1. Introduction
The problem of coal fine coming out of the wellbore exists at all stages of coalbed methane production, such as dewatering and pressure reduction, gas and water co-production, and gas production [
1]. Most of the coal fine entering the wellbore is sucked into the production tubing column, and a small proportion is deposited in the wellbore. As the amount of coal fine deposited in the well increases, it not only clogs the perforated section, affecting water and gas production, but can also bury or block the production tubing. Therefore, when the amount of coal fine deposited in the tubing column exceeds a certain amount, it is necessary to take measures to remove the coal fine from the well. The treatment process of coal fine deposited in the tubing column mainly includes water injection washing, oil pipe flushing to remove coal fine, and using a sand pump to recover the coal fine [
2,
3,
4,
5]. Those commonly used treatment processes use high-flow-rate fluids to carry the coal fine out of the well. By studying the settling and critical transport characteristics of coal fine, the critical flow rate of the fluid carrying the coal fine can be determined, which helps to determine the economic and reasonable equipment parameters.
For the critical transport law of particles in horizontal pipelines, a lot of related research has been done by previous researchers. Oroskar and Turian (1980) [
6] defined the critical velocity as the minimum velocity that separates the flow between the bed solids at the bottom of the pipeline and the flow in full suspension. A correlation equation for the critical velocity was established based on force balance and turbulence theory. Turian (1987) [
7] derived an empirical correlation equation for the critical velocity based on data from 864 experiments, with a diameter of 0.5 m and a sand grain size range of about 19 mm. Davies (1987) [
8] obtained the minimum mean flow velocity of suspended particles based on the theoretical equations of simple turbulence theory of the balance between settling forces and vortex wave dynamics. Salama (2000) [
9] proposed a theoretical equation capable of simultaneously predicting the critical velocity for single-phase and two-phase flow conditions. Stevenson (2002) [
10] derived the force balance of hemispherical particles in a viscous boundary layer on the wall of a horizontal pipeline and gave critical velocities for particle initiation under different conditions depending on the laminar or turbulent conditions of the fluid surrounding the particles. Danielson (2007) [
11] used the SINTEF data to obtain critical velocities for a body of sand based on the correlation equation for liquid–solid transport developed using SINTEF data, based on the assumption that the critical slip velocity between the sand and the liquid is relatively constant over a wide range of conditions. Since these particles are rigid spheres with uniform density, their form will not change during transportation. These properties are quite different from those of coal fine, making these formulas not applicable to predicting the critical velocity of coal fine.
Coal is a compound composed of many organic polymers and minerals. The ionic group carboxyl in coal molecules makes the surface of coal fine negatively charged. The non-homogeneous composition of the coal fine particles and the different particle sizes make the surface of the coal fine different in hydrophobicity and hydrophilicity (wettability), which is characterized in liquids by the fact that some of the coal fine particles float and some settle [
12]. It is these properties of coal fine particles that make the settling and critical transport properties of coal fine different from those of ordinary rock chips, sand particles, etc.
2. Characteristics of Coal Fine Particles
2.1. Compositional Analysis
Coal fine is the particle produced when coal rock is crushed, and the composition of coal fine is the same as that of coal briquettes. Coal rock consists of organic and inorganic minerals [
13]. Under microscopic observation, the organic fractions usually have mirror, inert, and stable groups, and the inorganic fractions usually have clay, carbonate, and sulfide fractions.
Figure 1 shows the volume percentage composition of microscopic components of coal and rock in several typical coal mines collected.
The figure shows that the composition of coal fine is more complex, with organic components dominating. At the same time, the nature of coal fine emissions from different mining areas is also different.
2.2. Density Characteristics
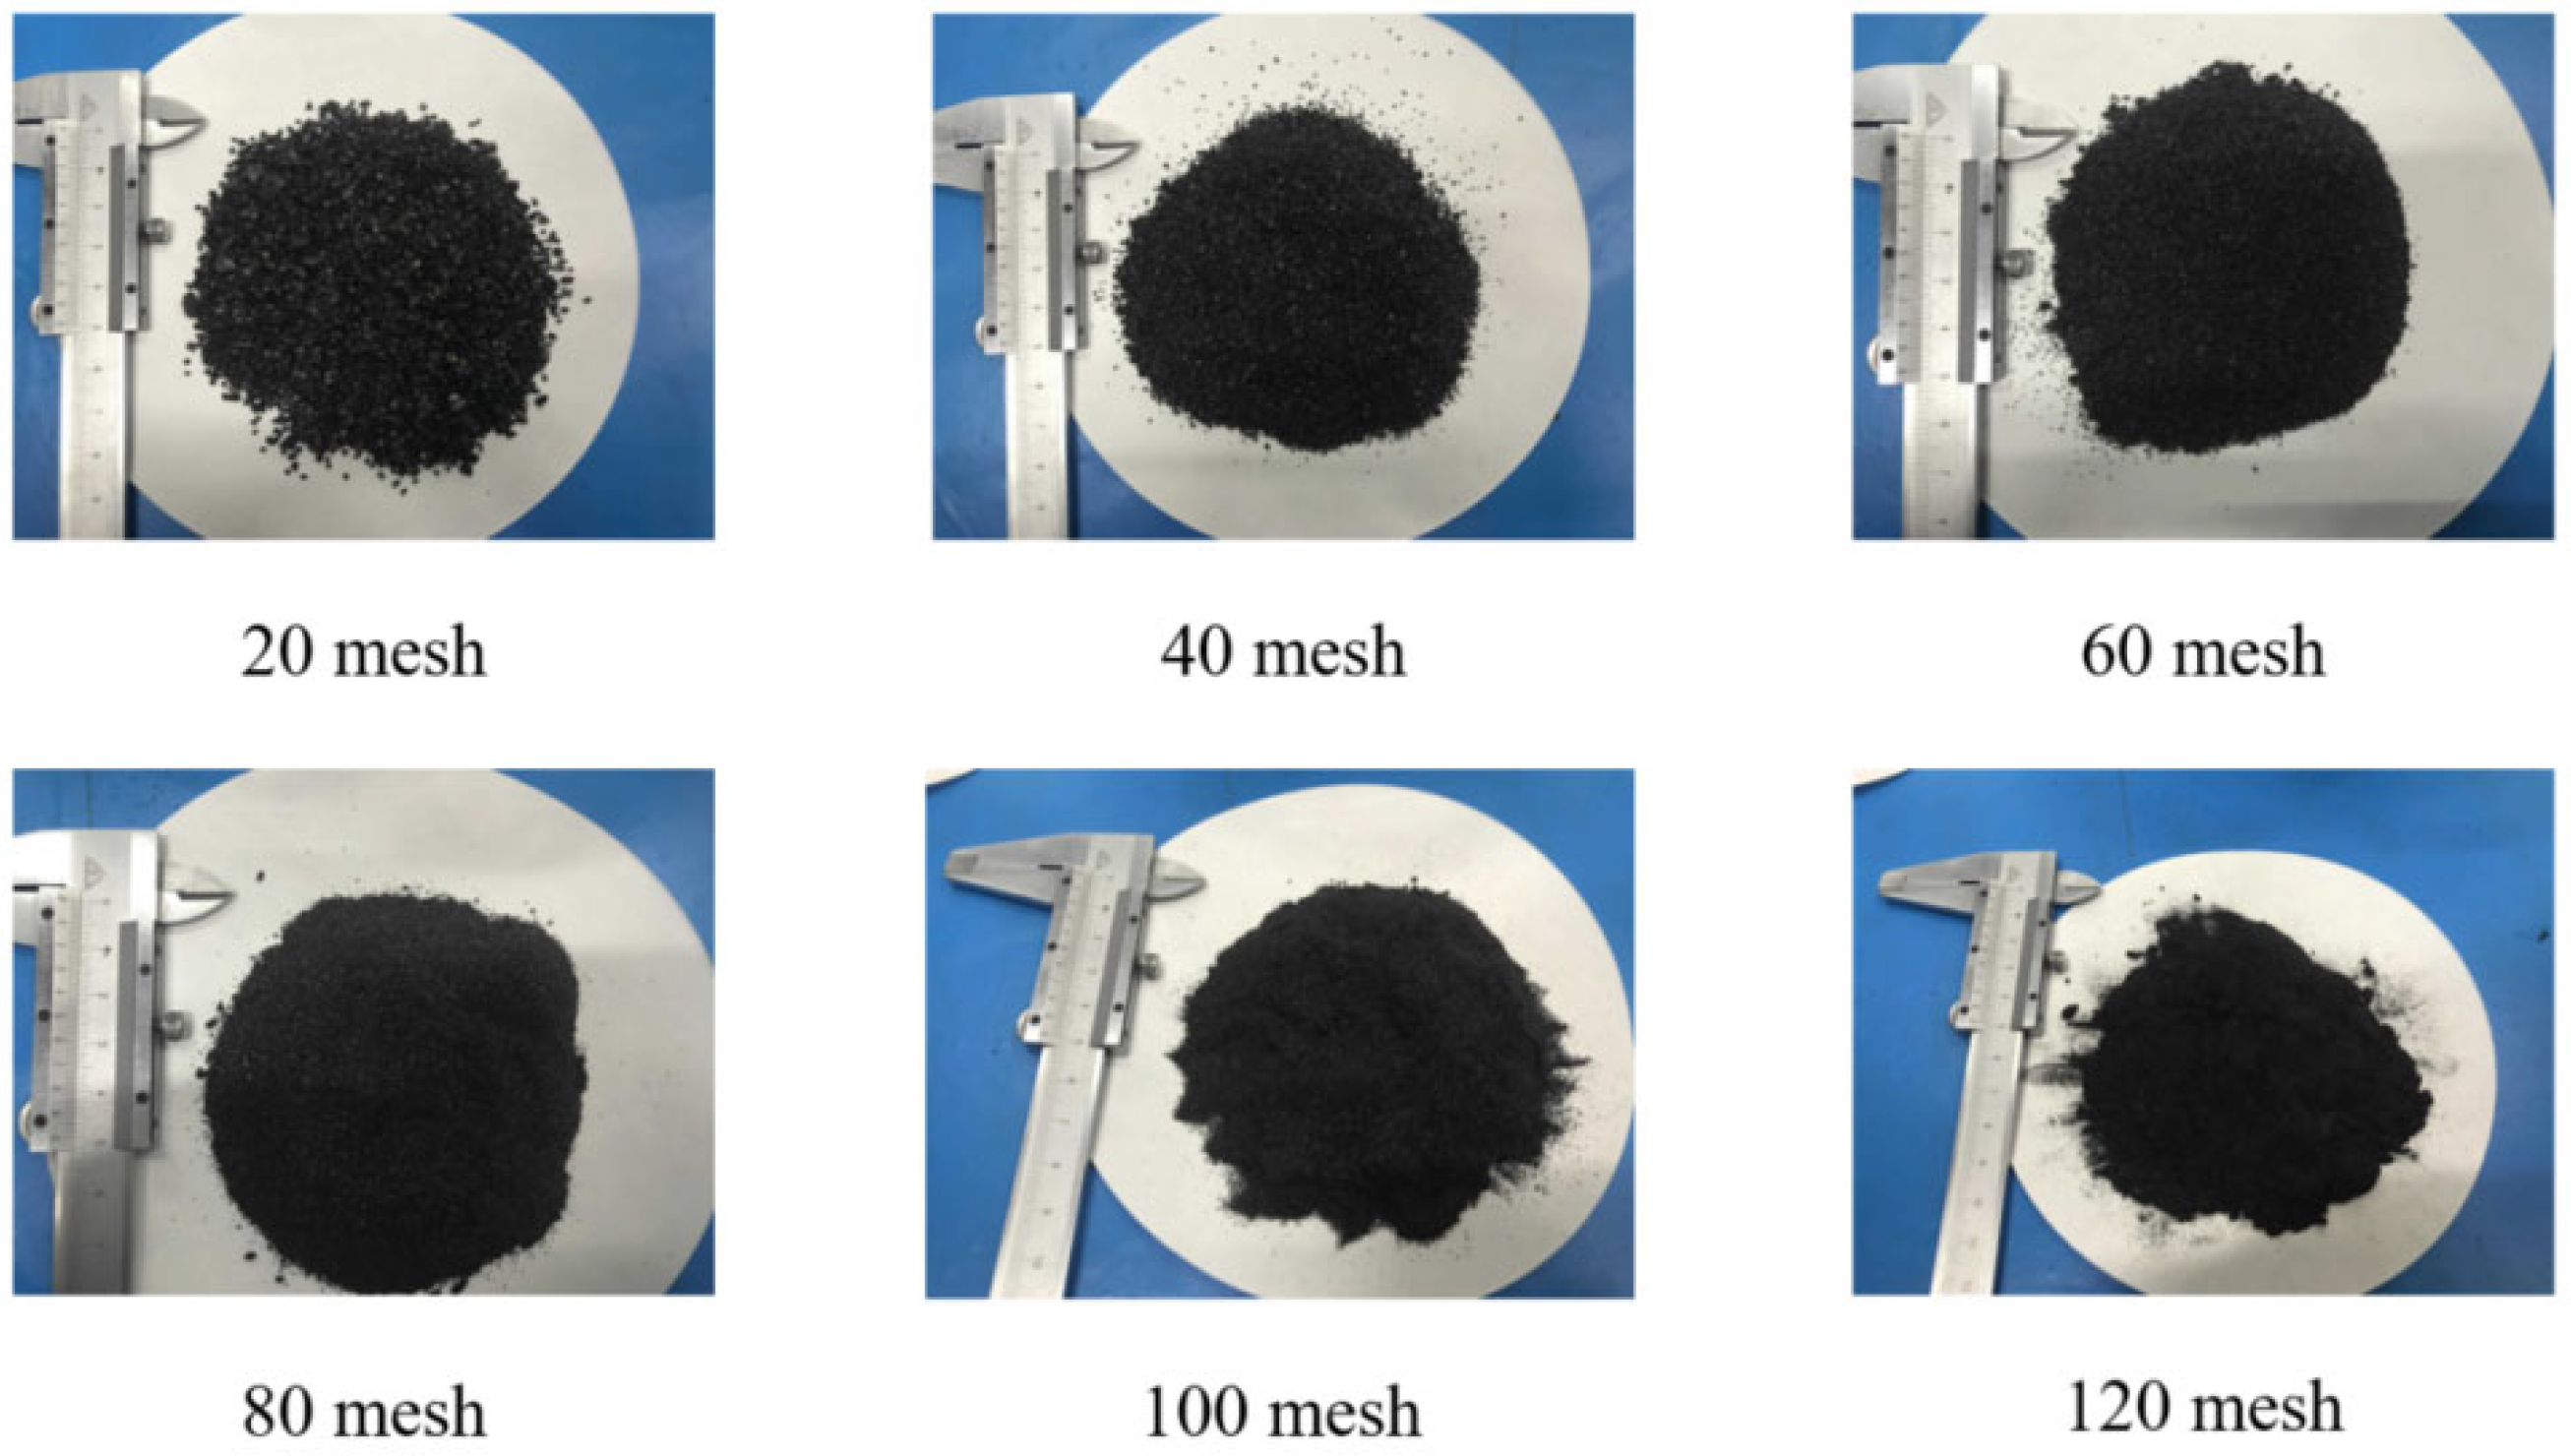
In conjunction with the actual production of CBM wells, the coal rock collected from the mine was crushed, and a standard screen was used to separate out different sizes of coal fine, classified according to the mesh size of the screen: 40 mesh, 60 mesh, 80 mesh, 100 mesh, 120 mesh, and greater than 120 mesh, as shown in
Figure 2.
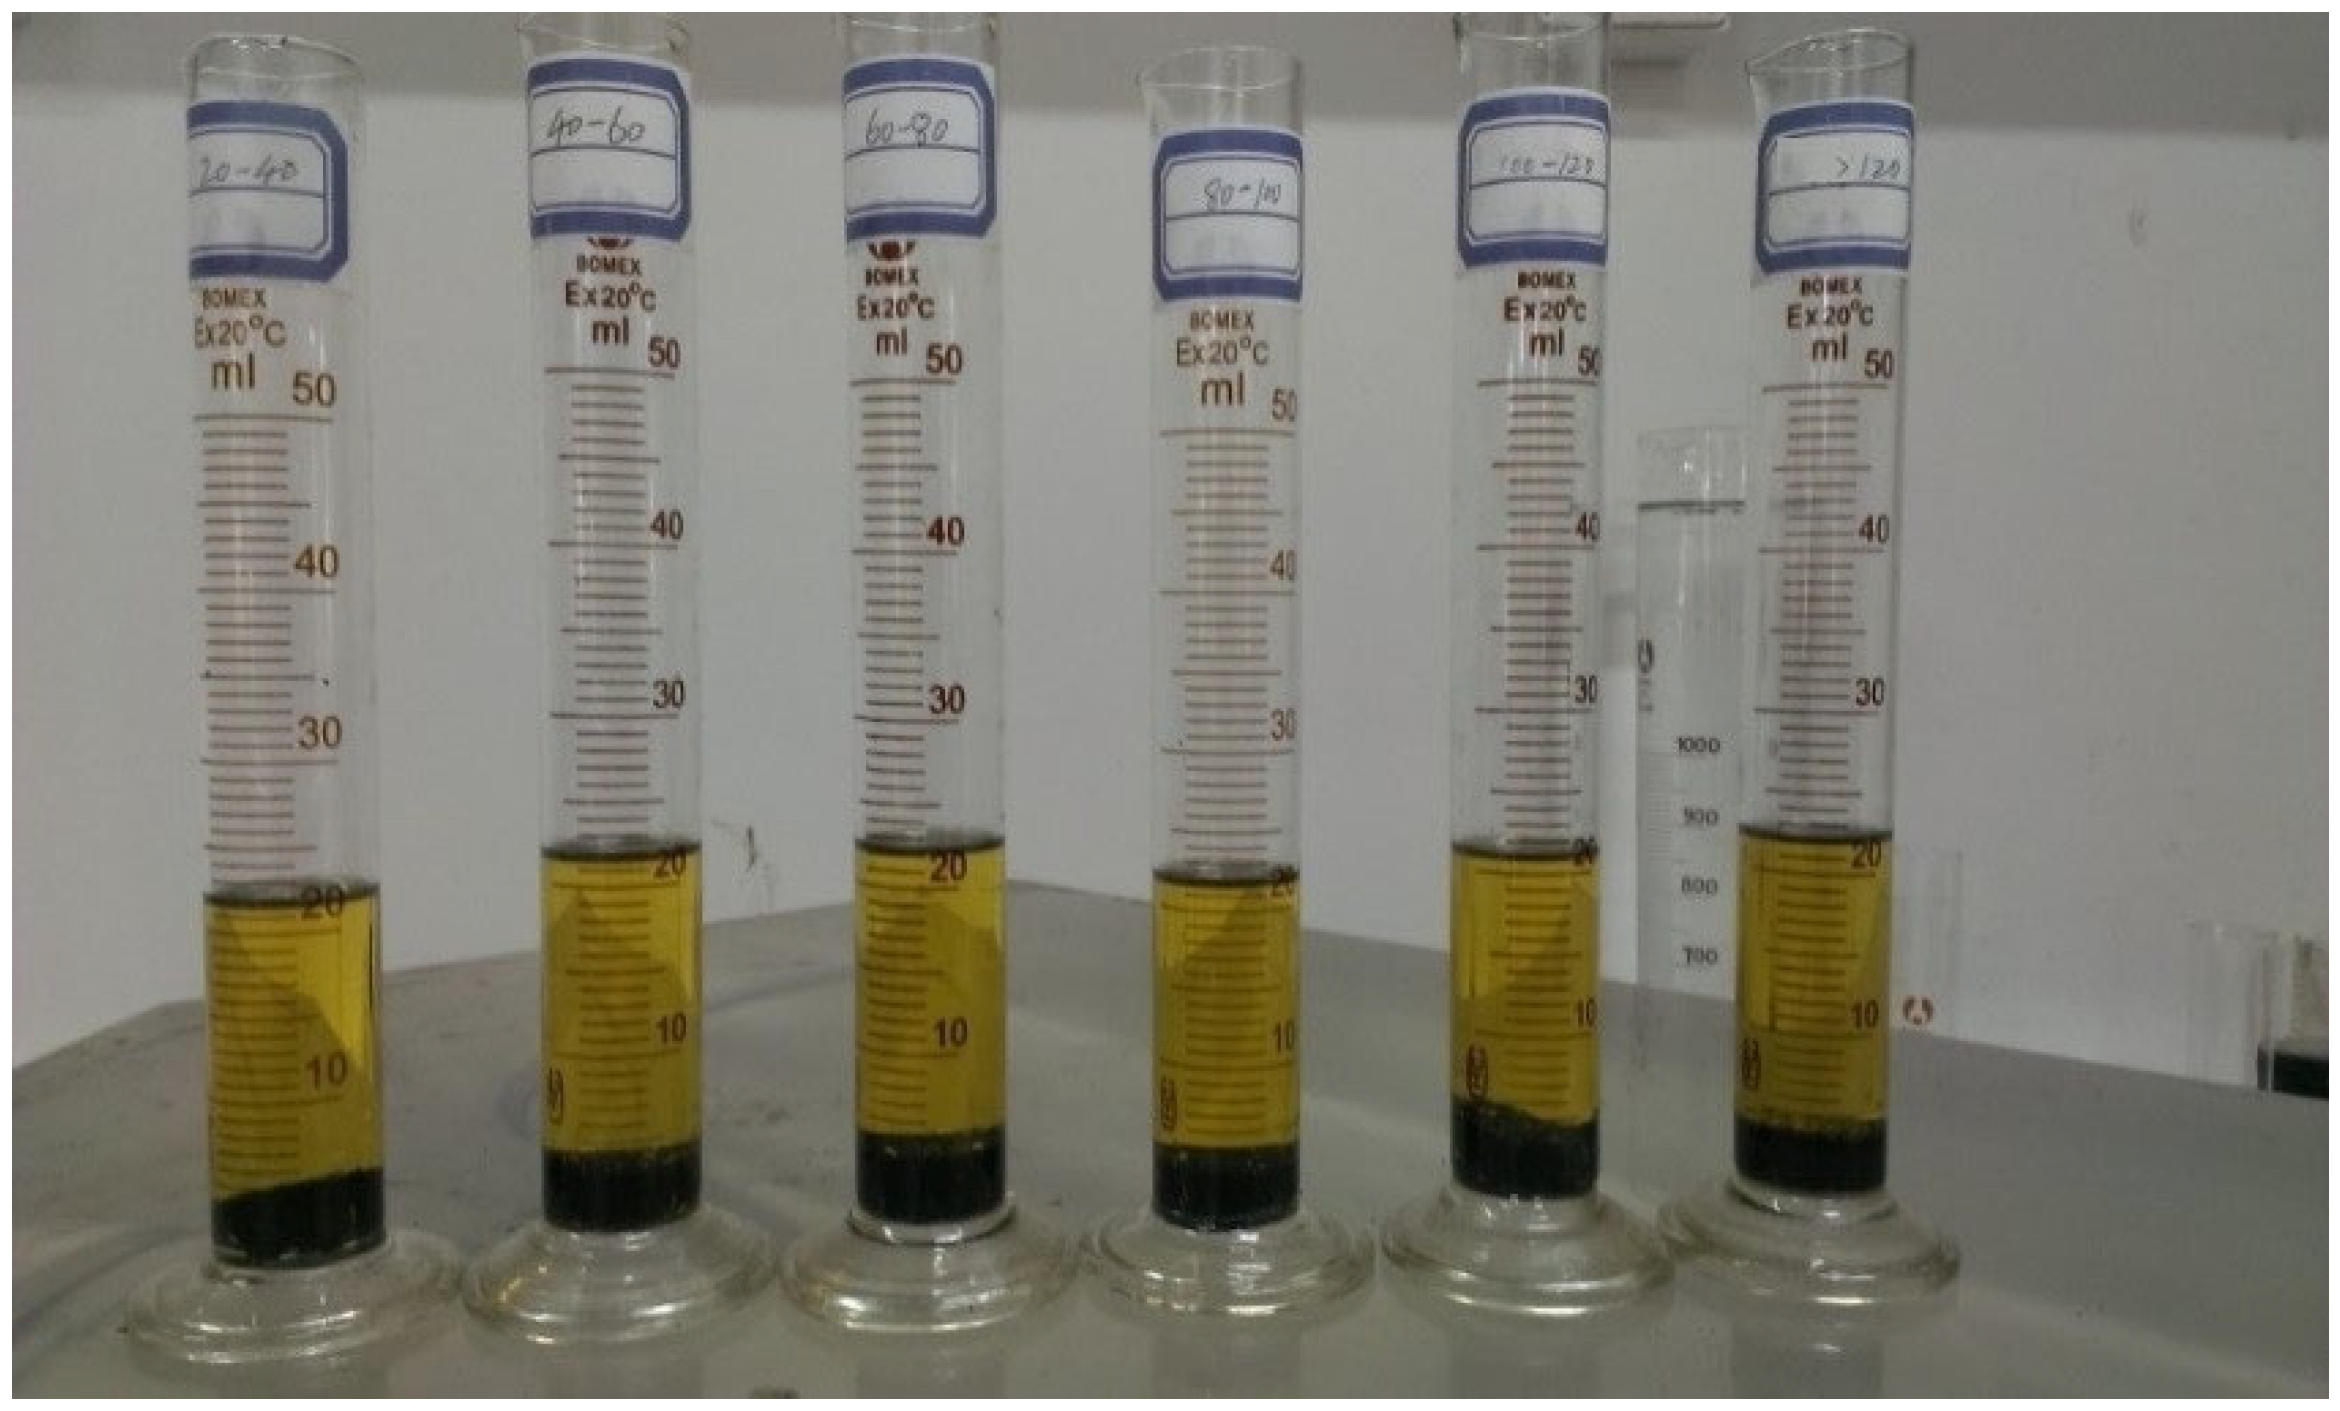
The true density of different sizes of coal fine was measured using the volumetric displacement method. First, the mass of dry coal fine was measured by electronic weighing, and then the coal fine was added into light oil for liquid discharge, as shown in
Figure 3. The figure shows the state of coal fine of different mesh sizes in light oil, and the volume of coal fine of known mass can be obtained by finding the volume difference of light oil before and after the coal fine is added into the measuring cylinder, and then the true density of coal fine of different mesh size ranges can be obtained.
The measured data were processed to obtain the densities of different sizes of coal fine, as shown in
Table 1. The densities of ordinary sand grains measured under the same experimental conditions are also given in the table. From the table, it can be seen that the density of coal fine ranged from 1.312~1.109 g/cm
3 and became smaller as the mesh size of the coal fine increased—the coal fine became finer and finer. Previous studies have indicated that the smaller the particle size of coal fine, the more complex the surface shape and the larger the specific surface area [
14]. The more gases are adsorbed in this way, the lower the density of the particles. The density of ordinary sand particles is greater than that of coal fine and does not vary much with particle size.
2.3. Coal Fine Morphology
The average particle sizes of the selected coal fine ranged from 0.1 mm to 0.9 mm. Observation with a magnifying glass showed that the coal fine particles mainly had the following morphologies: (1) Prismatic, where the particles were relatively regular in shape and the corners of the particles were relatively clear. (2) Plate-like, where particles in one dimension were much smaller than the other two dimensions, and the overall morphology was irregular. (3) Cone-shaped, where there was a clear tip of the particles, and the overall shape was irregular. It was also found that among several different sizes of coal fine, the smaller the particle size, the smaller the difference in shape between the particles, and the better the sorting.
3. Static Settlement Experiment
Under hydrostatic conditions, particles were subjected to the force of the liquid phase related to their speed of movement during natural settling. The settling velocity first increased, and after a certain velocity was reached, gravity, buoyancy, and liquid-phase drag forces reached equilibrium in the vertical direction, and the velocity of the particles did not change anymore. This velocity is also known as the end-of-sedimentation velocity of the particles [
15]. The end-of-sedimentation velocity is an important index to study the motion of solid phase in a fluid (gas or liquid), and the relative velocities of the solid particle phase and the aqueous phase are related to the end-of-sedimentation velocity under flowing conditions. We designed simple static settling experiments to measure the end-of-sedimentation velocities of coal fine particles of different sizes in water and to compare the results with those of sand particles.
3.1. Experimental Setup and Procedure
In view of the differences between individual coal particles, the coal particles involved in the experiment were put into water before the settling experiment, and the coal particles will separate, with part of the coal particles settling to the bottom of the pipe and part of the particles floating upward to be captured by the gas–water interface. The surface of the floating particles was not separated from the gas and could not be used for settling velocity measurements, so we only used the coal particles that settled to the bottom of the measuring cylinder for the settling experiments.
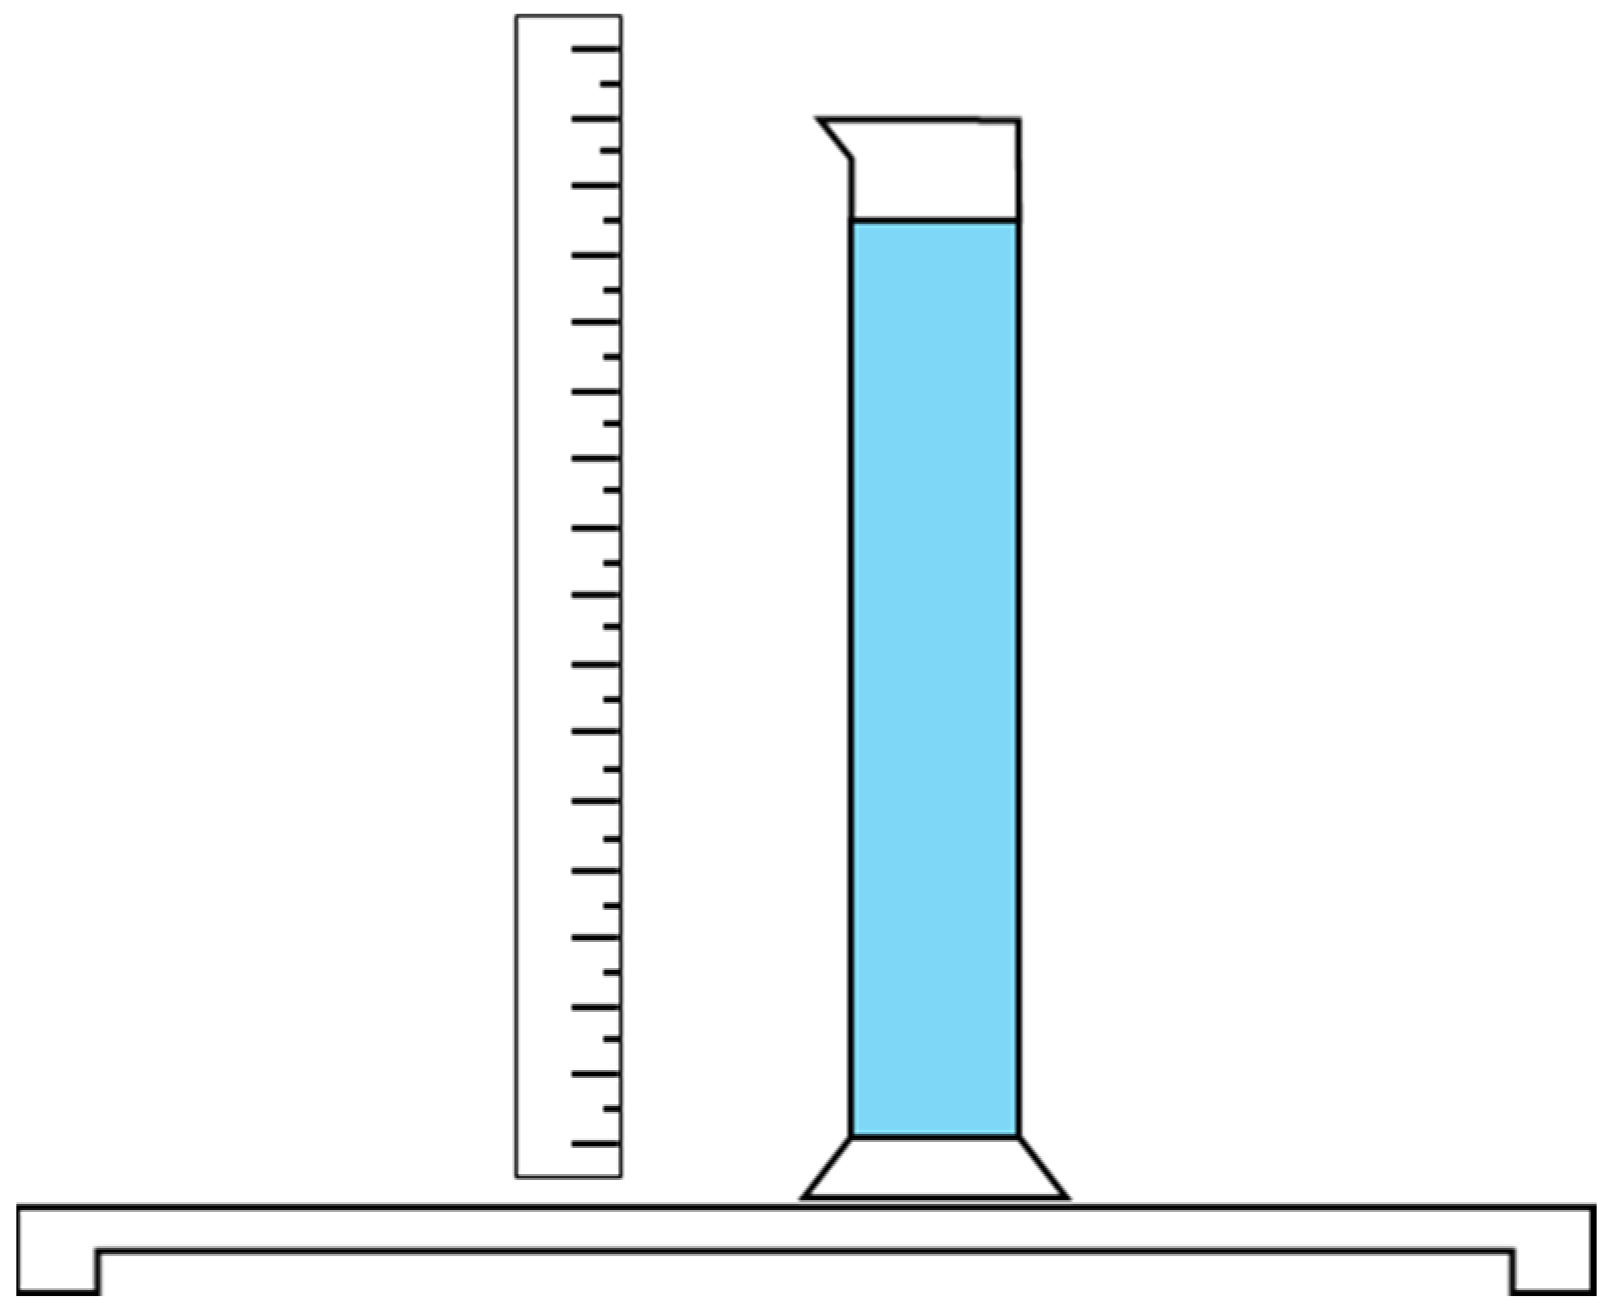
The experimental setup consisted of a measuring cylinder used to settle the particles and a measuring scale, as shown in
Figure 4. A stopwatch was used to time the settling of the particles.
The main steps of the whole sedimentation experiment were as follows:
- (1)
Collect the coal fine that settles to the bottom of the measuring cylinder after sorting, and fill the measuring cylinder used to measure the final sedimentation velocity with water.
- (2)
Select a mesh of coal fine, slowly place it in the water phase inside the measuring cylinder to ensure that it is not disturbed by the gas–liquid interface, and then observe the position at which the coal fine settles. Each time it passes a certain position, it is recorded at one meter per second to record the time taken for the current settling.
- (3)
According to step (2), a curve of the settling distance, s, and its corresponding settling time, t, can be obtained, and the slope of the linear segment of the curve can be taken to find the final velocity of particle settling.
- (4)
Repeat steps (2) and (3) with the same mesh size particles and carry out several experiments to take the average value of the final settling velocity.
- (5)
Replace the coal fine with other sizes and continue the above experiments. Replace the coal fine with sand particles and measure the settling velocities of sand particles of different sizes.
3.2. Results of the Experiment
The results of the settling velocity for different mesh sizes of coal fine are shown in
Table 2. For comparison, we also carried out experiments on the settling of sand particles, the results of which are also given in
Table 2.
A solid particle settles in still water at a final velocity
, experiencing a drag force from the liquid phase given by:
In this equation,
represents the drag coefficient of the particle, which is dimensionless and depends on the particle’s Reynolds number but is independent of particle density. When these two forces are balanced,
represents the particle’s terminal settling velocity:
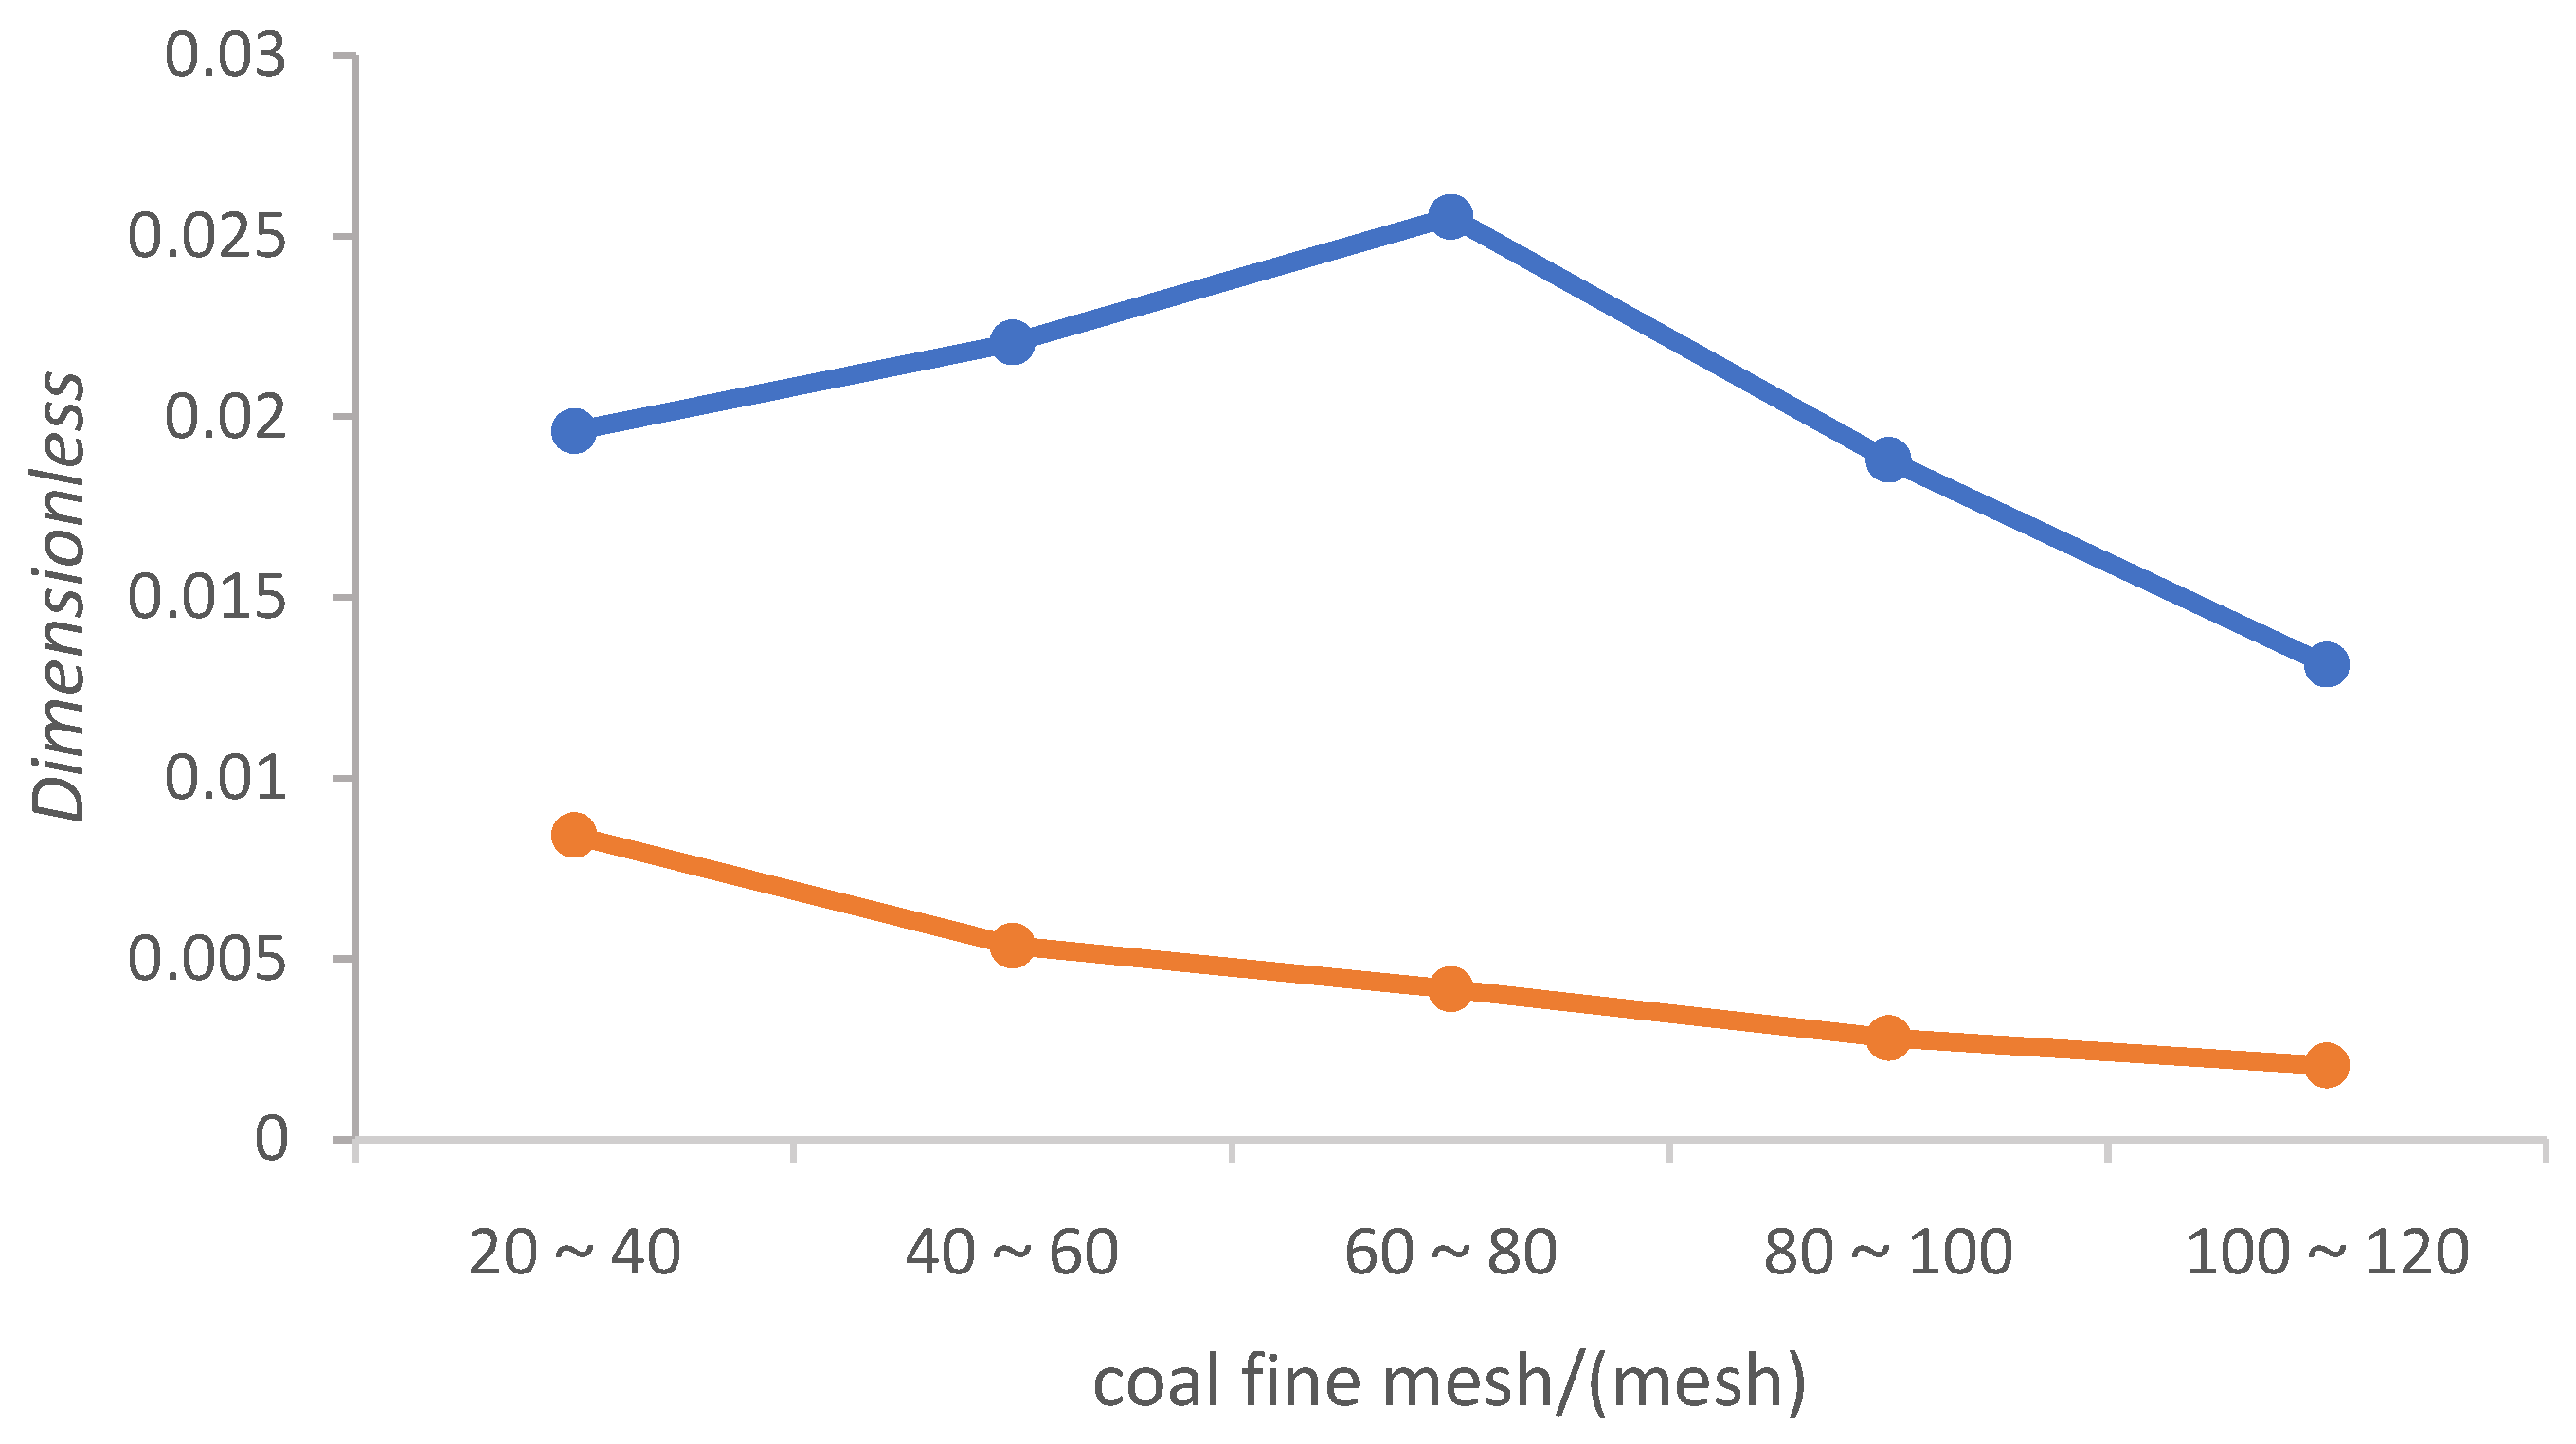
Based on Equation (3), a dimensionless variable can be defined as follows:
It is also known that
is a function of the drag coefficient
and is independent of particle density. The terminal settling velocity obtained from coal fine and sand particle settling experiments was used to calculate the value of
, as shown in
Figure 5. The dimensionless variable
for coal particles initially increased and then decreased with increasing mesh size, whereas for sand particles
decreased with increasing mesh size. This indicates that in addition to density, other properties, such as surface structure, wettability, and surface charge, also influenced particle motion in the fluid.
4. Critical Transport Velocity Experiment
The higher the flow velocity in the borehole, the greater the carrying capacity of the coal fine, and if the flow velocity is not sufficient to carry the solid phase particles upwards, the particles will settle to the bottom of the tube, where friction with the wall causes the particles to become stationary. The critical coal fine start-up velocity is defined as the minimum liquid-phase flow velocity required for the stationary coal fine to start moving forward and continue until it is discharged from the experimental section of the tube [
16].
4.1. Experimental Setup and Procedure
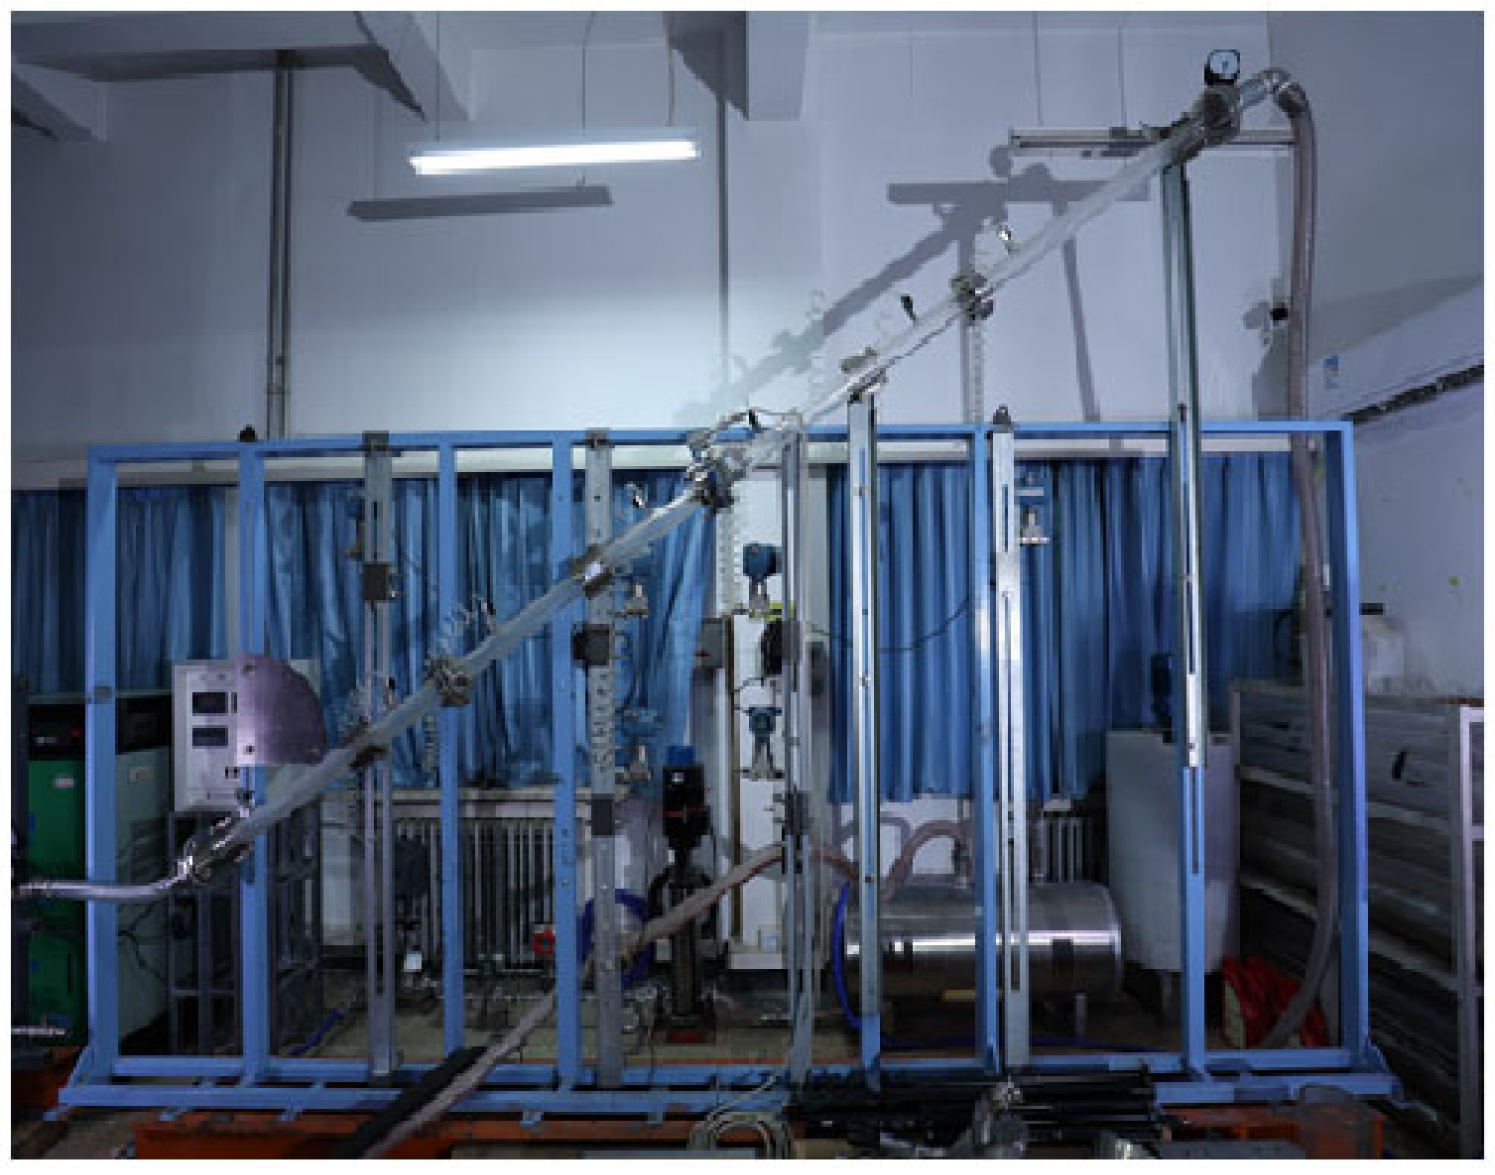
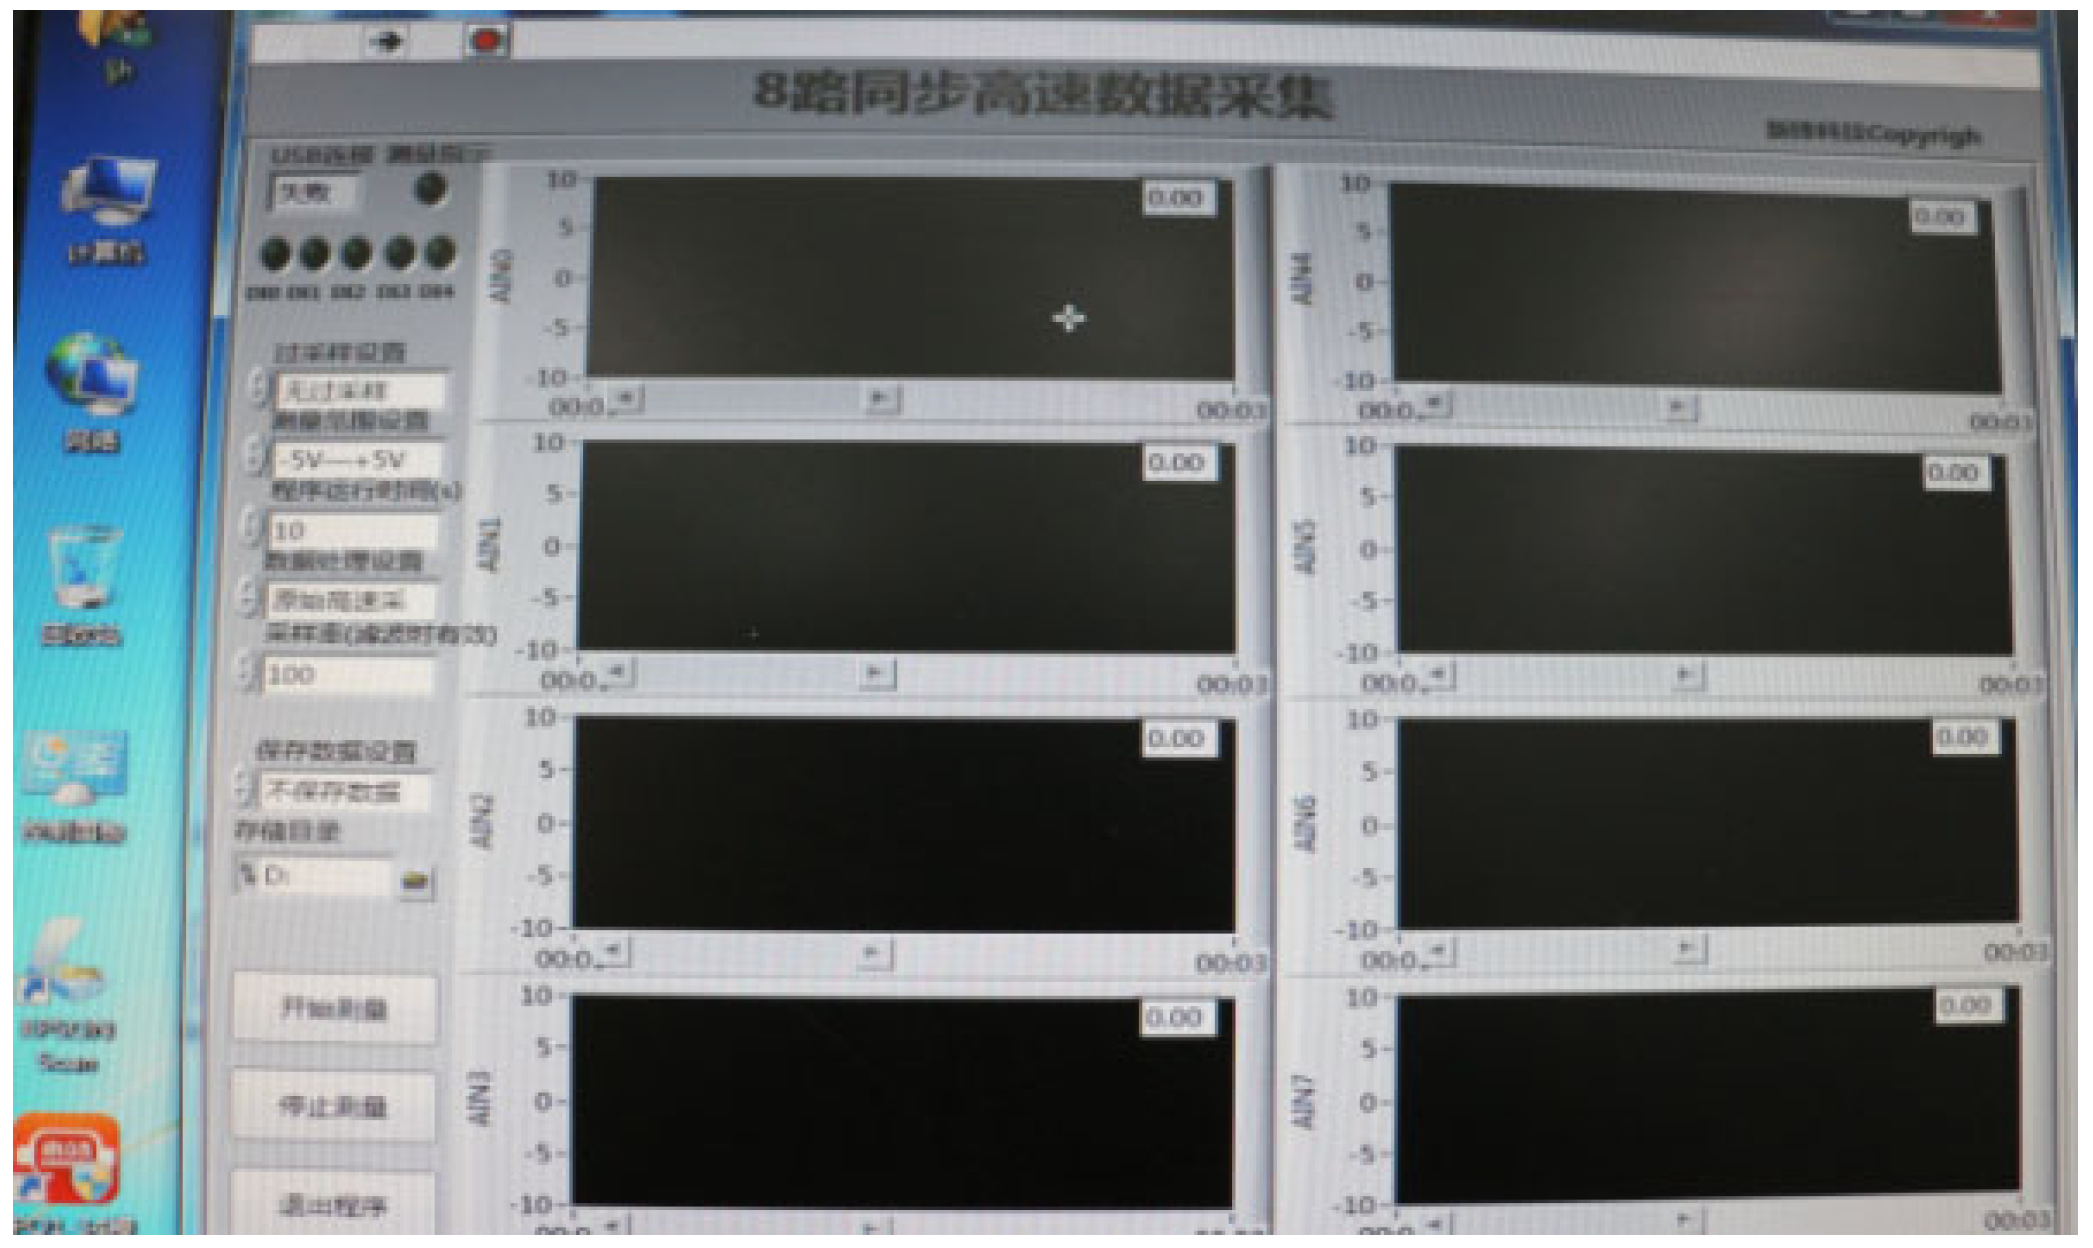
The liquid–solid two-phase flow experimental setup was mainly composed of a fluid supply and metering system, well simulation system, data acquisition and processing system, and other parts. Clean water was pumped from the tank into the simulated borehole by a centrifugal pump and finally returned to the tank to form a loop, where the centrifugal pump and tank, the simulated borehole, and the data acquisition system are shown in
Figure 6,
Figure 7 and
Figure 8, respectively.
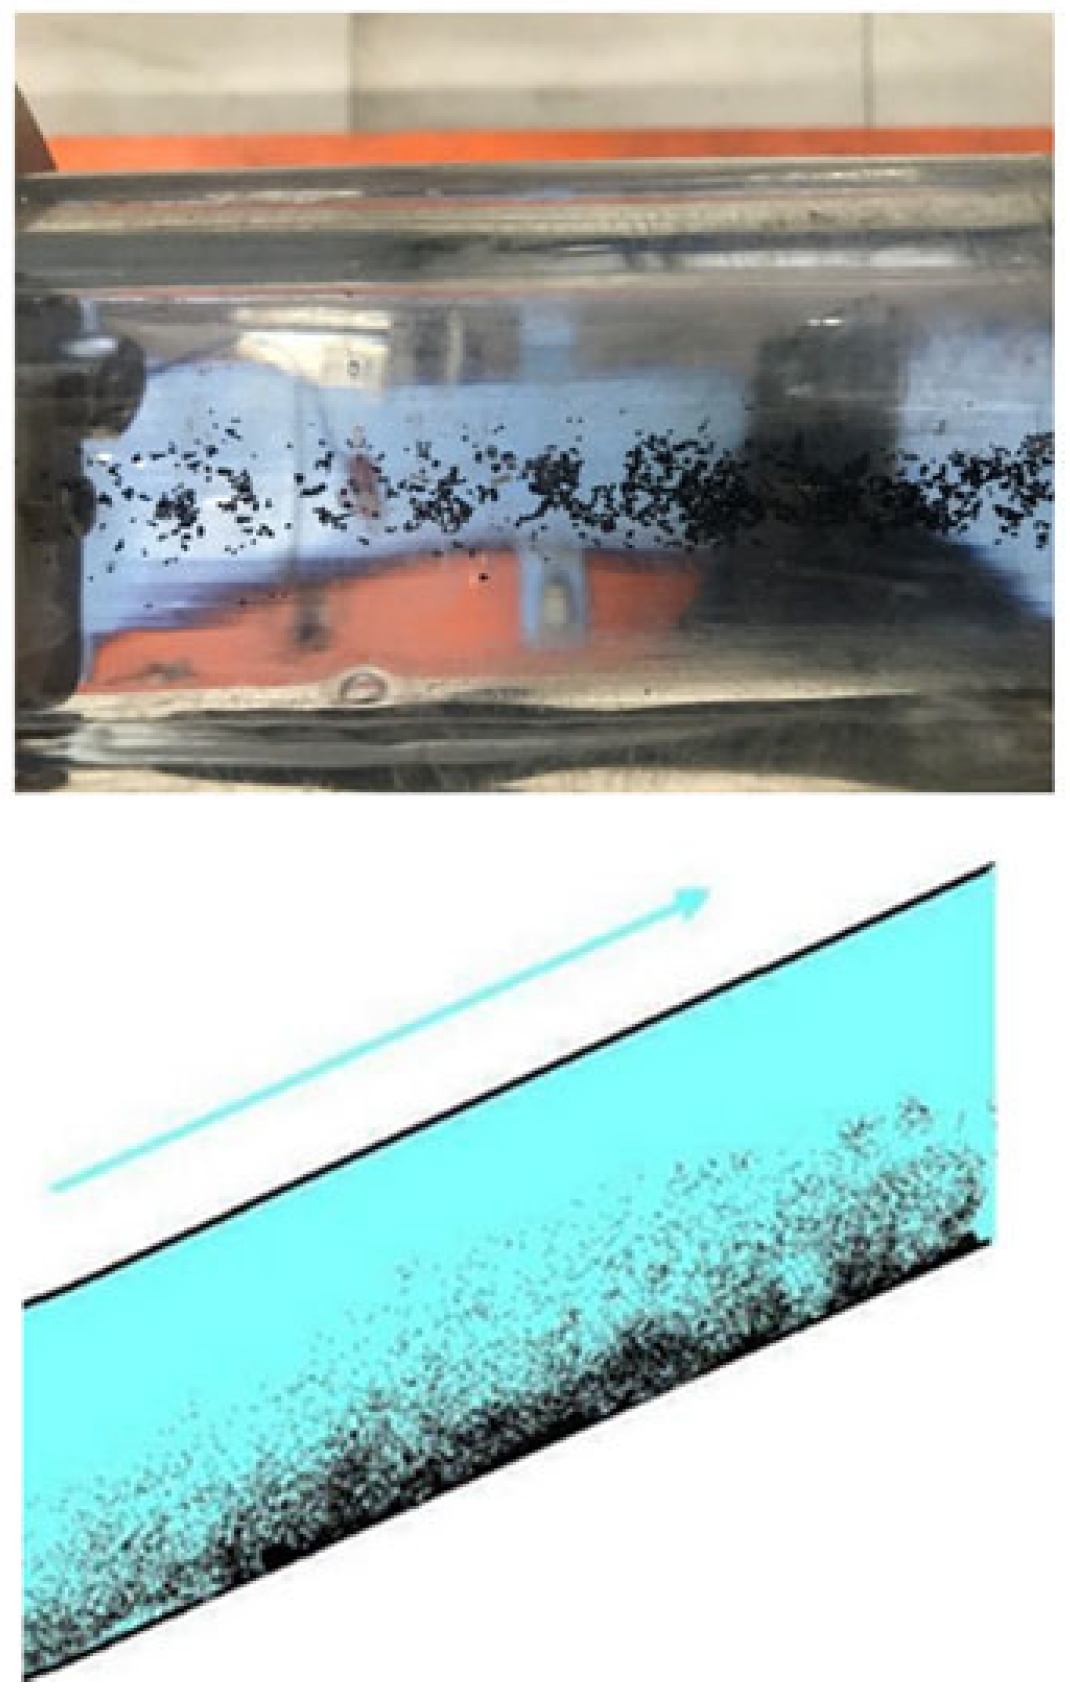
A certain amount of coal fine was pre-positioned in a simulated borehole with an internal diameter of 0.05 m and made of PMMA pipe. Then, the displacement of the regulated centrifugal pump was slowly increased to observe the movement process of the coal fine in the single liquid phase. The critical start-up velocity of the coal fine under different inclination conditions was measured, as shown in
Figure 9. The angle of the borehole varied from 0~35°, and the particle sizes of the coal fine and sand particles ranged from 0.1 mm~1.0 mm.
4.2. Experimental Results
During the experiment, as the flow rate increases, the coal fine will go through a series of processes, from standing, rolling, jumping, translating, and floating. Take the experiment with the inclination angle of 5°, the mesh size of the coal fine of 20 meshes, and the concentration of the coal fine of 0.001 v/v as an example. When the controlled liquid-phase flow rate was less than 7.0 L/min, coal fine could be observed to accumulate at the bottom of the well. As the flow rate increased above 7 L/min, the coal fine began to jump, but the movement of the coal fine was intermittent and could not be continuously transported downstream. When the liquid-phase flow rate reached 8.5 L/min, the coal fine at the bottom of the tube was lifted by the liquid flow, and the particles were transported forward in the form of rolling, jumping, and panning. When the liquid-phase flow rate reached 14.5 m3/min, most of the coal particles were transported forward in suspension in the liquid phase. The critical start-up speed was calculated to be 0.119 m/s.
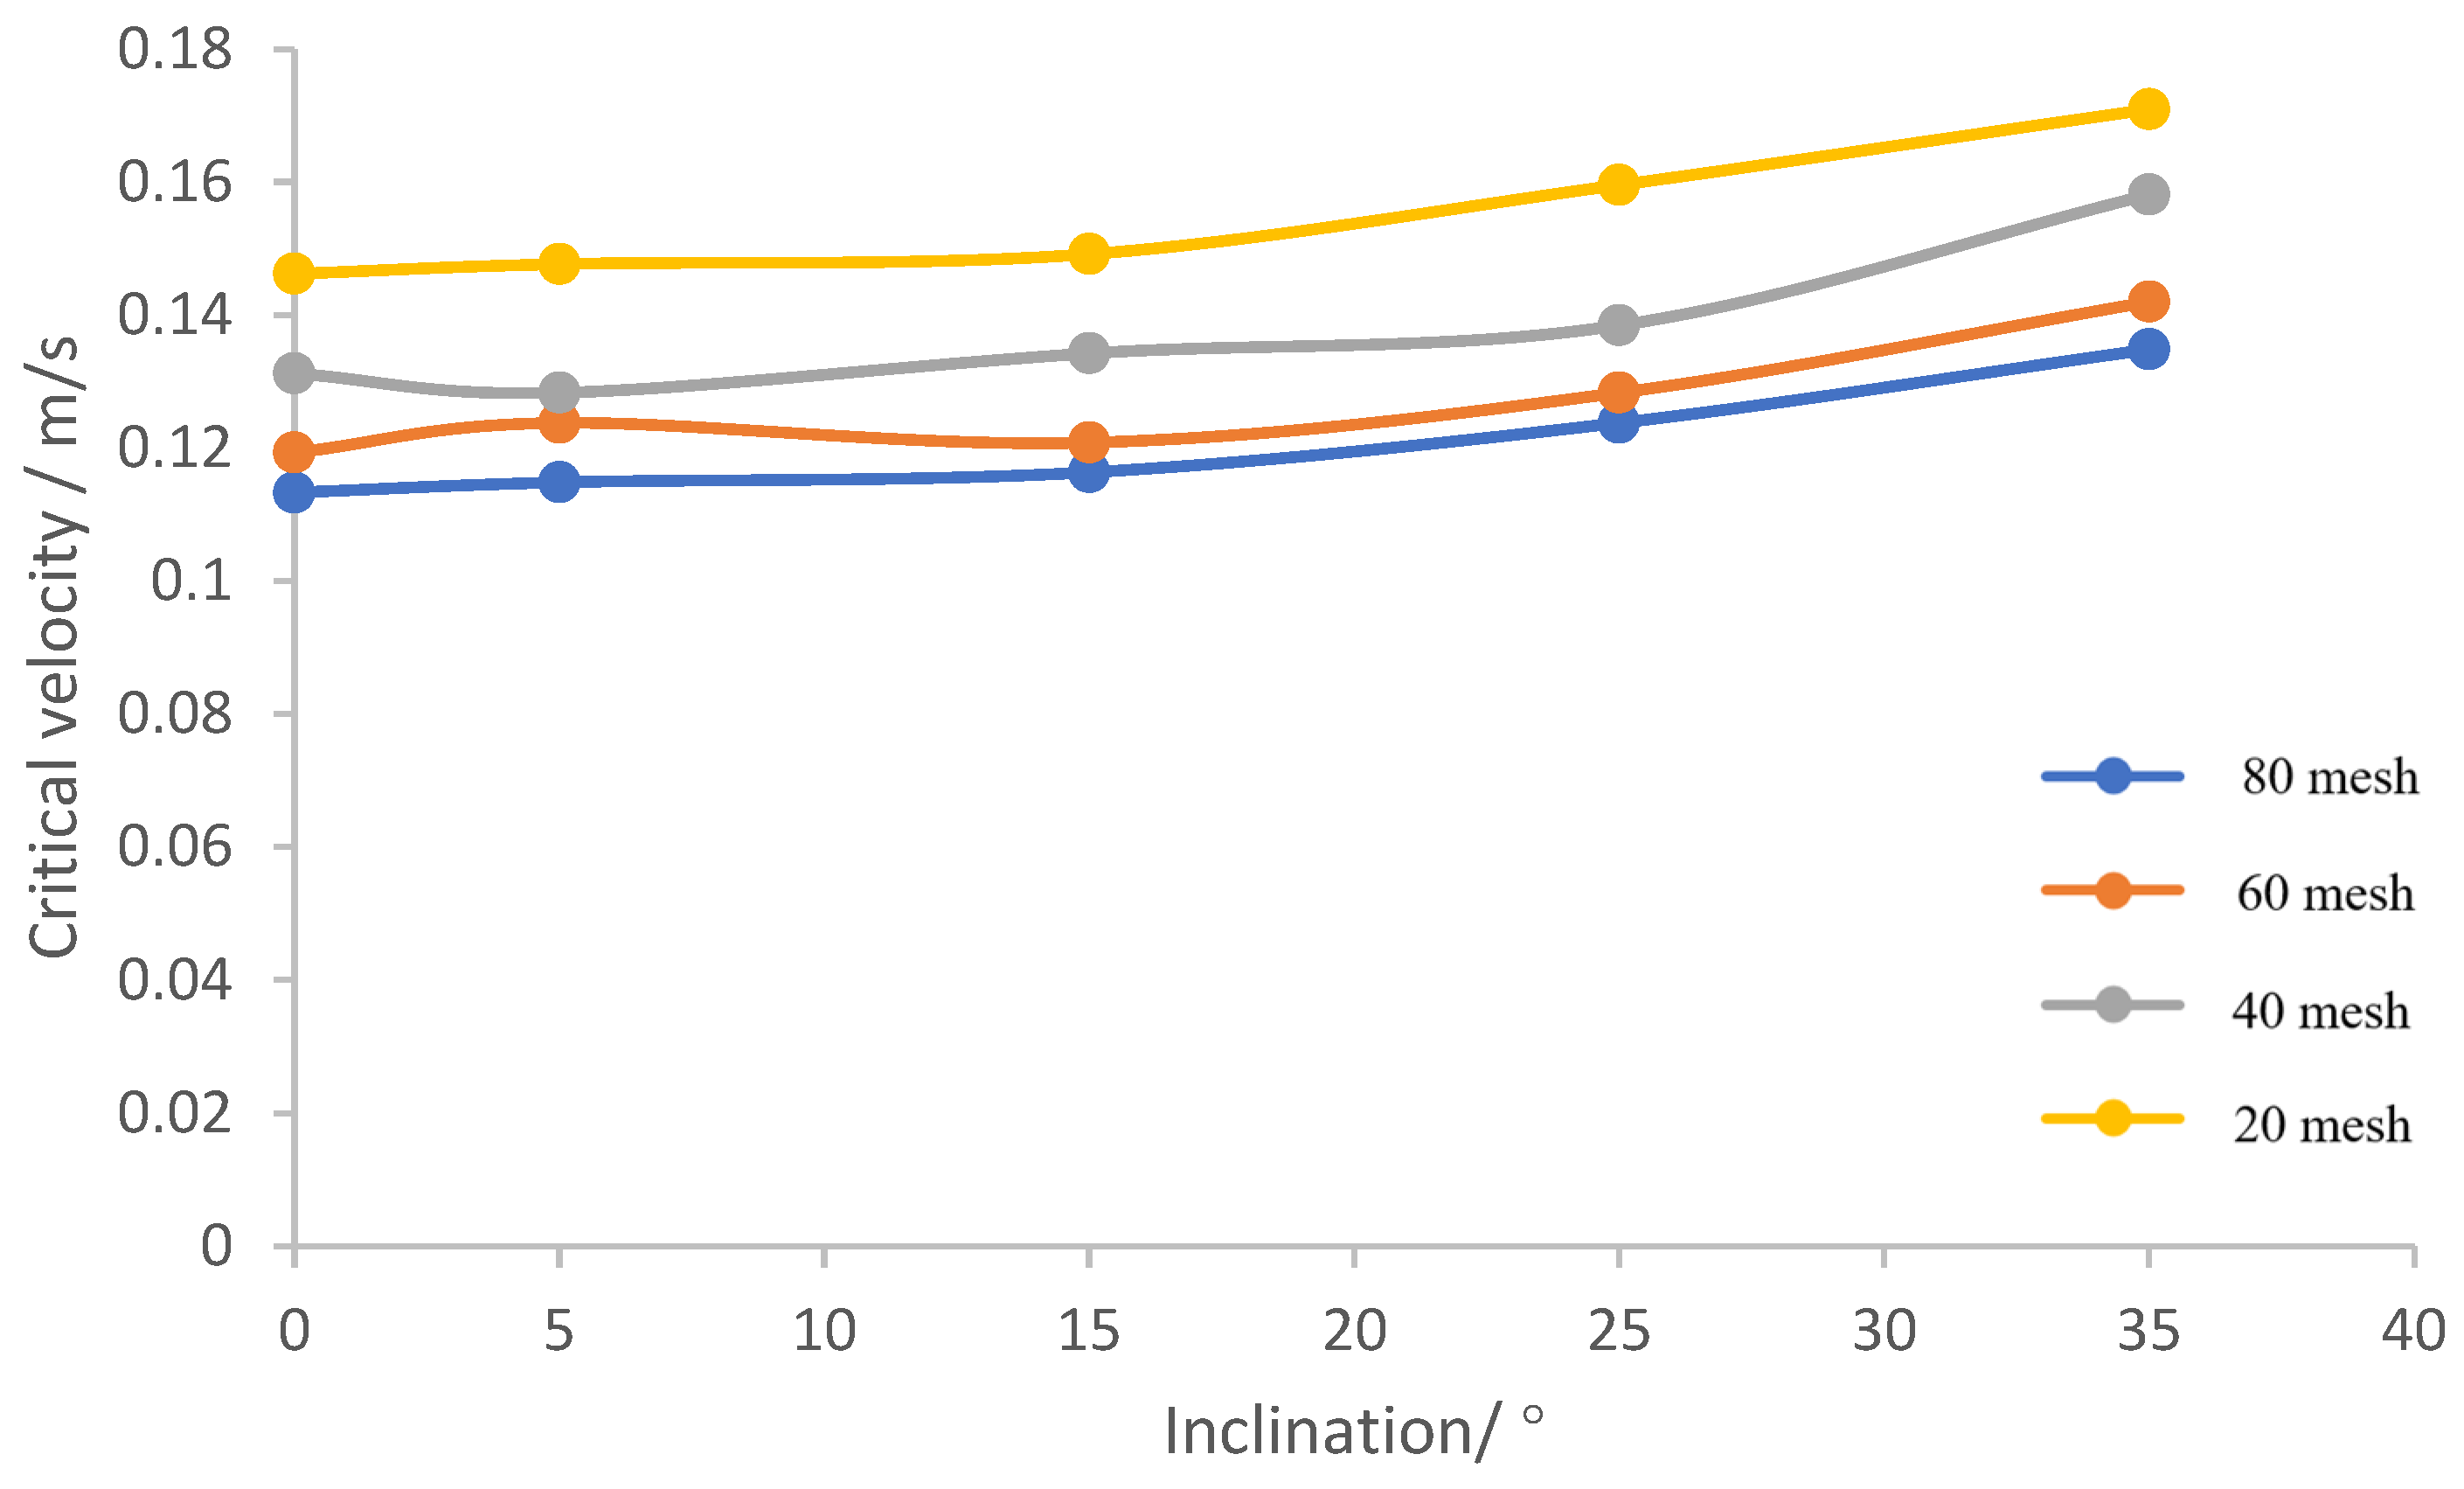
The liquid–solid two-phase flow experiment was repeated using coal fine particles with other mesh sizes (40 mesh, 60 mesh, and 80 mesh). The inclination angle of the wellbore was varied, and experiments were conducted at different tilt angles (15°, 25°, and 35°) as well as under horizontal conditions. The experimental results are shown in
Figure 10 and
Figure 11.
Figure 10 shows the critical start-up velocity of coal fine with different particle sizes at different drilling angles. From the figure, it can be seen that as the particle size of the coal fine particles increased, the critical start-up velocity of the coal fine particles increased, but the increase was limited. The larger the particle size, the more likely it was to settle to the bottom of the pipe by gravity, and the greater the friction with the pipe wall, so the more difficult it was for the particles to start moving. On the other hand, the larger the diameter of the particles, the larger the area of the particles in the liquid phase that was subject to the action of the liquid phase, which in turn increased the ability of the particles to move. As the angle of inclination of the tube increased, the critical starting velocity of coal particles of all sizes tended to be upwardly inclined. This is because as the angle of inclination increased, the gravitational force on the particles in the direction of flow increased, requiring a greater relative solid–liquid velocity to obtain a greater liquid-phase drag force to compensate for this force.
Figure 11 shows the start-up velocity of coal particles of different sizes for different coal fine injection concentrations. It can be seen from the figure that for different sizes of pulverized coal particles, the critical start-up velocity of pulverized coal particles increased as the pulverized coal concentration increased. As the coal fine concentration increased the chance of collisions between particles and between particles and the wall, the friction increased the difficulty of particle start-up.
5. Coal Fine Critical Start-Up Velocity Calculation Model
Due to the existence of different complexities of surface structures and wettabilities of coal particles with different particle sizes, the density of coal particles exhibits different characteristics from other particles, as well as the carrying capacity of fluids for coal particles will be different from other particles [
17,
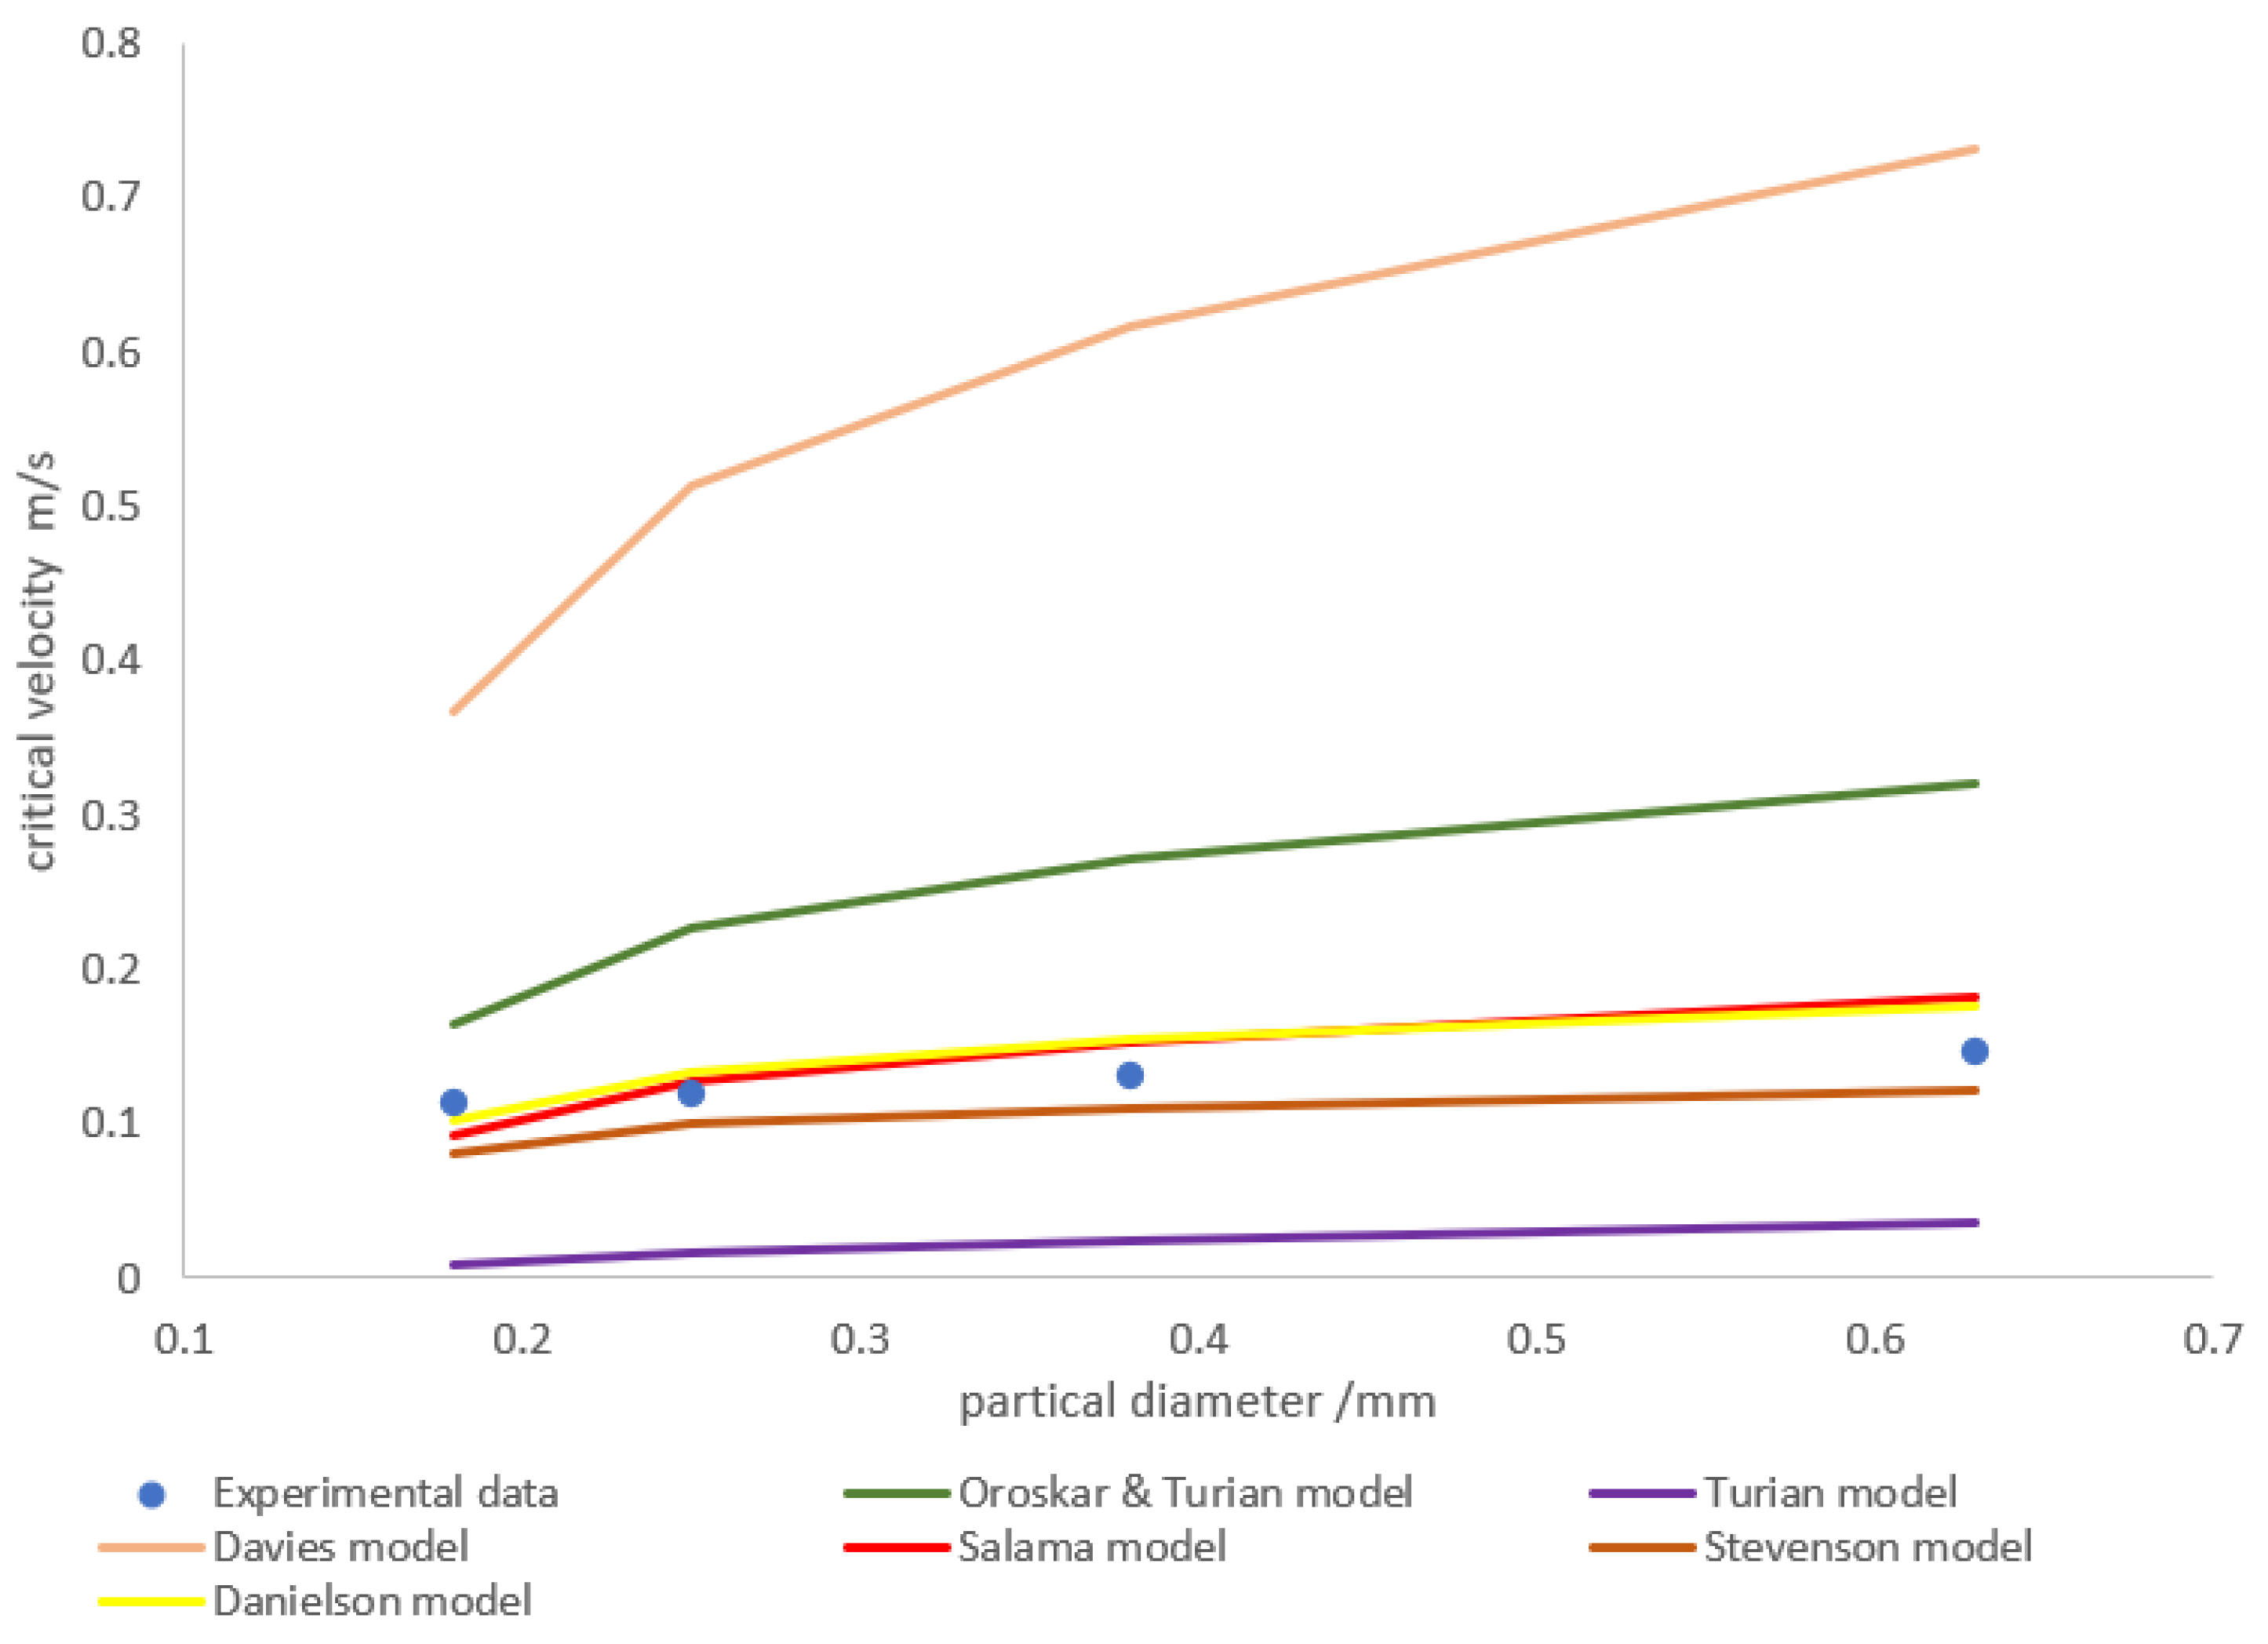
18]. The six correlation equations derived from solid-phase particles, such as sand and glass beads, as mentioned earlier, are shown in
Table 3.
Figure 12 shows the experimental data (scattered dots) and the results of different model calculations (solid lines) for the critical velocity at a particle concentration of 0.001
v/
v. The Salama and Danielson models were similar to the experimental results, while the other models had larger errors and were not suitable for calculating the critical velocity of coal particles, but these two models did not consider the role of pipe inclination.
Table 4 presents the maximum relative error, minimum relative error, and average error of the calculation results from the six models under different concentration conditions, particle sizes, and pipe inclination angles. It can be seen that the Salama model had a relatively small overall error, within 20%, but the maximum error was 24.11%. Therefore, based on the Salama model, a new model can be proposed to represent the ability of coal fine to be carried by the fluid under different pipe inclination conditions.
To further improve the accuracy of the model calculations, the experimental data were analyzed in dimensionless terms and then regressed to obtain an empirical model of the critical speed. The dimensionless variables are defined as:
Based on the Salama model and considering the effect of pipe inclination, the calculation model for the critical velocity of coal particles inside the pipe is given as follows:
where
,
,
,
, and
are the regression parameters, and the final regression results are as follows:
Figure 13 presents a comparison between the dimensionless critical velocity
calculated using Equation (8) and the
values derived from experimental data. From the figure, it can be observed that the average relative error was 7.07%, with a maximum error of 17.84%. Out of 113 data points, only 11 had errors greater than 15%, and 3 data points had errors exceeding 20%. This indicates that the newly proposed empirical formula provides highly accurate results and can be used to calculate the critical start-up velocity of coal fine under different angles.
6. Conclusions
In this study, through experiments and theoretical modeling, a critical start-up speed prediction model considering the morphology, concentration of pulverized coal, and the inclination angle of the pipe wall was established. The main conclusions are as follows.
Coal fine is primarily composed of organic matter, and as the mesh size of the coal fine increased, meaning the coal fine became finer, its density decreased. The larger the mesh size of the coal fine, the smaller the static settling velocity of the coal fine particles.
Coal fine particles have characteristics different from other particles, such as sand and glass beads, and the ability of the fluid to carry coal fine also differs from that of other particles. The existing critical velocity models, derived from the flow of sand, glass beads, and other particles in horizontal pipes, are not applicable to the flow of coal fine in pipes at different angles.
Based on the results of the critical transport velocity experiment, a new empirical formula was proposed to calculate the critical velocity of coal fine particles, taking into account the effects of pipe inclination and concentration, based on the Salama model. Compared with the existing models, it had better adaptability to coal fine.
The model did not consider the dynamic evolution of particle size caused by coal fine breakage, and the experiment only covered the particle size range of 0.2–0.6 mm. The applicability to ultrafine coal fine needs to be verified. Meanwhile, it is necessary to further study the influence of agglomeration between coal fine molecules on the migration law of coal fine.
Author Contributions
Conceptualization, G.H. and S.L.; methodology, X.X. and J.L.; validation, X.M. and J.D.; formal analysis, X.X. and J.L.; investigation, M.C. and X.M.; resources, G.H. and S.L.; data curation, M.C. and J.L.; writing—original draft, X.X. and S.L.; writing—review and editing, G.H., X.M. and J.D.; visualization, M.C.; supervision, G.H. All authors have read and agreed to the published version of the manuscript.
Funding
This research received no external funding.
Data Availability Statement
The data presented in this study are available upon request from the corresponding author.
Conflicts of Interest
Authors Xiaohui Xu, Ming Chi, Jiang Liu, and Siyu Lai were employed by Oil Production Technology Research Institute, PetroChina Xinjiang Oilfield Company. Author Xiangyan Meng was employed by PetroChina Xinjiang Oilfield Company. The remaining authors declare that the research was conducted in the absence of any commercial or financial relationships that could be construed as a potential conflict of interest.
References
- Zhong, Z. Study on the Sedimentation and Aggregation Law of Coal Fine in Fluctuating Wellbores. Ph.D. Thesis, China University of Petroleum, Beijing, China, 2021. [Google Scholar]
- Yao, J. Analysis of Sand Removal Operations in Coalbed Methane Wells in Fuxin Area. China Coalbed Methane 2011, 8, 34–36. [Google Scholar]
- Zhang, Y.; Li, Y.; Ge, D. Mechanical sand removal technology for coalbed methane wells. China Coalbed Methane 2005, 1, 24–25. [Google Scholar]
- Mo, R.; Liu, B.; Diao, X.; Qi, Y. Cycle replenishment drainage and gas production in CBM. J. China Coal Soc. 2014, 39, 141–145. [Google Scholar] [CrossRef]
- Tu, Z.; Li, P.; Meng, S. Application and Effect Analysis of CBM Extraction Process in Hancheng PSC Block. China Coalbed Methane 2016, 13, 27–30. [Google Scholar]
- Oroskar, A.R.; Turian, R.M. The critical velocity in pipeline flow of slurries. AIChE J. 1980, 26, 550–558. [Google Scholar] [CrossRef]
- Turian, R.M.; Hsu, F.-L.; Ma, T.-W. Estimation of the Critical Velocity in Pipeline Flow of Slurries. Powder Technol. 1987, 51, 35–47. [Google Scholar] [CrossRef]
- Davies, J.T. Calculation of critical velocities to maintain solids in suspension in horizontal pipes. Chem. Eng. Sci. 1987, 42, 1667–1670. [Google Scholar] [CrossRef]
- Salama, M.M. An alternative to API 14E erosional velocity limits for sand-laden fluids. J. Energy Resour. Technol. Trans. ASME 2000, 122, 71–77. [Google Scholar] [CrossRef]
- Stevenson, P.; Thorpe, R.B.; Davidson, J.F. Incipient motion of a small particle in the viscous boundary layer at a pipe wall. Chem. Eng. Sci. 2002, 57, 4505–4520. [Google Scholar] [CrossRef]
- Danielson, T.J. Sand Transport Modeling in Multiphase Pipelines. Paper presented at the Offshore Technology Conference, Houston, TX, USA, 30 April–3 May 2007. [Google Scholar] [CrossRef]
- Han, G.; Gao, F.; Zhu, B.; Guo, H. Superficial transport mechanisms of coal particles in thecoal-bed methane well. J. China Coal Soc. 2013, 38, 364–369. [Google Scholar] [CrossRef]
- Vassilev, V.V.; Tascón, M.D. Methods for characterization of inorganic and mineral matter in coal: A critical overview. Energy Fuels 2003, 17, 271–281. [Google Scholar] [CrossRef]
- Hilly Terrain Effects on Slug Flow Characteristics. SPE Annual Technical Conference and Exhibition. Available online: https://onepetro.org/SPEATCE/proceedings/93SPE/93SPE/SPE-26566-MS/55259 (accessed on 9 November 2024).
- Pang, B. Study on Technology and Equipment of Cleaning Wellbore in Coalbed Methane Well. Master’s Thesis, China University of Petroleum, Qingdao, China, 2024. [Google Scholar]
- Wang, D. Research on the Transport Mechanism and Control Technology of Pulverized Coal in the Entire Process of Coalbed Methane Production. Ph.D. Thesis, China University of Petroleum, Beijing, China, 2022. [Google Scholar]
- Li, J.; Lu, Y.; Sun, C.; Shi, Y. Experimental Study on the Wetting Properties of Coal Fine. Zhongzhou Coal 2015, 6, 36–38. [Google Scholar]
- Liu, S. CBM Wellbore Pulverized Coal Migration Rule Research. Master’s Thesis, China University of Petroleum, Beijing, China, 2018. [Google Scholar]
| Disclaimer/Publisher’s Note: The statements, opinions and data contained in all publications are solely those of the individual author(s) and contributor(s) and not of MDPI and/or the editor(s). MDPI and/or the editor(s) disclaim responsibility for any injury to people or property resulting from any ideas, methods, instructions or products referred to in the content. |
© 2025 by the authors. Licensee MDPI, Basel, Switzerland. This article is an open access article distributed under the terms and conditions of the Creative Commons Attribution (CC BY) license (https://creativecommons.org/licenses/by/4.0/).


 and
and 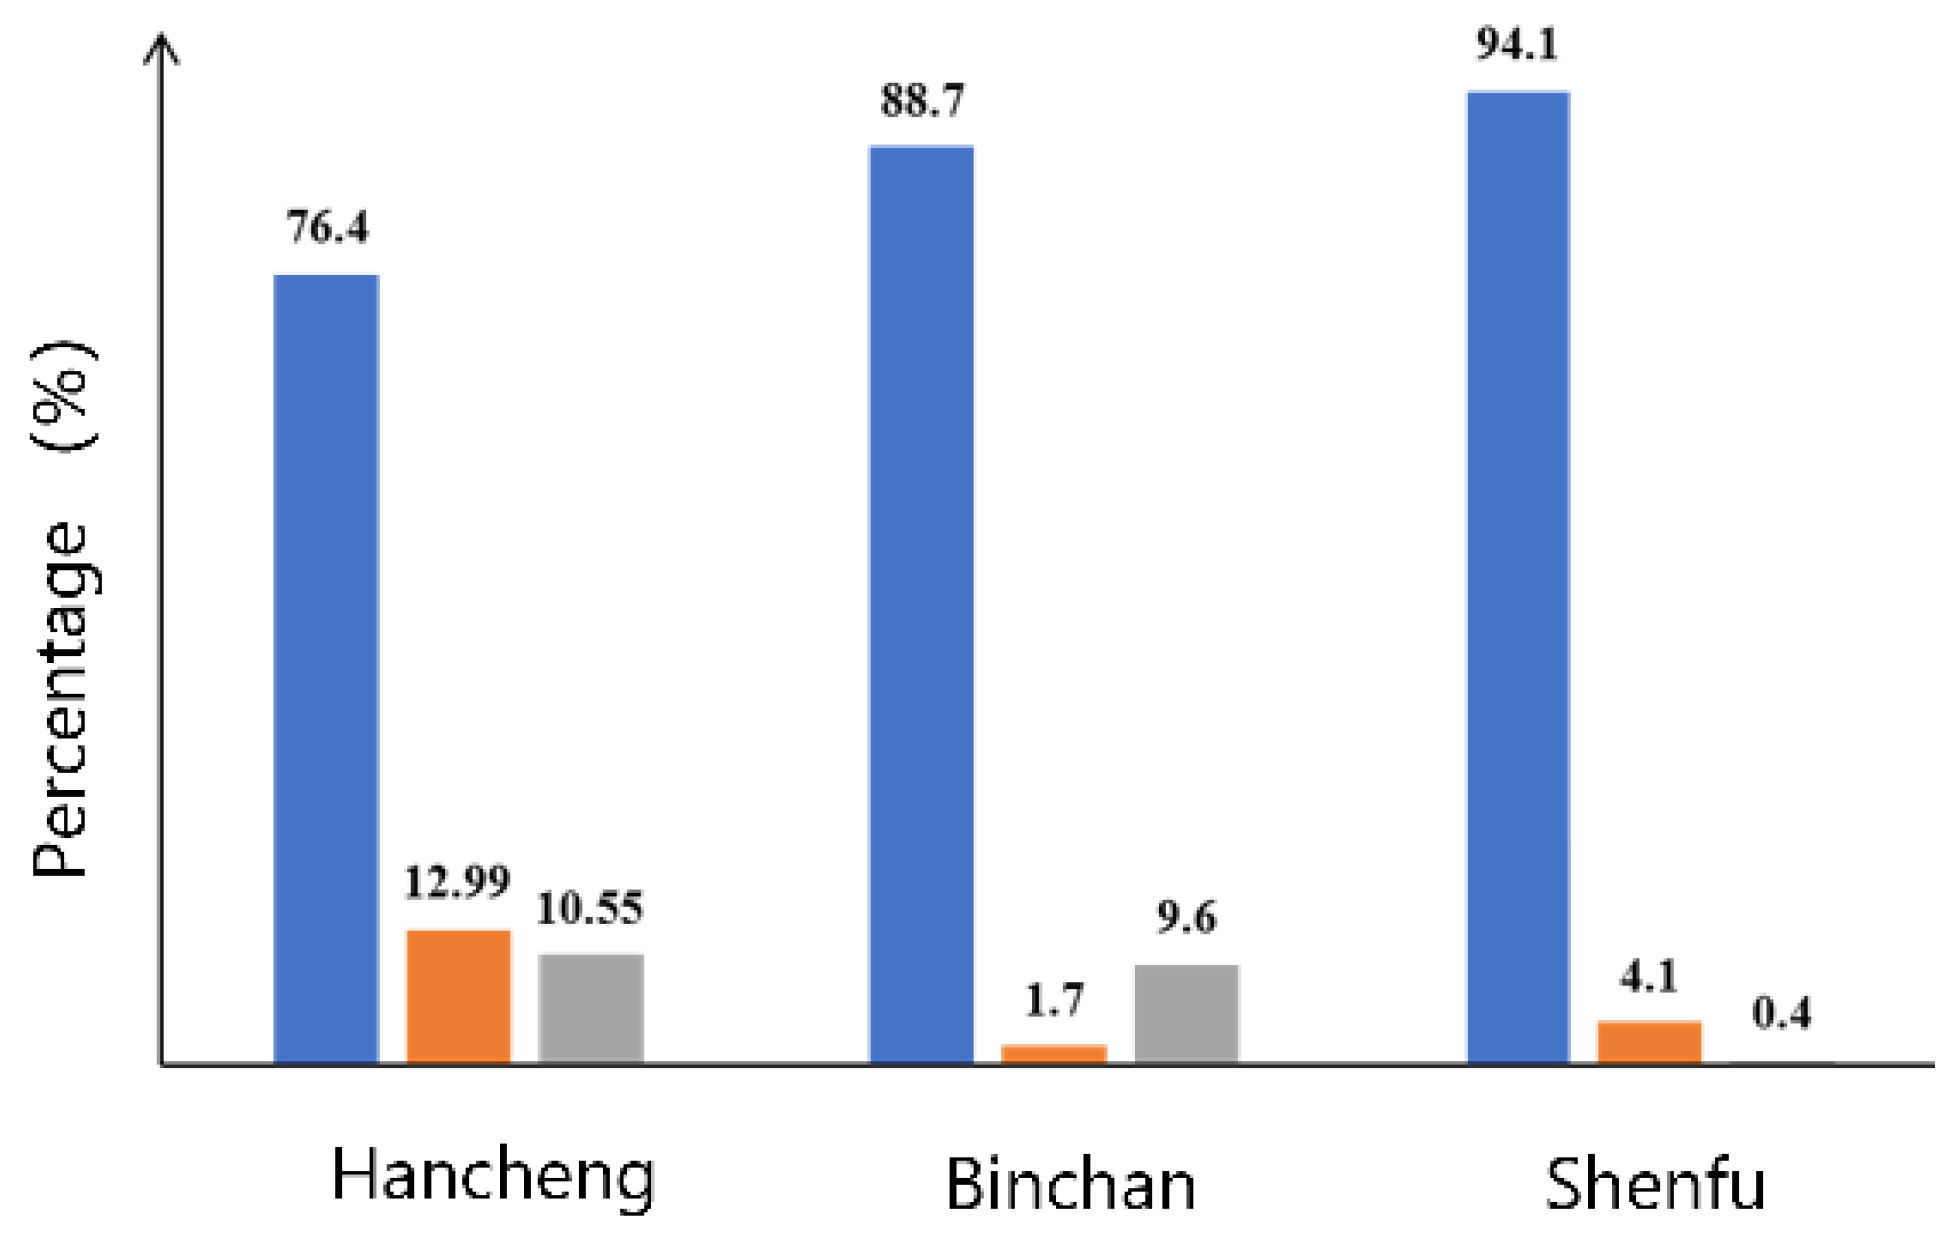


