Article

Development of a Biotechnological Strategy for CO2 Capture in Coke Plant Emissions Using Microalgae

by
Antonio Zuorro
1,*,
Jefferson E. Contreras-Ropero
2,
Renso J. Parada-Solano
2,
Janet B. García-Martínez
2,
Germán L. López-Barrera
2,
Néstor A. Urbina-Suarez
2 and
Andrés F. Barajas-Solano
2,*
1
Department of Chemical Engineering, Materials, and Environment, Sapienza University, Via Eudossiana 18, 00184 Roma, Italy
2
Department of Environmental Sciences, Universidad Francisco de Paula Santander, Av. Gran Colombia No. 12E-96, Cúcuta 540003, Colombia
*
Authors to whom correspondence should be addressed.
Processes 2025, 13(7), 2121; https://doi.org/10.3390/pr13072121
Submission received: 20 May 2025 / Revised: 25 June 2025 / Accepted: 30 June 2025 / Published: 3 July 2025

Abstract

Coke production generates up to 400 m3/min of flue gases containing 4% CO2. This study evaluated the capacity of the microalga Halochlorella rubescens_UFPS013 to capture CO2 from emissions generated by Excomin SAS (Colombia). A Central Composite Design and response surface methodology were employed to analyze the effects of CO2 concentration and light–dark cycles on biomass production. The statistical model explained 99% of the observed variability, suggesting a robust foundation with room for further improvement. In situ test showed that H. rubescens_UFPS013 tolerated a flue gas flow rate of up to 0.587 L/min, achieving an optimal predicted biomass yield of 2 g/L under a 12.6 h photoperiod on day 20. The generated biomass exhibited significant protein (48.5%) and lipid (9.6%) content, highlighting its potential for industrial applications in the food and energy sectors. These findings underscore the role of H. rubescens_UFPS013 as a viable biotechnological tool for CO2 capture in industrial processes, with prospects for scale-up and continuous optimization, contributing to sustainable solutions in emission reduction and the production of high-value bioproducts.

1. Introduction

In recent years, anthropogenic activities such as burning fossil fuels (coal, oil, or natural gas), deforestation, and energy generation have led to intense emissions of greenhouse gases [1]. Carbon dioxide (CO2) is the main component of these emissions and poses significant challenges to global environmental sustainability [2]. Addressing climate change has never been more critical, as 2020 was one of the warmest years on record (NOAA 2020). Despite global efforts, CO2 emissions related to energy were 2% higher in December 2020 compared to December 2019, as economies struggled to recover from the contraction caused by the COVID-19 pandemic (IEA 2021). The high concentration of CO2 in the atmosphere contributes to global warming, with an atmospheric lifetime of 50 to 200 years, making its mitigation an urgent priority [3]. CO2 accounts for approximately 52% of global warming [4].
Reducing CO2 emissions has been a major focus of research, with various strategies proposed, including carbon capture and storage (CCS) technologies and enhancements in energy efficiency. CCS involves capturing CO2 from industrial sources and storing it underground to prevent atmospheric release [5]. Despite its potential, CCS faces significant technical and economic challenges, as well as uncertainties regarding the long-term safety of storage [6]. Alternatively, renewable energy sources such as solar and wind present attractive options, although advancements in efficiency and cost-effectiveness are essential for widespread adoption [7]. Within this context, biological carbon capture using microalgae has emerged as a promising and sustainable approach due to its ability to utilize CO2 for growth and biomass production [8,9].
Microalgae contribute beyond CO2 capture, addressing other environmental concerns effectively. Their capacity to remove nitrogen and phosphorus from wastewater makes them valuable for mitigating eutrophication, a pressing issue in water bodies impacted by industrial activities [10]. Integrating microalgae into industrial systems leverages emissions to produce biomass rich in lipids and carbohydrates, fostering a circular economy and reducing dependence on fossil fuels [11]. Additionally, the production of bioactive compounds, including pigments and antioxidants, by microalgae has been extensively explored, offering applications in the pharmaceutical, cosmetic, and food industries [12].
Strains from the microalga Halochlorella rubescens have demonstrated exceptional CO2 capture and biomass production capabilities under diverse experimental conditions. Studies report biomass productivities of up to 31.2 g·m−2·day−1 in biofilm photobioreactors using 3% CO2, among the highest documented for such systems [13]. In liquid cultures, this strain achieved biomass yields of 0.49 g·L−1 under 5% CO2, maintaining stability under stress conditions [14]. Comparative analyses reveal that Chlorella vulgaris reached 0.9 g·L−1 under 4% CO2 in continuous flow reactors [15], while Scenedesmus obliquus achieved carbon fixation rates of 1.296 g·L−1·day−1 in aerated cultures utilizing industrial gases [16]. These results underscore the competitive potential of H. rubescens in biotechnological and industrial applications, highlighting its efficiency and versatility.
Photosynthesis is an effective natural mechanism for recycling CO2. Each year, 500 billion tons of CO2 are biologically mitigated through terrestrial vegetation worldwide. However, this process is insufficient to counteract the current rise in atmospheric CO2 levels [17]. Microalgae, with their high CO2 fixation capacity, offer a more effective solution, converting CO2 and solar energy into biomass composed of lipids, proteins, polysaccharides, and pigments [18,19,20]. This process not only reduces atmospheric CO2 but also produces valuable bioproducts [21,22]. Unlike terrestrial plants, microalgae can double their biomass much more rapidly, reaching growth rates up to 100 times faster.
Moreover, their adaptability to diverse environmental conditions and ability to use seawater and wastewater make them an effective tool for climate change mitigation [23,24]. These characteristics, along with their ability to convert solar energy into chemical energy and fix CO2 into stable organic compounds without generating secondary pollution, position them as a practical solution [25]. This method has been considered one of the most essential approaches to carbon capture [26]. Compared to other techniques, such as chemical absorption and geological storage of CO2, biological capture through microalgae is seen as an up-and-coming option [27].
Using real combustion gases, such as those generated in industrial coke production plants, introduces a series of contaminants that pose significant challenges for microalgae carbon capture. These gases are primarily composed of carbon dioxide (CO2) but also contain additional pollutants such as sulfur dioxide (SOx), nitrogen oxides (NOx), carbon monoxide (CO), and particulate matter. The presence of these contaminants can negatively affect the physiology of microalgae, impacting their ability to capture CO2 and generate biomass. Recent studies have shown that elevated concentrations of SOx and NOx can alter the metabolism of microalgae, affecting photosynthesis and reducing carbon fixation efficiency [28]. Furthermore, these gases can induce oxidative stress in cells, compromising cell viability and biomass productivity [29].
While many previous studies have used synthetic gases in controlled experiments, using real combustion gases (with the presence of SOX, NOX, particulate matter, and other elements) allows for a more accurate assessment of microalgae’s conditions in actual industrial environments. H. rubescens has been identified as a suitable strain for operating under these adverse conditions due to its ability to tolerate industrial contaminants and maintain biomass production. Recent research has demonstrated that this strain can grow in the presence of combustion gases containing high CO2 and other pollutants without significantly losing its carbon fixation capacity [30]. This makes it a viable option for large-scale industrial processes where contaminants are inevitable.
The selection of H. rubescens as a model organism is based on its robustness and versatility under extreme conditions. This strain has demonstrated the ability to maintain high biomass productivity rates under CO2 concentrations of up to 5%, while accumulating significant proportions of lipids (17.77%) and carbohydrates (56.81%) [31]. In biofilm environments, H. rubescens has achieved growth rates of 31.2 g·m−2·day−1, highlighting its adaptability to high carbon fluxes [13]. Compared to species such as Scenedesmus obliquus, renowned for its efficiency in nutrient removal and carbon fixation [16], H. rubescens stands out for its tolerance to industrial pollutants such as sulfur oxides and nitrogen oxides, while maintaining cellular viability and productivity [14]. These characteristics position it as a competitive and sustainable alternative for industrial applications.
Biomass growth under industrial conditions depends mainly on optimizing key parameters such as CO2 concentration and the light–dark cycle. Controlling the CO2 concentration is essential, as while CO2 is necessary for photosynthesis, excessive levels can disrupt the cellular osmotic balance, negatively affecting the growth of microalgae [32]. On the other hand, optimizing the light–dark cycle can significantly influence the rate of carbon fixation and the production of bioactive compounds, such as lipids and pigments, which are of great interest to various industries [33]. This study will explore how the interaction of these factors under actual combustion gas conditions can maximize both CO2 capture and biomass productivity in H. rubescens.
Additionally, it has been shown that combining industrial gases with optimized cultivation parameters improves carbon capture efficiency and opens new opportunities for valorizing these gases and wastes into marketable products. H. rubescens can produce lipids, which can be used in biofuel production, as well as pigments and other bioactive compounds with applications in the pharmaceutical, cosmetic, and food industries [34]. This process of biotransforming industrial waste contributes to reducing CO2 emissions. It converts these contaminants into valuable resources, generating high-value-added products that can enhance the profitability of industrial plants adopting this technology.
The objective of this research is to evaluate how variations in the light–dark cycle and the concentration of combustion gases influence the ability of the microalgae strain H. rubescens to capture carbon dioxide and generate biomass under industrial conditions, specifically in a coke production plant. The goal is to optimize these parameters to maximize CO2 capture efficiency and biomass productivity, focusing on synthesizing high-value bioactive compounds like lipids and pigments. Optimizing these processes has the potential to significantly reduce CO2 emissions in carbon-intensive industrial sectors while also promoting the production of commercial bioproducts, generating a positive impact on environmental sustainability. Integrating carbon capture and reuse within a circular economy framework could create new technological and economic opportunities, contributing decisively to the global climate change mitigation strategy.

2. Materials and Methods

2.1. Strain

Halochlorella rubescens UFPS013 was isolated from a thermal spring in the town of Bochalema (Colombia). The strain was maintained on solid agar plates with Bold Basal medium [35] under a photoperiod of 12:12 h (light), at a light intensity of 100 µmol m−2 s−1 and a temperature of 26 ± 1 °C, in the INNOValgae collection (UFPS, Cucuta, Colombia). The strain was reinoculated every 35 days to maintain its active metabolism.

2.2. Initial Biomass Production

The strain was aseptically inoculated into a 2000 mL GL45 glass flask (Schott, Germany) containing 80% of the working volume of Bold Basal liquid medium. The culture was aerated by injecting filtered air with 1% (v/v) CO2 at a flow rate of 0.6 L min−1, under a photoperiod of 12:12 h (light) at 100 µmol m−2 s−1 and maintained at 26 ± 1 °C for 20 days. Upon completion of the cycle, the biomass was used for various experimental designs.

2.3. Effect of Photoperiod and Flue Gas Concentration on Biomass Production

To evaluate the effect of the light–dark cycle and flue gas concentration on biomass production, a Central Composite Design (CCD) was employed, coupled with response surface methodology, using Design Expert software (v22.02, StatEase, MN, USA). This design consisted of 14 experiments (Runs), distributed in 2 blocks, including six central points and eight axial points (Table 1). In each experiment, biomass was inoculated into 9000 mL reactors with a working volume of 7000 mL. The culture medium was agitated by the injection of simulated flue gas from a custom cylinder provided by a local gas supplier (FONOS, Colombia). The simulated flue gas comprised 13.9% oxygen, 4.2% CO2, 69.9%, NO2 and 12% air [36]. Gas concentrations were selected to simulate the flue gas from Excomin SAS coke plant production (Norte de Santander, Colombia).
After the 20-day cultivation period, biomass was measured using the dry weight method. The obtained data were analyzed using analysis of variance (ANOVA), following the parameters established by the software, to assess the significance of the independent variables and their interactions with biomass production.

2.4. Optimization of Photoperiod and Flue Gas Concentration

The levels of the evaluated factors will be adjusted according to the results of Section 2.3 and will be further analyzed using a Central Composite Design (CCD) coupled with response surface methodology, using Design Expert software (v22.02, StatEase, MN, USA).

2.5. Biomass Quantification

Biomass estimation was carried out using the dry weight method. At the end of the cultivation period, 20 mL aliquots of the medium were taken and filtered through pre-incinerated Whatman GF/C filters (incinerated at 100 °C for 1 h) that had been previously weighed. The filters were then placed in an oven at 100 °C for 1 h and left in a desiccator for 12 h to reach a constant weight before being weighed again [37]. Dry weight was calculated using Equation (1), where the difference in mass ( W f W i ) provides the net mass of dry biomass accumulated on the filter, normalized by the volume of the filtered sample ( V f ), allowing for the calculation of biomass concentration in the culture medium at the end of the experiment.
B d = W f W i V f
where
  • B d is the dry biomass per unit volume of the culture medium (g/L).
  • W f is the final weight of the filter with the dry biomass (g).
  • W i is the initial weight of the filter before filtration (g).
  • V f is the volume of the aliquot filtered (L).

2.6. Biomass Analysis

2.6.1. Total Carbohydrates

The biomass produced by the field verification experiments was used to obtain total carbohydrates, according to Moheimani & Borowitzka [37]. Briefly, 5 mg of dried biomass was homogenized with 0.5 mL of 1 M H2SO4 (2000 rpm, 20 min) in an automatic vortex (Multi Reax, Heidolph, Germany). After the destruction, 5 mL of 1 M H2SO4 was added. The sample was incubated (100 °C, 1 h). After incubation, the sample was cooled down at room temperature (30 min) and centrifuged to remove cellular debris. A total of 2 mL of the supernatant was removed into a glass tube and mixed with 1 mL of phenol solution (5% w/v) and 5 mL of concentrated H2SO4. The sample was mixed and cooled at room temperature (30 min). The samples were analyzed on a spectrophotometer UV–VIS at 485 nm.

2.6.2. Total Proteins

Samples were analyzed according to Slocombe et al. [38]. A total of 5 mg of dried biomass was vortexed in an automatic vortex (Multi Reax, Heidolph, Germany) 0.2 mL 24% (w/v) TCA (2000 rpm, 10 min) and the sample was incubated (95 °C for 15 min). after cooldown at room temperature, 0.6 0.6 mL of deionized water were added and the sample was centrifuged (15,000 rpm, 20 min at 4 °C) and the supernatant was discarded. The TCA precipitate was resuspended in 0.5 mL of Lowry Reagent D and incubated (55 °C, 3 h), followed by centrifugation (15,000 rpm, 20 min at 25 °C). The supernatant was used to obtain the concentration of total proteins according to the Lowry method.

2.6.3. Total Lipids

Samples were analyzed following the protocol created by Mishra et al. [39]. A total of 5 mg of dried biomass was mixed with 2 mL of concentrated H2SO4 and incubated (100 °C, 10 min). The sample was cooled down in an ice bath for 5 min and mixed with 5 mL of freshly prepared phospho-vanillin reagent. The sample was incubated (15 min, 37 °C), and the samples were analyzed on a spectrophotometer UV–VIS at 530 nm.

2.6.4. Total Organic Carbon (TOC) Analysis

Total Organic Carbon (TOC) was quantified using a TORCH TOC analyzer from TELEDYNE (Cincinnati, OH, USA). The procedure began with an acid digestion step, where 1 mL of sulfuric acid at a concentration of 1 M was added, followed by thermal digestion for one hour in a water bath at 100 °C. After digestion, the sample was allowed to cool to room temperature until equilibrium. Once stabilized, the sample was centrifuged, and the resulting supernatant was used for the assay. The operational conditions of the analyzer were as follows: sample volume of 0.5 mL, carrier water volume of 1.0 mL, injection line rinse activation, injection line rinse volume of 0.5 mL, acid volume of 0.5 mL, ICS purge flow rate of 200 mL min−1, carrier gas delay time of 0.40 min, ICS purge time of 50 min, detector sweep flow rate of 500 mL min−1, sweep time in the furnace of 1.0 min, and system flow rate of 200 mL min−1.

2.7. Field Verification

Following the statistical analysis of the data obtained from the previous experimental design (CCD), in situ results were validated at the Excomin SAS coke plant production (Cucuta, Colombia), considering the optimal levels determined for maximizing biomass production.
For the experiments, biomass was cultivated in two 30 L photobioreactors (Synoxis algae, France) connected to a manifold, ensuring flue gas temperature reduction before injection into the PBR. The light intensity was regulated using greenhouse plastic sheeting. Biomass produced under this stage was analyzed using dry weight, total carbohydrates, proteins, lipids, and COT. The results were compared with those of a control group maintained under identical conditions, except for the absence of flue gas injection. This experimental cycle was replicated over five months (December 2024–April 2025) to ensure the robustness of the obtained data.

2.8. Biomass Production and Metabolite Concentration

H. rubescens_UFPS013 was produced and evaluated under optimized conditions identified in the adjustment process using flue gases (with an average concentration of 13.6% oxygen, 4.09% CO2, 65% NO2, and 10% air) from the coke plant. The cultivation was conducted in two 30 L photobioreactors, with 300 mL aliquots taken daily over 20 days. Biomass was quantified using the dry weight method.
Biomass collected at different time points during the growth kinetics (days 5, 10, 15, and 20) was used for biochemical composition analysis, specifically for quantifying protein, carbohydrate, and lipid content. Each analysis was performed in triplicate, and results were expressed as a percentage of the dry weight of the total biomass.
The biochemical composition of metabolites was calculated using the following Equation (2):
M c = M s B f × 100
where
  • Mc represents the percentage of the metabolite (proteins, carbohydrates, or lipids) in the biomass (%);
  • Ms is the mass of the specific metabolite in the sample (g);
  • Bs is the total dry biomass in the sample (g).

3. Results

3.1. Effect of Photoperiod and CO2 Concentration on Biomass Production and CO2 Capture

3.1.1. Statistical Analysis

The statistical analysis of the data was conducted using an analysis of variance (ANOVA) (Table 2) model to evaluate the effects of light intensity (A) and CO2 flow rate (B) on biomass production. This model allowed for the identification of both individual effects and interactions between the studied factors, including quadratic terms to capture nonlinear relationships within the experimental range. The model’s validity was assessed using metrics such as the coefficient of determination (R2), adjusted R2, predicted R2, and Adeq Precision, which measures the signal-to-noise ratio in the data. The results indicate that the model explains 99.29% of the variability in biomass production (R2 = 0.9929), while the adjusted R2 value of 0.9879 suggests the model adequately captures the influence of the considered variables. Finally, the predicted R2 of 0.9768 shows the high capacity of the model to predict new experimental data. Meanwhile, the Adeq Precision value of 27.1428 indicates the model can reliably distinguish signal from noise within the evaluated range.
Regarding the main factors, both photoperiod (p = 0.0038) and CO2 flow rate (p = 0.0062) had significant effects on biomass production. Additionally, the quadratic analysis revealed a significant effect of both factors, highlighting the importance of optimizing this parameter to maximize biomass production. The lack-of-fit test was non-significant (p = 0.8356), indicating that discrepancies between the observed data and the model can be attributed to random variations rather than structural deficiencies in the model. Finally, the coefficient of variation (C.V.) of 7.8% confirms the model’s consistency within the experimental range.
In practical terms, these results provide a robust foundation for optimizing cultivation conditions in experimental and industrial systems. For instance, adjusting the CO2 flow rate within an optimal range could maximize carbon availability, while careful control of the photoperiod could minimize the effects of photooxidative stress. Furthermore, understanding the interactions between factors helps avoid suboptimal configurations that could reduce system efficiency.

3.1.2. Visualization of Interactions Using Response Surfaces

The response surfaces generated in this study reveal how the interaction between the photoperiod and flue CO2 flow rate influences biomass production, allowing the identification of optimal combinations of these factors to maximize biomass yield. Although the ANOVA provides a statistical assessment of these variables’ individual effects and interactions, the response surfaces directly visualize how these interactions affect production outcomes.
Figure 1 presents a three-dimensional representation of the results through two complementary contour plots: the desirability plot (Figure 1A) and the biomass production plot (Figure 1B). In the desirability plot (Figure 1A), it is observed that the optimal conditions for maximizing biomass, reflected by the highest desirability, are around 12 h of light and a flue CO2 flow rate of 0.5 L/min. These conditions achieve a desirability close to 1.0, indicating they are the most favorable within the studied experimental space. On the other hand, the biomass production plot in Figure 1B clearly shows how these conditions lead to the highest biomass production, with a peak production coinciding with the optimal desirability values, reaching maximum biomass values of approximately 1.5 g/L.
Additionally, by examining both plots in Figure 1, clear patterns can be identified showing how photoperiod and flue CO2 flow rate interact to influence biomass production. For instance, it is observed that both desirability and biomass increase consistently in specific areas of the experimental space, suggesting a positive interaction between these variables. The proximity of the areas of maximum desirability and maximum biomass in both plots reinforces that optimizing these conditions is crucial for improving biomass production.

3.1.3. Quadratic Model for Biomass Prediction

The quadratic model obtained indicates that biomass production depends on two primary factors—flow rate of combustion gases (X) and photoperiod (Y). The cycle of hot gases is a beneficial contributor to producing biomass by the higher C availability due the better photosynthesis. However, the model also highlights a level-off CO2 flow rate, demonstrating that a further increase cannot enhance the biomass production by CO2 enrichment, possibly caused by physiological constraints such as osmotic stress or medium acidification.
Negative effects of the photoperiod on biomass production are due to photooxidative stress, which in the gas phase limits growth. However, the model predicts that under severe light regimes, microalgae can adapt through enzymatic control or antioxidant accumulation. The relationship between CO2 flow rate and photoperiod exposes a non-additive effect; increasing the supply of CO2 enhances biomass production, which, however, decreases with an increased photoperiod, implying that the physiological advantages of increased CO2 availability are not so evident when the duration of light exposure is extended. This emphasizes the requirement for co-optimization of both parameters to achieve maximal biomass production.
B i o m a s s   g L = 1.68449 + 0.393877 P h o t o p e r i o d + 4.35278 F l u e   g a s + 0.009524 P h o t o p e r i o d F l u e   g a s 0.015799 P h o t o p e r i o d 2 3.80469 F l u e   g a s 2

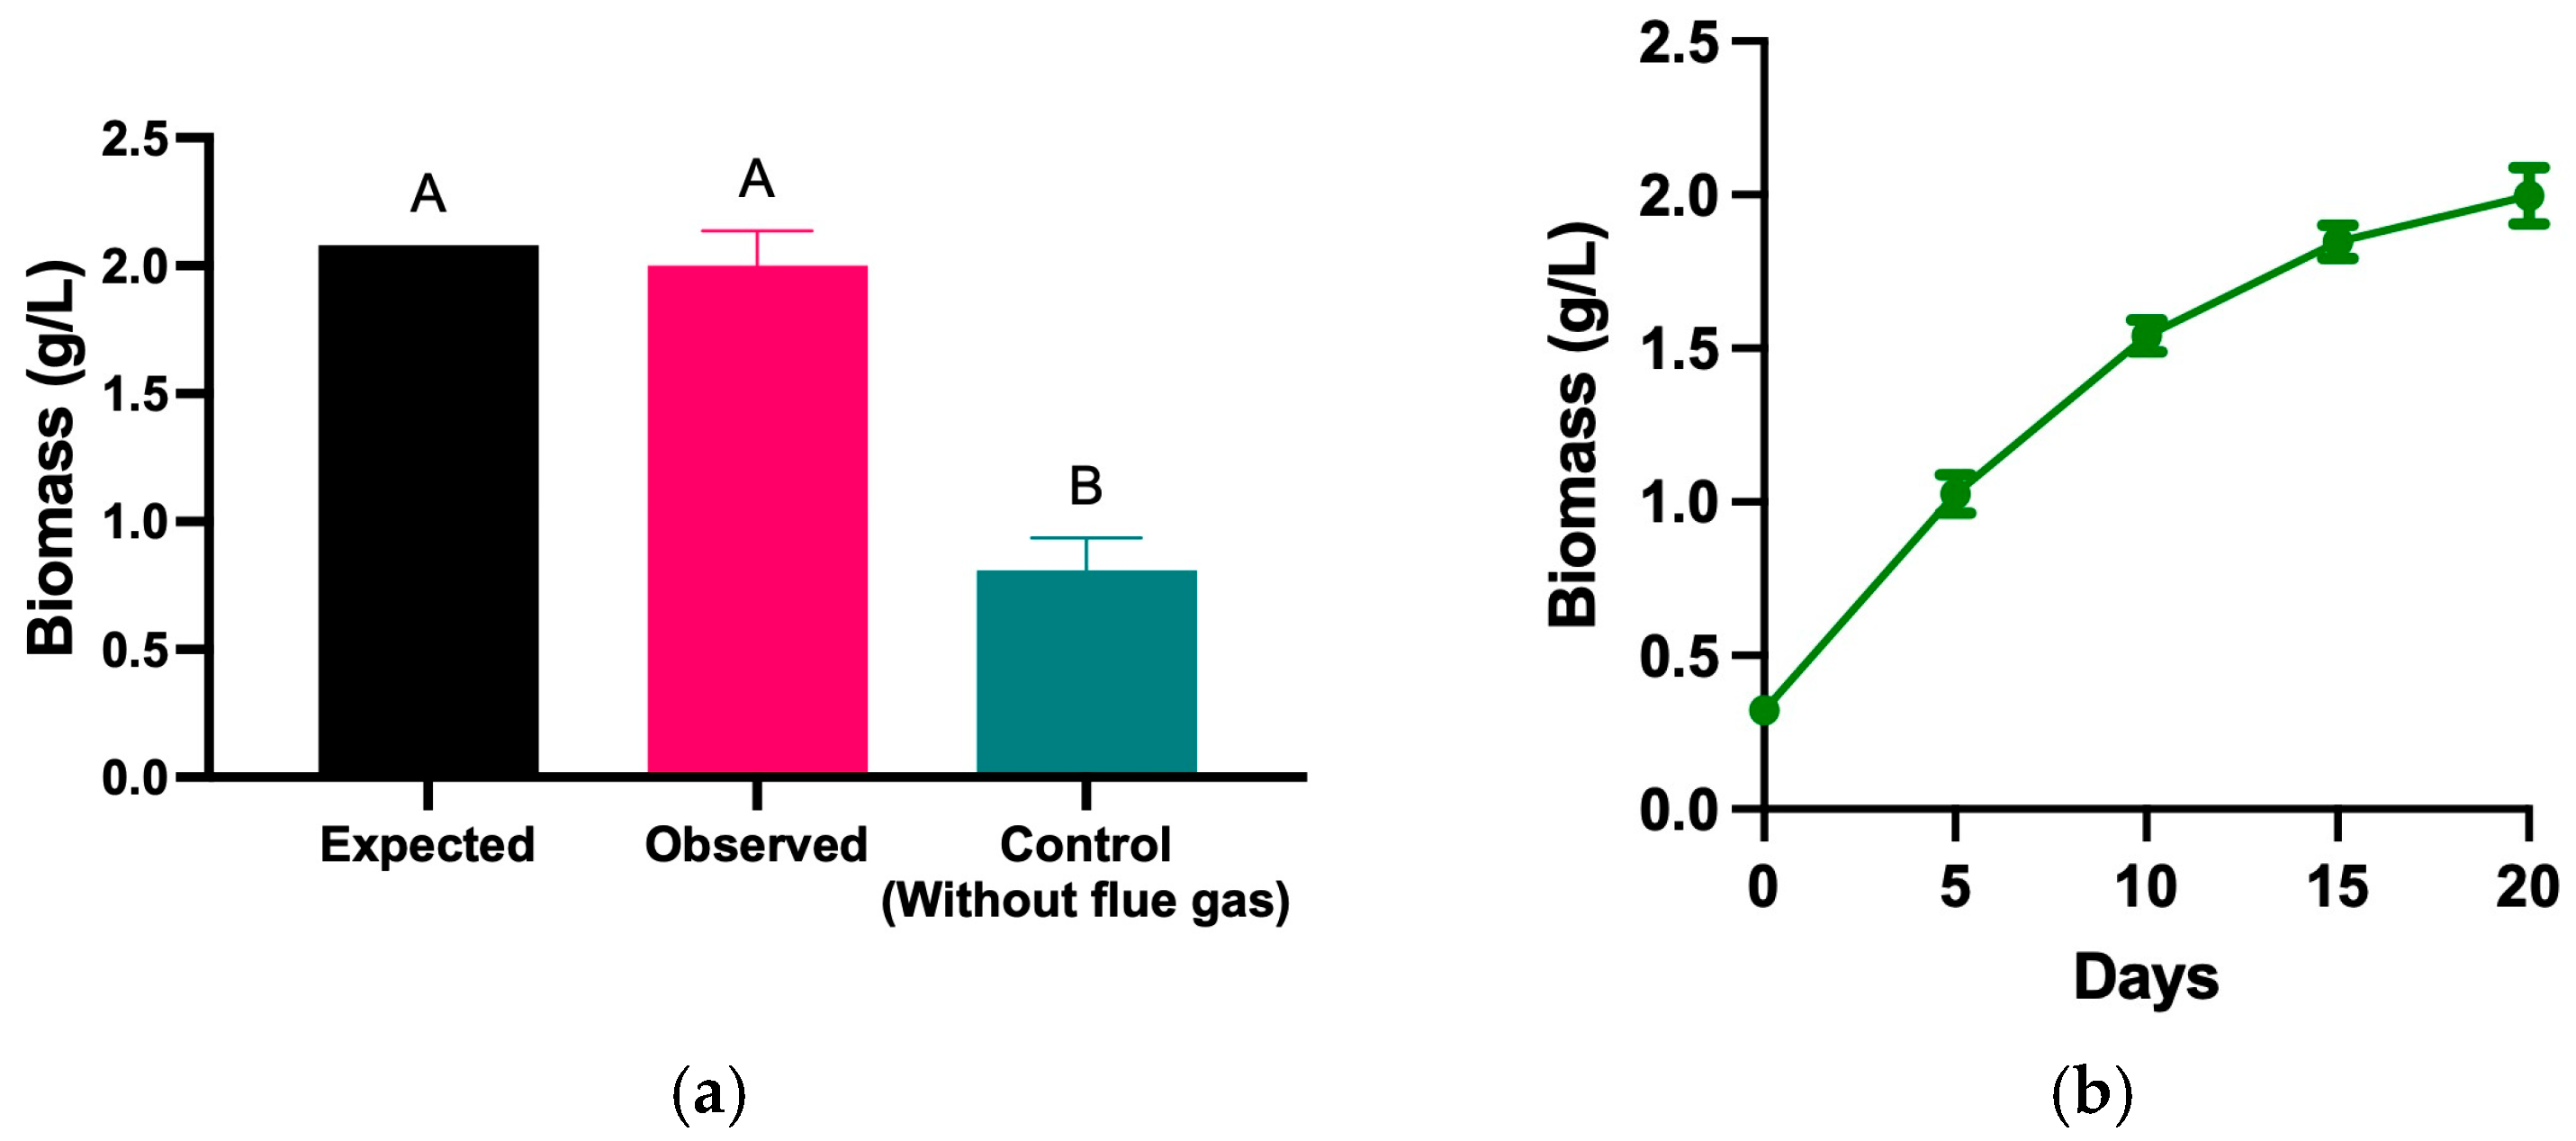
3.2. Process Optimization

The optimization process using the Design Expert module allowed for identifying optimal conditions to maximize biomass production in microalgae cultivation. This detailed analysis enabled the determination of precise levels of critical variables, such as flue CO2 flow rate and photoperiod, that generate the highest production efficiency. After an exhaustive analysis of the interactions between these variables, it was established that a flue CO2 flow rate of 0.587 L/min combined with a photoperiod of 12.6 h are the ideal conditions for optimizing biomass production (Table 3).
The results indicate that applying these optimal values can predict a biomass production of 2.08 g/L, representing a significant yield compared to other experimental conditions. Additionally, the desirability of this adjustment, which measures the model’s effectiveness in achieving the optimization goal, reached a value of 0.9768. This high desirability value suggests the model is highly suitable for the experimental conditions, ensuring practical and reproducible application in controlled cultivation systems.
The optimized conditions were tested under a real-life scenario using real flue gas and solar light, enhanced with LEDs to obtain the expected photoperiod regime (Table 3). In this case, two 30 L PBRs were connected to a line of cooled flue gas from the coke plant (Figure 2).

Biomass Production and Biochemical Composition of Metabolites

The biomass concentration obtained from the test under a real-life scenario using real flue gas and solar light was compared against the expected values of the obtained model (Table 3) and a negative control (without flue gas or additional CO2). The data was analyzed using a one-way ANOVA, followed by Dunnett’s multiple comparisons test was performed using GraphPad Prism (version 10.2.3). According to the model, the predicted biomass concentration was approximately 2.08 g/L.
Under real combustion gas conditions, the observed biomass concentration was like the expected values of the model; however, the control without flue gas or additional CO2 only reached 0.81 g/L (Figure 3a). These results emphasize the positive influence of combustion gases on biomass production, highlighting that CO2 in industrial gases promotes more efficient growth. Figure 3b shows the biomass production of H. rubescens_UFPS013 over 20 days under optimized conditions using real combustion gases. The data indicate a steady growth trend throughout the cultivation cycle, culminating in a peak biomass value of 2.0 g/L on day 20. This sustained increase reflects that the experimental conditions supported exponential growth during the early stages, followed by stabilization in the final phase of the experiment, suggesting a favorable environment for maximizing biomass production in industrial settings.
Figure 3c illustrates changes in the biochemical composition of the biomass over time, showing that proteins constitute the primary metabolite, with a gradual increase as the cultivation cycle progresses, reaching its highest value on day 20. Lipids also demonstrate a consistent increase in accumulation, while carbohydrates exhibit relatively stable levels during the early phases of cultivation, with a slight uptick towards the final days. These trends suggest that the applied conditions promoted cellular growth and the synthesis of critical metabolites, such as proteins and lipids, essential for various industrial applications, including high-value bioproducts. Similarly, Figure 3d presents the biochemical composition of the biomass produced under both conditions. A two-way ANOVA analysis indicated that using combustion gases significantly impacted the synthesis of critical metabolites such as proteins, lipids, carbohydrates, and Total Organic Carbon (TOC). Total Organic Carbon (TOC) refers to the amount of carbon found in organic compounds within a system. In the context of microalgal biomass, TOC serves as an indicator of the efficiency of carbon fixation and metabolic activity, reflecting how effectively the system utilizes carbon sources, such as CO2, to synthesize organic matter. This parameter is crucial for evaluating the conversion efficiency of CO2 into biomass and can also provide insights into the biochemical quality of the produced material. Notably, total carbohydrate content was higher under combustion gas conditions, reaching 29%, compared to 23% w/w in the control group. Lipid and protein content showed no statistical significance. Additionally, an increase in TOC was observed, suggesting more efficient carbon utilization under combustion gas treatment.
Table 4 presents the biomass concentration of various microalgae species evaluated under different CO2 concentrations and temperatures. In this study, H. rubescens_UFPS013 achieved a biomass production of 2 g/L at a temperature of 27 ± 1.2 °C under real combustion gas conditions from a coke plant. This yield is notable compared to other species. For instance, Scenedesmus obliquus exhibited a higher biomass concentration of 2.25 g/L but using a high CO2 concentration of 15% and a temperature of 30 °C, while C. vulgaris showed a yield of 0.43 g/L at 10% CO2 and 27 °C. In the case of Dunaliella sp., a biomass content of 0.17 g/L was observed at a CO2 concentration of 3% and 27 °C, whereas Chlorella sp. reached 1.2 g/L at 25% CO2 and 40 °C. On the other hand, Scenedesmus sp. achieved 1.95 g/L at 20% CO2 and 30 °C. These variations in biomass productivity across species and experimental conditions underscore the importance of optimizing CO2 concentration and temperature for each strain.
The biochemical composition analysis of various microalgal strains, as shown in Table 5, reveals significant differences in biomass production and the concentration of metabolites such as proteins, carbohydrates, and lipids.
Regarding biomass, Scenedesmus vacuolatus stood out with the highest value, reaching 8.3 g/L, while H. rubescens_UFPS013 recorded a comparatively higher value of 1.65 g/L. Also, H. rubescens_UFPS013 exhibited a notably significant protein content of 48.5%, positioning it well above other species such as Chlorella sp., 48.5%, and S. vacuolatus, 44.6%. Regarding carbohydrate content, H. rubescens_UFPS013 recorded a carbohydrate content of 29.6%, surpassed only by certain strains of Nostoc, such as Nostoc sp. PCC 9202, which exhibited a maximum carbohydrate content of 32.2%. Regarding lipid content, H. rubescens_UFPS013 presented a value of 9.6%, positioning it below strains like S. vacuolatus, which reached 28%. However, its balanced profile highlights its potential for specific biotechnological applications, such as bioethanol production or its integration into systems prioritizing protein and carbohydrate synthesis over lipid accumulation.

4. Discussion

4.1. ANOVA Analysis

The ANOVA (analysis of variance) is an essential statistical tool in scientific research, allowing for the decomposition of observed variability in a data set into components attributable to different sources. In this case, it has been used to evaluate the impact of variables such as CO2 and light on biomass production and CO2 capture in an experimental environment. This approach facilitates the identification of the individual effects of each variable and their interactions, providing a deeper understanding of the underlying processes. Studies like those by Senatore et al. [11] have demonstrated the importance of these variables in photobioreactor systems. At the same time, Heffernan et al. [53] have highlighted the complexity of these interactions in industrial CO2 valorization contexts.
Firstly, it is essential to note the significance of the overall model, with a p-value of <0.0001, which indicates that the selected variables effectively explain the variability in the response. This finding is consistent with previous studies, such as that of Senatore et al. [11], where both CO2 and light were shown to be determinants in biomass production in photobioreactor systems. Specifically, the main effects of A-Photoperiod and B-Flue gas are highly significant, with p-values of 0.0038 and 0.0062, respectively. These results reinforce the existing literature that emphasizes the sensitivity of microalgae to these environmental variables. However, studies like that of Deprá et al. [54] suggest that while these variables are critical, other factors such as water quality or temperature may also play an important role, which could explain the unexplained residual variability [11,54].
On the other hand, the interaction between photoperiod and flue gas, though not significant at the conventional level (p = 0.5385), suggests a moderate interaction that could be relevant in broader studies or with a more refined experimental design. This behavior is consistent with research by Ghosh et al. [55], which evidences complex interactions between these variables in optimizing biomass production and CO2 fixation. However, Madhubalaji et al. [56] question the robustness of these interactions under certain conditions, suggesting that the response may vary significantly depending on other factors, such as agitation intensity or the presence of other nutrients [55,56]. Regarding model evaluation, the determination coefficients R2 and adjusted R2, which are 0.9929 and 0.9879, respectively, indicate a good fit of the model to the data. Also, the predicted R2 of 0.9768 reveals that the model possesses a high ability to predict new observations, suggesting that other factors studied are highly influential on the biomass production. This aspect is crucial, as studies like those by Deprá et al. [54] have highlighted the importance of including additional variables, such as temperature and nutrient availability, to improve predictive capacity in complex biological systems. On the other hand, studies like that of Ziganshina et al. [57] emphasize that while the model may adequately describe current data, its applicability may be limited in different scenarios or on larger industrial scales [54,57].

4.2. Response Surface Analysis

A response surface analysis was utilized to better understand how photoperiod and CO2 flow rate interact in biomass production, revealing optimal points within a range to maximize these results. This type of analysis is beneficial for visualizing how different combinations of variables can influence performance [55]. Wang et al. [58] optimal points were found within a similar range, where the combination of moderate CO2 flow and an adjusted photoperiod resulted in significant biomass production, demonstrating the effectiveness of this approach in optimizing microalgae cultivation. The desirability analysis, which integrates multiple optimization criteria, suggests that the conditions identified within these ranges are optimal for biomass production and other performance parameters. This is supported by studies such as that of Gao et al. [59], which demonstrated that maintaining CO2 flow rate within a moderate range is crucial to avoid saturation and ensure efficient conversion of CO2 to biomass. Additionally, Choi et al. [60] reported that a photoperiod in the intermediate range effectively maximizes production. This reinforces the results obtained in this study, where a notable increase in biomass production was observed under similar conditions.
Furthermore, these findings highlight the importance of adjusting experimental conditions to maximize performance in different contexts. Huang et al. [61] found that to optimize biomass production in an industrial setting, it is essential to adjust CO2 flow rate and photoperiod based on the system’s specific characteristics, such as temperature or culture medium composition. This study observed that changing these variables within specific ranges allows for maximum biomass production while meeting other optimization criteria, indicating that optimal conditions must be carefully adapted when scaling the process or modifying the experimental environment.

4.3. Quadratic Model

Using a quadratic model is fundamental for addressing the inherent complexity of nonlinear relationships between variables, such as CO2 flow rate and photoperiod in biomass production. This approach allows for precise identification of the optimal combinations of these variables, maximizing productive efficiency. The model’s ability to capture these nonlinear interactions has been validated in multiple studies. For instance, Mohammadi & Abedini [62] demonstrated that quadratic models are particularly effective in optimizing complex biological processes, as they evaluate how slight variations in critical variables can significantly impact outcomes, such as biomass production. Regarding the impact of CO2 flow rate on biomass production, this model confirms that an adequate CO2 supply is crucial for photosynthetic efficiency, consistent with the existing literature. The work by Wang et al. [58] supports this claim, highlighting that CO2 not only acts as an essential substrate for photosynthesis but also directly influences the growth rate of microalgae. However, Wang et al. [58] also caution that there is an optimal CO2 threshold beyond which saturation occurs, which can decrease photosynthetic efficiency and, consequently, biomass production.
In identifying the coefficients of the quadratic equation, it is crucial to analyze how these coefficients reflect the dynamics between the variables. For example, the positive quadratic coefficient associated with CO2 flow rate suggests the presence of an optimal point, after which further increases in CO2 will not continue to increase biomass proportionally. This saturation phenomenon is well documented in the literature, where it has been observed that excess CO2 can lead to a self-shading effect in dense cultures, reducing the efficiency of available light for photosynthesis [63]. Additionally, the negative interaction term in the equation suggests that although CO2 and photoperiod are beneficial separately, their combination requires integrated adjustment. The negative relationship implies that an increase in one variable may require a decrease in the other to maintain or maximize biomass production. This finding is consistent with studies like that of Shalaby et al. [64], which also observed that interactions between environmental variables in biological processes are often complex and nonlinear, justifying the use of advanced models like the quadratic one to capture these relationships.
On the other hand, the identification of optimal conditions to maximize biomass production, reflected in the high desirability of 0.9768 and the prediction of 2.08 g/L of biomass, underscores the effectiveness of the quadratic model employed, highlighting not only its predictive capacity but also its adaptability to variable experimental conditions, which is crucial for scalability in industrial contexts. This approach is validated by studies like that of Mink et al. [65], which demonstrate how advanced models allow for capturing complex interactions between variables, ensuring that optimized conditions are robust and applicable in broader scenarios. Similarly, the model’s ability to integrate different factors and their interaction aligns with the findings of Shalaby et al. [64], who emphasize the importance of multifactorial optimization to achieve high efficiency without compromising process stability, reinforcing the practical applicability of the results obtained in this study.

4.4. Optimal Conditions

Optimizing CO2 flow rate and photoperiod is crucial for maximizing biomass production in microalgal cultures. The findings of this study, which identified an optimal combustion CO2 flow rate of 0.587 L/min and a photoperiod of 12.6 h, reinforce the importance of fine-tuning these variables to achieve high production efficiency. This optimization strategy is consistent with recent research emphasizing the need to calibrate these parameters for maximum yield [66]. For example, ref. [63] reported that a CO2 flow rate in the range of 0.5–0.8 vvm, combined with CO2 concentrations between 2.5% and 20%, optimizes CO2 biofixation and biomass productivity in C. vulgaris. These findings align with the values obtained in this study. The photoperiod has also proven to be a critical variable. Studies such as [67] demonstrated that adjustments to photoperiod and CO2 flow rate significantly increased protein content and biomass production in T. striata, highlighting the importance of precise calibration. Similarly, ref. [68] identified a CO2 flow rate of 0.2 vvm as optimal for maximizing specific biomass productivity in photobioreactors.
These optimal values underscore the need for a careful balance between CO2 flow and photoperiod to prevent issues such as CO2 saturation, which can reduce photosynthetic efficiency and biomass production [63]. Recent studies have also emphasized operational strategies to enhance CO2 utilization efficiency in photobioreactors, improving both carbon capture and biomass productivity [69]. This approach was validated by [70], who demonstrated that adjustments to light intensity and CO2 flow rate significantly boosted biomass productivity in C. vulgaris, supporting the relevance of the optimal conditions identified in this study. Advanced technologies, such as membrane photobioreactors, have also proven effective in enhancing CO2 capture and biomass productivity [67]. For instance, a recent study with C. vulgaris demonstrated that optimizing light intensity, the liquid/gas ratio, and precise CO2 concentration control can significantly increase production [11]. These innovations complement the conditions identified in this work and highlight the necessity of integrated approaches to maximize productivity in microalgal cultures.

4.5. Biomass Production and Biochemical Composition

The results reflect how using combustion gases influences the biomass production and biochemical quality of H. rubescens_UFPS013. The observed biomass reached 2 g/L, exceeding the control group (0.81 g/L) (Figure 3a). This confirms the positive impact of additional CO2 from industrial gases on photosynthesis rates and biomass production. This behavior aligns with previous studies that have demonstrated an increase in microalgal growth rates under conditions enriched with CO2 from industrial gases [71,72]. However, a more detailed analysis reveals that while biomass growth was significant, the increase in lipid accumulation was relatively modest. This could limit its potential in bioenergy applications, such as biofuel production, where maximizing lipid output is crucial [73]. In this context, investigating the application of nutrient stress, such as nitrogen limitation, could be an exciting approach to enhance lipid accumulation, as reported in other microalgae species under stress conditions [74].
The optimization of crucial cultivation parameters supports this result, precisely the flow of combustion gases (0.587 L/min) and photoperiod (12.6 h), which played a significant role in achieving this yield at a temperature of 27 ± 1.2 °C. This production level highlights the viability of H. rubescens_UFPS013 for industrial applications, particularly when compared to other microalgae species. For instance, C. vulgaris achieved a biomass yield of 0.43 g/L at a CO2 concentration of 10% [42]. While S. obliquus produced 2.25 g/L under a higher CO2 concentration of 15% [45], H. rubescens_UFPS013 demonstrated the capacity to thrive even under flue gas, a more challenging environment for many species. The robustness of H. rubescens_UFPS013 in such demanding conditions aligns with previous findings that certain microalgae can maintain high levels of CO2 capture under elevated gas concentrations [41], positioning this strain as a viable option for carbon capture, particularly in industrial settings like coke production plants.
The observed protein content in H. rubescens_UFPS013 under combustion gas conditions underscores its potential for advanced biotechnological applications. Its protein content (48.5.%) achieves the value of other well-studied species such as C. vulgaris (48.5%) and S. vacuolatus (44.6%) [46], highlighting its ability to efficiently synthesize proteins even in adverse environments. This result may be attributed to the biochemical regulation of metabolic pathways associated with the nitrogen cycle, where the increased availability of CO2 and nutrients under cultivation conditions promotes protein synthesis over other metabolites such as lipids [75,76].
Regarding carbohydrate content, H. rubescens UFPS013 reached 29.5%, surpassing S. vacuolatus (20.3%) and approaching Nostoc sp. PCC 9202 (32.2%) [50]. This value can be explained by the influence of environmental conditions on polysaccharide synthesis pathways, as elevated CO2 levels combined with optimized light periods favor carbohydrate accumulation as energy reserves. Additionally, environmental factors such as fluctuating light intensity or osmotic stress can redirect metabolism toward carbohydrate synthesis, providing adaptive advantages in adverse scenarios [77,78]. This highlights the importance of carefully managing environmental variables to maximize carbohydrate accumulation, reinforcing the potential of this strain in bioethanol production.
On the other hand, lipid content in H. rubescens UFPS013 was moderate at 9.6%, lower than the 28% observed in S. vacuolatus [52]. This lower lipid level can be biochemically explained by the prioritization of metabolic pathways toward protein and carbohydrate synthesis under current cultivation conditions. It is well established that nutritional stress, particularly nitrogen limitation, can induce a metabolic shift toward lipid accumulation at the expense of proteins [72,79,80]. Therefore, the current conditions may not generate sufficient stress to promote significant lipid accumulation. However, adjusting variables such as CO2 flow rate, photoperiod, light intensity, or in situ temperature could redirect metabolism toward higher lipid levels, enhancing its applicability in biofuel production [80].
The findings of this study highlight the role of H. rubescens_UFPS013 as a key tool in industrial strategies for CO2 emission mitigation. Its ability to adapt to adverse conditions, such as pollutant-rich combustion gases, underscores its potential for integration into carbon-intensive industrial systems like coke plants and other emitting processes. The implementation of advanced technologies, such as next-generation photobioreactors, could maximize CO2 capture efficiency and biomass conversion, enabling versatile applications in biofuels, biofertilizers, and protein additives. For example, recent studies have shown that optimized closed systems can achieve up to 80% more efficient CO2 capture, improving biomass quality and enhancing the feasibility of sustainable industrial processes [81,82].
While H. rubescens_UFPS013 has demonstrated an interesting capacity to accumulate proteins, carbohydrates, and lipids under severe culture conditions, practical limitations of these systems must be addressed. The observed moderate lipid levels (9.6%) can be explained by the adaptive metabolic response to current cultivation conditions, which favor protein and carbohydrate synthesis due to CO2 and nutrient availability. Additional studies have shown that nitrogen limitation can induce lipid accumulation, increasing its utility for biofuel applications [79,80]. Furthermore, recent research on other strains has highlighted the importance of pretreating combustion gases to reduce pollutants such as NOx and SOx, which can generate oxidative stress affecting biomass productivity [83].
In terms of environmental adaptability, the efficiency of H. rubescens_UFPS013 at a temperature of 27 ± 1.2 °C sets it apart from strains from S. obliquus and C. vulgaris, which reach their highest productivity at 30 °C [42,45]. This adaptability to slightly lower temperatures makes it well-suited for industrial environments, where temperature fluctuations are typical. Liu et al. [40] have also highlighted the importance of maintaining optimal temperatures for maximizing photosynthetic efficiency and biomass production, which is consistent with the results obtained in this study. Finally, from an industrial perspective, integrating H. rubescens_UFPS013 into a circular economy not only effectively mitigates CO2 emissions but also generates high-value products such as bioethanol, bioplastics, and pigments. For instance, studies with other strains have demonstrated that using industrial byproducts can reduce costs and improve energy efficiency by 25%, optimizing the overall profitability of the system [78]. By combining innovative technologies, such as membrane photobioreactors, with scaling protocols focused on stability and cost-effectiveness, H. rubescens_UFPS013 is positioned as an essential component in global sustainability efforts.

5. Conclusions

The results confirm the effectiveness of Halochlorella rubescens UFPS013 as a biotechnological solution for CO2 capture from industrial emissions, specifically in coke plant operations. Under optimal conditions—such as a CO2 flow rate of 0.587 L/min and a photoperiod of 12.6 h—a biomass concentration of 2 g/L was achieved, surpassing both the predicted and the control group’s concentration. Furthermore, the biomass exhibited a protein content of 48.5% and a lipid content of 9.6%, underscoring its potential for applications in biofertilizers, food products, and high-value bioproducts. Its ability to operate under combustion gases containing contaminants such as NOx and SOx highlights its suitability for complex industrial environments where other technologies face limitations.
The industrial-scale implementation of this technology, while promising, requires addressing challenges related to emission variability and operational stability across diverse contexts. Advanced technologies such as hybrid photobioreactors could enhance photosynthetic efficiency and lower operational costs, while tailored protocols could enable more consistent integration into industrial plants. These strategies, combined with future research aimed at maximizing key metabolite production and validating the technology in broader scenarios, would solidify the environmental and economic impact of this biotechnological solution within a sustainable framework.

Author Contributions

Conceptualization, J.B.G.-M., A.F.B.-S., A.Z., and N.A.U.-S.; methodology, R.J.P.-S., J.E.C.-R. and G.L.L.-B.; software, A.F.B.-S. and J.B.G.-M.; validation, N.A.U.-S. and R.J.P.-S.; formal analysis, R.J.P.-S., J.E.C.-R., N.A.U.-S., and J.B.G.-M.; investigation, J.E.C.-R. and R.J.P.-S.; resources, A.F.B.-S., A.Z., and J.B.G.-M.; data curation, N.A.U.-S. and G.L.L.-B.; writing—original draft preparation, A.F.B.-S., J.E.C.-R. and R.J.P.-S.; writing—review and editing, J.B.G.-M. and A.Z.; visualization, A.F.B.-S.; supervision, G.L.L.-B.; project administration, J.B.G.-M.; funding acquisition, A.F.B.-S. and A.Z. All authors have read and agreed to the published version of the manuscript.

Funding

This study received financial support from Sapienza University with its Academic Mid Projects 2021 n. RM12117A8B58023A. Universidad Francisco de Paula Santander (Colombia) (FINU 011-2023), the Ministry of Science and Technology of Colombia, and the Colombian Institute of Educational Credit and Technical Studies Abroad (MINCIENCIAS-ICETEX) under the project titled “FOTOLIX” with ID 2023-0686.

Data Availability Statement

The original contributions presented in this study are included in the article. Further inquiries can be directed to the corresponding authors.

Acknowledgments

We would like to express our sincere gratitude to CI Excomin SAS for allowing experimentation in their coke plant. We also acknowledge Sapienza University of Rome, Universidad Francisco de Paula Santander (Colombia) for providing the equipment for this research. We also thank the Colombian Ministry of Science, Technology, and Innovation MINCIENCIAS for supporting national Ph.D. doctorates through the Francisco José de Caldas scholarship program.

Conflicts of Interest

The authors declare no conflicts of interest.

References

  1. Shindell, D.; Smith, C.J. Climate and Air-Quality Benefits of a Realistic Phase-out of Fossil Fuels. Nature 2019, 573, 408–411. [Google Scholar] [CrossRef] [PubMed]
  2. Pendrill, F.; Persson, U.M.; Godar, J.; Kastner, T.; Moran, D.; Schmidt, S.; Wood, R. Agricultural and Forestry Trade Drives Large Share of Tropical Deforestation Emissions. Glob. Environ. Change 2019, 56, 1–10. [Google Scholar] [CrossRef]
  3. Verma, P.; Kumar Ghosh, P. REDD+ Strategy for Forest Carbon Sequestration in India. Holist. Approach Environ. 2022, 12, 117–130. [Google Scholar] [CrossRef]
  4. Gizer, S.G.; Polat, O.; Ram, M.K.; Sahiner, N. Recent Developments in CO2 Capture, Utilization, Related Materials, and Challenges. Int. J. Energy Res. 2022, 46, 16241–16263. [Google Scholar] [CrossRef]
  5. Regufe, M.J.; Pereira, A.; Ferreira, A.F.P.; Ribeiro, A.M.; Rodrigues, A.E. Current Developments of Carbon Capture Storage and/or Utilization–Looking for Net-Zero Emissions Defined in the Paris Agreement. Energies 2021, 14, 2406. [Google Scholar] [CrossRef]
  6. Seo, H.; Rahimi, M.; Hatton, T.A. Electrochemical Carbon Dioxide Capture and Release with a Redox-Active Amine. J. Am. Chem. Soc. 2022, 144, 2164–2170. [Google Scholar] [CrossRef]
  7. Sgouridis, S.; Carbajales-Dale, M.; Csala, D.; Chiesa, M.; Bardi, U. Comparative Net Energy Analysis of Renewable Electricity and Carbon Capture and Storage. Nat. Energy 2019, 4, 456–465. [Google Scholar] [CrossRef]
  8. Zhang, X.; Yuan, H.; Guan, L.; Wang, X.; Wang, Y.; Jiang, Z.; Cao, L.; Zhang, X. Influence of Photoperiods on Microalgae Biofilm: Photosynthetic Performance, Biomass Yield, and Cellular Composition. Energies 2019, 12, 3724. [Google Scholar] [CrossRef]
  9. Rangel-Basto, Y.A.; García-Ochoa, I.E.; Suarez-Gelvez, J.H.; Zuorro, A.; Barajas-Solano, A.F.; Urbina-Suarez, N.A. The Effect of Temperature and Enzyme Concentration in the Transesterification Process of Synthetic Microalgae Oil. Chem. Eng. Trans. 2018, 64, 331–336. [Google Scholar] [CrossRef]
  10. Ji, M.-K.; Abou-Shanab, R.A.I.; Kim, S.-H.; Salama, E.-S.; Lee, S.-H.; Kabra, A.N.; Lee, Y.-S.; Hong, S.; Jeon, B.-H. Cultivation of Microalgae Species in Tertiary Municipal Wastewater Supplemented with CO2 for Nutrient Removal and Biomass Production. Ecol. Eng. 2013, 58, 142–148. [Google Scholar] [CrossRef]
  11. Senatore, V.; Buonerba, A.; Zarra, T.; Oliva, G.; Belgiorno, V.; Boguniewicz-Zablocka, J.; Naddeo, V. Innovative Membrane Photobioreactor for Sustainable CO2 Capture and Utilization. Chemosphere 2021, 273, 129682. [Google Scholar] [CrossRef] [PubMed]
  12. Cheng, J.; Huang, Y.; Feng, J.; Sun, J.; Zhou, J.; Cen, K. Mutate Chlorella sp. by Nuclear Irradiation to Fix High Concentrations of CO2. Bioresour. Technol. 2013, 136, 496–501. [Google Scholar] [CrossRef]
  13. Schultze, L.K.P.; Simon, M.-V.; Li, T.; Langenbach, D.; Podola, B.; Melkonian, M. High Light and Carbon Dioxide Optimize Surface Productivity in a Twin-Layer Biofilm Photobioreactor. Algal Res. 2015, 8, 37–44. [Google Scholar] [CrossRef]
  14. Tan, K.M.; Kassim, M.A. Growth, Carbohydrate Productivity And Growth Kinetic Study of Halochlorella Rubescens Cultivated Under CO2-Rich Conditions. Malays. Appl. Biol. 2020, 49, 1–11. [Google Scholar] [CrossRef]
  15. Razzak, S.A.; Ali, S.A.M.; Hossain, M.M.; Mouanda, A.N. Biological CO2 Fixation Using Chlorella Vulgaris and Its Thermal Characteristics through Thermogravimetric Analysis. Bioprocess. Biosyst. Eng. 2016, 39, 1651–1658. [Google Scholar] [CrossRef]
  16. Kuo, C.-M.; Jian, J.-F.; Lin, T.-H.; Chang, Y.-B.; Wan, X.-H.; Lai, J.-T.; Chang, J.-S.; Lin, C.-S. Simultaneous Microalgal Biomass Production and CO2 Fixation by Cultivating Chlorella sp. GD with Aquaculture Wastewater and Boiler Flue Gas. Bioresour. Technol. 2016, 221, 241–250. [Google Scholar] [CrossRef] [PubMed]
  17. Shakoor, A.; Ashraf, F.; Shakoor, S.; Mustafa, A.; Rehman, A.; Altaf, M.M. Biogeochemical Transformation of Greenhouse Gas Emissions from Terrestrial to Atmospheric Environment and Potential Feedback to Climate Forcing. Environ. Sci. Pollut. Res. 2020, 27, 38513–38536. [Google Scholar] [CrossRef]
  18. Borella, L.; Sforza, E.; Bertucco, A. Effect of Residence Time in Continuous Photobioreactor on Mass and Energy Balance of Microalgal Protein Production. New Biotechnol. 2021, 64, 46–53. [Google Scholar] [CrossRef]
  19. Sterman, J.; Moomaw, W.; Rooney-Varga, J.N.; Siegel, L. Does Wood Bioenergy Help or Harm the Climate? Bull. At. Sci. 2022, 78, 128–138. [Google Scholar] [CrossRef]
  20. García-Martínez, J.B.; Ayala-Torres, E.; Reyes-Gómez, O.; Zuorro, A.; Andrés, F.; Barajas-Solano, B.; Crisóstomo, C.; Barajas-Ferreira, B. Evaluation of a Two-Phase Extraction System of Carbohydrates and Proteins from Chlorella Vulgaris Utex 1803. Chem. Eng. Trans. 2016, 49, 355–360. [Google Scholar] [CrossRef]
  21. Choi, H.I.; Hwang, S.-W.; Sim, S.J. Comprehensive Approach to Improving Life-Cycle CO2 Reduction Efficiency of Microalgal Biorefineries: A Review. Bioresour. Technol. 2019, 291, 121879. [Google Scholar] [CrossRef]
  22. Barajas-Solano, A.F.; Gonzalez-Delgado, A.D.; Kafarov, V. Effect of Thermal Pre-Treatment on Fermentable Sugar Production of Chlorella Vulgaris. Chem. Eng. Trans. 2014, 37, 655–660. [Google Scholar] [CrossRef]
  23. Khan, M.I.; Shin, J.H.; Kim, J.D. The Promising Future of Microalgae: Current Status, Challenges, and Optimization of a Sustainable and Renewable Industry for Biofuels, Feed, and Other Products. Microb. Cell Fact. 2018, 17, 36. [Google Scholar] [CrossRef] [PubMed]
  24. Urbina-Suarez, N.A.; Ayala-González, D.D.; Rivera-Amaya, J.D.; Barajas-Solano, A.F.; Machuca-Martínez, F. Evaluation of the Light/Dark Cycle and Concentration of Tannery Wastewater in the Production of Biomass and Metabolites of Industrial Interest from Microalgae and Cyanobacteria. Water 2022, 14, 346. [Google Scholar] [CrossRef]
  25. Vuppaladadiyam, A.K.; Yao, J.G.; Florin, N.; George, A.; Wang, X.; Labeeuw, L.; Jiang, Y.; Davis, R.W.; Abbas, A.; Ralph, P.; et al. Impact of Flue Gas Compounds on Microalgae and Mechanisms for Carbon Assimilation and Utilization. ChemSusChem 2018, 11, 334–355. [Google Scholar] [CrossRef]
  26. Alami, A.H.; Alasad, S.; Ali, M.; Alshamsi, M. Investigating Algae for CO2 Capture and Accumulation and Simultaneous Production of Biomass for Biodiesel Production. Sci. Total Environ. 2021, 759, 143529. [Google Scholar] [CrossRef]
  27. Wang, H.; Nche-Fambo, F.A.; Yu, Z.; Chen, F. Using Microalgal Communities for High CO2-Tolerant Strain Selection. Algal Res. 2018, 35, 253–261. [Google Scholar] [CrossRef]
  28. Suresh, A.; Benor, S. Microalgae-Based Biomass Production for Control of Air Pollutants. In From Biofiltration to Promising Options in Gaseous Fluxes Biotreatment; Elsevier: Amsterdam, The Netherlands, 2020; pp. 345–372. [Google Scholar]
  29. Ma, S.; Li, D.; Yu, Y.; Li, D.; Yadav, R.S.; Feng, Y. Application of a Microalga, Scenedesmus obliquus PF3, for the Biological Removal of Nitric Oxide (NO) and Carbon Dioxide. Environ. Pollut. 2019, 252, 344–351. [Google Scholar] [CrossRef]
  30. Cheng, D.; Li, X.; Yuan, Y.; Yang, C.; Tang, T.; Zhao, Q.; Sun, Y. Adaptive Evolution and Carbon Dioxide Fixation of Chlorella sp. in Simulated Flue Gas. Sci. Total Environ. 2019, 650, 2931–2938. [Google Scholar] [CrossRef]
  31. Kassim, M.A.; Ramli, S.H.; Meng, T.K. Analysis of Microalgal Growth Kinetic Model and Carbohydrate Biosynthesis Cultivated Using Agro-Industrial Waste Residuals as Carbon Source. Prep. Biochem. Biotechnol. 2022, 52, 514–524. [Google Scholar] [CrossRef]
  32. Talib, R.M.; Dharma, A.; Syafrizayanti, K.F. The Impact of Gas from Coal Combustion toward the Degree of Acidity (pH), Biomass Productivity, and Chlorophyll A and B Content of Chlorella Emersonii. Int. J. Curr. Microbiol. Appl. Sci. 2022, 11, 120–127. [Google Scholar] [CrossRef]
  33. Kumar, P.K.; Krishna, S.V.; Verma, K.; Pooja, K.; Bhagawan, D.; Himabindu, V. Phycoremediation of Sewage Wastewater and Industrial Flue Gases for Biomass Generation from Microalgae. S. Afr. J. Chem. Eng. 2018, 25, 133–146. [Google Scholar] [CrossRef]
  34. Cheng, J.; Zhu, Y.; Zhang, Z.; Yang, W. Modification and Improvement of Microalgae Strains for Strengthening CO2 Fixation from Coal-Fired Flue Gas in Power Plants. Bioresour. Technol. 2019, 291, 121850. [Google Scholar] [CrossRef]
  35. Andersen, R.; Berges, J.; Harrison, P.; Watanabe, M. Recipes for Freshwater and Seawater Media. In Algal Culture Techniques; Academic Press: London, UK, 2005. [Google Scholar]
  36. Al-Mallahi, J.; Ishii, K.; Sato, M.; Ochiai, S. Static Supply of Different Simulated Flue Gases for Native Microalgae Cultivation in Diluted Cow Manure Digestate. J. Environ. Manag. 2023, 335, 117557. [Google Scholar] [CrossRef] [PubMed]
  37. Moheimani, N.R.; Borowitzka, M.A.; Isdepsky, A.; Sing, S.F. Standard Methods for Measuring Growth of Algae and Their Composition. In Algae for Biofuels and Energy; Springer: Dordrecht, The Netherlands, 2013; pp. 265–284. ISBN 978-94-007-5479-9. [Google Scholar]
  38. Slocombe, S.P.; Ross, M.; Thomas, N.; McNeill, S.; Stanley, M.S. A Rapid and General Method for Measurement of Protein in Micro-Algal Biomass. Bioresour. Technol. 2013, 129, 51–57. [Google Scholar] [CrossRef] [PubMed]
  39. Mishra, S.K.; Suh, W.I.; Farooq, W.; Moon, M.; Shrivastav, A.; Park, M.S.; Yang, J.W. Rapid Quantification of Microalgal Lipids in Aqueous Medium by a Simple Colorimetric Method. Bioresour. Technol. 2014, 155, 330–333. [Google Scholar] [CrossRef]
  40. Liu, X.; Chen, G.; Tao, Y.; Wang, J. Application of Effluent from WWTP in Cultivation of Four Microalgae for Nutrients Removal and Lipid Production under the Supply of CO2. Renew. Energy 2020, 149, 708–715. [Google Scholar] [CrossRef]
  41. Aghaalipour, E.; Akbulut, A.; Güllü, G. Carbon Dioxide Capture with Microalgae Species in Continuous Gas-Supplied Closed Cultivation Systems. Biochem. Eng. J. 2020, 163, 107741. [Google Scholar] [CrossRef]
  42. Kong, W.; Kong, J.; Ma, J.; Lyu, H.; Feng, S.; Wang, Z.; Yuan, P.; Shen, B. Chlorella Vulgaris Cultivation in Simulated Wastewater for the Biomass Production, Nutrients Removal and CO2 Fixation Simultaneously. J. Environ. Manag. 2021, 284, 112070. [Google Scholar] [CrossRef]
  43. Hariz, H.B.; Takriff, M.S.; Mohd Yasin, N.H.; Ba-Abbad, M.M.; Mohd Hakimi, N.I.N. Potential of the Microalgae-Based Integrated Wastewater Treatment and CO2 Fixation System to Treat Palm Oil Mill Effluent (POME) by Indigenous Microalgae; Scenedesmus sp. and Chlorella sp. J. Water Process Eng. 2019, 32, 100907. [Google Scholar] [CrossRef]
  44. Rodas-Zuluaga, L.I.; Castañeda-Hernández, L.; Castillo-Vacas, E.I.; Gradiz-Menjivar, A.; López-Pacheco, I.Y.; Castillo-Zacarías, C.; Boully, L.; Iqbal, H.M.N.; Parra-Saldívar, R. Bio-Capture and Influence of CO2 on the Growth Rate and Biomass Composition of the Microalgae Botryococcus braunii and Scenedesmus sp. J. CO2 Util. 2021, 43, 101371. [Google Scholar] [CrossRef]
  45. Ramos-Ibarra, J.R.; Snell-Castro, R.; Neria-Casillas, J.A.; Choix, F.J. Biotechnological Potential of Chlorella sp. and Scenedesmus sp. Microalgae to Endure High CO2 and Methane Concentrations from Biogas. Bioprocess. Biosyst. Eng. 2019, 42, 1603–1610. [Google Scholar] [CrossRef]
  46. Bhola, V.; Swalaha, F.M.; Nasr, M.; Bux, F. Fuzzy Intelligence for Investigating the Correlation between Growth Performance and Metabolic Yields of a Chlorella sp. Exposed to Various Flue Gas Schemes. Bioresour. Technol. 2017, 243, 1078–1086. [Google Scholar] [CrossRef]
  47. Hussain, J.; Wang, X.; Sousa, L.; Ali, R.; Rittmann, B.E.; Liao, W. Using Non-Metric Multi-Dimensional Scaling Analysis and Multi-Objective Optimization to Evaluate Green Algae for Production of Proteins, Carbohydrates, Lipids, and Simultaneously Fix Carbon Dioxide. Biomass Bioenergy 2020, 141, 105711. [Google Scholar] [CrossRef]
  48. Quintero-Dallos, V.; García-Martínez, J.B.; Contreras-Ropero, J.E.; Barajas-Solano, A.F.; Barajas-Ferrerira, C.; Lavecchia, R.; Zuorro, A. Vinasse as a Sustainable Medium for the Production of Chlorella Vulgaris UTEX 1803. Water 2019, 11, 1526. [Google Scholar] [CrossRef]
  49. Ghosh, A.; Khanra, S.; Mondal, M.; Devi, T.I.; Halder, G.; Tiwari, O.N.; Bhowmick, T.K.; Gayen, K. Biochemical Characterization of Microalgae Collected from North East Region of India Advancing towards the Algae-based Commercial Production. Asia-Pac. J. Chem. Eng. 2017, 12, 745–754. [Google Scholar] [CrossRef]
  50. Vishwakarma, R.; Dhar, D.W.; Jena, M.; Shukla, M. Biochemical Parameters and 18S RRNA Gene Sequence Analysis amongst Green Microalgal Strains from Selected Aquatic Sites of Eastern India. Water Sci. Technol. 2020, 82, 1205–1216. [Google Scholar] [CrossRef] [PubMed]
  51. Nordin, N.; Yusof, N.; Samsudin, S. Biomass Production of Chlorella sp., Scenedesmus sp., and Oscillatoria sp. in Nitrified Landfill Leachate. Waste Biomass Valorization 2017, 8, 2301–2311. [Google Scholar] [CrossRef]
  52. Gumbi, S.T.; Mutanda, T.; Olaniran, A.O. Nutrient Removal from Dairy and Poultry Wastewater with Simultaneous Biomass and Biodiesel Production by Chlorella sp. T4 Isolated from a Freshwater Stream in South Africa. Waste Biomass Valorization 2021, 12, 6931–6943. [Google Scholar] [CrossRef]
  53. Heffernan, J.K.; Valgepea, K.; de Souza Pinto Lemgruber, R.; Casini, I.; Plan, M.; Tappel, R.; Simpson, S.D.; Köpke, M.; Nielsen, L.K.; Marcellin, E. Enhancing CO2-Valorization Using Clostridium Autoethanogenum for Sustainable Fuel and Chemicals Production. Front. Bioeng. Biotechnol. 2020, 8, 204. [Google Scholar] [CrossRef]
  54. Deprá, M.C.; Dias, R.R.; Severo, I.A.; de Menezes, C.R.; Zepka, L.Q.; Jacob-Lopes, E. Carbon Dioxide Capture and Use in Photobioreactors: The Role of the Carbon Dioxide Loads in the Carbon Footprint. Bioresour. Technol. 2020, 314, 123745. [Google Scholar] [CrossRef] [PubMed]
  55. Ghosh, A.; Samadhiya, K.; Kiran, B. Multi-Objective Tailored Optimization Deciphering Carbon Partitioning and Metabolomic Tuning in Response to Elevated CO2 Levels, Organic Carbon and Sparging Period. Environ. Res. 2022, 204, 112137. [Google Scholar] [CrossRef]
  56. Madhubalaji, C.K.; Chandra, T.S.; Chauhan, V.S.; Sarada, R.; Mudliar, S.N. Chlorella Vulgaris Cultivation in Airlift Photobioreactor with Transparent Draft Tube: Effect of Hydrodynamics, Light and Carbon Dioxide on Biochemical Profile Particularly ω-6/ω-3 Fatty Acid Ratio. J. Food Sci. Technol. 2020, 57, 866–876. [Google Scholar] [CrossRef] [PubMed]
  57. Ziganshina, E.E.; Bulynina, S.S.; Yureva, K.A.; Ziganshin, A.M. Optimization of Photoautotrophic Growth Regimens of Scenedesmaceae Alga: The Influence of Light Conditions and Carbon Dioxide Concentrations. Appl. Sci. 2023, 13, 12753. [Google Scholar] [CrossRef]
  58. Wang, B.; Xiong, W.; Yu, J.; Maness, P.-C.; Meldrum, D.R. Unlocking the Photobiological Conversion of CO2 to (R)-3-Hydroxybutyrate in Cyanobacteria. Green. Chem. 2018, 20, 3772–3782. [Google Scholar] [CrossRef]
  59. Gao, E.-B.; Wu, J.; Ye, P.; Qiu, H.; Chen, H.; Fang, Z. Rewiring Carbon Flow in Synechocystis PCC 6803 for a High Rate of CO2-to-Ethanol under an Atmospheric Environment. Front. Microbiol. 2023, 14, 1211004. [Google Scholar] [CrossRef]
  60. Choi, J.; Ko, J.; Ng, C.T.; Jeong, S.; Tenhunen, J.; Xue, W.; Cho, J. Quantification of CO2 Fluxes in Paddy Rice Based on the Characterization and Simulation of CO2 Assimilation Approaches. Agric. Meteorol. 2018, 249, 348–366. [Google Scholar] [CrossRef]
  61. Huang, Y.; Rorrer, G.L. Optimal Temperature and Photoperiod for the Cultivation of Agardhiella subulata Microplantlets in a Bubble-Column Photobioreactor. Biotechnol. Bioeng. 2002, 79, 135–144. [Google Scholar] [CrossRef]
  62. Mohammadi, A.; Abedini, H. Experimental Study and Numerical Modeling of CO2 Bio-Fixation in a Continues Photobioreactor. J. Chem. Pet. Eng. 2020, 54, 47–55. [Google Scholar] [CrossRef]
  63. Almomani, F. Kinetic Modeling of Microalgae Growth and CO2 Bio-Fixation Using Central Composite Design Statistical Approach. Sci. Total Environ. 2020, 720, 137594. [Google Scholar] [CrossRef]
  64. Shalaby, A.; Elkamel, A.; Douglas, P.L.; Zhu, Q.; Zheng, Q.P. A Machine Learning Approach for Modeling and Optimization of a CO2 Post-Combustion Capture Unit. Energy 2021, 215, 119113. [Google Scholar] [CrossRef]
  65. Mink, A.; Schediwy, K.; Posten, C.; Nirschl, H.; Simonis, S.; Krause, M.J. Comprehensive Computational Model for Coupled Fluid Flow, Mass Transfer, and Light Supply in Tubular Photobioreactors Equipped with Glass Sponges. Energies 2022, 15, 7671. [Google Scholar] [CrossRef]
  66. Molitor, H.R.; Schnoor, J.L. Using Simulated Flue Gas to Rapidly Grow Nutritious Microalgae with Enhanced Settleability. ACS Omega 2020, 5, 27269–27277. [Google Scholar] [CrossRef]
  67. Patrinou, V.; Daskalaki, A.; Kampantais, D.; Kanakis, D.C.; Economou, C.N.; Bokas, D.; Kotzamanis, Y.; Aggelis, G.; Vayenas, D.V.; Tekerlekopoulou, A.G. Optimization of Cultivation Conditions for Tetraselmis Striata and Biomass Quality Evaluation for Fish Feed Production. Water 2022, 14, 3162. [Google Scholar] [CrossRef]
  68. Gabrielyan, D.A.; Gabel, B.V.; Sinetova, M.A.; Gabrielian, A.K.; Markelova, A.G.; Shcherbakova, N.V.; Los, D.A. Optimization of CO2 Supply for the Intensive Cultivation of Chlorella sorokiniana IPPAS C-1 in the Laboratory and Pilot-Scale Flat-Panel Photobioreactors. Life 2022, 12, 1469. [Google Scholar] [CrossRef] [PubMed]
  69. Dey, S.; Bhattacharya, A.; Kumar, P.; Malik, A. High-Rate CO2 sequestration Using a Novel Venturi Integrated Photobioreactor and Subsequent Valorization to Microalgal Lipids. Green. Chem. 2020, 22, 7962–7973. [Google Scholar] [CrossRef]
  70. Metsoviti, M.N.; Papapolymerou, G.; Karapanagiotidis, I.T.; Katsoulas, N. Effect of Light Intensity and Quality on Growth Rate and Composition of Chlorella vulgaris. Plants 2019, 9, 31. [Google Scholar] [CrossRef]
  71. Yadav, G.; Dubey, B.K.; Sen, R. A Comparative Life Cycle Assessment of Microalgae Production by CO2 Sequestration from Flue Gas in Outdoor Raceway Ponds under Batch and Semi-Continuous Regime. J. Clean. Prod. 2020, 258, 120703. [Google Scholar] [CrossRef]
  72. Aslam, A.; Thomas-Hall, S.R.; Mughal, T.; Zaman, Q.; Ehsan, N.; Javied, S.; Schenk, P.M. Heavy Metal Bioremediation of Coal-Fired Flue Gas Using Microalgae under Different CO2 Concentrations. J. Environ. Manag. 2019, 241, 243–250. [Google Scholar] [CrossRef]
  73. Lage, S.; Toffolo, A.; Gentili, F.G. Microalgal Growth, Nitrogen Uptake and Storage, and Dissolved Oxygen Production in a Polyculture Based-Open Pond Fed with Municipal Wastewater in Northern Sweden. Chemosphere 2021, 276, 130122. [Google Scholar] [CrossRef]
  74. Almomani, F.; Ketife, A.A.; Judd, S.; Shurair, M.; Bhosale, R.R.; Znad, H.; Tawalbeh, M. Impact of CO2 Concentration and Ambient Conditions on Microalgal Growth and Nutrient Removal from Wastewater by a Photobioreactor. Sci. Total Environ. 2019, 662, 662–671. [Google Scholar] [CrossRef]
  75. Siddiki, S.Y.A.; Mofijur, M.; Kumar, P.S.; Ahmed, S.F.; Inayat, A.; Kusumo, F.; Badruddin, I.A.; Khan, T.M.Y.; Nghiem, L.D.; Ong, H.C.; et al. Microalgae Biomass as a Sustainable Source for Biofuel, Biochemical and Biobased Value-Added Products: An Integrated Biorefinery Concept. Fuel 2022, 307, 121782. [Google Scholar] [CrossRef]
  76. Li, G.; Xiao, W.; Yang, T.; Lyu, T. Optimization and Process Effect for Microalgae Carbon Dioxide Fixation Technology Applications Based on Carbon Capture: A Comprehensive Review. C 2023, 9, 35. [Google Scholar] [CrossRef]
  77. Rinanti, A.; Purwadi, R. Increasing Carbohydrate and Lipid Productivity in Tropical Microalgae Biomass as a Sustainable Biofuel Feed Stock. Energy Procedia 2019, 158, 1215–1222. [Google Scholar] [CrossRef]
  78. de Morais, M.G.; de Morais, E.G.; Duarte, J.H.; Deamici, K.M.; Mitchell, B.G.; Costa, J.A.V. Biological CO2 Mitigation by Microalgae: Technological Trends, Future Prospects and Challenges. World J. Microbiol. Biotechnol. 2019, 35, 78. [Google Scholar] [CrossRef]
  79. Klin, M.; Pniewski, F.; Latała, A. Growth Phase-Dependent Biochemical Composition of Green Microalgae: Theoretical Considerations for Biogas Production. Bioresour. Technol. 2020, 303, 122875. [Google Scholar] [CrossRef] [PubMed]
  80. Mandik, Y.I.; Cheirsilp, B.; Srinuanpan, S.; Maneechote, W.; Boonsawang, P.; Prasertsan, P.; Sirisansaneeyakul, S. Zero-Waste Biorefinery of Oleaginous Microalgae as Promising Sources of Biofuels and Biochemicals through Direct Transesterification and Acid Hydrolysis. Process Biochem. 2020, 95, 214–222. [Google Scholar] [CrossRef]
  81. Comley, J.G.; Scott, J.A.; Laamanen, C.A. Utilizing CO2 in Industrial Off-Gas for Microalgae Cultivation: Considerations and Solutions. Crit. Rev. Biotechnol. 2024, 44, 910–923. [Google Scholar] [CrossRef]
  82. Mehar, J.; Shekh, A.; Malchira, N.U.; Mudliar, S. Potential of Microalgae for Integrated Biomass Production Utilizing CO2 and Food Industry Wastewater. In Application of Microalgae in Wastewater Treatment; Springer International Publishing: Cham, Switzerland, 2019; pp. 41–67. [Google Scholar]
  83. Chen, Y.; Xu, C. How to Narrow the CO2 Gap from Growth-Optimal to Flue Gas Levels by Using Microalgae for Carbon Capture and Sustainable Biomass Production. J. Clean. Prod. 2021, 280, 124448. [Google Scholar] [CrossRef]
Figure 1. Response surface plots illustrate (A) the desirability function for maximizing biomass production and (B) biomass production as a function of CO2 flow rate and photoperiod.
Processes 13 02121 g001
Figure 2. Experimental set-up using real coke flue gas.
Processes 13 02121 g002
Figure 3. Biomass production using flue gas under environmental conditions. Exepcted vs Observed biomass produced under optimized conditions (a), Biomass growth curve over 20 days (b), change in biomass composition over 20 days (c), composition of biomass produced using flue gas under environmental conditions in terms of carbohydrates, proteins, lipids and Total Organic Carbon (d). “ns” means no statistical significance. “****” means statistical significance between samples.
Processes 13 02121 g003aProcesses 13 02121 g003b
Table 1. Experimental design variables for photoperiod and CO2 concentration.
FactorNameUnitsType Levels
−α−10+1
APhotoperiodh Numeric
(Continuous)
2.1712.51822.9
BFlue gasL/min00.10.5511.4
Table 2. ANOVA analysis and adjusted statistics for biomass under light intensity and CO2 flow rate.
SourceSum of SquaresdfMean SquareF-Valuep-Value
Block0.004310.0043
Model8.4751.69196.68<0.0001 *
A-Photoperiod0.155910.155918.100.0038 *
B-Flue gas0.128710.128714.950.0062 *
AB0.003610.00360.41810.5385 **
A24.4314.43513.94<0.0001 *
B24.3814.38509.04<0.0001 *
Residual0.060370.0086
Lack of Fit0.010630.00350.28380.8356 **
Pure Error0.049740.0124
Cor Total8.5313
R20.9929Adeq
Precision
27.1428C.V.%7.80
Adjusted R20.9879Std. Dev.0.0928
Predicted R20.9768Mean1.19
* Significant, ** not significant.
Table 3. Optimized conditions for maximum biomass production and model desirability.
CodeVariableUnitValue
AFlue gasL/min0.587
BPhotoperiodh12.6
Z1Biomassg/L2.08
Table 4. Impact of CO2 concentration and temperature on biomass production in various microalgae species.
Algal StrainCO2 (% v/v)Temperature (°C)Biomass (g/L)Reference
Chlorella sp.5270.36[40]
25401.2[30]
10302.12[41]
C. vulgaris10270.43[42]
Dunaliella sp.3270.17[43]
Scenedesmus sp.20301.95[44]
S. obliquus15302.25[45]
H. rubescens_UFPS0134.227 ± 1.22.0This work
Table 5. Biomass production and biochemical composition of various microalgal strains.
StrainBiomassProteinsCarbohydratesLipidsReference
(g/L)(% w/w)
Chlorella sp.2.648.523.817.7[46]
C. vulgaris6.653.022.021.9[47]
C. vulgaris UTEX 18035.649.123.015.3[48]
Chloroccocum sp.2.947.219.720.2[49]
Nostoc sp. PCC 92023.142.432.28.1[50]
N. punctiforme345.829.913.6[51]
S. vacuolatus8.344.620.328[52]
H. rubescens_UFPS013248.529.69.6This work
Disclaimer/Publisher’s Note: The statements, opinions and data contained in all publications are solely those of the individual author(s) and contributor(s) and not of MDPI and/or the editor(s). MDPI and/or the editor(s) disclaim responsibility for any injury to people or property resulting from any ideas, methods, instructions or products referred to in the content.

