Article

Ni Supported on Pr-Doped Ceria as Catalysts for Dry Reforming of Methane

by
Antonella R. Ponseggi
1,
Amanda de C. P. Guimarães
1,2,
Renata O. da Fonseca
3,
Raimundo C. Rabelo-Neto
3,
Yutao Xing
1,
Andressa A. A. Silva
1,
Fábio B. Noronha
3 and
Lisiane V. Mattos
1,*
1
Chemical Engineering Department, Federal Fluminense University, Rua Passo da Pátria, 156, Niterói 24210-240, Brazil
2
Graduate Program in Chemical Engineering, Rio de Janeiro State University, Rua São Francisco Xavier, 524, Rio de Janeiro 20550-900, Brazil
3
Division of Catalysis, Biocatalysis and Chemical Processes, National Institute of Technology, Av. Venezuela, 82, Rio de Janeiro 20081-312, Brazil
*
Author to whom correspondence should be addressed.
Processes 2025, 13(7), 2119; https://doi.org/10.3390/pr13072119
Submission received: 27 May 2025 / Revised: 24 June 2025 / Accepted: 1 July 2025 / Published: 3 July 2025
(This article belongs to the Special Issue Advances in Synthesis and Applications of Supported Nanocatalysts)

Abstract

The use of CH4 and CO2 as fuels in direct internal reforming solid oxide fuel cells (DIR-SOFCs) is a promising strategy for efficient power generation with reduced greenhouse gas emissions. In this study, Ni catalysts supported on Ce–Pr mixed oxides with varying Pr contents (0–80 mol%) were synthesized, calcined at 1200 °C, and tested for dry reforming of methane (DRM), aiming at their application as catalytic layers in SOFC anodes. Physicochemical characterization (XRD, TPR, TEM) showed that increasing Pr loading enhances catalyst reducibility and promotes the formation of the Pr2NiO4 phase, which contributes to the generation of smaller Ni0 particles after reduction. Catalytic tests revealed that all samples exhibited low-carbon deposition, attributed to the large Ni crystallites. The catalyst with 80 mol% Pr showed the best performance, achieving the highest CH4 conversion (72%), a H2/CO molar ratio of 0.89, and improved stability. These findings suggest that Ni/Ce0.2Pr0.8 could be a promising candidate for use as a catalyst layer of anodes in DIR-SOFC anodes. Although electrochemical data are not yet available, future work will evaluate the catalyst’s performance and durability under SOFC-relevant conditions.

1. Introduction

Energy demand is rising due to population growth and increasing industrial activity. However, the extensive use of these fuels has led to higher emissions of greenhouse gases, such as carbon dioxide (CO2) and methane (CH4), which are major contributors to global warming [1]. Among the strategies for cleaner energy production, direct internal reforming solid oxide fuel cells (DIR-SOFCs) offer an attractive solution by enabling the conversion of CH4 and CO2 mixtures into electrical energy within the cell itself, thus avoiding the release of these gases into the atmosphere while achieving high conversion and system integration simplicity [2].
In DIR-SOFCs, CH4 and CO2 are directly fed into the anode compartment, where dry reforming of methane (DRM) occurs, promoted by the catalytic properties of the anode material, generating syngas (H2 and CO), which is subsequently electrochemically oxidized. This configuration eliminates the need for external reformers and allows for the use of biogas, composed mainly of CH4 and CO2, as a sustainable fuel [2,3,4,5,6,7,8,9,10,11,12].
Ni-YSZ cermet is the most used anode material in SOFCs due to its combined electronic/ionic conductivity and mechanical stability at high temperatures [13]. Nevertheless, the high Ni content required for percolation promotes carbon formation from CH4, leading to deactivation and irreversible damage to the anode [14,15].
To mitigate this issue, recent research has focused on the incorporation of catalytic layers based on Ni supported on cerium-based oxides. Ceria offers high oxygen storage capacity and redox activity, enabling the removal of surface carbon through oxygen transfer near metal sites [16,17]. Doping ceria with cations, such as Gd3+, Y3+, Pr3+, and Zr4+, enhances its oxygen mobility and conductivity [7,18,19,20,21], improving catalyst performance for DRM. These materials are promising as catalytic layers that promote reforming reactions while protecting the electrochemical anode (e.g., Ni/YSZ).
Some authors have proposed the use of Ni–Ce0.9Gd0.1O2–δ (GDC) and perovskite-type SrTiO3-based materials containing La, Ce, and Ni (LSCNT) as catalytic layers for the anodes of biogas-fueled DIR-SOFCs [22,23]. However, significant carbon deposition was observed on the GDC catalytic layer. While LSCNT demonstrated high stability during catalytic tests, its CH4 and CO2 conversion rates (~40%) were lower than those of other catalysts commonly used in methane reforming reactions [23].
Considering the aforementioned studies, it is evident that it is still necessary to develop catalyst layers for anodes of DIR-SOFCs fueled by CH4 and CO2 mixtures that exhibit high activity and strong resistance to carbon formation.
Da Fonseca et al. [24] studied the behavior of Ni supported on ceria containing Zr, Pr and Nb (Me/Ce molar ratio of 1/9; Me = Zr, Pr or Nb) as anodes for SOFC fed by fuels containing methane and CO2. The catalysts containing 14 vol% of Ni were obtained using a hydrothermal method described in the literature [25] to prepare Ni-based anodes with greater resistance to carbon deposition. The Ni/CeZr, Ni/CePr and Ni/CeNb catalysts were calcined at 800 °C. Catalytic test results in a fixed-bed reactor (with a CH4/CO2 ratio of 1) showed that the Ni/CePr catalyst achieved high methane conversion and minimal carbon formation. The reduced carbon deposition was attributed to the CePr support’s enhanced oxygen mobility, which facilitates carbon removal.
Vasiliades et al. [26] studied the performance of Ni (5 wt.%) supported on Ce1–xPrxO2–δ (x = 0.0–0.8) as catalysts for DRM at different reaction temperatures. They observed that the Ni/Ce1–xPrxO2–δ was an active and very promising coke-resistant material for DRM in the 700–750 °C range. According to these authors, the Pr-dopant concentration is very important as it influences the mobility and concentration of lattice oxygen near the Ni-support interface, resulting in the production of gaseous CO. Additionally, the concentration of surface oxygen vacancies is affected by the Pr-dopant, which play a major role in the dissociation of CO2 into CO(g) and atomic oxygen, aiding in the re-oxidation of the reduced support.
It is worth noting that the DRM catalysts studied by Vasiliades et al. [26] and da Fonseca et al. [24] were calcined at lower temperatures (750 and 800 °C) than the 1200 °C required for ceramic processing of SOFC layers [15,27]. Using high calcination temperatures is crucial for obtaining a catalyst with microstructural properties similar to those used in SOFCs. According to the literature, the Pr loading (up to 80 atom%) does not affect the ceria crystallite size for samples calcined at 750 °C [26]. On the other hand, when ceria doped with Pr (10 and 50 wt.% of Pr) are calcined at higher temperatures (1000 °C), the Pr loading strongly affects the support crystallite sizes [28,29].
Considering the studies cited above, although various dopants such as Gd3+, Zr4+, and Nb5+ have been investigated to improve the redox properties and catalytic performance of ceria-based supports, Pr3+ doping has shown distinct advantages for DRM, including enhanced oxygen mobility, increased surface reactivity, and reduced carbon deposition [24,26]. Therefore, Ni supported on Pr-doped ceria appears to be a particularly promising candidate for catalytic layers in SOFC anodes directly fed with CH4 and CO2 mixtures, due to its favorable redox behavior and resistance to carbon formation. However, most studies to date have assessed the performance of catalysts containing Pr after calcination at relatively low temperatures (typically ≤800 °C), which are not compatible with the high-temperature conditions (~1200 °C) required for ceramic processing in SOFC manufacturing. The influence of Pr content on key catalyst properties, such as crystallinity, oxygen mobility, and structural stability, under these high-temperature conditions remains poorly understood. This represents a significant knowledge gap, particularly for the design of catalytic layers capable of maintaining their structural integrity and catalytic activity after thermal treatment during SOFC fabrication.
Therefore, the main objective of this work was to develop a catalyst capable of withstanding the high-temperature conditions typical of SOFC processing while maintaining good catalytic performance for DRM. To this end, we investigated the performance of Ni supported on Pr-doped ceria, evaluating the effects of Pr content on the catalyst’s crystalline structure, Ni and support crystallite sizes, and support reducibility after calcination at 1200 °C.
Assessing the catalytic performance of materials prepared under such conditions in fixed-bed reactors, prior to electrochemical testing in SOFC cells, is a valuable strategy. It helps to screen promising candidates efficiently, reducing the number of cell experiments required, thereby saving time and lowering overall costs. The findings from this study will support the selection of a catalyst with strong potential for future studies focused on DIR-SOFC applications.
For this, the catalysts prepared are characterized using temperature-programmed reduction (TPR), in situ X-ray diffraction (XRD), Scanning Electron Microscopy (SEM) and Transmission Electron Microscopy (TEM) analyses. The catalytic performance during DRM was evaluated in a fixed-bed reactor. Post-reaction temperature-programmed oxidation (TPO) analyses were performed to investigate the quantity and nature of the carbon formed during the DRM.

2. Materials and Methods

2.1. Catalyst Preparation
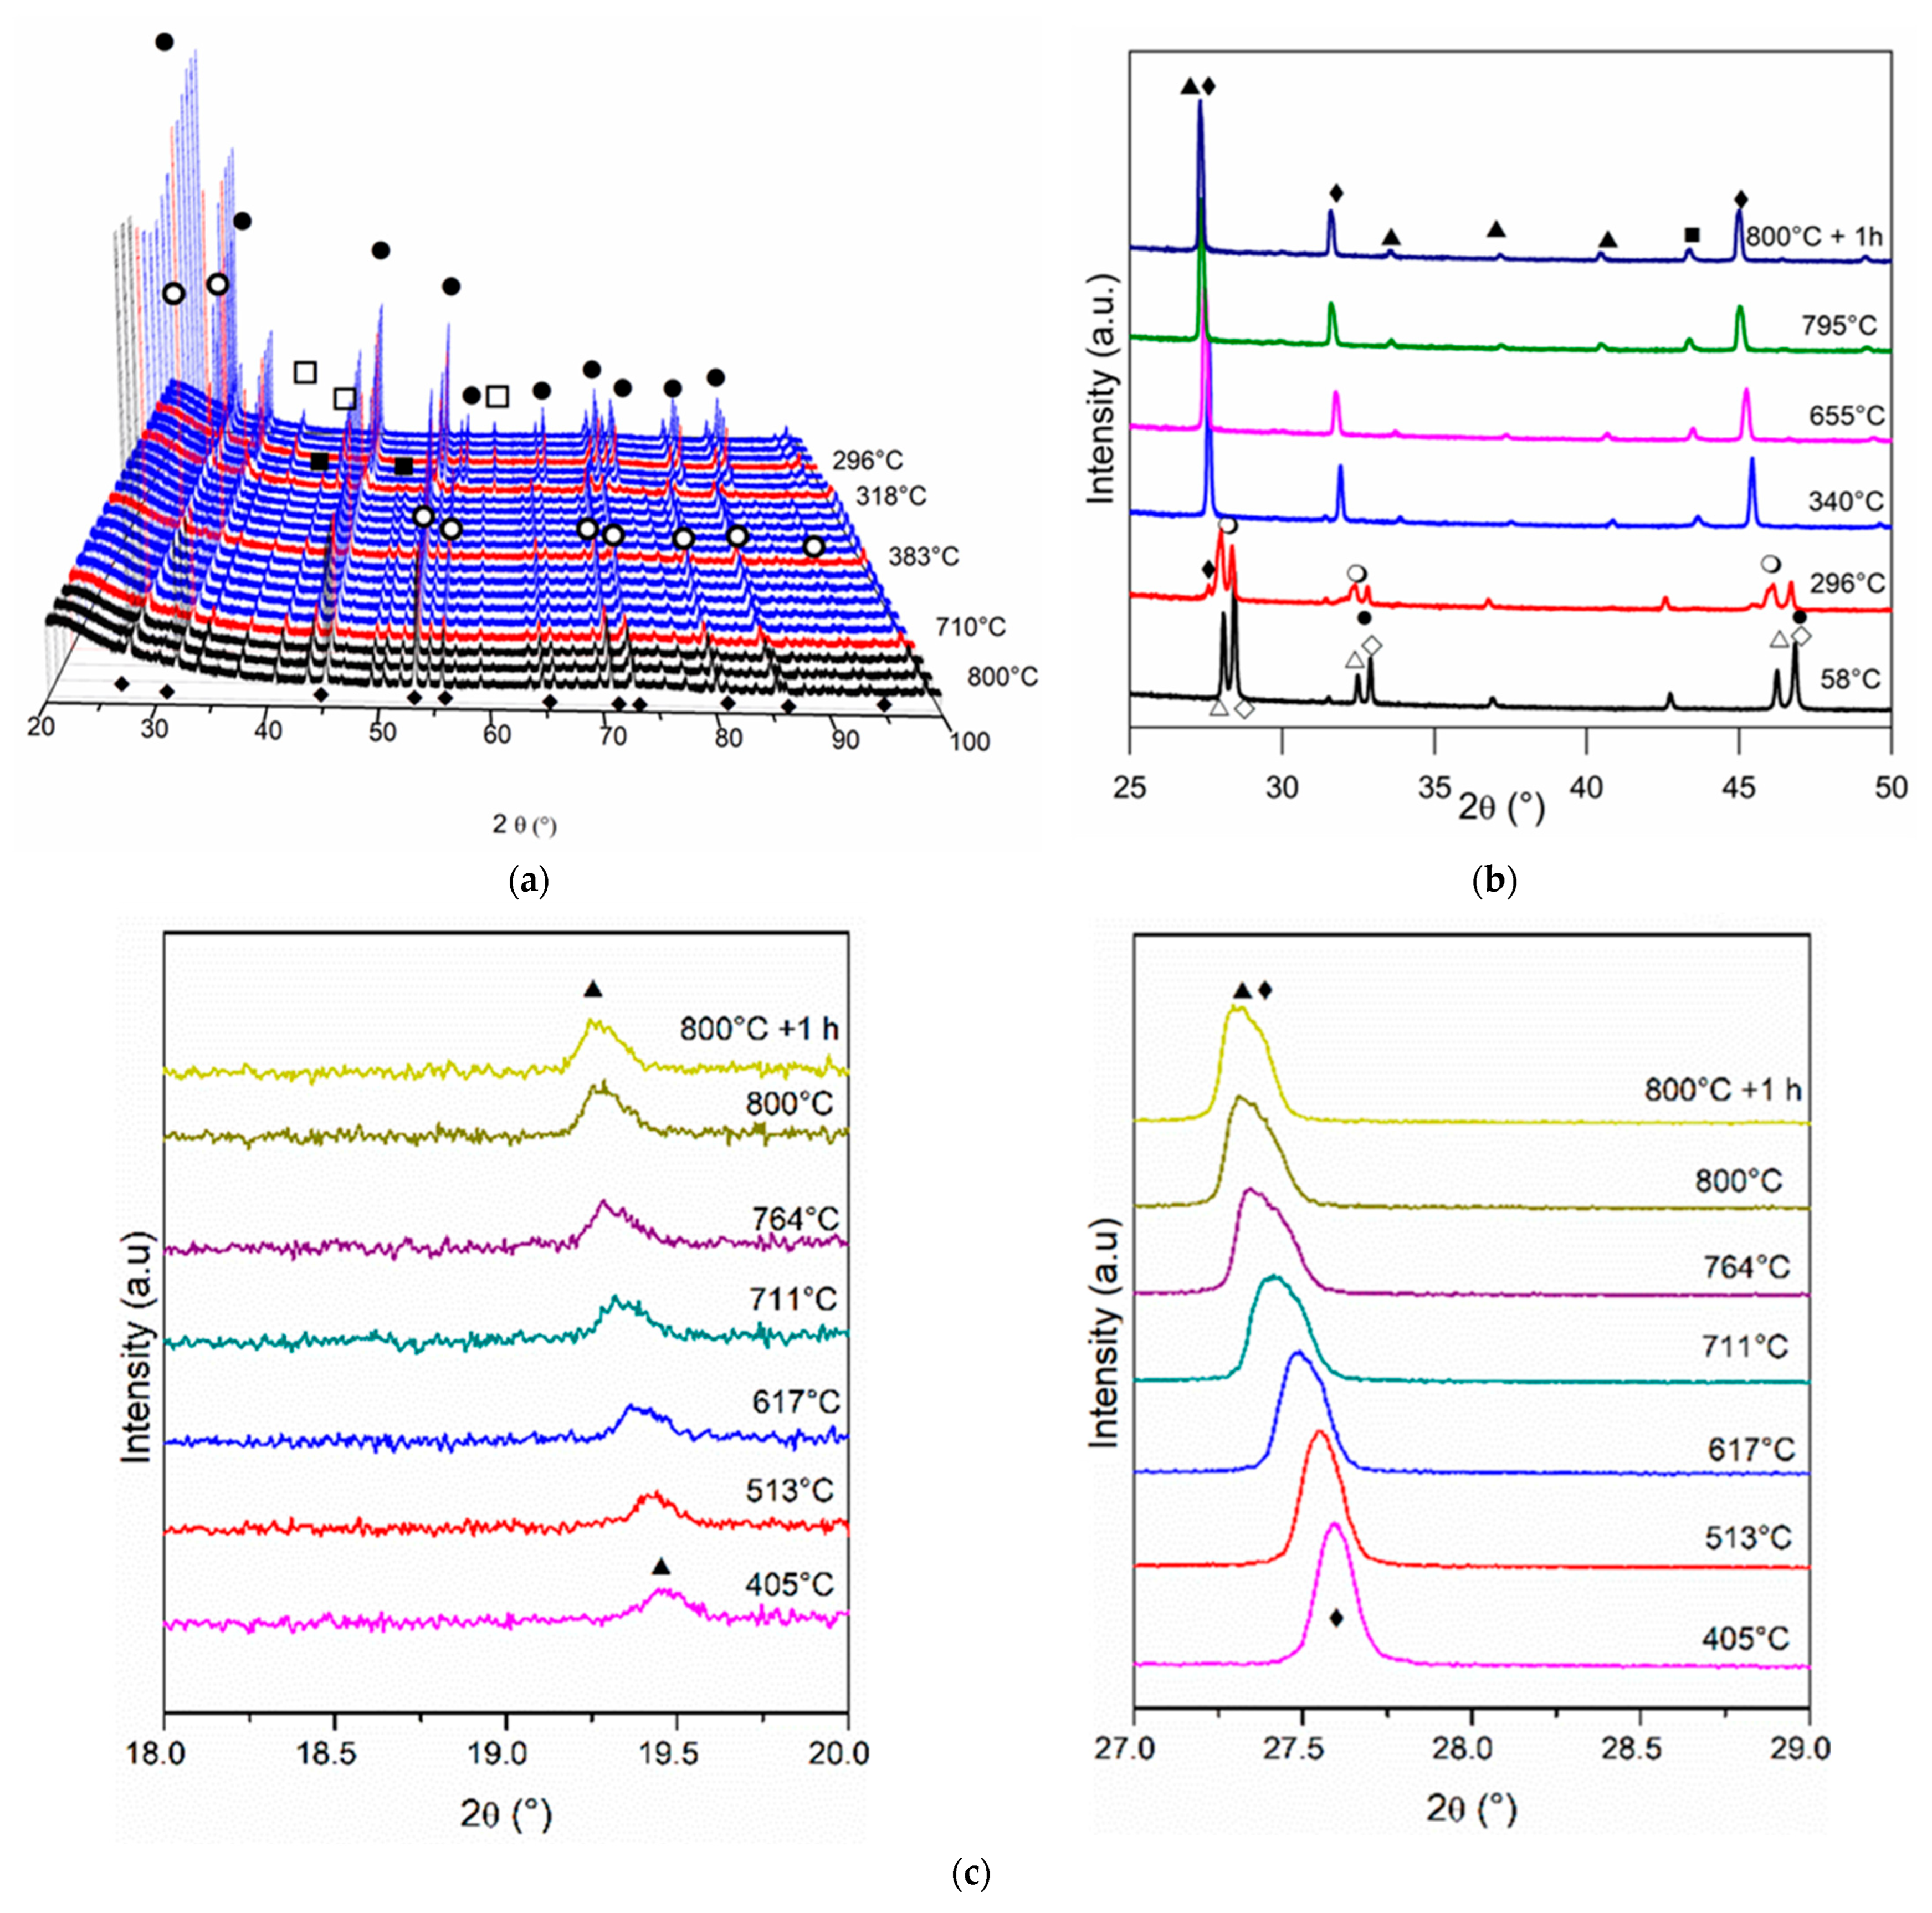
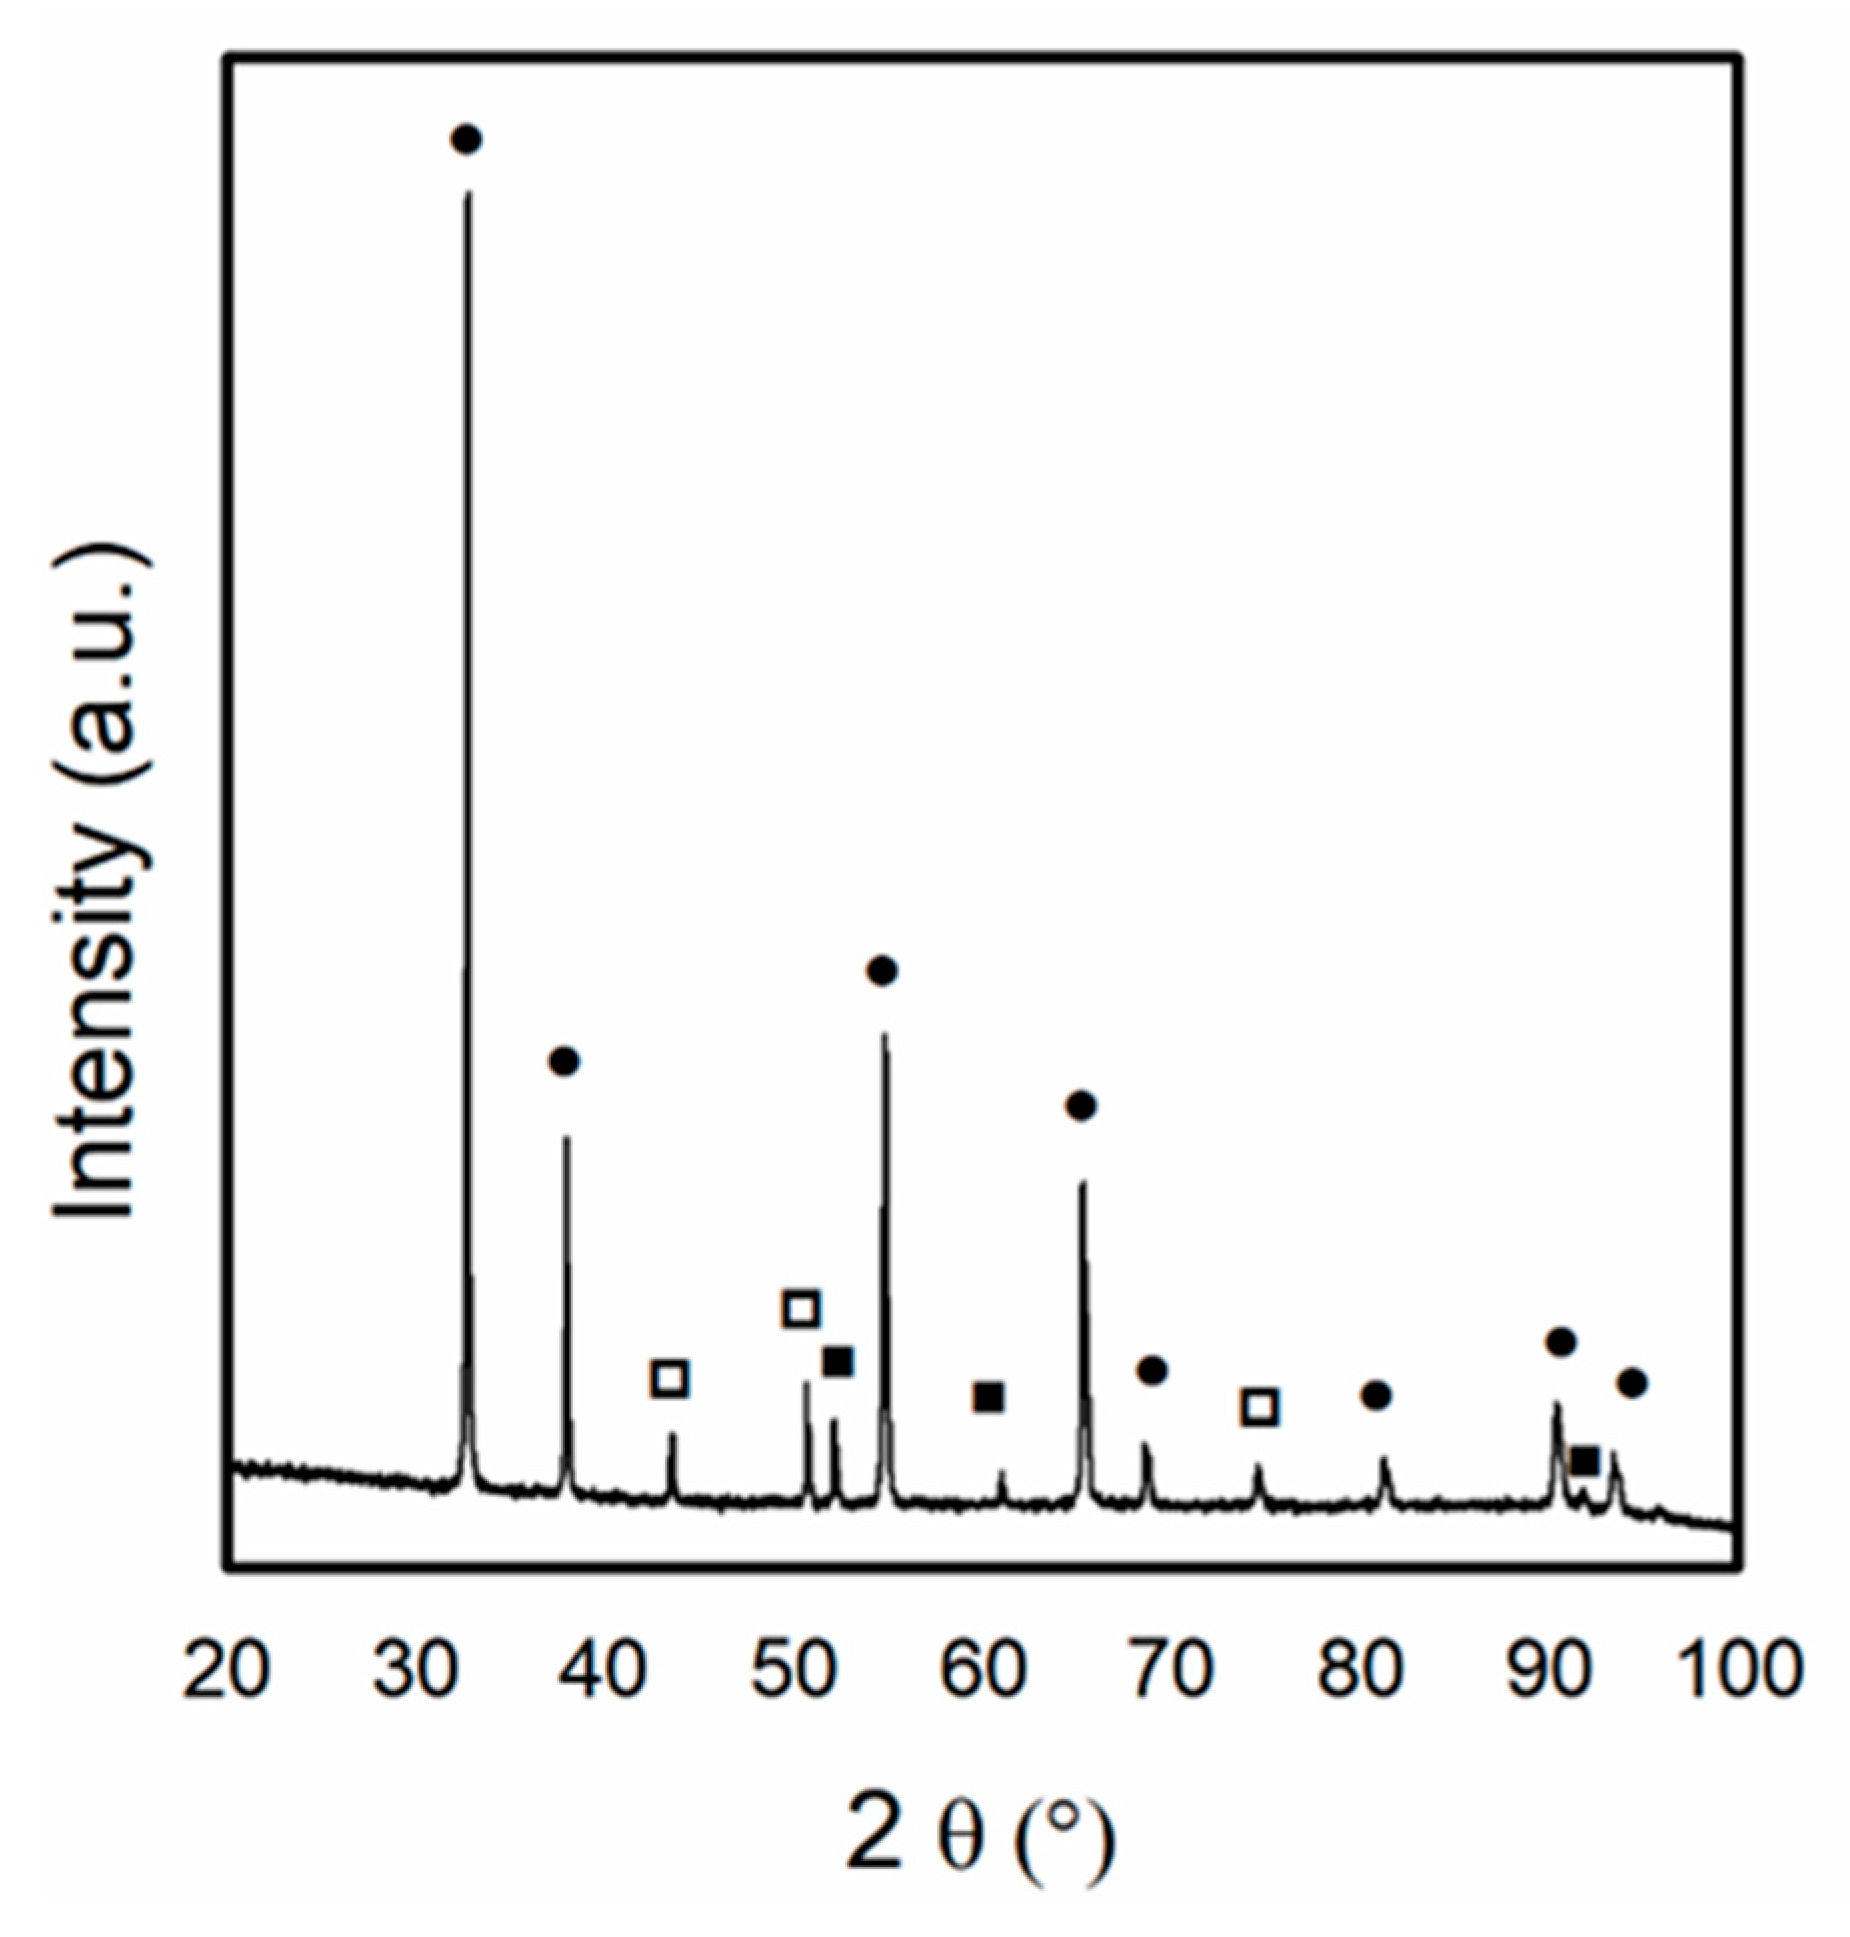
The supports containing Ce and Pr (Ce1–x Prx with x = 0, 0.2, 0.5, 0.8) were prepared via co-precipitation of the precursor salts’ aqueous solutions (ammonium cerium nitrate (IV) and praseodymium nitrate hexahydrate) with ammonium hydroxide (NH4OH). An NH4OH solution was added in a 4-fold molar excess. After 24 h, the mixtures were vacuum filtered and washed to achieve a neutral pH, then dried at 100 °C for 24 h. The samples were ground and calcined under an air flow (50 mL/min) for 2 h at 300 °C. The calcined supports were sieved (d ≤ 53 µm) for subsequent metal addition.
Ni (10 wt.%) was added to the supports via wet impregnation with aqueous solutions of nickel nitrate hexahydrate (Ni(NO3)2·6H2O). The solutions were kept under stirring for 19 h at room temperature and atmospheric pressure. After evaporation, the obtained materials were dried at 100 °C for 24 h and ground. The samples were calcined at 1200 °C for 5 h (0.5 °C/min) from room temperature to 300 °C, and 2 °C/min from 300 to 1200 °C. This elevated temperature was selected to simulate the conditions necessary for the ceramic processing of SOFC layers, as reported in the literature [15,30]. Then, the following catalysts were obtained: Ni/Ce, Ni/Ce0.8Pr0.2, Ni/Ce0.5Pr0.5 and Ni/Ce0.2Pr0.8.

2.2. XRD

In situ X-ray powder diffraction analyses were carried out at the XRD1 beamline of the National Syncrotron Light Laboratory (LNLS), using a wavelength radiation of 1.03305 Å, a 2θ range from 10° to 100° and acquisition time of 120 s. XRD patterns were obtained from the Ni/Ce(1–x)Prx catalysts, before and during reduction, under pure H2 at 800 °C for 30 min, at a heating rate of 10 °C/min and a flow rate of 10 mL/min. XRD analysis of Ni/Ce0.5Pr0.5 was also performed after CO2 flow to evaluate the oxidation of Ni particles. For this purpose, after a reduction treatment under H2 at 800 °C for 1 h and purging under N2 for 30 min, the catalysts were subjected to a flow of 50 mL/min of CO2. Subsequently, the system was purged with N2 for 30 min. Finally, the material was passivated with a bath of liquid nitrogen and isopropyl alcohol under a flow mixture of 5% O2/N2.
The crystallite mean sizes were calculated using the Scherrer equation, Equation (1), for CeO2 and Ni phases.
d = k · λ β · c o s θ
where β = Full Width at Half Maximum (FWHM) calculated from the diffraction line’s Gauss curve, θ = Bragg’s angle, k = 0.9 (spherical particles), λ = radiation wavelength and d = crystallite’s mean diameter.
Lattice parameters of the supports were calculated via Bragg’s equation, considering the (111) plane and pseudo-cubic geometry.

2.3. TEM

STEM analyses and energy-dispersive X-ray spectroscopy (EDS) were conducted on a JEOL JEM 2100F (Tokyo, Japan), with 80 kV to 200 kV voltage, field emission and EDS SSD detector with a high-angle annular dark-field detector (HAADF). For that purpose, small quantities of the catalysts were diluted in ethanol and kept under ultrasound sonification for 40 min for better dispersion. Then, they were dripped onto a TEM mesh (Electron Microscopy Sciences, Hatfield, PA, USA, Cat. # LC200-CU) with Pasteur pipette. EDS allowed for the identification of the different element distribution in the samples and [31], thus, a better understanding of the metal–support interaction.

2.4. SEM

Scanning Electron Microscopy (SEM) was employed to evaluate the formation of filamentous carbon structures. The analyses were performed using a JEOL JSM-7100F field-emission microscope operating at 30 kV and equipped with an energy-dispersive X-ray spectroscopy (EDS) system. Samples were mounted on aluminum stubs using conductive carbon tape.

2.5. TPR

The TPR analysis was performed on an AutoChem II 2920 V5.01 instrument (Micromeritics®, Norcross, GA, USA), coupled to a thermal conductivity detector. The samples were heated to 1000 °C at a 10 °C/min rate, under a 10% H2/N2 mixture and total flow rate of 30 mL/min.

2.6. DRM Reaction

DRM reaction was carried out in a tubular quartz reactor for 24 h, fed with a CH4:CO2 equimolar gas mixture at 800 °C, atmospheric pressure and a total flow rate of 100 mL/min. The exit gases were analyzed using a coupled gas chromatograph equipped with a thermal conductivity detector. Samples of around 100 mg were used, diluted with SiC in a weight ratio of 1.5 (SiC/catalyst), to avoid hot spots and temperature gradients. Before each reaction, reduction was carried out under pure H2 (30 mL/min) at 800 °C for 1 h and heating rate of 10 °C/min, followed by a 30 min N2 purge, at the same temperature and flow rates. The reactant conversions and product distribution were calculated from the equations below.
X i = n i f e e d n i e x i t n i f e e d × 100
S p =   n p n t o t a l × 100
where i = CH4 or CO2, Xi = conversion of i, ni = moles of i, p = H2, H2O or CO, Sp = yield of p, np = moles of produced p, ntotal = sum of the moles of products (CO, H2 and H2O).

2.7. TPO

TPO analysis was performed immediately following the catalytic test within the same reaction unit to quantify the carbon deposition during the 24 h reaction. This analysis employed a quadrupole mass spectrometer (Pfeifer D-35614, Memmingen, Germany) to detect the CO2 signal generated from the combustion of carbonaceous species on the catalyst. After the reaction, the reactor was cooled to room temperature under a He flow. An oxidizing gas mixture (O2/He ≈ 21.4%) was subsequently introduced at a total flow rate of 70 mL/min. Once the gas signals stabilized, the temperature was ramped to 900 °C at a rate of 10 °C/min, and the CO2 signal was monitored to track the carbon oxidation process. Upon reaching the final temperature, the feed was switched to bypass mode, and a CO2 reference signal was obtained at a known flow rate for calibration purposes.

3. Results and Discussion

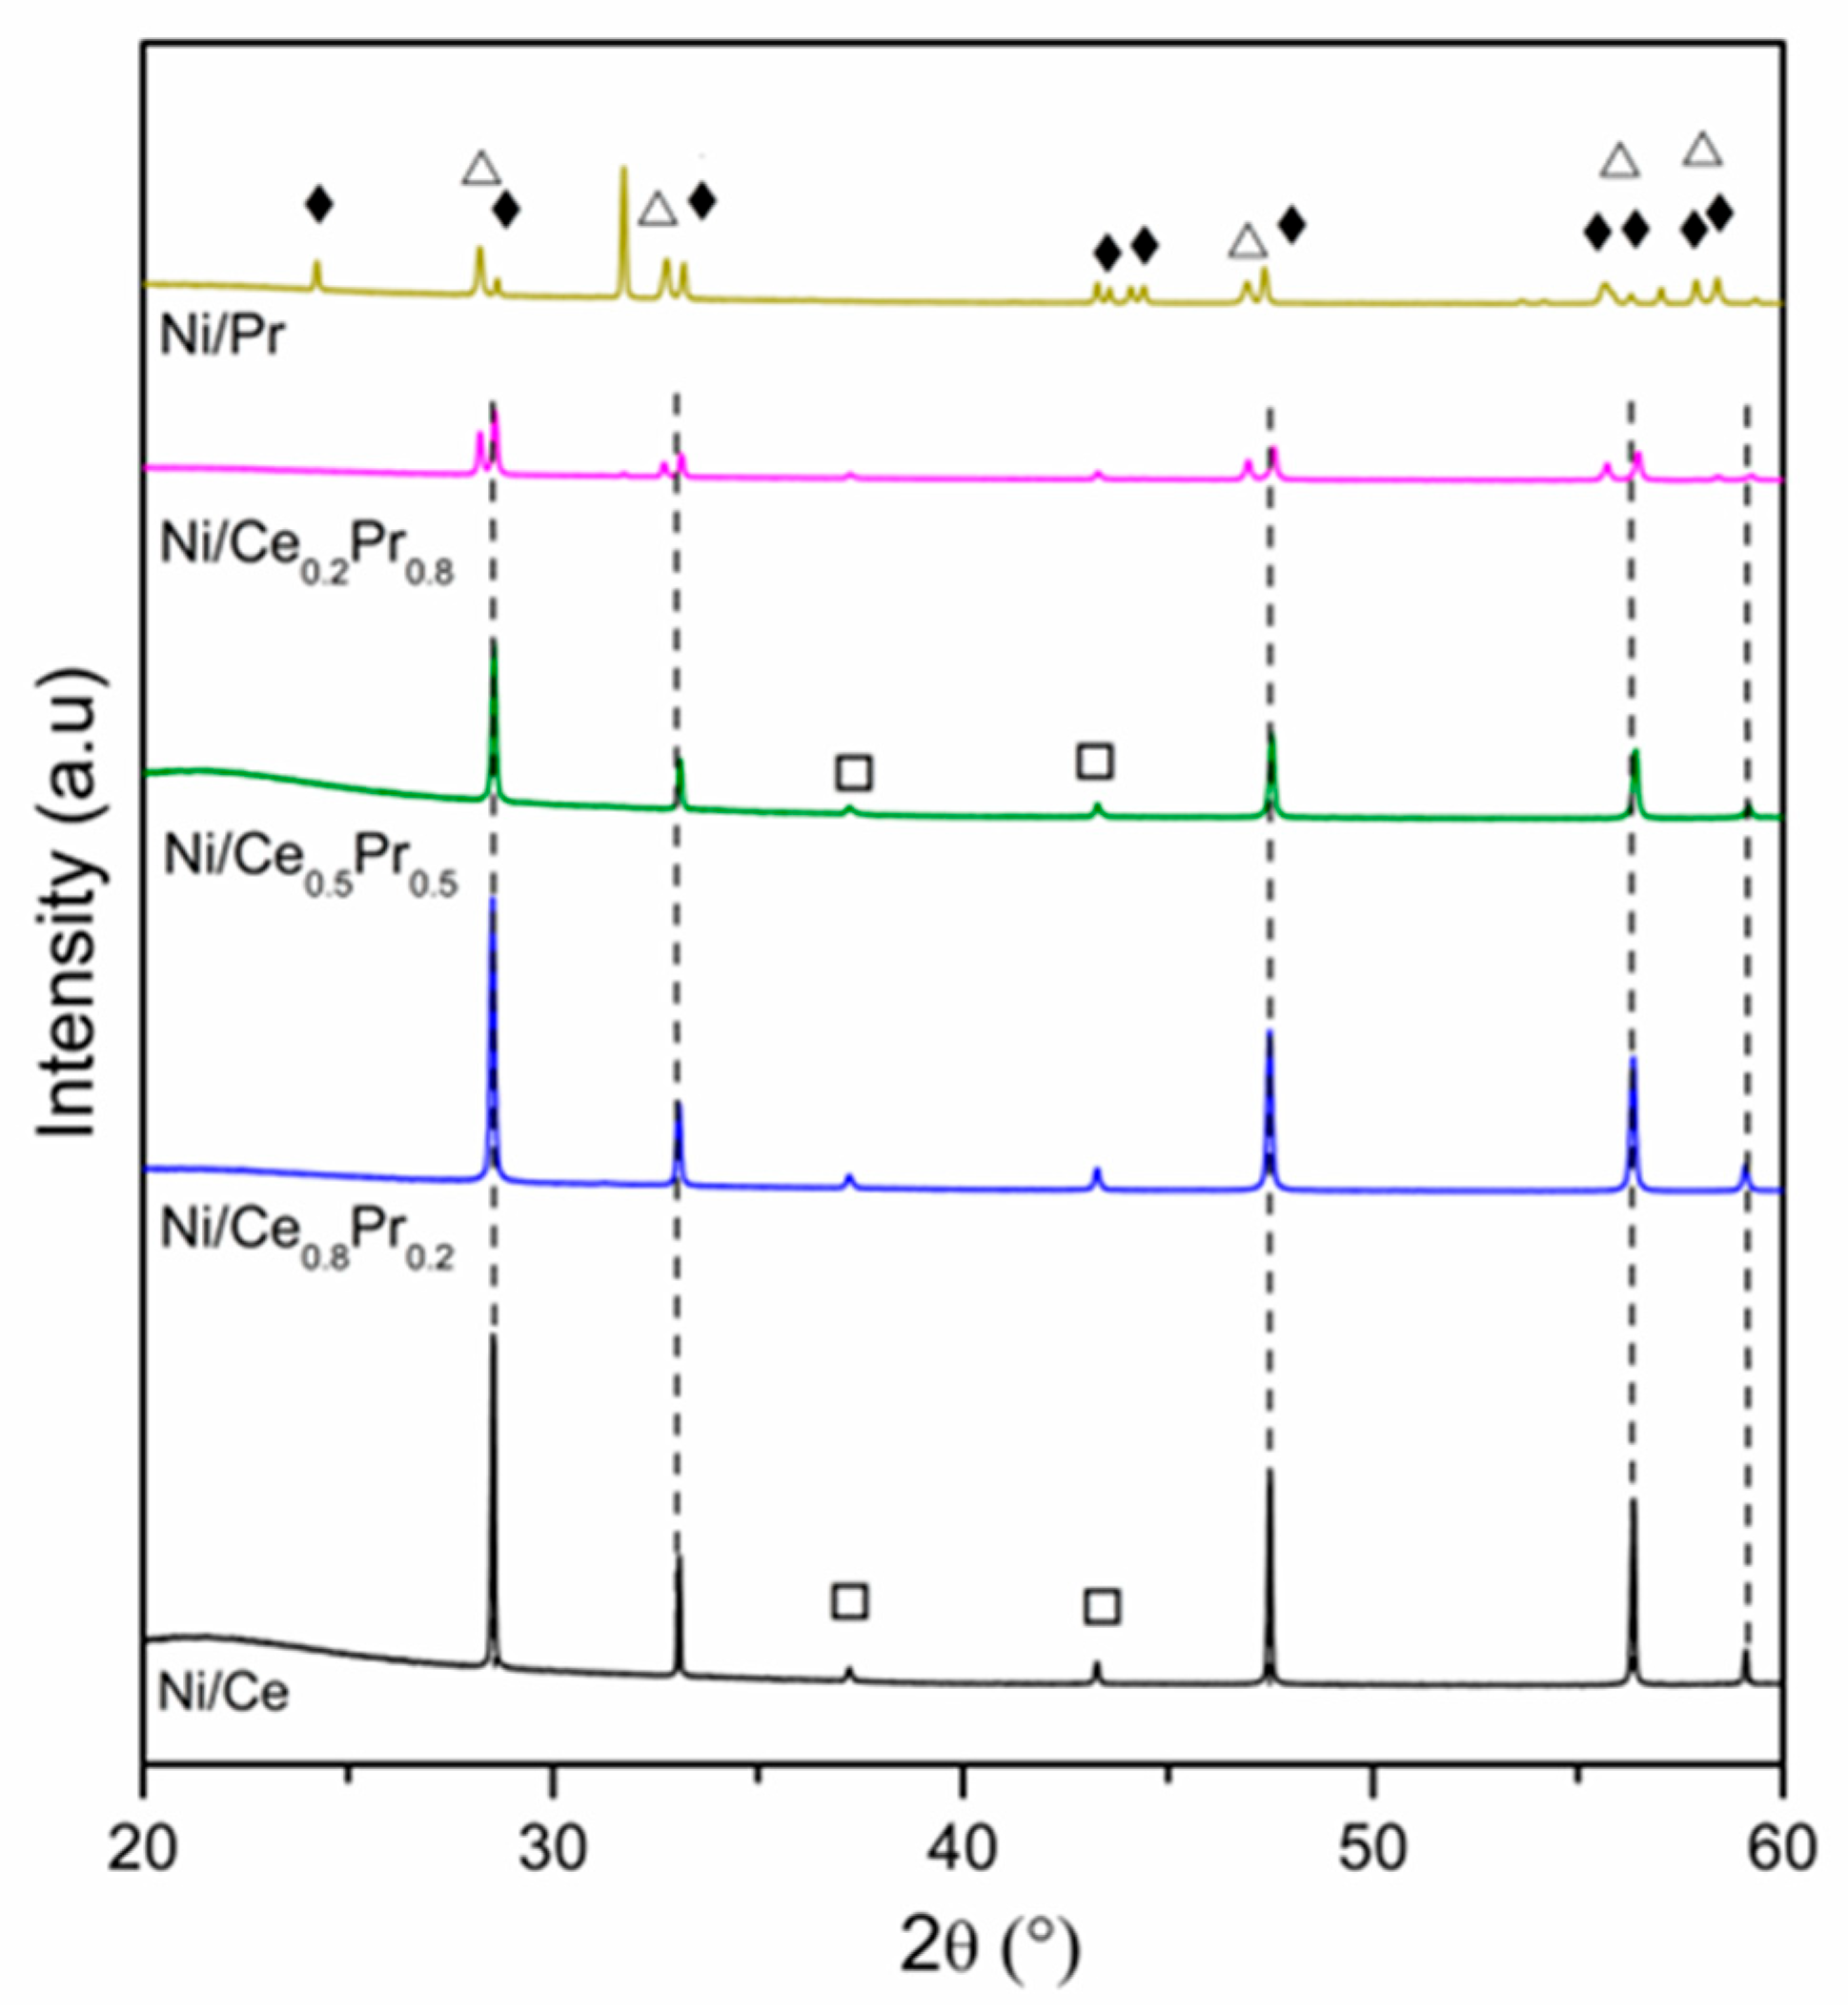
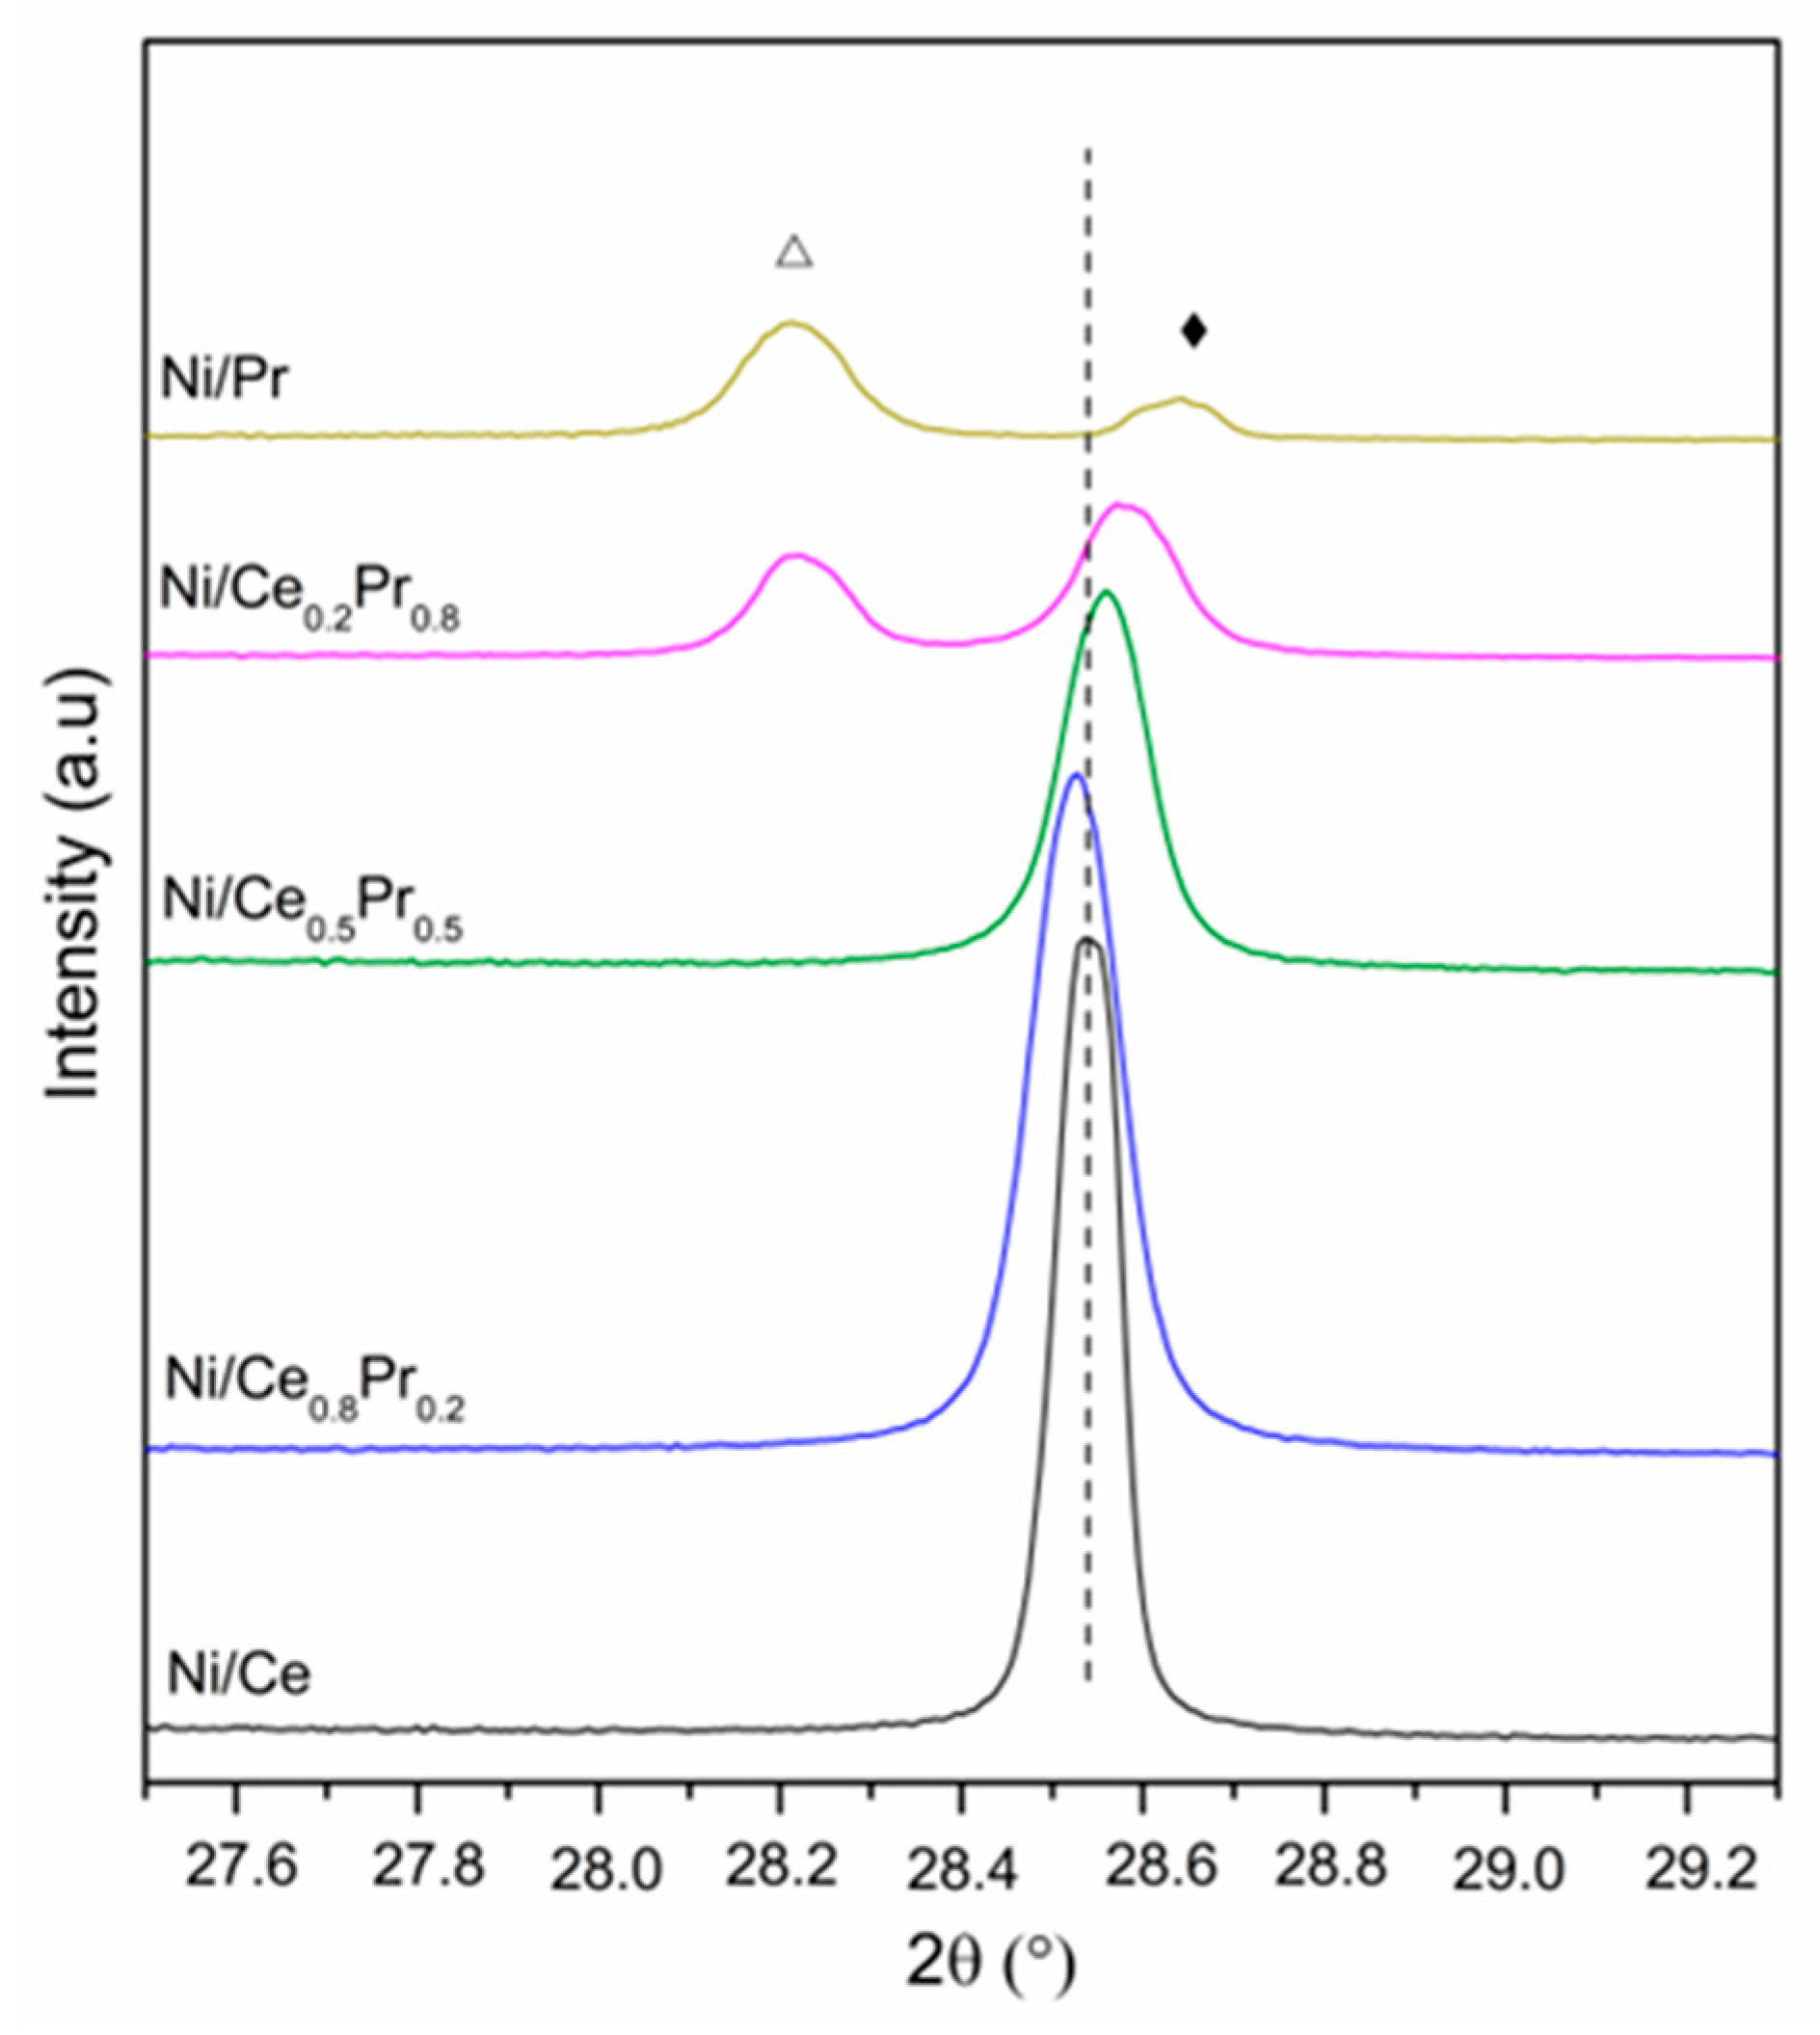
3.1. Catalyst Characterization

XRD patterns obtained for all calcined samples are presented in Figure 1 and Figure 2. All samples exhibited the diffraction lines characteristic of CeO2 in cubic phase (ICSD 72155). In the case of Ni/Ce0.8Pr0.2, a shift in the CeO2 lines was detected to lower values of 2θ (Figure 2). This result suggests that there was an expansion in the cerium oxide lattice. No diffraction lines related to praseodymium oxides were observed. On the other hand, for Ni/Ce0.5Pr0.5 and Ni/Ce0.2Pr0.8 samples, a displacement for higher values of 2θ was detected. In addition, for the sample containing 80 mol% of Pr, in addition to the lines related to CeO2, the diffraction lines corresponding to Pr12O22 (ICSD 82107) in a monoclinic phase were detected, which is a non-stoichiometric oxide containing Pr+3 and Pr+4. However, the presence of a Pr6O11 phase cannot be ruled out, since the diffraction lines of this phase overlap with those of ceria in the cubic phase.
Krishna et al. [28] studied the performance of ceria doped with different contents of Pr as catalysts for soot oxidation. They observed a shift in the peaks corresponding to the ceria cubic phase to higher 2θ values and a PrOx phase segregation in XRD analyses of Pr-doped ceria. According to these authors, the higher 2θ values indicate that most of the praseodymium in a solid solution is present in the 4+ oxidation state.
Concerning the Ni species, all samples exhibited NiO diffraction lines. Nevertheless, in both Ni/Ce0.5Pr0.5 and Ni/Ce0.2Pr0.8 catalysts, a reduction in intensities of NiO lines was observed. Furthermore, the main diffraction line of ceria became less symmetric, indicating the formation of another phase, such as Pr2NiO4, in samples with a higher Pr content.
To confirm the possibility of this phase formation, analyses were carried out for a sample containing only Ni and Pr (Figure 1 and Figure 2) prepared using the same method as the other samples. For the Ni/Pr sample, diffraction lines corresponding to NiO were not identified. Instead, only the diffraction lines of Pr2NiO4 in the orthorhombic phase (ICSD 81577) were detected. Thus, in this work, the XRD results suggest that increasing Pr loading favored the formation of Pr2NiO4 and PrOx phases, in addition to the ceria phase.
The values of the ceria lattice parameter obtained for Ni/Ce, Ni/Ce0.8Pr0.2, Ni/Ce0.5Pr0.5 and Ni/Ce0.2Pr0.8 are shown in Table 1.
A comparison between the values of lattice parameters of ceria for Ni/Ce0.8Pr0.2, Ni/Ce0.5Pr0.5 and Ni/Ce0.2Pr0.8 with those obtained for Ni/Ce and for CeO2 from ICSD 72155 (5.4124) showed that the addition of 20 mol% of Pr led to an increase in the lattice parameter. The increase in the lattice parameter and the shift to lower values of 2θ suggest the insertion of praseodymium ions in the CeO2 crystalline lattice [32]. On the other hand, for Ni/Ce0.5Pr0.5 and Ni/Ce0.2Pr0.8, there was a decrease in the values of the CeO2 lattice parameter, indicating a contraction of the crystalline lattice of ceria.
Chiba et al. [33] reported that the insertion of Pr in the crystalline lattice of CeO2 can cause both expansion and contraction effects, depending on the oxidation state of Pr ions. This effect can be explained by the significantly larger radius of Pr3+ ions (1.128 Å) compared to that of Ce4+ ions (0.97 Å). On the other hand, the ionic radius of Pr4+ (0.96 Å) is slightly smaller than that of Ce4+ [34,35].
The XRD results presented above indicated the formation of a solid solution between ceria and praseodymium oxides for all doped samples. Furthermore, increasing Pr content resulted in a phase segregation, which is consistent with the results reported by Krishna et al. [28], showing a segregation phase for CePrOx catalysts, when Pr loading was higher than 50%.
Table 1 also shows the crystallite size of CeO2 obtained through XRD analyses for calcined samples.
Compared with the results obtained for the undoped sample, the addition of 20 mol.% of Pr slightly decreased the support crystallite size. However, increasing Pr loading to 50 and 80 mol.% of Pr increased support crystallite sizes. Some authors reported that the crystallite size of CePrOx calcined at high temperatures depends on the amount of praseodymium dopant. They observed that after calcination at 1000 °C, a lower amount of Pr (10 wt.%) decreased the crystallite size of CeO2, whereas higher quantities of this dopant (50 wt.%) increased the support crystallite sizes [28,29]. All catalysts showed similar NiO particle sizes (∼78–90 nm).
Figure 3 and Figure 4 show the results obtained through TEM and EDS analyses for Ni/Ce and Ni/Ce0.8Pr0.2, respectively. Micrographs of the other samples are presented in the (Supporting Information Figures S1 and S2). TEM and EDS analyses revealed that all samples presented large CeO2 and NiO particles, which are in agreement with XRD analyses. In addition, isolated NiO and CeO2 crystallites were observed, with no significant difference in their sizes. On the other hand, in the samples containing Pr, smaller NiO particles dispersed on the support were observed, especially in the sample containing 80 mol% of Pr, indicating greater contact between the Ni particles and the support for this catalyst.
Figure 5 and Figure 6 show the diffractograms obtained for in situ XRD experiments for Ni/Ce and Ni/Ce0.2Pr0.8 during reduction treatment from room temperature to 800 °C. The results obtained for the other doped cerium samples (Ni/Ce0.8Pr0.2 and Ni/Ce0.5Pr0.5) are presented in Figures S3 and S4 (Supporting Information).
The diffractogram of the samples Ni/Ce, Ni/Ce0.8Pr0.2, Ni/Ce0.5Pr0.5 and Ni/Ce0.2Pr0.8 at room temperature shows the diffraction lines of CeO2 and NiO.
For Ni/Ce (Figure 5), we observed a shift in the CeO2 diffraction lines to lower values of 2θ after heating to 560 °C. This displacement is likely due to the distortions of the crystallite structure that are caused by heating and reduction of the oxide [33,36]. At 579 °C, a diffraction line around 27.90° was detected (Figure 5b), which is attributed to the presence of non-stoichiometric oxide Ce11O20 (ICSD 88758). According to the literature [36,37,38], the ceria-phase transitions observed with increasing temperature are as follows: CeO2 → Ce11O20 → Ce7O12 → CeO1.67.
Bekheet et al. [36] observed the transformation of Ce7O12 into Ce11O20 for ceria-based materials at approximately 530 °C during cooling under H2. Increasing the temperature to 786 °C led to the appearance of a diffraction line at 2θ = 27.53°, which can be attributed to the formation of the Ce7O12 phase (ICSD 88754) with rhombohedral geometry. This phase is more stable at high temperatures, even though it has the same quantity of vacancies as the previous phase [37]. After 1 h at 800 °C, the CeO1.67 phase with a bixbyite structure (ICSD-88753) was also detected.
Regarding the nickel species, the appearance of Ni0 lines is observed around 280 °C. At 474 °C, NiO lines are no longer detectable, and only the Ni0 lines are observed, indicating a complete reduction of NiO. After this temperature, the intensity of Ni lines increased as the temperature increased.
For the doped samples, a slight displacement of CeO2 diffraction lines for smaller values of 2θ is also observed. In addition, increasing temperature reduction also led to the appearance of the Ce11O20 and Ce7O12 phases. The first one was observed at 490, 289 and 296 °C for Ni/Ce0.8Pr0.2, Ni/Ce0.5Pr0.5 and Ni/Ce0.2Pr0.8, respectively. The Ce7O12 phase was detected at 712 °C (for Ni/Ce0.8Pr0.2), 310 °C (for Ni/Ce0.5Pr0.5) and 296 °C (for Ni/Ce0.8Pr0.2). The formation of the Ce11O20 phase was also observed for samples with Pr during heating. However, the addition of Pr increased the temperature at which this phase was detected. This effect is attributed to the reduction of Pr4+ ions, leading to a valence state of Pr ions similar to that in Pr6O11 (mean valence value = +22/6) [33]. This contributes to the abrupt increase in the cell volume of the ceria cubic structure and the concentration of oxygen vacancies [33].
In addition to the ceria phases, the appearance of cubic Pr2O3 in bixbyite form (ICSD 647290) was detected from 747, 611 and 340 °C for Ni/Ce0.8Pr0.2, Ni/Ce0.5Pr0.5 and Ni/Ce0.2Pr0.8, respectively. However, the lines corresponding to this phase are more intense for the sample containing 80 mol% of Pr (Figure 6b,c). The Pr2O3 phase is formed by the reduction of the Pr12O22 phase, which occurs simultaneously with the reduction of the Ce11O20 phase. After reduction at 800 °C for 1 h, the presence of Ce11O20 was no longer detected for the samples containing 20, 50 and 80 mol % of Pr. Only the presence of the Ce7O12 and Pr2O3 phases was observed. The intensity of the Pr2O3 lines was higher for samples with 50 and 80 mol % of Pr.
Figure 7 presents the reduction temperature at which the different phases were first detected as a function of Pr loading. It is noticed that increasing Pr content decreased the temperature at which the presence of the Ce11O20, Ce7O12 and Pr2O3 phases was detected.
Thus, these results indicate that the reduction of CeO2 occurs at lower temperatures for samples containing higher Pr loading. This suggests that an increase in Pr content led to an increase in the reducibility of the catalysts. Ahn et al. [32] reported that the addition of Pr to ceria favors the ordering of oxygen vacancies, creating paths for better diffusion of O2, which increases the reducibility.
Regarding nickel species, all doped samples exhibited lines corresponding to NiO at room temperature. For the sample containing 80 mol% of Pr, in addition to the diffraction lines corresponding to NiO, diffraction lines related to Pr2NiO4 were also detected. The intensity of the lines corresponding to NiO decreased, and the lines related to Ni0 were detected during reduction at around 300–319 °C for Ni/Ce0.8Pr0.2, Ni/Ce0.5Pr0.5, and Ni/Ce0.2Pr0.8. The Pr content did not have a significant influence on the initial reduction temperature of NiO (Figure 7). Furthermore, it was not possible to determine at what temperature the Pr2NiO4 phase was reduced, since its diffraction lines overlap with the diffraction lines of the other phases detected at higher reduction temperatures.
Then, to determine the reducibility of the Pr2NiO4 phase, the in situ XRD analysis of Ni/Pr sample was carried out (Figure S5). At room temperature, the lines of Pr12O22 and Pr2NiO4 were detected. Increasing temperature decreased the intensity of the lines corresponding to Pr12O22, while the diffraction lines related to Pr2O3 with the cubic phase (ICSD 647290) were detected. At 464 °C, the lines associated with Pr12O22 were no longer observed. When the temperature was increased to 523 °C, the presence of lines of Pr2O3 with a hexagonal phase (ICSD 61179) was observed. The formation of this phase was followed by a decrease in the lines of Pr2NiO4. At 620 °C, only Pr2O3 with cubic and hexagonal phases was detected. No changes in XRD patterns were observed at temperatures higher than 620 °C. Since the results obtained showed the Pr2NiO4 reduction was followed by Pr2O3 formation, the absence of the diffraction lines of Ni0 could be attributed to the formation of very small Ni crystallites dispersed on Pr2O3.
Tarutin et al. [39] reported that, when Pr2NiO4+δ is submitted to reducing atmospheres, Ni is completely reduced, and a Ni/Pr2O3 cermet is formed, exhibiting small Ni particles.
Osinkin [40] also investigated the use of Pr2NiO4+δ as a catalyst to simultaneously enhance oxygen reduction and hydrogen oxidation reactions in solid oxide electrochemical devices. A double-layer electrode based on Sr2Fe1.5Mo0.5O6-a was coated with a symmetric catalyst using the wet impregnation method, applying a precursor solution for synthesizing Pr2NiO4+a. XRD analysis, after a 10 h heat treatment at 800 °C under various atmospheres, indicated that in in an oxidizing atmosphere, NiO and Pr6O11 are present, while Ni0 and Pr2O3 were detected in a reducing atmosphere.
Table 1 presents the crystallite sizes of Ni0 after reduction at 800 °C for 1 h. The Ni/Ce catalyst exhibited the largest Ni crystallite size (116 nm). The smallest Ni crystallite size was obtained for the sample with 80 mol% of Pr (63 nm). This result could be related to the presence of Pr2NiO4, which led to the formation of smaller Ni particles. The formation of the Pr2NiO4 phase is favored in the sample with the highest amount of Pr, as revealed by XRD analyses. Since metallic Ni is the active phase for methane dissociation in DRM, and smaller Ni particles are known to exhibit higher activity, the formation of Pr2NiO4 during calcination can be considered beneficial. In this context, Pr2NiO4 acts as a precursor that facilitates the generation of smaller Ni0 particles.
The TPR profiles are presented in Figure 8. The Ni/Ce exhibited H2 consumption at 400, 450, 597 and 830 °C. The peaks in the region between 400 and 597 °C can be attributed to the reduction of NiO and superficial CeO2 [41,42].
The consumption of H2 at higher temperatures is related to the reduction of bulk CeO2 [43]. For samples containing Ce and Pr, similar TPR profiles were obtained. However, increasing Pr content increased the intensity of the peaks at temperatures below 700 °C and decreased H2 consumption at higher temperatures. The increase in consumption at lower temperatures may be associated with an increase in the reducibility of CeO2 that is due to the formation of the solid solution between Ce and Pr [44]. This agrees with XRD analyses during reduction treatment, which showed that the increase in Pr content led to an increase in the reducibility of the catalysts. Moreover, for the samples containing 50 and 80 mol% of Pr, it is not possible to rule out the reduction of the Pr2NiO4 phase at temperatures lower than 750 °C, since the results obtained via XRD analyses suggest that these samples also exhibited this phase. In the case of the sample with 80 mol% of Pr, in addition to the Pr2NiO4 phase, the reduction of Pr12O22 cannot be ruled out either.
The total H2 consumption and the degree of reduction of Ni species and support for all catalysts are presented in Table 2.
It is important to note that the presence of the Pr2NiO4 phase does not impact the calculation of the degree of reduction for nickel, as the reduction stoichiometry for NiO reduction is the same as that for Pr2NiO4 reduction. Therefore, the degree of reduction of nickel can be calculated as if all nickel was in the NiO phase. The reduction of Ni/Ce at temperatures lower than 750 °C was close to 100%. However, for samples containing Pr and Ce, the values of the degree of reduction were higher than 100%, mainly for the sample containing 80 mol% of Pr. This suggests that, in addition to Ni species, there would also be a reduction in the support at temperatures lower than 750 °C for these samples. Furthermore, the reduction degree increased as the Pr content increased. These results agree with those reported by Zoellner et al. [45]. They conducted TPD of O2 analyses for CexPr(1-x) oxides (x = 0.2–0.6) and observed that the increase in Pr content led to an increase in the O2 storage capacity. The reduction of the supports at higher temperatures was not affected by Pr loading.

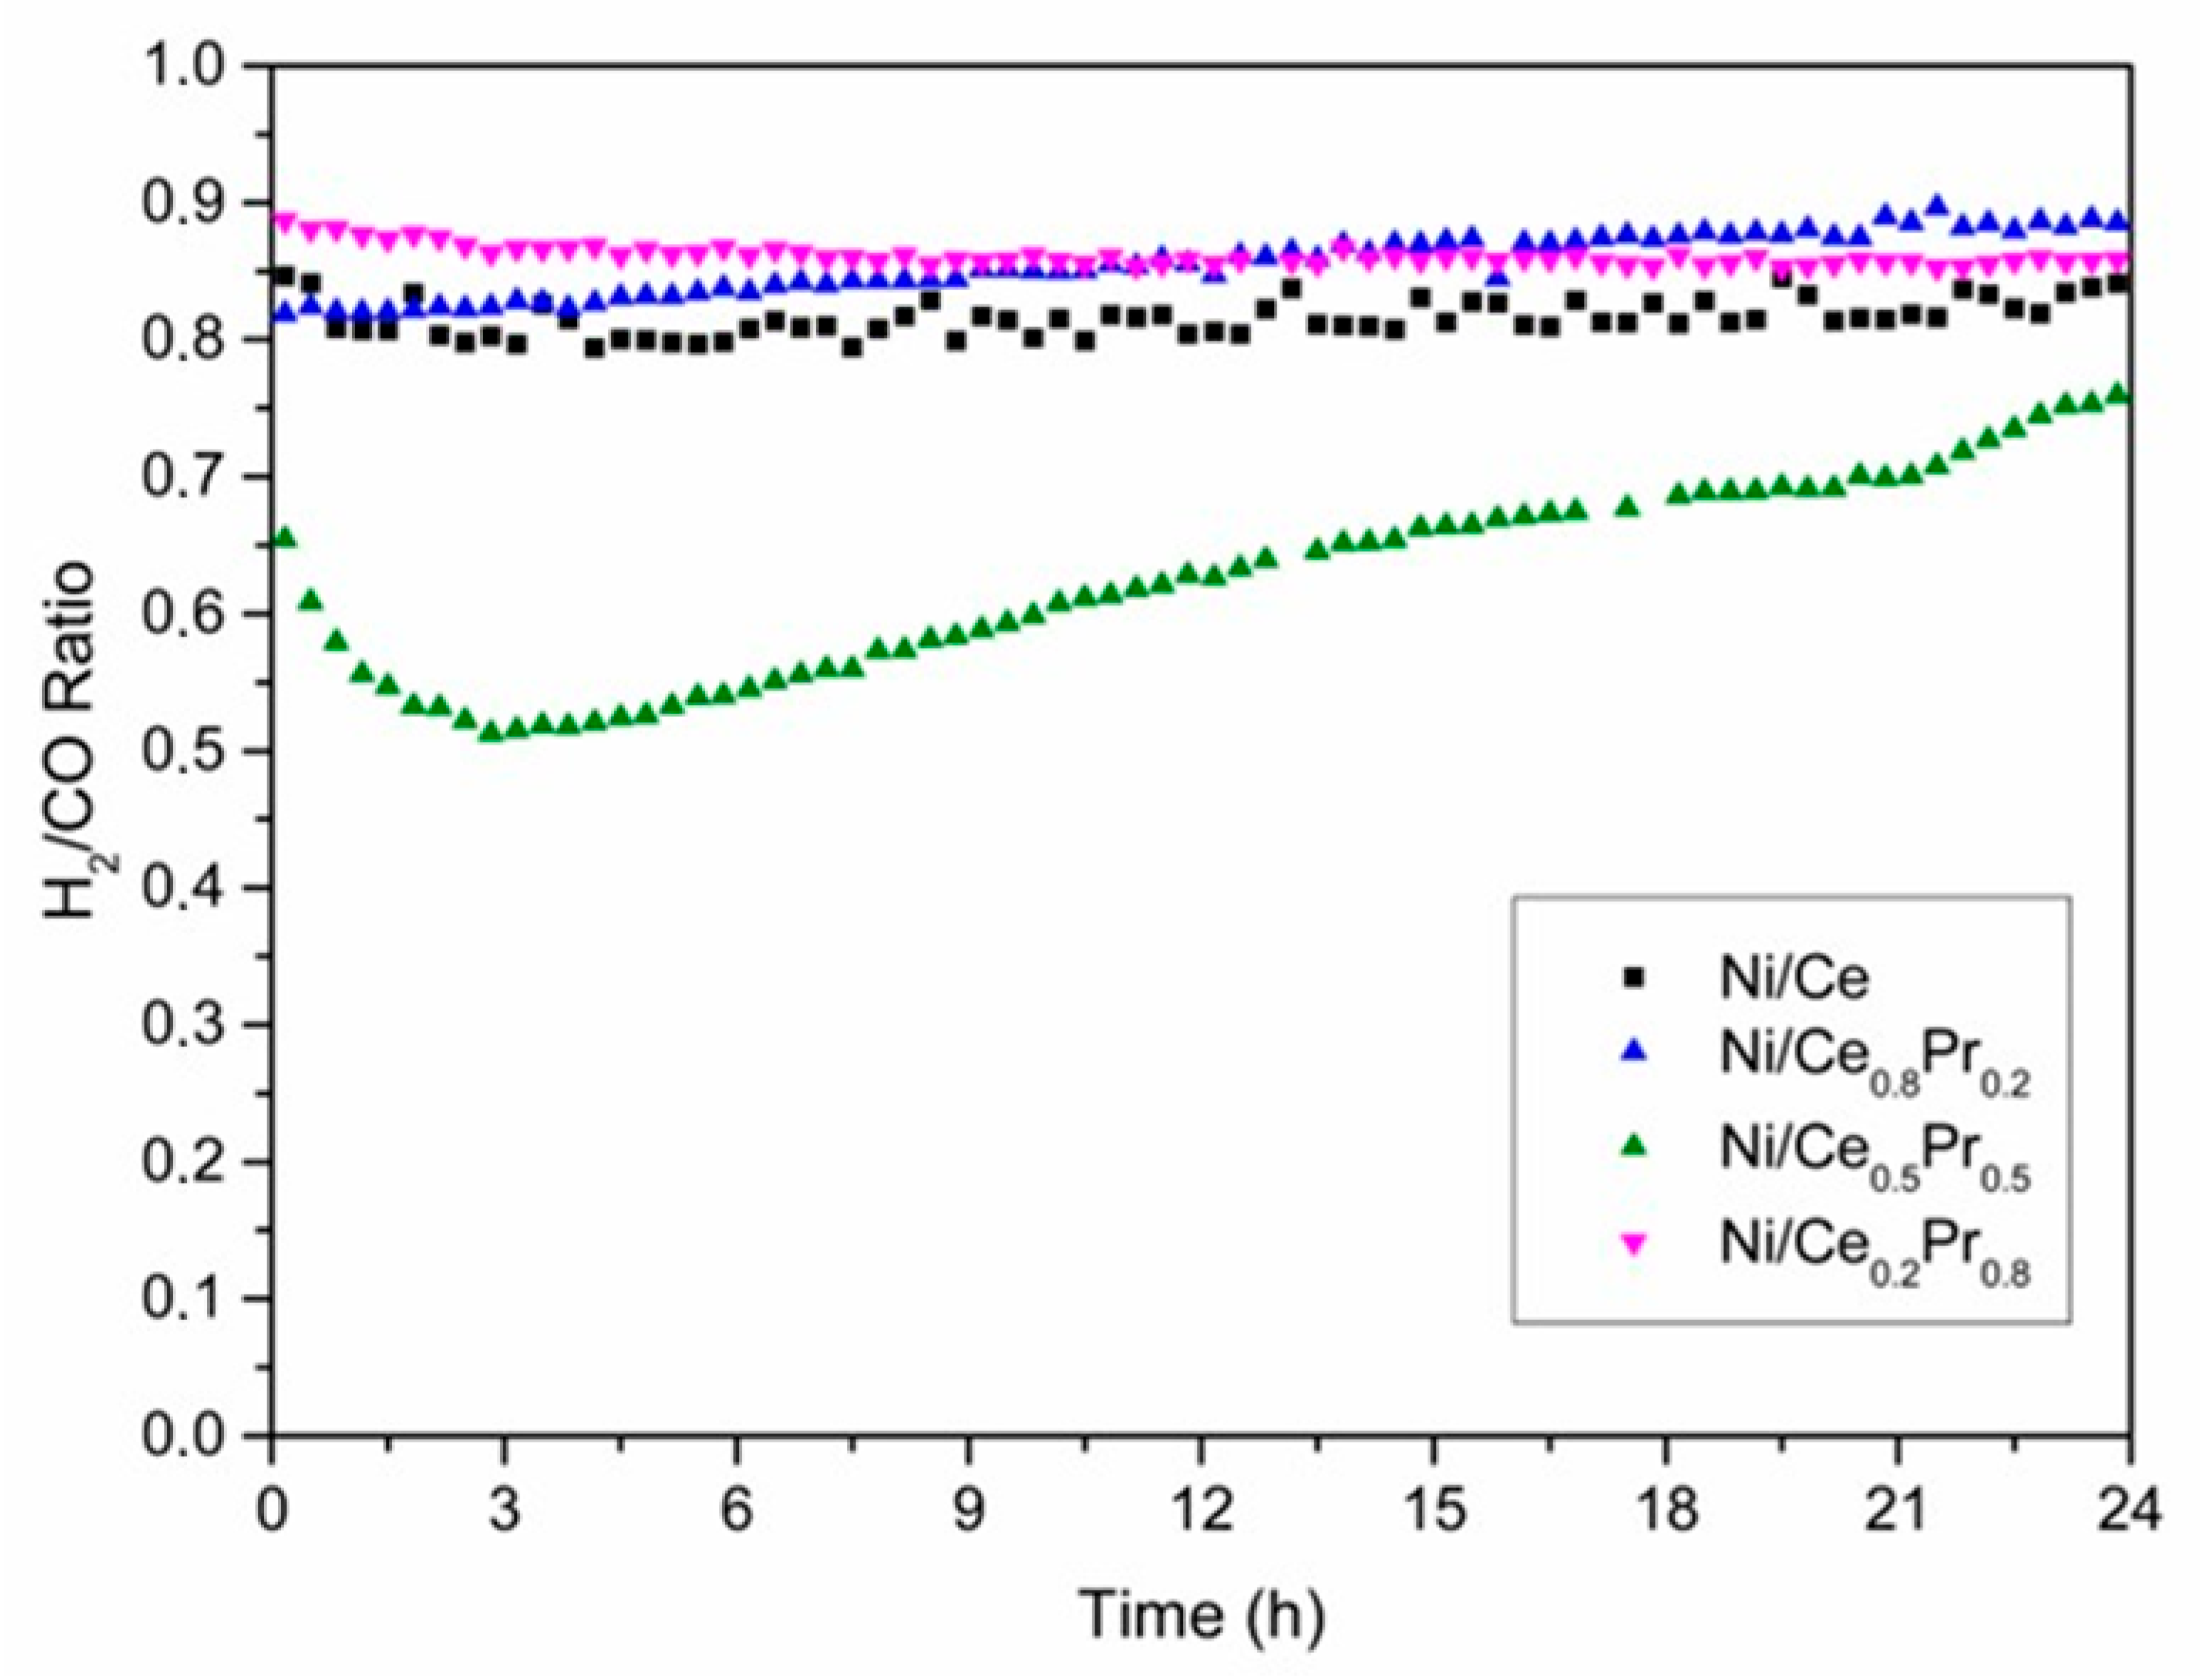
3.2. CO2 Reforming of Methane

Catalytic tests were carried out at 800 °C and 1 atm, using a CH4/CO2 molar ratio of 1.00 (Figure 9 and Figure 10). The value of initial CH4 conversion obtained for Ni/Ce was 58%. The highest and lowest values of initial CH4 conversion were obtained for the samples with 80 mol% of Pr (72%) and 50% of Pr (45%), respectively (Figure 9). When comparing the initial methane conversion values obtained in this work with those reported in the literature for catalysts tested at 800 °C and calcined between 400 and 800 °C (Table 3), it is observed that our results (46–72%) are within the reported range, which goes from around 37% to 75%. This shows that the catalysts developed in this study perform well under similar reaction conditions, even though they were calcined at a much higher temperature (1200 °C). The initial CO2 conversions followed the same tendency as initial CH4 conversion (Figure S6). However, the CO2 conversions were higher than CH4 conversions. The main products obtained were H2 and CO (Figure 10). A small amount of water was also observed. Figure S7 shows the catalytic test of Ni/Ce with error bars.
The H2/CO molar ratio values also had a similar behavior to that observed for the conversion of CH4 during the reaction (Figure 10). Ni/Ce0.2Pr0.8 exhibited the highest H2/CO ratio (0.89), which could be related to its highest initial CH4 conversion. The lowest value of the H2/CO molar ratio (0.65) was observed for the material with 50% of Pr.
Thus, all catalysts exhibited CO2 conversion higher than CH4 conversion and the H2/CO molar ratios below 1.0, which is due to the reverse water gas shift reaction [53].
Regarding catalyst stability, continuous deactivation was observed over 24 h of time on stream (TOS) for Ni/Ce. In the case of the sample containing 20 and 80 mol% of Pr, after a slight loss of catalytic activity in the first few hours of reaction, the methane conversion remained practically unchanged.
For the sample containing 50 mol% of Pr, more pronounced initial deactivation was observed, followed by a gradual activation phase starting after 3 h of time on stream (TOS), which continued until the end of the reaction. Moreover, for the catalyst with 50 mol% Pr, which exhibited the most significant loss of catalytic activity, the deactivation was accompanied by an increase in CO and H2O formation and a decrease in H2 production (Figures S8 and S9). As the reverse water gas shift reaction is in equilibrium under operating conditions, the formation of CO increases with the loss of catalytic activity for reforming reactions [53].
Some authors [16,17] also observed a period of activation in the DRM reaction. Faria et al. [16] studied the DRM over Ni/Al2O3 and Ni/CexZr1–xO2/Al2O3 (x = 0.5; 0.75; 1.0) catalysts. The activation period was observed for Ni/Al2O3 and Ni/CeO2/Al2O3 catalysts. An XRD experiment after exposition of the Ni/Al catalyst to CO2 stream was carried out in order to investigate the evolution of the phases present in the catalyst. After the exposition of the sample to CO2, the line characteristic of Ni0 was no longer observed, whereas a line attributed to the NiO phase appeared. This result suggested that Ni particles were partially oxidized at the beginning of the reaction for Ni/Al and Ni/Ce/Al catalysts. Rabelo-Neto et al. [17] investigated the performance of catalysts obtained from perovskites (LaNiO3, LaNiO3/Al2O3 and LaNiO3/CeSiO2). for DRM. In situ XPS experiments carried out under reaction conditions showed that metallic Ni particles were oxidized by CO2 in the feed for both LaNiO3 and LaNiO3/Al2O3 catalysts. Takanabe et al. [54] also reported a loss of activity at the beginning of the DRM at 750 °C over Co supported on TiO2. This was attributed to the oxidation of metallic Co particles by the CO2 of the feed, as revealed by XRD and XPS.
In the present work, to evaluate the oxidation of metallic Ni particles by CO2 from the feed, XRD analysis was performed after exposing the Ni/Ce0.5Pr0.5 catalyst to a CO2 stream for 1 h (Figure 11). The results showed that the characteristic lines of Ni0 were still present. However, the appearance of the lines was related to the NiO phase. Additionally, the diffraction line corresponding to the Ce11O20 phase was detected. These findings suggest that both the metallic Ni crystallites and the support were partially oxidized when exposed to a CO2 stream.
Thus, in this work, the partial oxidation of Ni0 to NiO by CO2 from the feed could contribute to the initial deactivation period observed for Ni/Ce0.5Pr0.5 during the DRM reaction. As hydrogen is formed during the reaction, the NiO particles are reduced, which could explain the observed activation period for this sample.
Some authors [55,56] studied the kinetics of the oxidation of metal particles and reported that the rate of oxidation increases with decreasing metal particle size. Then, the smaller metallic Ni particle observed for Ni/Ce0.5Pr0.5, when compared to the undoped sample and sample with 20 mol% of Pr, may explain why this behavior is more pronounced for this sample.
On the other hand, although the sample with 80 mol% Pr exhibited the smallest Ni0 particles, no activation period was observed. This may be attributed to its highest reducibility, as indicated by TPR analyses, which suggest that under reaction conditions, the support was preferentially oxidized, thereby preventing the oxidation of the Ni particles [18].

3.3. Characterization of Used Catalysts

In order to evaluate the carbon formation during DRM, TPO analyses were carried out after 24 h of TOS (Figure S10). All catalysts exhibited two main peaks of CO2 at 594–619 °C and 821–830 °C. For Ni/Ce0.2Pr0.8, in addition to these peaks, CO2 formation was also detected around 400–500 °C.
According to the literature [57], peaks of CO2 at temperatures between 400 and 500 °C are related to the formation of amorphous carbon, while peaks above 700 °C are attributed to graphitic carbon. The formation of CO2 at intermediate temperatures (from 600 °C) is attributed to carbon filaments [58]. Da Fonseca et al. [38] investigated the nature of carbon formed during DRM over Ni/CeO2 catalysts. They performed TPO analyses of well-defined carbonaceous structures: amorphous carbon, multi-wall carbon nanotube (MWNT) and graphite. For the amorphous carbon, oxygen uptake was observed between 350 and 550 °C, with a peak at 538 °C. The TPO profile of MWCNT exhibited a peak at 600 °C, whereas the oxidation of graphite took place at high temperature (above 650 °C).
Thus, the results obtained in this work indicate a predominance of carbon nanotubes and the presence of graphitic carbon in all catalysts studied. In addition, amorphous carbon appears to be present in the Ni/Ce0.2Pr0.8 sample.
SEM images of Ni/Ce and Ni/Ce0.2Pr0.8 showed the formation of carbon filaments after DRM at 800 °C (Figure S11), corroborating the results obtained through TPO analysis.
Previous studies [38,59,60] have demonstrated a correlation between Ni particle size and the nature of carbon deposits formed during methane decomposition and DRM over Ni-based catalysts. These authors observed that amorphous carbon tends to form preferentially on smaller Ni particles, while carbon nanotubes are predominantly produced on larger ones. Da Fonseca et al. [38] reported that Ni/CeO2 catalysts with Ni particle sizes larger than 10 nm mainly exhibited the formation of carbon nanotubes after DRM. Moreover, a small amount of graphitic carbon was also detected.
A similar trend was observed in this work. All catalysts exhibited large metallic Ni crystallite sizes (63–116 nm). Consequently, carbon nanotubes were the predominant form observed for all samples. The presence of amorphous carbon in the Ni/Ce0.2Pr0.8 sample could be associated with the formation of the Pr2NiO4 phase during calcination, as suggested by XRD analyses. Upon reduction, this phase could facilitate the generation of smaller metallic Ni particles, which may in turn favor the formation of amorphous carbon.
The amount of carbon formed over 24 h of TOS obtained for the catalysts is shown in Table 4.
All samples showed a low rate of carbon formation between 0.20 and 0.36 mgC·gcat−1·h−1. Table 3 also presents the carbon formation rates reported in the literature for various Ni catalysts supported on ceria [38,46,47,48]. These studies show that carbon deposition during DRM is influenced by multiple factors, such as Ni particle size, catalyst composition, synthesis method, and reaction conditions. Due to these variations, a direct comparison with literature data is not straightforward. To allow for more consistent analysis, only catalysts with similar initial methane conversions (between 66% and 75%) were considered. Within this range, carbon formation rates still vary significantly from as low as 0.4 mgC·gcat−1·h−1 (for 5%Ni/Ce0.5Pr0.5O2 calcined at 750 °C) to as high as 200 mgC·gcat−1·h−1 (for a Ni/Ce–Al2O3 catalyst calcined at 600 °C).
The Ni/Ce0.2Pr0.8 catalyst developed in the present study showed a comparable initial CH4 conversion (72%), while maintaining one of the lowest carbon formation rates (0.36 mgC·gcat−1·h−1), despite being calcined at higher temperature. These results demonstrate high resistance to carbon deposition under DRM conditions.
Given that the initial conversion values for the catalysts studied in this work varied among the samples, the carbon formation rate was normalized by the number of moles of methane converted (mol CH4 conv) to allow for a more accurate analysis. When considering the carbon formation normalized in this way, it is evident that, despite the small amounts of carbon formed overall, the sample containing 50 mol% Pr exhibited the lowest carbon formation (0.15 mgC·gcat−1·h−1. molCH4conv−1). The undoped sample and those containing 20 and 80 mol% Pr showed similar carbon formation values (0.23–0.19 mgC·g_cat−1·h−1·mol_CH4conv−1), which were slightly higher than that observed for the 50 mol% Pr sample.
According to the proposed mechanism for carbon formation on hydrocarbon reforming reactions [61,62], initially, highly reactive carbon species (Cα) are produced from the dissociation of methane on the nickel surface. Cα species can undergo gasification, forming CO. However, if the gasification rate is low or excess Cα species are formed, the carbon can undergo polymerization, generating Cβ species. These species are less reactive and can lead to the occurrence of two processes: (i) encapsulation of the particle, causing the deactivation of the catalyst, and (ii) formation of carbon filaments, which occurs through the dissolution of the Cβ species in the nickel particles. The formation of carbon filaments does not lead to an immediate deactivation of the catalyst, since the surface of the metallic particle remains free for the reaction. While filamentous carbon does not immediately block active sites, its progressive accumulation may lead to mechanical degradation (e.g., cracking or delamination of the catalytic layer) and hinder mass transfer by obstructing pore networks or displacing active metal particles. Therefore, controlling its formation is important to ensure long-term structural and catalytic stability.
The size of nickel crystallites plays an important role in the nucleation and growth of carbon layers. The formation of these layers is favored over a minimum number of atoms. Thus, there is a critical size for the nickel particles, above which the accumulation of carbon occurs. Then, to avoid carbon formation, the size of the Ni crystallites should be kept at a value lower than this critical size [63]. The presence of large Ni crystallites would favor carbon production.
Some authors [64,65] showed that very large metallic particles can also prevent the formation of carbon. Chen et al. [65] studied the behavior of Ni catalysts supported on hydrotalcites, CaAl2O4 and α-Al2O3 during the decomposition of methane. They observed that the formation of carbon is favored when the size of the metallic particles is between 20 and 40 nm. They also concluded that carbon production is inhibited for particles smaller than 10 nm and for very large particles. In addition, Toebes et al. [66] did not detect the formation of carbon filaments during the decomposition of methane, using bulk NiO.
Most studies that explore how the size of Ni particles affects carbon buildup during DRM [48,59,67,68] do not consider catalysts with very large particles (over 100 nm), which are typically found in catalytic layers of SOFC anodes [15].
Da Fonseca et al. [38] investigated the effect of the metallic Ni crystallite size on carbon formation during the dry reforming of methane under the same reaction conditions used in the present work. The results showed that the rate of carbon formation initially increases with Ni crystallite size, reaching a maximum around 20–30 nm, and then gradually decreases with further growth in the metallic particles, up to 133 nm. This behavior indicates the existence of a critical Ni crystallite size for carbon formation on Ni/CeO2 catalysts, at which the highest carbon deposition occurs. In that study, Ni/CeO2 catalysts with Ni0 crystallite sizes ranging from 10 to 132 nm were evaluated. It was observed that the carbon formation rate decreased from 5.9 to 0.0 mgC·gcat−1·h−1 as the crystallite size increased from 46 to 132 nm.
In the present work, the catalysts exhibited a large Ni0 crystallite size (63 to 113 nm) and low carbon formation rates (0.20–0.36 mgC·gcat−1·h−1). These values are consistent with the previously observed trend and reinforce the correlation between larger Ni crystallite sizes and reduced carbon formation under DRM conditions. Regarding the Ni/Ce0.5Pr0.5 sample, the minimum carbon formation observed suggests that the presence of NiO and Ni0 species, resulting from the oxidation of metallic Ni particles by CO2, may also have contributed to the reduced carbon formation in this sample.
For catalysts with larger Ni crystallites, the CH4 dissociation rate is likely lower, which may help suppress carbon accumulation [38]. However, the presence of oxygen vacancies in ceria does not significantly aid in removing carbon from the Ni surface due to the weaker metal–support interaction associated with larger Ni particles [38].
Since all samples exhibited low carbon formation, the most promising material for catalytic anodic layers in DIR-SOFCs fueled by CH4 and CO2 is the sample containing 80 mol% Pr, likely due to its higher methane conversion and greater stability during the catalytic tests.

4. Conclusions

This study investigated the effect of Pr content on the catalyst’s crystalline structure, support reducibility, and stability during DRM. The reducibility of the catalysts was enhanced by the increase in Pr loading. However, higher Pr content led to the formation of PrOx, indicating phase segregation. Furthermore, increasing Pr loading favored the formation of Pr2NiO4, in addition to the NiO phase after calcination, especially in the sample with the highest Pr content. The reduction of Pr2NiO4 could have contributed to the decrease in the metallic Ni crystallite size in this catalyst.
DRM stability tests and the characterization of spent catalysts revealed that all catalysts exhibited very low carbon formation, likely due to the large metallic Ni particles. The lowest carbon deposition was observed for the sample containing 50 mol% Pr. However, this catalyst was not stable during the reaction, exhibiting significant deactivation followed by continuous activation. XRD analysis after exposure to a CO2 stream suggests the occurrence of metallic Ni particle oxidation by CO2 from the feed, which leads to the initial deactivation followed by activation observed for this sample. This behavior is consistent with the results obtained in the literature for Ni catalysts [16,17,54]. The addition of 80 mol% Pr led to higher methane conversion and improved catalyst stability. The lack of an activation phase in this sample is attributed to its enhanced reducibility, as evidenced by TPR analyses. These results indicate that, under reaction conditions, the support underwent preferential oxidation, which likely helped preserve the metallic Ni phase from oxidation, as previously reported in the literature for Ni supported on ceria-based oxides [16].
This study stands out from previous research by demonstrating that Ni supported on ceria doped with 80 mol% of Pr has potential as a catalyst layer for anodes in DIR-SOFCs fueled by CH4 and CO2 mixtures. Although the catalyst exhibited high performance and stability under DRM conditions in a fixed-bed reactor, its electrochemical behavior under actual DIR-SOFC operating conditions has not yet been evaluated. Future studies should include long-term stability tests under realistic feed compositions, as well as electrochemical testing in single-cell SOFC configurations to confirm the material’s suitability for practical applications.

Supplementary Materials

The following supporting information can be downloaded at: https://www.mdpi.com/article/10.3390/pr13072119/s1, Figure S1: TEM and EDS analyses for Ni/Ce0.8Pr0.2: Ni: green; Ce: red; Figure S2: TEM and EDS analyses for Ni/Ce0.5Pr0.5: Ni: green; Ce: red; Figure S3: Diffractograms obtained by in situ XRD analyses of Ni/Ce0.8Pr0.2 at: (a) 2θ range = 20–100°; (b) 2θ = 25–50° and (c) (2θ = 27–29°) (●) CeO2, (○) Ce11O20, (♦) Ce7O12, (▲) Pr2O3 (□) NiO and (■) Ni; Figure S4: Diffractograms obtained by in situ XRD analyses of Ni/Ce0.5Pr0.5 at: (a) 2θ range = 20–100°; (b) 2θ = 25–50° and (c) 2θ = 27–29° (●) CeO2, (○) Ce11O20, (♦) Ce7O12, (▲) Pr2O3 (□) NiO and (■) Ni; Figure S5: Diffractograms obtained by in situ XRD analyses of Ni/Pr at: (a) 2θ range = 10–90°; (b) 2θ = 25–50° and (c) 2θ = 43–45° (∆) Pr12O22, (◊) Pr2NiO4, (▲) Pr2O3(a) (cubic phase), (▼) Pr2O3(b) (hexagonal phase) e (■) Ni; Figure S6: CO2 conversion versus TOS obtained during DRM at 800 °C (CH4/CO2 molar ratio of 1.00) over all catalysts; Figure S7: Catalytic test of Ni/Ce with error bars at 800 °C (CH4/CO2 molar ratio of 1.00); Figure S8: CO selectivity versus TOS obtained during DRM at 800 °C (CH4/CO2 molar ratio of 1.00) over all catalysts; Figure S9: H2O selectivity versus TOS obtained during DRM at 800 °C (CH4/CO2 molar ratio of 1.00) over all catalysts; Figure S10: TPO profiles of the spent catalysts; Figure S11: SEM images of Ni/Ce and Ni/Ce0.2Pr0.8 after DRM at 800 °C.

Author Contributions

Conceptualization, F.B.N. and L.V.M.; methodology, R.C.R.-N. and Y.X.; validation, A.d.C.P.G. and R.O.d.F.; investigation, A.R.P. and Y.X.; data curation, A.R.P.; visualization, A.d.C.P.G. and R.O.d.F.; writing—original draft preparation, A.A.A.S. and A.d.C.P.G.; writing—review and editing, F.B.N. and L.V.M.; funding acquisition, L.V.M.; project administration, A.A.A.S.; supervision, L.V.M. All authors have read and agreed to the published version of the manuscript.

Funding

This research was funded by COORDENAÇÃO DE APERFEIÇOAMENTO DE NÍVEL SUPERIOR, grant number CAPES—Finance code 001; FUNDAÇÃO DE AMPARO À PESQUISA DO ESTADO DO RIO DE JANEIRO, grant number E-26/010.001861/2015 and E-26/010.001444/2019.

Data Availability Statement

The data presented in this study are available in the article and in the Supplementary Materials.

Acknowledgments

The authors thank the Coordenação de Aperfeiçoamento de Pessoal de Nível Superior [CAPES—Finance code 001], the Fundação de Amparo à Pesquisa do Estado do Rio de Janeiro—FAPERJ [E-26/010.001861/2015, E-26/010.001444/2019] for scholarship and financial support. The group thanks the LNLS for the assigned time at XRD1 beamlines and the Centro de Caracterização Avançada para Indústria de Petróleo (CAIPE) for the TEM analyses.

Conflicts of Interest

The authors declare no conflicts of interest.

Abbreviations

The following abbreviations are used in this manuscript:
DIR-SOFCDirect Internal Reforming Solid Oxide Fuel Cell
DRMDry Reforming of Methane
XRDX-ray diffraction
SEMScanning Electron Microscopy
TPRTemperature-programmed Reduction
TEMTransmission Electron Microscopy
TPOTemperature-programmed Oxidation

References

  1. Veiga, S.; Romero, M.; Faccio, R.; Segobia, D.; Apesteguía, C.; Laura Pérez, A.; Dante Brondino, C.; Bussi, J. Biogas Dry Reforming over Ni-La-Ti Catalysts for Synthesis Gas Production: Effects of Preparation Method and Biogas Composition. Fuel 2023, 346, 128300. [Google Scholar] [CrossRef]
  2. Escudero, M.J.; Valero, C.; Cauqui, M.Á.; Goma, D.; Yeste, M.P. Ni-Ce-ZrO2 System as Anode Material for Direct Internal Reforming Biogas Solid Oxide Fuel Cells. Fuel 2022, 322, 124247. [Google Scholar] [CrossRef]
  3. Rayner, A.J.; Briggs, J.; Tremback, R.; Clemmer, R.M.C. Design of an Organic Waste Power Plant Coupling Anaerobic Digestion and Solid Oxide Fuel Cell Technologies. Renew. Sustain. Energy Rev. 2017, 71, 563–571. [Google Scholar] [CrossRef]
  4. Reeping, K.W.; Bohn, J.A.; Walker, R.A. Chlorine-Induced Degradation in SOFCs Operating with Biogas. Sustain. Energy Fuels 2017, 1, 1320–1328. [Google Scholar] [CrossRef]
  5. Saadabadi, S.A.; Thallam Thattai, A.; Fan, L.; Lindeboom, R.E.F.; Spanjers, H.; Aravind, P.V. Solid Oxide Fuel Cells Fuelled with Biogas: Potential and Constraints. Renew. Energy 2019, 134, 194–214. [Google Scholar] [CrossRef]
  6. Papurello, D.; Silvestri, S.; Modena, S. Biogas Trace Compounds Impact on High-Temperature Fuel Cells Short Stack Performance. Int. J. Hydrogen Energy 2021, 46, 8792–8801. [Google Scholar] [CrossRef]
  7. Bochentyn, B.; Chlipała, M.; Gazda, M.; Wang, S.-F.; Jasiński, P. Copper and Cobalt Co-Doped Ceria as an Anode Catalyst for DIR-SOFCs Fueled by Biogas. Solid State Ion. 2019, 330, 47–53. [Google Scholar] [CrossRef]
  8. Tsipis, E.V.; Matveev, D.V.; Sharafutdinov, A.U.; Yalovenko, D.V.; Samoilov, A.V.; Fedotov, Y.S.; Dyakina, M.S.; Zhigacheva, D.V.; Agarkov, D.A.; Bredikhin, S.I.; et al. Performance of SOFCs Using Model Waste Gases: A Case Study. Fuel 2024, 358, 130129. [Google Scholar] [CrossRef]
  9. Illathukandy, B.; Saadabadi, S.A.; Kuo, P.-C.; Wasajja, H.; Lindeboom, R.E.F.; Vijay, V.K.; Aravind, P.V. Solid Oxide Fuel Cells (SOFCs) Fed with Biogas Containing Hydrogen Chloride Traces: Impact on Direct Internal Reforming and Electrochemical Performance. Electrochim. Acta 2022, 433, 141198. [Google Scholar] [CrossRef]
  10. Singh, M.; Zappa, D.; Comini, E. Solid Oxide Fuel Cell: Decade of Progress, Future Perspectives and Challenges. Int. J. Hydrogen Energy 2021, 46, 27643–27674. [Google Scholar] [CrossRef]
  11. da Silva, F.S.; de Souza, T.M. Novel Materials for Solid Oxide Fuel Cell Technologies: A Literature Review. Int. J. Hydrogen Energy 2017, 42, 26020–26036. [Google Scholar] [CrossRef]
  12. Piroonlerkgul, P.; Laosiripojana, N.; Adesina, A.A.; Assabumrungrat, S. Performance of Biogas-Fed Solid Oxide Fuel Cell Systems Integrated with Membrane Module for CO2 Removal. Chem. Eng. Process. Process Intensif. 2009, 48, 672–682. [Google Scholar] [CrossRef]
  13. Chen, T.; Wang, W.G.; Miao, H.; Li, T.; Xu, C. Evaluation of Carbon Deposition Behavior on the Nickel/Yttrium-Stabilized Zirconia Anode-Supported Fuel Cell Fueled with Simulated Syngas. J. Power Sources 2011, 196, 2461–2468. [Google Scholar] [CrossRef]
  14. Li, Y.; Pang, Y.; Tu, H.; Torrigino, F.; Biollaz, S.M.A.; Li, Z.; Huang, Y.; Yin, X.; Grimm, F.; Karl, J. Impact of Syngas from Biomass Gasification on Solid Oxide Fuel Cells: A Review Study for the Energy Transition. Energy Convers. Manag. 2021, 250, 114894. [Google Scholar] [CrossRef]
  15. da Silva, A.A.A.; Steil, M.C.; Tabuti, F.N.; Rabelo-Neto, R.C.; Noronha, F.B.; Mattos, L.V.; Fonseca, F.C. The Role of the Ceria Dopant on Ni / Doped-Ceria Anodic Layer Cermets for Direct Ethanol Solid Oxide Fuel Cell. Int. J. Hydrogen Energy 2021, 46, 4309–4328. [Google Scholar] [CrossRef]
  16. Faria, E.C.; Neto, R.C.R.; Colman, R.C.; Noronha, F.B. Hydrogen Production through CO2 Reforming of Methane over Ni/CeZrO2/Al2O3 Catalysts. Catal. Today 2014, 228, 138–144. [Google Scholar] [CrossRef]
  17. Rabelo-Neto, R.C.; Sales, H.B.E.; Inocêncio, C.V.M.; Varga, E.; Oszko, A.; Erdohelyi, A.; Noronha, F.B.; Mattos, L.V. CO2 Reforming of Methane over Supported LaNiO3 Perovskite-Type Oxides. Appl. Catal. B 2018, 221, 349–361. [Google Scholar] [CrossRef]
  18. da Silva, A.A.A.; Bion, N.; Epron, F.; Baraka, S.; Fonseca, F.C.; Rabelo-Neto, R.C.; Mattos, L.V.; Noronha, F.B. Effect of the Type of Ceria Dopant on the Performance of Ni/CeO2 SOFC Anode for Ethanol Internal Reforming. Appl. Catal. B 2017, 206, 626–641. [Google Scholar] [CrossRef]
  19. Adjah-Tetteh, C.; Wang, Y.; Niaz, A.K.; Jia, Z.; Zhou, X.-D. Understanding the Physical Properties of Pr-Gd Co-Doped Ceria and Its Role as the Interlayer in Solid Oxide Cells. ECS Meet. Abstr. 2023, MA2023-01, 252. [Google Scholar] [CrossRef]
  20. Wang, H.; Chroneos, A.; Schwingenschlögl, U. Impact of Doping on the Ionic Conductivity of Ceria: A Comprehensive Model. J. Chem. Phys. 2013, 138, 224705. [Google Scholar] [CrossRef]
  21. Grope, B.O.H.; Zacherle, T.; Nakayama, M.; Martin, M. Oxygen Ion Conductivity of Doped Ceria: A Kinetic Monte Carlo Study. Solid State Ion. 2012, 225, 476–483. [Google Scholar] [CrossRef]
  22. Lyu, Z.; Wang, Y.; Zhang, Y.; Han, M. Solid Oxide Fuel Cells Fueled by Simulated Biogas: Comparison of Anode Modification by Infiltration and Reforming Catalytic Layer. Chem. Eng. J. 2020, 393, 124755. [Google Scholar] [CrossRef]
  23. Błaszczak, P.; Łapiński, M.; Wang, S.-F.; Jasiński, P.; Bochentyn, B. Exsolution of Ni Nanoparticles on the Surface of Cerium and Nickel Co-Doped Lanthanum Strontium Titanate as a New Anodic Layer for DIR-SOFC. Anti-Coking Potential and H2S Poisoning Resistance of the Prepared Material. Int. J. Hydrogen Energy 2020, 45, 29186–29200. [Google Scholar] [CrossRef]
  24. da Fonseca, R.O.; da Silva, A.A.A.; Signorelli, M.R.M.; Rabelo-Neto, R.C.; Noronha, F.B.; Simões, R.C.C.; Mattos, L.V. Nickel/Doped Ceria Solid Oxide Fuel Cell Anodes for Dry Reforming of Methane. J. Braz. Chem. Soc. 2014, 25, 235–2363. [Google Scholar] [CrossRef]
  25. Modafferi, V.; Panzera, G.; Baglio, V.; Frusteri, F.; Antonucci, P.L. Propane Reforming on Ni–Ru/GDC Catalyst: H2 Production for IT-SOFCs under SR and ATR Conditions. Appl. Catal. A Gen. 2008, 334, 1–9. [Google Scholar] [CrossRef]
  26. Vasiliades, M.A.; Makri, M.M.; Djinović, P.; Erjavec, B.; Pintar, A.; Efstathiou, A.M. Dry Reforming of Methane over 5 wt% Ni/Ce1–XPrxO2–δ Catalysts: Performance and Characterisation of Active and Inactive Carbon by Transient Isotopic Techniques. Appl. Catal. B 2016, 197, 168–183. [Google Scholar] [CrossRef]
  27. Dogdibegovic, E.; Wang, Y.; Wright, C.J.; Zhou, X.-D. Origin for Retained Activity in Pr2NiO4 While Undergoing Substantial Phase Transformation in a Long-Term Solid Oxide Cell Operation. Nano Energy 2022, 103, 107684. [Google Scholar] [CrossRef]
  28. Krishna, K.; Bueno-López, A.; Makkee, M.; Moulijn, J.A. Potential Rare-Earth Modified CeO2 Catalysts for Soot Oxidation. Appl. Catal. B 2007, 75, 210–220. [Google Scholar] [CrossRef]
  29. Krishna, K.; Bueno-López, A.; Makkee, M.; Moulijn, J.A. Potential Rare-Earth Modified CeO2 Catalysts for Soot Oxidation Part II: Characterisation and Catalytic Activity with NO + O2. Appl. Catal. B 2007, 75, 201–209. [Google Scholar] [CrossRef]
  30. Mahato, N.; Banerjee, A.; Gupta, A.; Omar, S.; Balani, K. Progress in Material Selection for Solid Oxide Fuel Cell Technology: A Review. Prog. Mater. Sci. 2015, 72, 141–337. [Google Scholar]
  31. Stagg-Williams, S.M.; Noronha, F.B.; Fendley, G.; Resasco, D.E. CO2 Reforming of CH4 over Pt/ZrO2 Catalysts Promoted with La and Ce Oxides. J. Catal. 2000, 194, 240–249. [Google Scholar] [CrossRef]
  32. Ahn, K.; Yoo, D.S.; Prasad, D.H.; Lee, H.-W.; Chung, Y.-C.; Lee, J.-H. Role of Multivalent Pr in the Formation and Migration of Oxygen Vacancy in Pr-Doped Ceria: Experimental and First-Principles Investigations. Chem. Mater. 2012, 24, 4261–4267. [Google Scholar] [CrossRef]
  33. Chiba, R.; Taguchi, H.; Komatsu, T.; Orui, H.; Nozawa, K.; Arai, H. High Temperature Properties of Ce1–XPrxO2–δ as an Active Layer Material for SOFC Cathodes. Solid State Ion. 2011, 197, 42–48. [Google Scholar] [CrossRef]
  34. Fan, M.S.; Abdullah, A.Z.; Bhatia, S. Catalytic Technology for Carbon Dioxide Reforming of Methane to Synthesis Gas. ChemCatChem 2009, 1, 192–208. [Google Scholar] [CrossRef]
  35. Wang, S.; Kato, T.; Nagata, S.; Honda, T.; Kaneko, T.; Iwashita, N.; Dokiya, M. Ni/Ceria Cermet as Anode of Reduced-Temperature Solid Oxide Fuel Cells. J. Electrochem. Soc. 2002, 149, A927. [Google Scholar] [CrossRef]
  36. Bekheet, M.F.; Grünbacher, M.; Schlicker, L.; Gili, A.; Doran, A.; Epping, J.D.; Gurlo, A.; Klötzer, B.; Penner, S. On the Structural Stability of Crystalline Ceria Phases in Undoped and Acceptor-Doped Ceria Materials under in Situ Reduction Conditions. CrystEngComm 2019, 21, 145–154. [Google Scholar] [CrossRef] [PubMed]
  37. Kümmerle, E.A.; Heger, G. The Structures of C–Ce2O3+δ, Ce7O12, and Ce11O20. J. Solid State Chem. 1999, 147, 485–500. [Google Scholar] [CrossRef]
  38. da Fonseca, R.O.; Ponseggi, A.R.; Rabelo-Neto, R.C.; Simões, R.C.C.; Mattos, L.V.; Noronha, F.B. Controlling Carbon Formation over Ni/CeO2 Catalyst for Dry Reforming of CH4 by Tuning Ni Crystallite Size and Oxygen Vacancies of the Support. J. CO2 Util. 2022, 57, 101880. [Google Scholar] [CrossRef]
  39. Tarutin, A.; Lyagaeva, J.; Farlenkov, A.; Plaksin, S.; Vdovin, G.; Demin, A.; Medvedev, D. A Reversible Protonic Ceramic Cell with Symmetrically Designed Pr2NiO4+δ-Based Electrodes: Fabrication and Electrochemical Features. Materials 2018, 12, 118. [Google Scholar] [CrossRef]
  40. Osinkin, D.A. Precursor of Pr2NiO4+δ as a Highly Effective Catalyst for the Simultaneous Promotion of Oxygen Reduction and Hydrogen Oxidation Reactions in Solid Oxide Electrochemical Devices. Int. J. Hydrogen Energy 2021, 46, 24546–24554. [Google Scholar] [CrossRef]
  41. Dong, W.S.; Roh, H.S.; Jun, K.W.; Park, S.E.; Oh, Y.S. Methane Reforming over Ni/Ce-ZrO2 Catalysts: Effect of Nickel Content. Appl. Catal. A Gen. 2002, 226, 63–72. [Google Scholar] [CrossRef]
  42. Augusto, B.L.; Costa, L.O.O.; Noronha, F.B.; Colman, R.C.; Mattos, L.V. Ethanol Reforming over Ni/CeGd Catalysts with Low Ni Content. Int. J. Hydrogen Energy 2012, 37, 12258–12270. [Google Scholar] [CrossRef]
  43. Yao, H.C.; Yao, Y.F.Y. Ceria in Automotive Exhaust Catalysts. I. Oxygen Storage. J. Catal. 1984, 86, 254–265. [Google Scholar] [CrossRef]
  44. Ahn, K.; He, H.; Vohs, J.M.; Gorte, R.J. Enhanced Thermal Stability of SOFC Anodes Made with CeO2-ZrO2 Solutions. Electrochem. Solid-State Lett. 2005, 8, A414. [Google Scholar] [CrossRef]
  45. Zoellner, M.H.; Niu, G.; Jhang, J.-H.; Schaefer, A.; Zaumseil, P.; Bäumer, M.; Schroeder, T. Temperature-Dependent Reduction of Epitaxial Ce1–xPrxO2–δ (x = 0–1) Thin Films on Si(111): A Combined Temperature-Programmed Desorption, X-Ray Diffraction, X-Ray Photoelectron Spectroscopy, and Raman Study. J. Phys. Chem. C 2013, 117, 24851–24857. [Google Scholar] [CrossRef]
  46. Muñoz, M.A.; Calvino, J.J.; Rodríguez-Izquierdo, J.M.; Blanco, G.; Arias, D.C.; Pérez-Omil, J.A.; Hernández-Garrido, J.C.; González-Leal, J.M.; Cauqui, M.A.; Yeste, M.P. Highly Stable Ceria-Zirconia-Yttria Supported Ni Catalysts for Syngas Production by CO2 Reforming of Methane. Appl. Surf. Sci. 2017, 426, 864–873. [Google Scholar] [CrossRef]
  47. Marinho, A.L.A.; Toniolo, F.S.; Noronha, F.B.; Epron, F.; Duprez, D.; Bion, N. Highly Active and Stable Ni Dispersed on Mesoporous CeO2-Al2O3 Catalysts for Production of Syngas by Dry Reforming of Methane. Appl. Catal. B 2021, 281, 119459. [Google Scholar] [CrossRef]
  48. Marinho, A.L.A.; Rabelo-Neto, R.C.; Epron, F.; Bion, N.; Toniolo, F.S.; Noronha, F.B. Embedded Ni Nanoparticles in CeZrO2 as Stable Catalyst for Dry Reforming of Methane. Appl. Catal. B 2020, 268, 118387. [Google Scholar] [CrossRef]
  49. Luisetto, I.; Tuti, S.; Romano, C.; Boaro, M.; Di Bartolomeo, E.; Kesavan, J.K.; Kumar, S.S.; Selvakumar, K. Dry Reforming of Methane over Ni Supported on Doped CeO2: New Insight on the Role of Dopants for CO2 Activation. J. CO2 Util. 2019, 30, 63–78. [Google Scholar] [CrossRef]
  50. Luisetto, I.; Tuti, S.; Battocchio, C.; Lo Mastro, S.; Sodo, A. Ni/CeO2–Al2O3 Catalysts for the Dry Reforming of Methane: The Effect of CeAlO3 Content and Nickel Crystallite Size on Catalytic Activity and Coke Resistance. Appl. Catal. A Gen. 2015, 500, 12–22. [Google Scholar] [CrossRef]
  51. Pu, Z.; Liu, Q.; Chen, C.; Wang, F. Promoting Surface Lattice Oxygen and Oxygen Vacancy of CeO2 for Photothermal Methane Dry Reforming over Ni/CeO2 Catalysts. Chem. Eng. J. 2024, 497, 154861. [Google Scholar] [CrossRef]
  52. Gonzalez-Delacruz, V.M.; Ternero, F.; Pereñíguez, R.; Caballero, A.; Holgado, J.P. Study of Nanostructured Ni/CeO2 Catalysts Prepared by Combustion Synthesis in Dry Reforming of Methane. Appl. Catal. A Gen. 2010, 384, 1–9. [Google Scholar] [CrossRef]
  53. Cozendey da Silva, H.N.; Prata, D.M.; Alves Lima, G.B.; Zotes, L.P.; Mattos, L.V. A Techno-Economic Evaluation of the Energy Generation by Proton Exchange Membrane Fuel Cell Using Biogas Reforming. J. Clean. Prod. 2018, 200, 598–608. [Google Scholar] [CrossRef]
  54. Takanabe, K.; Nagaoka, K.; Nariai, K.; Aika, K. Influence of Reduction Temperature on the Catalytic Behavior of Co/TiO2 Catalysts for CH4/CO2 Reforming and Its Relation with Titania Bulk Crystal Structure. J. Catal. 2005, 230, 75–85. [Google Scholar] [CrossRef]
  55. Zhdanov, V.P.; Kasemo, B. Cabrera–Mott Kinetics of Oxidation of Nm-Sized Metal Particles. Chem. Phys. Lett. 2008, 452, 285–288. [Google Scholar] [CrossRef]
  56. Chernavskii, P.A.; Pankina, G.V.; Chernavskii, A.P.; Peskov, N.V.; Afanasiev, P.; Perov, N.S.; Tennov, V.A. In Situ Magnetic Study of the Low-Temperature Oxidation of Carbon-Supported Cobalt Nanoparticles. J. Phys. Chem. C 2007, 111, 5576–5581. [Google Scholar] [CrossRef]
  57. Wang, F.; Xu, L.; Zhang, J.; Zhao, Y.; Li, H.; Li, H.X.; Wu, K.; Xu, G.Q.; Chen, W. Tuning the Metal-Support Interaction in Catalysts for Highly Efficient Methane Dry Reforming Reaction. Appl. Catal. B 2016, 180, 511–520. [Google Scholar] [CrossRef]
  58. Rezaei, M.; Alavi, S.M.; Sahebdelfar, S.; Yan, Z.-F. Syngas Production by Methane Reforming with Carbon Dioxide on Noble Metal Catalysts. J. Nat. Gas Chem. 2006, 15, 327–334. [Google Scholar] [CrossRef]
  59. Damaskinos, C.M.; Zavašnik, J.; Djinović, P.; Efstathiou, A.M. Dry Reforming of Methane over Ni/Ce0.8Ti0.2O2–δ: The Effect of Ni Particle Size on the Carbon Pathways Studied by Transient and Isotopic Techniques. Appl. Catal. B 2021, 296, 120321. [Google Scholar] [CrossRef]
  60. Liang, W.; Yan, H.; Chen, C.; Lin, D.; Tan, K.; Feng, X.; Liu, Y.; Chen, X.; Yang, C.; Shan, H. Revealing the Effect of Nickel Particle Size on Carbon Formation Type in the Methane Decomposition Reaction. Catalysts 2020, 10, 890. [Google Scholar] [CrossRef]
  61. Rostrup-Nielsen, J.; Trimm, D.L. Mechanisms of Carbon Formation on Nickel-Containing Catalysts. J. Catal. 1977, 48, 155–165. [Google Scholar] [CrossRef]
  62. Trimm, D.L. Catalysts for the Control of Coking during Steam Reforming. Catal. Today 1999, 49, 3–10. [Google Scholar] [CrossRef]
  63. Bengaard, H.S.; Nørskov, J.K.; Sehested, J.; Clausen, B.S.; Nielsen, L.P.; Molenbroek, A.M.; Rostrup-Nielsen, J.R. Steam Reforming and Graphite Formation on Ni Catalysts. J. Catal. 2002, 209, 365–384. [Google Scholar] [CrossRef]
  64. Li, D.; Nakagawa, Y.; Tomishige, K. Methane Reforming to Synthesis Gas over Ni Catalysts Modified with Noble Metals. Appl. Catal. A Gen. 2011, 408, 1–24. [Google Scholar] [CrossRef]
  65. Chen, D.; Christensen, K.; Ochoafernandez, E.; Yu, Z.; Totdal, B.; Latorre, N.; Monzon, A.; Holmen, A. Synthesis of Carbon Nanofibers: Effects of Ni Crystal Size during Methane Decomposition. J. Catal. 2005, 229, 82–96. [Google Scholar] [CrossRef]
  66. Toebes, M. Impact of the Structure and Reactivity of Nickel Particles on the Catalytic Growth of Carbon Nanofibers. Catal. Today 2002, 76, 33–42. [Google Scholar] [CrossRef]
  67. Minh, N.Q. Ceramic Fuel Cells. J. Am. Ceram. Soc. 1993, 76, 563–588. [Google Scholar] [CrossRef]
  68. Vogt, C.; Kranenborg, J.; Monai, M.; Weckhuysen, B.M. Structure Sensitivity in Steam and Dry Methane Reforming over Nickel: Activity and Carbon Formation. ACS Catal. 2020, 10, 1428–1438. [Google Scholar] [CrossRef]
Figure 1. XRD patterns of calcined samples at 2θ range = 20–60°. (---) CeO2, (Δ) Pr12O22, (□) NiO and (♦) Pr2NiO4.
Processes 13 02119 g001
Figure 2. XRD patterns of calcined samples at 2θ range = 27.5–29.3°. (---) CeO2 (Δ) Pr12O22 and (♦) Pr2NiO4.
Processes 13 02119 g002
Figure 3. TEM images with corresponding EDXS elemental mapping for Ni/Ce.
Processes 13 02119 g003
Figure 4. TEM images with corresponding EDXS elemental mapping for Ni/Ce0.2Pr0.8.
Processes 13 02119 g004
Figure 5. Diffractograms obtained by in situ XRD analyses of Ni/Ce at: (a) 2θ range = 20–100° and (b) 2θ = 25–50°. (●) CeO2, (○) Ce11O20, (♦) Ce7O12, (*) CeO1.67, (□) NiO and (■) Ni.
Processes 13 02119 g005
Figure 6. Diffractograms obtained by in situ XRD analyses of Ni/Ce0.2Pr0.8 at: (a) 2θ range = 20–100°; (b) 2θ = 25–50° and (c) 2θ = 18–20° and 27–29° (●) CeO2, (○) Ce11O20, (♦) Ce7O12, (▲) Pr2O3, (∆) Pr12O22, (◊) Pr2NiO4, (□) NiO e (■) Ni.
Processes 13 02119 g006
Figure 7. Reduction temperature at which the different phases were detected as a function of Pr loading.
Processes 13 02119 g007
Figure 8. TPR profiles for all catalysts.
Processes 13 02119 g008
Figure 9. Methane conversion versus time on stream (TOS) obtained during DRM at 800 °C (CH4/CO2 molar ratio of 1.00) over all catalysts.
Processes 13 02119 g009
Figure 10. H2/CO molar ratio versus TOS obtained during DRM at 800 °C (CH4/CO2 molar ratio of 1.00) over all catalysts.
Processes 13 02119 g010
Figure 11. X-ray diffraction patterns obtained for Ni/Ce0.5Pr0.5 catalyst after exposition of Ni/Ce0.5Pr0.5 catalyst to CO2 stream for 1 h. (●) Ce11O20, (□) NiO and (■) Ni.
Processes 13 02119 g011
Table 1. Values of lattice parameter of CeO2 and crystallite size of cerium oxides and Ni0 after calcination at 1200 °C and after reduction at 800 °C for 1 h.
CatalystLattice Parameter of Calcined Samples (Å) 1CeO2 Crystallite Sizes (nm) 2NiO Crystallite Sizes (nm) 2Ni0 Crystallite Sizes (nm) 3
Ni/Ce5.41379581116
Ni/Ce0.8Pr0.25.4155819098
Ni/Ce0.5Pr0.55.40951167873
Ni/Ce0.2Pr0.85.40501078863
1 Calculated by using the (111) CeO2 (experimental error = ±0.0008). 2 After calcination at 1200 °C. 3 After reduction at 800 °C for 1 h.
Table 2. Amount of H2 consumed and reduction degree of all catalysts obtained during TPR analyses.
CatalystReduction Degree at Low Temperature Region (T < 750 °C) (%)Reduction Degree at Low Temperature Region (T < 750 °C) (%)Total H2
Consumption (mol/g Catalyst)
Ni/Ce99322.36 × 10−3
Ni/Ce0.8Pr0.2131122.37 × 10−3
Ni/Ce0.5Pr0.5162132.91 × 10−3
Ni/Ce0.2Pr0.8231122.77 × 10−3
Table 3. Crystallite size of Ni0, initial methane conversion, and rate of carbon formation on Ni catalysts calcined at 400–1200 °C and tested in DRM at 700–800 °C with a CH4/CO2 molar ratio of 1.0 (this work and literature data).
CatalystTcalc. (°C) aTreaction (°C) bNi0 
Crystallite Size (nm)
Initial XCH4 (%) cmgC/
(gcat·h)
Reference
5%Ni/CeO240080010~661.6[38]
10%Ni/CeO240080020~6320.9[38]
10%Ni/CeO260080028~7110.6[38]
10%Ni/CeO280080046~615.9[38]
5%Ni/CeO2/YSZ50075015~1002.9[46]
10%Ni-CeAl80080011~702.0[47]
10%Ni@CeO240080019~601.6[48]
10%Ni/CeO240080033~609.7[48]
10%Ni/Ce0.2Pr0.8120080063720.36this work
10%Ni/Ce0.5Pr0.5120080073460.20this work
10%Ni/Ce0.8Pr0.2120080098560.29this work
10%Ni/Ce1200800116580.33this work
NiO1200800132370.0[38]
5%Ni/CeO2750750318014.8[26]
5%Ni/Ce0.8Pr0.2O2750750347512.0[26]
5%Ni/Ce0.5Pr0.5275075030700.4[26]
5&Ni/Ce0.2Pr0.8O275075036500.06[26]
18%Ni/CeNb80080032666.5[24]
18%Ni/CeZr80080024749.68[24]
18%Ni/CePr80080033660.42[24]
5%Ni/CeO275080024~554.8[49]
5%Ni/Zr-DC
(Zr-doped ceria)
7508009.2~553.2[49]
5%Ni/Sm-DC
(Sm-doped ceria)
75080019~380.6[49]
5%Ni/La-DC
(La-doped ceria)
75080021~450.4[49]
10%Ni/Ce/Al8008004.6~40n.d.[16]
10%Ni/Ce0.75Zr0.25O2/Al8008006.6~70n.d.[16]
10%Ni/Ce0.50Zr0.50O2/Al8008005.2~70 [16]
10%Ni/20%CeO2-Al2O3
Co-precipitation method
60080022.6~75200[50]
10%Ni/20%CeO2-Al2O3
Wet impregnation method
60080011.1~55138[50]
10%Ni/20%CeO2-Al2O3
Sol-gel method
6008009.5~5550[50]
10%Ni/20%CeO2-Al2O3
Citric acid method
6008005.8~7012.5[50]
20%Ni/CeO2-NR
(nanorods morphology)
50070020.5~450.54[51]
5%Ni/CeO2-NR
(nanorods morphology)
5007006.8~700.21[51]
3%Ni/CeO2-NR
(nanorods morphology)
5007006.2~550.50[51]
26%Ni/CeO2-ac25
Combustion method
(red./oxi. ratio = 2.5)
75075028~50n.d.[52]
13%Ni/CeO2-ac25
Combustion method
(red./oxid. ratio = 2.5)
75075015~41n.d.[52]
7%Ni/CeO2-ac25
Combustion method
(red./oxid. ratio = 2.5)
75075016~35n.d.[52]
13%Ni/CeO2-ac10
Combustion method
(red./oxid. ratio = 1.0)
75075018~65n.d.[52]
13%Ni/CeO2-ac15
Combustion method
(red./oxid. ratio = 1.5)
75075012~90n.d.[52]
a calcination temperature (°C). b reaction temperature (°C). c Initial methane conversion (%). n.d. not determined.
Table 4. Rate of carbon formation obtained by TPO analyses after DRM at 800 °C.
CatalystRate of Carbon Formation mgC/(gcat·h)Rate of Carbon Formation (mgC·gcat−1·h−1·molCH4conv−1)
Ni/Ce0.330.23
Ni/Ce0.8Pr0.20.290.19
Ni/Ce0.5Pr0.50.200.15
Ni/Ce0.2Pr0.80.360.19
Disclaimer/Publisher’s Note: The statements, opinions and data contained in all publications are solely those of the individual author(s) and contributor(s) and not of MDPI and/or the editor(s). MDPI and/or the editor(s) disclaim responsibility for any injury to people or property resulting from any ideas, methods, instructions or products referred to in the content.

