Abstract
Low Overall Equipment Effectiveness (OEE) remains a critical challenge in manufacturing, affecting productivity and operational efficiency. This study investigates the persistent issue of low OEE in the kit packing department of a South African Original Equipment Manufacturer, where frequent downtime (DT) has resulted in OEE that is consistently below 60%. Using the Define–Measure–Analyze–Improve–Control (DMAIC) methodology, this research identifies the root causes of inefficiencies before implementing corrective actions. Data analysis revealed that material-related issues (84%) and manpower issues (15%) were the primary contributors to downtime. These inefficiencies led to equipment underutilization and financial losses due to production delays and overproduction of unnecessary kits. This study significantly enhances manufacturing efficiency by addressing these root causes, leading to reduced downtime and optimized machine usage. The financial benefits include substantial cost savings and improved resource utilization. The methodology and findings are applicable across various industries, contributing to the broader field of industrial engineering. The research highlights how misalignment between production planning and execution exacerbates inefficiencies. While this paper presents findings from the Define, Measure, and Analyze phases, the Improve and Control phases will follow in future work. The results provide a foundation for developing targeted interventions to enhance OEE and manufacturing performance.
1. Introduction
In today’s competitive manufacturing environment, maximizing production efficiency is crucial for maintaining operational excellence and meeting customer demands [1]. It is therefore imperative that organizations focus their efforts on the initiatives that promote production efficiency and manufacturing excellence. This study examines a South African company based in KwaZulu Natal, an Original Equipment Manufacturer (OEM) supplying various automotive manufacturers, which faces substantial production challenges in the kit packing department. This is a result of frequent downtime caused by material availability issues and other downtimes, resulting in an Overall Equipment Effectiveness (OEE) of less than 60% over a few months. This study aims to unravel the causes of low OEE in the kit packing department through the use of the DMAIC methodology, with the intention of reducing downtime, increasing daily production, and enhancing overall productivity. By investigating material flow and production dynamics, the study seeks to identify key areas for improvement and implement sustainable measures to foster continuous advancement and reliability in manufacturing processes. As this study has not been completed yet, it proposes the actions to be implemented and an envisaged control plan.
2. Background to the Problem
The kit packing department faces significant challenges when it comes to maintaining high Overall Equipment Effectiveness (OEE) due to frequent downtimes, primarily caused by material availability issues. These challenges have resulted in an OEE of less than 60% over the past few months, indicating a substantial amount of unproductive time. Operators in the department are often able to work effectively for only 2–3 h of their shift, leading to missed daily targets and late deliveries to customers. This inefficiency has also created a backlog of overdue orders, affecting both the kit packing and final packing departments, which rely on the timely supply of fitting kits to complete orders. The department consistently obtains OEE percentages below the targeted 85%, with specific monthly values such as 32%, 38%, and 47%, as depicted in Figure 1 below.
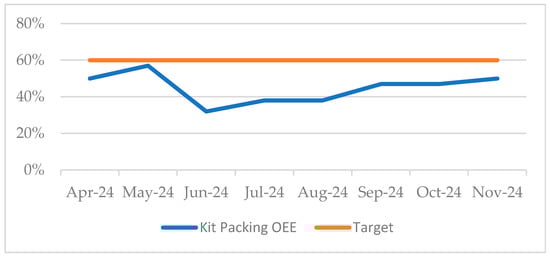
Figure 1.
Monthly attained OEE for kit packing.
The low OEE directly impacts employee productivity, leading to idle time and reduced morale. Financially, prolonged periods of low OEE have resulted in late deliveries, reduced output, and inefficient use of labor, potentially causing a loss of business as customers move to more reliable competitors. Improving OEE is crucial as it reduces downtime, optimizes machine usage, and decreases delays, leading to fewer production bottlenecks and enhanced throughput across the production chain. This broader improvement supports better resource utilization, reduces operational costs and waste, and improves overall profitability.
3. Literature Review
This section covers the fundamental concepts of OEE, as well as its three components: availability, performance, and quality. The DMAIC approach, which is utilized in this study, is also discussed. Figure 2 provides a schematic summary of the literature review. Section 3.1 and Section 3.2 provides a concise summary of the theoretical concepts and methodologies of OEE, while Section 3.3, Section 3.4, Section 3.5 and Section 3.6 cover practical case studies in which the DMAIC framework was used, aiming to provide directions for implementation grounded in this theory.
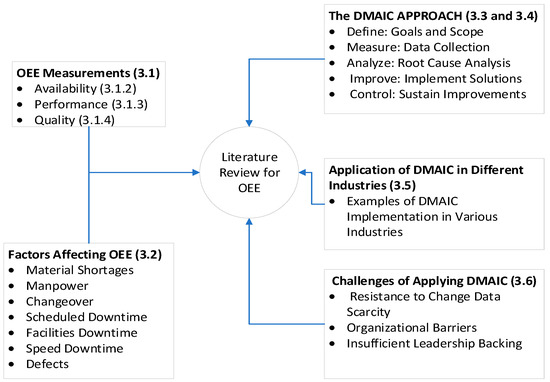
Figure 2.
Schematic representation of the literature review.
3.1. OEE and Measurements
Puvanasvaran et al. [2] state that OEE looks for production losses as well as other “hidden” or indirect costs, or those that account for a significant amount of the overall cost of production. Soltanali et al. [3] state that by returning equipment to as-good-as-new condition, the OEE estimations boost equipment performance and reduce production losses while also managing the equipment’s long-term efficacy. It is therefore apparent that proper utilization and analysis of OEE can benefit a company by identifying areas for improvement and aiding planning. Chiarini [4] states that OEE can be used as an important measure for taking into account the real output capacity of the machine compared with the output scheduled for the customers. OEE is a hierarchy of metrics used to evaluate how effectively a manufacturing operation is utilized or show how effectively equipment is utilized [5]. Soltanali et al. [3] also agrees that OEE assessment can lead to effective production planning and improvements in the availability of equipment.
3.1.1. Measurements of OEE
The OEE calculation method comprehensively analyzes the production capacity and performance loss of devices, and can accurately determine the production efficiency during the operation of equipment [6]. OEE is a pre-eminent practice for monitoring and enhancing the efficiency of manufacturing processes; for example, the efficiency of machines. It takes the most common sources of manufacturing productivity losses and places them into three main categories: availability, performance, and quality [7]. The formula for OEE is as follows:
OEE = Availability × Performance × Quality
3.1.2. Availability
Availability encompasses any events that stop planned production for a significant duration, typically several minutes, that is long enough to be logged as a traceable event [7]. Examples include equipment breakdowns, material shortages, and changeover time. Changeover time is factored into OEE analysis, as it constitutes downtime. Although eliminating changeover time might not always be feasible, it can often be minimized. The time remaining for actual operation is referred to as operating time [8]. Adithya and Anantharaj [5] explain the factors in this measurement as availability, setup losses, and breakdowns.
Singh et al. [9] provides the availability formula as follows:
Availability = (operating time-downtime)/(operating time) × 100
3.1.3. Performance
Performance considers any factors that cause the process to operate at less than its maximum possible speed during operation. Examples include machine wear, use of substandard materials, misfeeds, and operator inefficiency. The time left for actual operation after accounting for these factors is known as the net operating time. Performance losses, Minor stoppages and Speed losses. As stated by Klimecka-Tatar and Ingaldi [10], the formula for performance is
Performance = Actual Production Volume/planned Production volume
3.1.4. Quality
Quality encompasses produced pieces that fail to meet quality standards, including those requiring rework. The time left after accounting for these pieces is termed fully productive time. The objective is to maximize this fully productive time, avoiding quality losses, start-up losses, and in-process losses. The formula for quality is
Quality = (Total quantities process − Rejects)/(Total Quantities) × 100
3.2. Factors Affecting OEE
Downtime is defined as a period of time in which production machinery is not allowed to perform its output because it is not working. This could be caused by failures, setup issues, planned stops, lack of materials, etc. [11]. Downtime is also defined as the length of time for which a manufacturing process is interrupted due to an unanticipated circumstance [12]. This interruption not only impacts productivity but also increases costs and delays in meeting customer demands. OEE is significantly influenced by various factors that can lead to downtime and inefficiencies in manufacturing processes. Understanding these factors is crucial for organizations aiming to maximize their operational performance and minimize production losses. These factors include material shortages [12] [13], manpower, changeover [14], scheduled downtime [11], facilities downtime, speed downtime, and defects [14].
3.3. Using the DMAIC Approach to Improve OEE
The data-driven improvement approach known as DMAIC, or Define–Measure–Analyze–Improve–Control, is used to optimize and stabilize business processes and designs [15]. OEE can be utilized to locate process bottlenecks. Prasetyo and Veroya [16] offer a conceptual framework for applying the DMAIC method of Lean Six Sigma to OEE in a bottleneck process. The authors of [16] postulated that the productivity indices of the bottleneck process would rise with the adoption of the DMAIC approach integrated with OEE. As a secondary measure of progress, the use of OEE in conjunction with Lean Six Sigma’s DMAIC approach increased overall availability by 30% in terms of the median OEE and produced a 25% improvement in the total hit rate.
In a study by Pillay et al. [17], a company had to consider a number of strategies to reduce production losses and raise overall productivity in order to retain contracts in a market that was becoming increasingly competitive. Implementing OEE was one such initiative, aiming to lower production losses and boost productivity [17]. Due to the lack of significant and reliable historical data, the DMAIC issue solution approach was used for the OEE implementation. Downtime was reduced by 14%. A decrease in downtime has a direct impact on an organization’s OEE index; hence, a decrease in downtime would raise an organization’s OEE. Rozak et al. [18] assisted automakers who faced difficult obstacles in their efforts to shorten the amount of time needed for new products to be released and to enhance car quality. The product development process is under extreme pressure to meet these goals, which include increasing customer happiness, increasing company effectiveness, and producing higher-quality products faster and with less resources.
3.4. The DMAIC Approach
According to Tlapa-Mendoza et al. [19] the DMAIC methodology’s origins can be found in the development of Six Sigma techniques, which were introduced in the 1980s by businesses such as Motorola. The acronym DMAIC represents five different phases: Define, Measure, Analyze, Improve, and Control. Every phase is carefully crafted to lead organizations through a systematic process of identifying problems, analyzing root causes, implementing solutions, and monitoring performance. The application of DMAIC adheres to these five phases:
- Define: In this initial phase, the project goals and scope are clearly defined. According to Mittal et al. [20] this is a phase in which the problem and scope of the project is defined.
- Measure: During the Measure phase, relevant data are collected to quantify the current state of the process or system being analyzed. Key performance indicators (KPIs) are established to assess process performance and measure process outputs. This phase, according to Mittal et al. [20], is the one in which you examine the status of the problem. This phase emphasizes the importance of data accuracy and consistency to provide a baseline for comparison and analysis.
- Analyze: The Analyze phase involves an in-depth examination of collected data to identify the root causes of problems or inefficiencies within the process. Various tools and techniques, such as statistical analysis, cause-and-effect diagrams, and hypothesis testing, are utilized to uncover the underlying issues contributing to deviations from desired outcomes.
- Improve: In the Improve phase, potential solutions and interventions are developed and implemented to address the identified root causes. This phase focuses on generating creative ideas, evaluating alternative solutions, and implementing changes aimed at improving process performance. Pilot tests or simulations may be conducted to validate the effectiveness of proposed improvements prior to full-scale implementation.
- Control: The Control phase aims to ensure the sustainability of process improvements over time. Control measures and mechanisms are established to monitor process performance, detect deviations from expected outcomes, and initiate corrective actions as needed. Additionally, standard operating procedures (SOPs), training programs, and performance metrics are implemented to institutionalize the changes and prevent regression to previous states.
3.5. The Application of DMAIC in Different Industries
DMAIC is a methodology that has been implemented by various authors in different industries. Acosta-Vargas et al. [15] applied the DMAIC methodology in a business that manufactures furniture, which resulted in a significant increase in production and a decrease in delivery time, in addition to the optimization and reduction of waste. Danieli [21] utilized DMAIC in order to resolve the problem, which was the low performance of the production line in terms of OEE.
Mittal et al. [20] conducted a study aiming to illustrate a case in which the Six-Sigma DMAIC methodology was employed to diminish the rejection rate of rubber weather strips manufactured by XYZ Ltd. Following the implementation of the Six Sigma project’s findings, the daily average rejection rate of rubber weather strips decreased from 5.5% to 3.08%. This reduction resulted in a decrease from 153 rejected pieces to 68, leading to monthly savings of ZAR 15,249 in compound costs for the industry. Furthermore, within three months of implementing a single Six-Sigma project solution, the Sigma level improved from 3.9 to 4.45. Nandakumar et al. [22] conducted a study aimed at detecting and eliminating bottlenecks across different processes, with the goal of enhancing production. They utilized various techniques including DMAIC (Define, Measure, Analyze, Improve, and Control), SIPOC, VSM, ANOVA, and 5S methods. Drawing from their findings, recommendations were provided to enhance overall equipment efficiency, increase productivity, and decrease production fluctuations through lean and Six-Sigma initiatives.
3.6. Challenges of Applying DMAIC
Although DMAIC implementation is effective, it encounters challenges. These challenges are resistance to change, data scarcity, organizational barriers, and insufficient leadership backing. One of the challenges that was highlighted by Subagyo et al. [23], which is a challenge for a lot of companies, is that there is a lack of openness; employees are not well informed about DMAIC and about companies’ intentions in implementing it. Usman and Hutasoit [24] believe the challenges related to implementation are largely connected to the capabilities of the personnel involved, emphasizing the importance of selecting suitable staff and inspiring them to embrace changes in the correct manner. To deal with these challenges, organizations have adopted successful approaches, including fostering a culture of continuous improvement, providing thorough employee training, and employing technology for data collection and analysis.
DMAIC is uniquely suited to address the kit packing department’s challenges due to its structured, data-driven approach that spans problem identification, in-depth analysis, and sustainable solution development. Unlike the other tools, DMAIC integrates elements of risk assessment, process mapping, and data analysis, ensuring that improvements are evidence-based and maintained through its Control phase. This holistic methodology makes DMAIC the optimal choice for resolving the department’s key issues of material shortages, downtime, and communication barriers, leading to sustainable enhancements in OEE.
3.7. Literature Summary
This literature review covers the fundamental concepts of Overall Equipment Effectiveness (OEE) and its three components: availability, performance, and quality. It highlights the importance of OEE in identifying production losses and improving manufacturing efficiency. The review also discusses the factors affecting OEE, such as material shortages, manpower, and downtime. The DMAIC (Define–Measure–Analyze–Improve–Control) methodology is presented as a structured approach to optimize and stabilize business processes. Various studies demonstrate the successful application of DMAIC in different industries, leading to significant improvements in production efficiency and quality.
3.8. Research Gap
Despite the extensive research on OEE and DMAIC, there are a lack of studies focusing on the specific challenges faced by the kit packing department in the South African manufacturing context. This study addresses this gap by investigating the root causes of low OEE in this department and proposing targeted interventions. Additionally, while previous studies have demonstrated the effectiveness of DMAIC, there is limited research on its application in addressing material shortages and interdepartmental communication issues. This study aims to fill this gap by providing a detailed analysis and practical solutions to enhance OEE and manufacturing performance.
4. Methods
The DMAIC technique was used to analyze and reduce bottlenecks in the kit packing department, focusing on enhancing overall productivity through a structured, data-driven approach. This method systematically identifies and addresses process inefficiencies, ensuring that improvements are both effective and sustainable. By following the five phases, Define, Measure, Analyze, Improve, and Control, DMAIC provides a framework for implementing solutions that enhance process performance and predictability. It enables the identification of various potential improvements, targeting increased productivity in the kit packing process. In summary, the DMAIC methodology used in the study has 5 phases and various tools used in each phase; these are summarized in Table 1 below.

Table 1.
Summary of DMAIC phases and tools.
This study utilizes the Define–Measure–Analyze–Improve–Control (DMAIC) approach, but as the Improve and Control phases are not yet complete, this section focuses on the first three phases. During the Define phase, on-site observations were conducted to assess workflow inefficiencies, while interviews with operators and supervisors helped identify key production challenges. The scope of the study was established to focus on major inefficiencies, particularly downtime caused by material shortages, machine failures, and labor-related issues. In the Measure phase, quantitative data were collected to analyze OEE components, including Availability, Performance, and Quality. Production shift logs provided detailed records of machine downtime, while equipment monitoring data helped track stoppage frequency and duration.
The Analyze phase involved root cause identification using various analytical tools. Pareto analysis determined the most significant contributors to downtime, while a Fishbone diagram categorized issues related to material shortages, machine breakdowns, and human factors. Additionally, the 5 Whys technique was used to trace recurring production inefficiencies to their root causes. The findings revealed that material shortages accounted for 42.6% of total downtime, with machine failures contributing 25.8%, and manpower issues contributing 7.7%. Other factors, such as changeovers and defects, accounted for the remaining inefficiencies.
During the Define phase, semi-structured interviews with operators and supervisors were conducted to capture frontline perspectives on workflow inefficiencies. Their feedback was instrumental in identifying human-factor root causes (e.g., communication gaps, training deficiencies) and designing targeted solutions, such as refresher training programs and motivation initiatives. This approach aligns with best practices in DMAIC, where employee engagement is critical for sustainable improvements [1].
5. Results and Discussion
5.1. Define Phase
Figure 3 is a SIPOC diagram that illustrates the flow from kit packing suppliers (laser, press bending, powder coating) and the inputs required by the process to fulfill its function. It will help in identifying where the problem of kit packing maybe coming from. This will help guide the research on which to stream to follow on this research. The below-depicted SIPOC diagram gives an overview of the whole production process of the kit packing department.
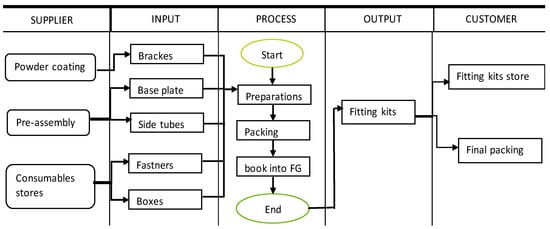
Figure 3.
SIPOC diagram for the department of kit packing showing process flow.
The goal was to improve the OEE to 60%, following a SMART approach to ensure clear, measurable progress. Key activities and deliverables were scheduled for a 3-month period, with weekly updates planned for tracking progress. The main identified risk was potential industrial strikes, and an effective management strategy was created to minimize disruptions. The project emphasizes collaboration between the project leader, support, and the production department to drive targeted improvements.
5.2. Measure Phase
Data related to low OEE were collected, focusing on factors such as downtime, rejections, and other elements that influenced production. This project prioritizes downtimes, as they are the primary constraint preventing the production line from reaching its full production potential. Additionally, attainment data were examined to assess how close the department was to achieving its production targets. Historical and current downtime data were gathered from the company’s system, with daily attainment data collected throughout the research period (Figure 4). This figure shows that material-related issues (42.6%) were the main contributors to downtime, followed by machine failures (25.8%) and manpower issues (7.7%). By differentiating these categories, the study focuses on addressing material-related inefficiencies to improve Overall Equipment Effectiveness (OEE). It is evident from the graph that material-related issues consistently posed the biggest challenge for the department. Bai et al. [6] highlight that disruptions in material supply can lead to reduced throughput and operational inefficiencies, underscoring the importance of reliable material management systemization.
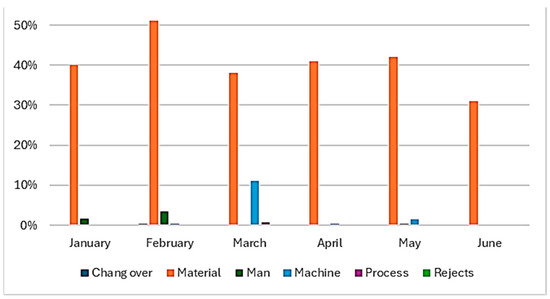
Figure 4.
Bar graph showing downtime percentages over the past 5 months.
Table 2 presents the amount of downtime experienced during a shift. The available time per shift, excluding breaks and time spent cleaning up and 5S activities, was 405 min. By multiplying this figure by the two stations in operation, the total available time per shift was calculated and found to be equal to 810 min. The data reveal that the leading contributor to downtime is the “Material” category. These findings are consistent with research by Haque et al. [12], who emphasize that material shortages can severely restrict production capacity, impacting throughput and operational efficiency. However, labeling material as the major issue is too broad and does not allow the company to draw definitive conclusions. Further investigation was needed to identify the specific material-related issues contributing to downtime, providing a clear direction for focused investigation.
Table 2.
Categories of downtime and the duration of downtime per shift.
To further analyze the impact of material and manpower downtimes on Overall Equipment Effectiveness (OEE), a regression analysis was performed on MS Excel using data from a 23-day period. The regression model was used to forecast total downtime for the next week. The model equation is as follows:
where β0 is the intercept, and β1 and β2 are the coefficients for material and manpower downtimes, respectively. The regression analysis yielded the following coefficients:
Total Downtime = β0 + β1 × Material Downtime + β2 × Manpower Downtime
Intercept (β0): 0.0000, Material Downtime (β1): 1.0000 and Manpower Downtime (β2): 1.0000.
The model demonstrated a perfect fit with an R-squared value of 1.000, indicating that material and manpower downtimes fully explain the variability in total downtime. Using the regression model, we forecasted total downtime for the next seven days. The forecasted values were as follows: Day 24: 698 min, Day 25: 710 min, Day 26: 722 min, Day 27: 734 min, Day 28: 746 min, Day 29: 758 min, Day 30: 770 min.
Figure 5 shows that the forecasted total downtime shows an increasing trend, indicating that both material and manpower downtimes are expected to continue impacting overall downtime. This highlights the need for targeted interventions to address these issues and improve OEE.
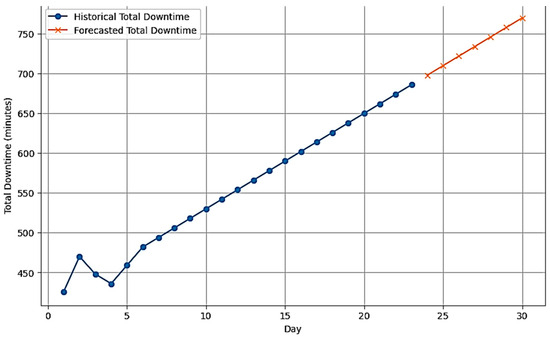
Figure 5.
Historical and forecasted downtime.
From the results, data on daily attainment were collected to understand how far from the department was from achieving its production goals. The actual output was compared with the target provided by the production planner. Figure 6 below shows the results from the attainment report.
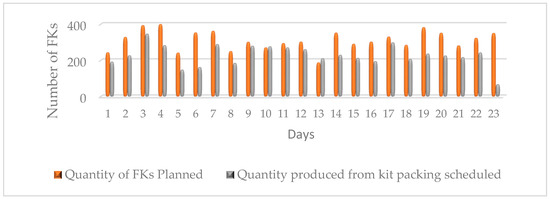
Figure 6.
Results from the attainment report.
The data reveal that the kit packing department frequently deviates from the planner’s schedule, creating its own production plan. According to the kit packing department, this deviation is due to the unavailability of the materials specified in the planner’s schedule. This deviation represents a significant process misalignment, where the department consistently overproduces kits that are not required, accounting for over 20% of production. These findings align with the research of Singh et al. [8], which emphasizes that deviations from production plans can exacerbate inefficiencies. This consistent process deviation prompted further investigation into the downstream departments responsible for kit packing. Specifically, the laser department was examined. The investigation confirmed that process deviation is also practiced in other departments, where the production plan is not followed. Instead, the laser department creates its own production schedule. Figure 7 reveals that the laser department’s supervisor does not communicate their production plan to the programmer or team leader. Instead, orders are issued verbally or via email, leading to unplanned production. At times, shifts start without formal orders, leading the team to produce items at random to avoid idle time. This deviation in downstream processes contributes to inefficiencies in the kit packing department.
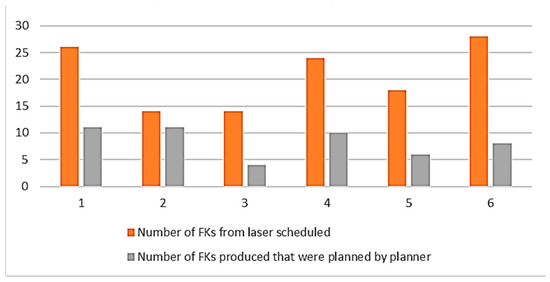
Figure 7.
Preproduction Planning showing the number of kits planned vs kits produced.
The investigation also revealed that not only does the laser department fail to receive production plans, but the pre-assembly department, which is responsible for supplying base plates and side tubes for kit packing, also lacks these plans. Orders are communicated only in emergencies, and are often delivered by associates rather than supervisors. Additionally, parts are sometimes produced without proper communication, resulting in them being unaccounted for or even being duplicated due to a lack of awareness. Although these findings were unexpected, they provided valuable insights into the root causes of missing parts and material shortages.
As an immediate countermeasure during the research process, the kit packing department was instructed to follow the production plan and document any factors which prevented them from fulfilling it. This allowed detailed data on material-related downtimes to be gathered; these data were further analyzed to address specific inefficiencies. Figure 8 analyzes the number of kits which went unpacked per week due to material-related issues. It shows that an average of 820 kits went unpacked per week, leading to an attainment of less than 40% per week in the department of kit packing.
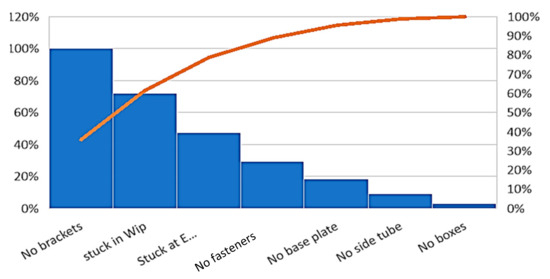
Figure 8.
Pareto chart showing the number of kits affected by each material factor.
5.2.1. Kit Packing Capacity Analysis
A capacity study was conducted in the kit packing department to assess its optimal performance potential. The following parameters were used: a cycle time of 94 s, an 8.25 h workday (29,700 s), and two workstations with a total of six heads. The department’s theoretical capacity was calculated using the following formula:
Capacity = (seconds in a shift)/(cycle time) = (29700)/94 = 315 kits
With two stations in operation, the total daily output should be
total daily output = 315 × 2 = 630 fitting kits
However, the current observed performance consistently falls short of this capacity, with daily outputs from both stations combined rarely exceeding 350 kits. This indicates a significant gap between the department’s theoretical capacity and its actual performance, suggesting inefficiencies or operational challenges that need to be addressed to fully utilize the available manpower and equipment.
5.2.2. Business Impact
During downtime, the company misses opportunities for production, sales, and profit generation. This results in a loss of earnings, which would not have been lost if the downtime had not occurred. If the downtime leads to late deliveries or failure to meet contractual obligations, the company may face penalties, fines, or may be obligated to provide monetary compensation to its customers. The cost analysis show the financial burden of low OEE in the kit packing department, as depicted in Table 3 below.
Table 3.
Costs incurred due to downtime in the kit packing department.
The analysis shows that material shortages result in over ZAR 404,000 in annual losses, followed by machine-related downtime, with annual losses of ZAR 245,000. The total estimated downtime cost approaches ZAR 950,000 annually, indicating a substantial financial impact. Beyond kit packaging, low OEE affects overall company performance, leading to the following problems:
- Production delays: There will be increased lead times for customers and potential contract penalties.
- Higher operational costs: Costs are incurred as a result of unplanned maintenance, excess labor expenses, and wasted materials.
- Lost revenue opportunities: Throughput is reduced, limiting the company’s ability to meet market demand.
A 20% reduction in downtime could result in estimated annual savings of ~ZAR 190,000, making OEE enhancement a strategic priority for financial sustainability and improved competitiveness.
5.2.3. Cost of Quality
Because of the low OEE, the kit packing department received an increase in customer complaints regarding the quality of its service. Dealing with quality issues also incurs costs for the company. The cost of quality (COQ) refers to the total costs incurred to ensure that a product or service meets the required quality standards, as well as the costs resulting from failing to meet those standards. Twenty-three G8Ds (customer complaints) have been lodged to the department of kit packing, and all of them cost the company money to correct.
The cost of product recalls includes the expenses associated with withdrawing defective products from the market, which are related to logistics, product replacements, customer compensation, and potential regulatory fines. Severe cases may lead to lawsuits and long-term financial damage, including harm to the company’s reputation. Rework costs arise when companies are required to correct defects before products reach customers, which requires additional labor, materials, and time, increasing operational expenses and reducing productivity. Scrap costs refer to financial losses from discarded materials or products that cannot be repaired or sold, leading to wasted resources and higher disposal or recycling costs.
Customer complaints incur costs related to handling issues like refunds, replacements, and lost sales, which can divert company resources from other critical tasks and damage customer satisfaction. Strapping or repackaging costs occur when quality issues force products to be repackaged, requiring extra labor, materials, and logistics expenses. This process can also cause delivery delays, further impacting on customer satisfaction and potentially damaging the company’s reputation.
5.3. Analytical Phase
The data collected during the measurement phase was analyzed to identify the root causes of the low OEE in the kit packing department. The analysis indicated that material-related issues are the primary contributor to downtime within this department. This phase aims to further investigate the specific aspects of material that lead to downtime, as material is a broad category that does not clearly define the problem. A fishbone diagram was employed to explore potential root causes systematically.
Figure 9 shows the possible root cause for the downtimes that result in low OEE. The fishbone diagram effectively highlights that the key drivers of low OEE in the kit packing department revolve around material availability, process deviations, equipment downtime, and workforce-related issues like a lack of supervision, communication, and motivation. These issues combined result in a systemic problem that affects the overall productivity and efficiency of the department. To further analyze the root causes, the 5 Whys analysis technique was employed, facilitating the identification of potential solutions to the identified issues. From there, potential solutions were developed.
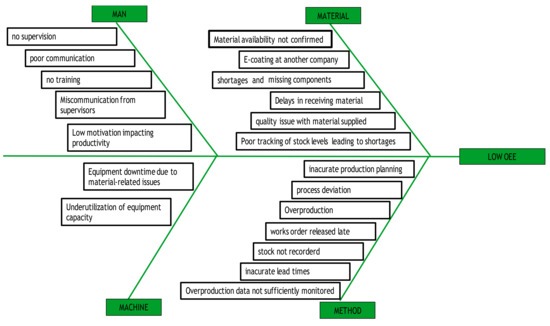
Figure 9.
Fishbone diagram showing the causes and effect of low OEE in kit packing.
The 5 Whys analysis used to formulate potential solutions in Table 4 reveals key challenges in the kit packing department, including outdated inventory systems, insufficient investment in new technologies, poor communication, and a lack of training. These issues result in material shortages, delays, and quality problems. Addressing these root causes through system upgrades, improved communication processes, and enhanced employee training can significantly improve material handling and planning, leading to greater efficiency and productivity.
Table 4.
Root causes and possible solutions for MATERIAL.
Table 5 below represents the possible solutions after conducting the 5 Whys analysis for method-related issues in the kit packing department. It highlights several critical problems, including outdated production planning data, poor communication between departments, lack of real-time tracking, and inadequate training. These issues lead to inaccuracies in production scheduling, process deviations, and overproduction of unnecessary kits. Addressing these root causes by implementing real-time data collection tools, improving cross-departmental communication, automating processes, and providing targeted training will ensure better alignment between planning and production, ultimately leading to more efficient and accurate operations.
Table 5.
Root causes and possible solutions for our method.
The 5 Whys analysis of MAN-related issues in the kit packing department reveals significant challenges related to supervision, communication, training, and motivation. Supervisors are not effectively overseeing or communicating due to low job satisfaction, lack of support for career development, and time pressures. The absence of training programs stems from budget limitations and an organizational culture that undervalues employee development. Additionally, poor communication practices and low motivation among staff are exacerbated by inadequate resources and misaligned priorities. Addressing these challenges through targeted training, improved communication protocols, leadership engagement, and efforts to enhance job satisfaction can create a more cohesive, productive, and motivated workforce. Table 6 below represents the potential solutions developed after the 5 Whys analysis.
Table 6.
Root causes and possible solutions for MAN.
Table 7 represents the potential solutions developed using the 5 Whys analysis for MACHINE. It reveals that equipment downtime and underutilization are largely due to material delays and production inefficiencies, and these issues are exacerbated by poor material planning, supplier performance issues, and lack of backup suppliers. Addressing these issues can significantly improve machine utilization.
Table 7.
Root causes and possible solutions for MACHINE.
Overall, the root causes identified reveal that low OEE is rooted in a combination of inadequate systems, poor communication, insufficient training, and a lack of investment in both technology and human resources. The proposed solutions focus on improving systems and processes, enhancing training and communication, and fostering a culture that values employee engagement and development. Addressing these root causes will be crucial for enhancing overall operational efficiency and OEE in the kit packing department.
The root causes of persistent inefficiencies in the kit packing department extend beyond downtime statistics, revealing deeper systemic challenges related to material availability, production planning, and workforce engagement. During observations and interviews with employees, one of the key issues identified was the failure to confirm material availability prior to production planning, primarily due to outdated inventory systems and resistance to adopting improved stock management technologies. This has led to frequent shortages and delays, which are further exacerbated by misalignment between the kits planning process and the mainline schedule.
Poor communication between departments contributes to process deviations, with teams independently adjusting schedules due to a lack of timely updates. Additionally, supervisors often neglect to relay critical production plans, believing that certain parts of the plan are not essential. These inconsistencies result in overproduction of unnecessary kits while crucial components remain unavailable, further disrupting workflow and leading to underutilization of equipment capacity. Addressing these challenges requires a combination of technological upgrades, structured communication protocols, and real-time data tracking to synchronize material availability with production schedules effectively.
Beyond material and planning issues, workforce management and machine utilization also play critical roles in low OEE. A lack of supervision, driven by low job satisfaction and limited career development opportunities, contributes to inconsistent production oversight. Poor communication among supervisors and between departments further hinders operational efficiency, as real-time production updates are either delayed or not shared at all. Demotivation among staff due to frequent idle time, compounded by weak organizational culture and unsatisfactory working conditions, exacerbates productivity issues. Similarly, persistent equipment downtime, primarily due to material shortages, reflects inadequate risk assessment in supplier management and an absence of backup sourcing strategies. Without a structured, proactive approach to material planning, machines remain underutilized, failing to meet their theoretical production capacity. Implementing targeted interventions, such as training programs, leadership engagement initiatives, and improved production planning frameworks, will be essential in fostering a more efficient and resilient kit packing process. Figure 10 depicts a word cloud of the issues discovered during observations.
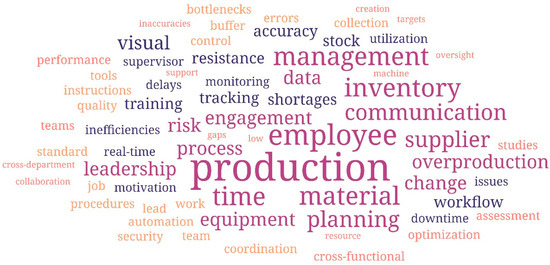
Figure 10.
Word cloud for qualitative issues discovered during observations.
5.4. Improvement Phase
In this phase, we prioritize the solutions to the identified root causes, assessing which are most feasible to implement first, as it is not possible to execute all solutions simultaneously. The feasibility analysis for each proposed solution highlights the technical, financial, and operational considerations for implementation and whether each solution is feasible to implement. The feasible solutions will be prioritized, whereas those that are not will be considered for implementation at a later stage. The methodology followed in this phase is summarized below (Figure 11). Table 8 also shows the action plan developed throughout the methodology.
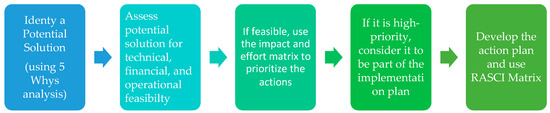
Figure 11.
Summary of the methodology used to develop the action plan.
Table 8.
The action plan that will be used to implement the solutions.
It is also important to create a timeline for this action plan to ensure that it is achievable. Appendix A (Table A2) below shows the recommended timelines and responsibilities to ensure accountability.
Control Phase
The control phase of the kit packing project aims to ensure that the improvements implemented during the previous stages are sustained over time and that the processes remain optimized. This phase will focus on monitoring key performance indicators (KPIs), maintaining newly established procedures, and ensuring consistent communication and training to keep the process improvements on track. From the provisional results, it is evident that there is still need for improvement in the kit packing department; therefore, a control chart must be established to sustain improvements in this department, ensuring that production levels remain consistent and addressing any existing variance. This plan will help maintain stable processes, monitor critical parameters, and ensure that the gains achieved from the project are preserved over the long term.
By implementing a control plan, the kit packing department can address production variances effectively, maintain consistent production levels, and continue to achieve improved OEE. This approach will also help ensure that corrective measures remain effective, and that the department adapts to changes quickly, ensuring long-term stability and growth. We also established a process flow for kit packing to standardize the process. To-be process flow is a crucial tool for the kit packing department, as it provides a blueprint for optimal operations. It helps address inefficiencies, improve communication, enhance productivity, and ensures that the department aligns with broader production goals. By focusing on creating a stable and streamlined workflow, the to-be process flow can drive long-term gains, supporting sustained improvements in OEE and overall performance. The envisaged control plan to be carried out once these actions have been implemented can be found in Appendix A (Table A1).
5.5. Discussion
In this research, we have identified various critical challenges, particularly those related to materials, which contribute to the low OEE of less than 60% observed in this study. These issues significantly impede the department’s ability to meet its production goals. Data collection indicated that downtime is predominantly driven by material-related problems, with the kit packing department often straying from its planned production schedules. This misalignment leads to the overproduction of unnecessary kits. Furthermore, an analysis of historical data and daily attainment reports revealed that material availability and communication breakdowns with upstream departments, notably the laser department, are pressing concerns. The consequences of low OEE manifest as diminished production output, elevated operational costs, and substantial financial repercussions stemming from lost sales opportunities and quality-related issues, such as customer complaints and product recalls. These challenges underscore the urgent need for immediate corrective actions alongside long-term strategic enhancements to improve OEE. By pinpointing material-related issues as the leading cause of downtime, the project revealed that the kit packing department frequently deviated from its planned production schedule. Such deviations not only resulted in the overproduction of unnecessary kits but also highlighted a significant lack of communication and coordination between the kit packing and upstream departments.
To address these concerns, the project will implement strategies aimed at ensuring the availability of materials at the point of use, thereby effectively reducing delays caused by material shortages. Table 9 presents the risk-based strategy that will be implemented to curb material shortages. This approach resonates with the findings of Haque et al. [12], who highlighted that material shortages can severely limit production capacity. Through the optimization of material handling processes and the establishment of reliable supply chains, the project succeeded in significantly reducing the amount of downtime associated with material unavailability, ultimately increasing operating time. The results indicate a notable improvement in operational efficiency, as reflected by reduced cycle times and improved throughput rates. This aligns with the insights presented by Bai et al. [6], who asserted that OEE is a fundamental tool for monitoring and improving manufacturing processes.
Table 9.
A risk-based strategy for curbing material shortages.
6. Conclusions
This study investigated the persistent issue of low OEE in the kit packing department of a South African Original Equipment Manufacturer (OEM), where frequent downtime resulted in OEE that consistently remained below 60%. Using the Define–Measure–Analyze–Improve–Control (DMAIC) methodology, this research identified material-related issues (84%) and manpower issues (15%) as the primary contributors to downtime. These inefficiencies led to equipment underutilization and financial losses due to production delays and overproduction of unnecessary kits. The key findings are as follows:
- Material shortages: Material shortages were the most significant cause of downtime, accounting for 84% of the total downtime. Thus, addressing material shortages can significantly reduce downtime and improve OEE.
- Manpower issues: Manpower issues were the cause of 15% of the total downtime, which implies that improving workforce management and training can enhance productivity and reduce delays.
A regression analysis was performed to model the relationship between material downtime, manpower downtime, and total downtime. The model demonstrated a perfect fit with an R-squared value of 1 indicating that material and manpower downtimes fully explain the variability in total downtime. Using this model, we predicted the total downtime for the next seven days, showing an increasing trend in total downtime.
Future Scope
Future research on this topic will focus on the following areas:
- Implementation of improvement strategies: The Improve and Control phases of the DMAIC methodology will be applied to implement and sustain the proposed solutions.
- Broader application: This study will be extended to other departments or industries facing similar challenges to validate our findings and help develop industry-wide best practices.
- Advanced modeling techniques: Advanced data modeling and machine learning techniques will be utilized to predict and mitigate downtime more effectively.
- Employee engagement: The impact of employee engagement and training programs on reducing manpower-related downtime will be investigated in greater depth.
By addressing these areas, future research can build on the findings of this study to further enhance manufacturing efficiency and operational performance.
Author Contributions
Conceptualization, Z.L.M. and B.M.; Methodology, Z.L.M. and B.M.; Investigation, Z.L.M.; Resources, B.M.; data curation, Z.L.M.; writing—original draft preparation, Z.L.M. and B.M.; writing—review and editing, Z.L.M. and B.M.; visualization, B.M.; supervision, B.M.; funding acquisition, B.M. All authors have read and agreed to the published version of the manuscript.
Funding
This research received no external funding.
Data Availability Statement
The original contributions presented in the study are included in the article.
Conflicts of Interest
The authors declare no conflicts of interest.
Appendix A
Table A1.
Control Plan for the Department of Kit Packing.
Table A1.
Control Plan for the Department of Kit Packing.
| Control Area | Control Measure | Frequency | Method of Monitoring | Responsibility | Action Plan for Variances |
|---|---|---|---|---|---|
| Material Availability | Ensure timely availability of materials from upstream departments (Laser, Press Bending, Powder Coating) | Daily | Monitor material availability using a Material Tracking Sheet. Conduct daily checks and updates from upstream departments. | Kit Packing Supervisor | If materials are unavailable, escalate to upstream department supervisors immediately. Adjust the schedule and prioritize pending kits with available materials. |
| Production Plan Adherence | Monitor adherence to the planned production schedule | Daily | Compare daily output with the planned production schedule. Use deviation logs to track any deviations. | Kit Packing Supervisor | Investigate the reasons for deviations and provide corrective actions. Conduct a weekly review with upstream departments to ensure alignment with the production plan. |
| Cycle Time | Ensure the average cycle time remains at 94 s | Weekly | Use a time study method to monitor cycle times. Record data and calculate average weekly cycle time. | Quality Control Team | If cycle time exceeds 94 s, Analyze bottlenecks and implement improvements in workstation layout or employee training. |
| Downtime Tracking | Track downtime causes, focusing on material issues | Shift-based (per shift) | Record downtime in downtime logs, categorizing the reasons for delays (e.g., material shortage, equipment failure) | Kit Packing Operators | Conduct root cause analysis for any downtime exceeding 10% of available shift time. Adjust supply schedules or conduct equipment maintenance as needed. |
| Quality Control | Monitor reject rates and ensure that products meet quality standards | Per Batch | Perform quality checks on randomly selected kits per batch using quality checklists. | Quality Control Inspector | If the reject rate exceeds 2% of the batch, conduct immediate root cause analysis and re-train staff on the quality standards. |
| Inventory Management | Manage inventory levels of fitting kits to prevent overproduction and stockouts | Weekly | Use the ERP system to monitor inventory levels and track the stock of fitting kits and materials | Inventory Manager | If inventory levels exceed 20% of demand, reduce production volumes accordingly. If stock is below minimum, expedite orders from suppliers. |
| Communication with Upstream Departments | Maintain clear communication channels with laser, press bending, and powder coating departments | Daily | Daily briefings with supervisors from upstream departments to align production needs and address potential issues | Kit Packing Supervisor | If communication gaps are identified, implement a weekly cross-departmental meeting to address recurring issues. |
| Employee Training | Ensure staff are trained in the updated process standards and equipment usage | Quarterly | Conduct refresher training sessions for operators, focusing on standard operating procedures (SOPs) | HR Department | If skill gaps are identified, provide targeted training sessions and create mentorship programs for new staff. |
| OEE Monitoring | Track OEE (Availability, Performance, Quality) to ensure it remains above 75% | Monthly | Use OEE calculation sheets to track and report availability, performance, and quality metrics | Operations Manager | If the OEE drops below 75%, conduct a detailed analysis and adjust action plans focusing on the weakest parameter. |
| Customer Feedback | Monitor customer complaints and address issues related to delivery delays and product quality | Monthly | Analyze complaint trends using a customer feedback database. Track improvements after corrective actions are implemented. | Customer Service Team | If complaints exceed 10% of deliveries, implement a cross-functional team to address root causes and propose corrective actions. |
Table A2.
Summary of the Solution and People Responsible for Actioning Them.
Table A2.
Summary of the Solution and People Responsible for Actioning Them.
| Solution | Who? | How? | When? | Why? |
|---|---|---|---|---|
| Improve Stock Tracking Processes | Inventory Manager, IT Department, HR, Operations Manager | Assess the current stock tracking systems, implement low-cost upgrades, provide training to employees, and monitor the effectiveness of new systems. | Start by 03/01 and complete by 03/15 | To minimize planning errors, reduce material shortages, and enhance the accuracy and efficiency of stock tracking, ultimately reducing downtime in production. |
| Implement Real-time Quality Checks | Quality Manager, IT Department, HR, Production Teams | Develop and document quality check procedures, install real-time quality check systems, train staff on using these systems, and regularly review quality check data to make necessary adjustments. | When: Start by 03/01 and complete by 03/15. | To catch defects early, ensure product quality, reduce customer complaints, and increase overall customer satisfaction. |
| Creating Buffer Stocks of Critical Components | Supply Chain, Procurement Team, Inventory Manager, Production Planner | Identify critical components for buffers, procure additional stock, monitor buffer levels, and align production schedules with buffer availability. | Start by 03/02 and complete by 03/15. | To prevent production stoppages due to stockouts, ensure smooth production flow, and improve the ability to meet demand fluctuations. |
| Automate Stock Recording | Inventory Manager, IT Department, HR, Operations Manager | Identify manual stock recording processes that can be automated, implement automation tools, train staff on the new system, and monitor accuracy improvements post-implementation. | Start by 03/01 and complete by 03/13. | To reduce manual entry errors, improve the accuracy of stock records, and save time for staff, leading to more efficient inventory management. |
| Improve Documentation Usage (Solution 15) | Supervisors, HR, Production Teams | Review existing work instructions, provide refresher training to associates on using the documentation, and monitor the usage of updated documents in daily operations. | Start by 03/01 and complete by 03/08. | To ensure that staff follow the proper procedures, reduce errors due to misinterpretation, and improve consistency in production processes. |
| Enforce Supervisor and Worker Communication (Solution 16) | HR Manager, Supervisors, Operations Manager | Establish communication protocols, train supervisors on communication skills, and monitor the effectiveness of communication practices through periodic reviews. | Start by 03/02 and complete by 03/10. | To improve operational efficiency by fostering better communication between supervisors and workers, leading to quicker problem resolution and more effective production planning. |
| Real-time Data Collection for Planning | Production Planner, IT Department, HR, Production Teams | Identify areas for data collection, implement real-time data collection tools, cross-train employees to use these tools, and review the impact of real-time data on production planning. | Start by 03/01 and complete by 03/13. | To improve the accuracy of production planning, ensure better alignment between material availability and production schedules, and reduce downtime |
| Motivate Associates and Ensure Job Security | Production Manager, HR Manager | Identify temporary tasks for associates, communicate job security measures, implement motivation programs, and monitor employee engagement through surveys. | Start by 03/02 and complete by 03/13 | To enhance employee morale and productivity, reduce idle time, and ensure associates feel valued and secure in their roles, thereby improving overall production efficiency. |
References
- Kiridena, S.; Li, W.; Dwight, R. Development and Validation of an Overall Equipment Efficiency Measurement Model for Supporting Operational Excellence. IFAC-PapersOnLine 2022, 55, 3076–3081. [Google Scholar] [CrossRef]
- Puvanasvaran, P.; Kim, C.Y.; Siang, T.Y.; Siang, Y. Overall Equipment Efficiency (Oee) Improvement Through Integrating Quality Tool: Case Study. In Proceedings of the International Conference on Design and Concurrent Engineering, Melaka, Malaysia, 15–16 October 2012; pp. 213–222. Available online: https://core.ac.uk/download/235640646.pdf (accessed on 29 January 2025).
- Soltanali, H.; Rohani, A.; Tabasizadeh, M.; Abbaspour-Fard, M.H.; Parida, A. Operational reliability evaluation-based maintenance planning for automotive production line. Qual. Technol. Quant. Manag. 2020, 17, 186–202. [Google Scholar] [CrossRef]
- Chiarini, A. Improvement of OEE performance using a Lean Six Sigma approach: An Italian manufacturing case study. Int. J. Product. Qual. Manag. 2015, 16, 416–433. Available online: https://ideas.repec.org/a/ids/ijpqma/v16y2015i4p416-433.html (accessed on 29 January 2025). [CrossRef]
- Adithya, S.; Ananthara, T. Enhancement of Overall Equipment Effectiveness in Automotive Parts Manufacturing Industry. Int. J. Mech. Eng. 2021, 6, 974–5823. Available online: https://kalaharijournals.com/resources/IJME2021Dec1-18/DEC_16.pdf (accessed on 29 January 2025).
- Bai, Z.; Dai, M.; Wei, Q.; Zhang, Z. An OEE Improvement Method Based on TOC. In Proceedings of the 25th International Conference on Mechatronics and Machine Vision in Practice (M2VIP), Stuttgart, Germany, 20–22 November 2018; pp. 1–6. [Google Scholar] [CrossRef]
- Rahman, M.S.A.; Mohamad, E.; Rahman, A.A.A. Enhancement of overall equipment effectiveness (OEE) data by using simulation as decision making tools for line balancing. Indones. J. Electr. Eng. Comput. Sci. 2020, 18, 1040–1047. [Google Scholar] [CrossRef]
- Singh, R.K.; Clements, E.J.; Sonwaney, V. Measurement of overall equipment effectiveness to improve operational efficiency. Int. J. Process Manag. Benchmarking 2018, 8, 246–261. [Google Scholar] [CrossRef]
- Singh, R.; Shah, D.B.; Gohil, A.M.; Shah, M.H. Overall Equipment Effectiveness (OEE) Calculation—Automation through Hardware & Software Development. Procedia Eng. 2013, 51, 579–584. [Google Scholar] [CrossRef]
- Klimecka-Tatar, D.; Ingaldi, M. Digitization of processes in manufacturing SMEs—Value stream mapping and OEE analysis. Procedia Comput. Sci. 2022, 200, 660–668. [Google Scholar] [CrossRef]
- Zennaro, I.; Battini, D.; Sgarbossa, F.; Persona, A.; De Marchi, R. Micro downtime: Data collection, analysis and impact on OEE in bottling lines the San Benedetto case study. Int. J. Qual. Reliab. Manag. 2018, 35, 965–995. [Google Scholar] [CrossRef]
- Haque, M.A.; Almas, A.M.; Azad, S.; Ghosh, M.; Oishi, Z.T.; Islam, M.M. An Integrated Framework for Investigating Relationship between Overall Equipment Effectiveness (OEE) and Downtime. In Proceedings of the 5th International Conference on Industrial & Mechanical Engineering and Operations, Dhaka, Bangladesh, 26–28 December 2022; pp. 521–532. [Google Scholar] [CrossRef]
- Islam, M.A.; Rashed, C.A.A.; Hasan, J. Raw Materials Shortage and Their Impact on the Manufacturing Business—An Empirical Study in the Pharmaceutical Sector of Bangladesh. Rev. Gen. Manag. 2019, 29, 128–144. Available online: https://research.ebsco.com/linkprocessor/plink?id=982cac4b-95ef-33c5-a896-7486e9fd45cb (accessed on 13 December 2024).
- Hedman, R.; Subramaniyan, M.; Almström, P. Analysis of Critical Factors for Automatic Measurement of OEE. Procedia CIRP 2016, 57, 128–133. [Google Scholar] [CrossRef]
- Acosta-Vargas, P.; Chicaiza-Salgado, E.; Acosta-Vargas, I.; Salvador-Ullauri, L.; Gonzalez, M. Towards Industry Improvement in Manufacturing with DMAIC. In Advances in Intelligent Systems and Computing; Springer International Publishing: Cham, Switzerland, 2021; 1273 AISC; pp. 341–352. [Google Scholar] [CrossRef]
- Prasetyo, Y.T.; Veroya, F.C. An Application of Overall Equipment Effectiveness (OEE) for Minimizing the Bottleneck Process in Semiconductor Industry. In Proceedings of the 2020 IEEE 7th International Conference on Industrial Engineering and Applications (ICIEA), Bangkok, Thailand, 16–21 April 2020; pp. 345–349. [Google Scholar] [CrossRef]
- Pillay, T.; Naicker, A.K.; Chetty, M. The Implementation of Operational Equipment Effectiveness in a Bearing Remanufacturing Company. In Proceedings of the 32nd Annual Southern African Institute for Industrial Engineering Conference, Muldersdrift, South Africa, 4–6 October 2021; pp. 622–632. [Google Scholar]
- Rozak, A.; Jaqin, C.; Hasbullah, H. Increasing overall equipment effectiveness in automotive company using DMAIC and FMEA method. J. Eur. Des. Syst. Autom. 2020, 53, 55–60. [Google Scholar] [CrossRef][Green Version]
- Tlapa-Mendoza, J.S.-C.D.; Limón-Romero, J.; Báez-López, Y. Process Improvement: The Six Sigma Approach. In Lean Manufacturing in the Developing World: Methodology, Case Studies and Trends from Latin America; Springer International Publishing: Cham, Switzerland, 2014; pp. 1–584. ISBN 9783319049. [Google Scholar]
- Mittal, A.; Gupta, P.; Kumar, V.; Al Owad, A.; Mahlawat, S.; Singh, S. The performance improvement analysis using Six Sigma DMAIC methodology: A case study on Indian manufacturing company. Heliyon 2023, 9, e14625. [Google Scholar] [CrossRef] [PubMed]
- Danieli, D. Industrial Application of Six Sigma to Increase the OEE of a Production line. Corso di Laurea Management and Engineering. 2023. Available online: https://webthesis.biblio.polito.it/26587/1/tesi.pdf (accessed on 6 January 2025).
- Nandakumar, N.; Saleeshya, P.G.; Harikumar, P. Bottleneck Identification and Process Improvement by Lean Six Sigma DMAIC Methodology. Mater. Today Proc. 2020, 24, 1217–1224. [Google Scholar] [CrossRef]
- Subagyo, I.; Saraswati, D.; Trilaksono, T.; Kusmulyono, M. Benefits and Challenges of DMAIC Methodology Implementation in Service Companies: An Exploratory Study. J. Apl. Manaj. 2020, 18, 814–824. [Google Scholar] [CrossRef]
- Usman, I.; Hutasoit, R. Six Sigma DMAIC practice in cigarette production process: Challenges and Opportunity BT. In Proceedings of the 2019 International Conference on Organizational Innovation (ICOI 2019), Ulsan, Republic of Korea, 20–22 July 2019; pp. 630–634. [Google Scholar] [CrossRef]
Disclaimer/Publisher’s Note: The statements, opinions and data contained in all publications are solely those of the individual author(s) and contributor(s) and not of MDPI and/or the editor(s). MDPI and/or the editor(s) disclaim responsibility for any injury to people or property resulting from any ideas, methods, instructions or products referred to in the content. |
© 2025 by the authors. Licensee MDPI, Basel, Switzerland. This article is an open access article distributed under the terms and conditions of the Creative Commons Attribution (CC BY) license (https://creativecommons.org/licenses/by/4.0/).