Abstract
In this paper, an IES optimal cooperative scheduling method based on a master–slave game is proposed considering a carbon emission trading (CET) and carbon capture system (CCS) combined operation with power to gas (P2G). We analysed the behaviour of integrated energy system operators (IESO) and energy suppliers (ES) when the system is operating in different states. This paper first introduces the structure of IES and the mathematical model of the game frame. Secondly, mixed integer linear programming and particle swarm optimization (MILP–PSO) are used. The final simulation results show that in the main scenario, IESO and ES have an income of CNY 181,900 and CNY 279,400, respectively, and the actual carbon emission is 106.75 tons. The overall income is balanced, and the carbon emission is in the middle. The results provide a reference value for operators and users to make decisions.
1. Introduction
To reduce the impact of global warming caused by carbon emissions, energy conservation and emission reduction in industrial parks are important [1,2,3]. Therefore, it is essential to realize the energy transformation of industrial parks. Integrated energy systems (IES) improve energy efficiency by coupling various energy sources to achieve multi-energy complementarity [4,5,6,7]. It has gradually become one of the important ways to promote the energy transformation of industrial parks [8,9,10,11].
At present, the research on IES mainly focuses on the energy composition of electric–heat–gas but neglects hydrogen. Hydrogen can complement a variety of energy sources and has a strong application prospect [12,13]. In addition, due to the high calorific value of hydrogen, the combustion product is completely clean, and the use of a mixture of natural gas with a certain proportion of hydrogen plays an important role in the carbon reduction operation of IES [14]. In recent years, gas hydrogen blending technology has rapidly developed, and China, the United States, Germany, and other countries have achieved stable operation of gas turbines under different hydrogen blending ratios [15]. Although hydrogen blending can reduce carbon dioxide emissions, the current high price of hydrogen will greatly increase the cost if a large amount of hydrogen is purchased, so how to achieve efficient production and utilization of hydrogen has become the main challenge of the current hydrogen blending system. In addition to the use of clean energy, the use of carbon capture system (CCS)–power to gas (P2G) technology in industrial parks to improve the utilization of carbon, thereby reducing carbon emissions, is also a common method. The technology can capture carbon dioxide in industrial production by various means, and convert the captured carbon dioxide into natural gas for reuse through P2G technology, in order to reduce greenhouse gas emissions [16,17,18].
In addition, some industrial parks have realized IES low-carbon operation by designing a carbon emission trading (CET) mechanism. In theory, the literature [19] analyzes the key scientific issues CET faces in the low-carbon transition process of the energy system from the “carbon perspective”. The literature [20] effectively restricts the carbon emissions of the system by constructing a reward–punishment ladder CET model. In engineering research, the literature [21] considers the output characteristics of each distributed unit, the operation constraints of each unit, and the charging and discharging characteristics of multiple types of components, as well as the stepped carbon trading mechanism to achieve system economy and emission reduction operation. The literature [22] established a CCS-coupled two-stage P2G low-carbon economic scheduling model and designed the energy supply and demand balance based on the hydrogen generated by P2G to optimize system operating costs and carbon emissions. The literature [23] proposes an IES low-carbon optimal scheduling strategy that takes into account CCS–P2G joint operation and the flexible demand response of source load and combines it with the load-side demand response model to form a flexible response model of source load, so as to realize the low-carbon economic scheduling of IES. All the above literature indicates that CET can stimulate the enthusiasm for renewable energy consumption of IES and promote the low-carbon operation of IES. However, there are interest disputes among stakeholders in the CET trading market, which will affect their enthusiasm to participate in the CET market and may lead to the loss of the incentive role of CET for users to reduce emissions.
Game theory is widely used in the field of IES optimization scheduling because it can effectively solve the interest disputes of multiple decision makers and is an important part of strategy choice. The literature [24] considers the CET mechanism, constructs a master–slave game between source and load, and guides users to participate in low-carbon demand-side response by formulating a demand-side response incentive price and an output plan, thus realizing IES energy saving and carbon reduction to a large extent. The literature [25] proposes a regional IES low-carbon cooperative scheduling model considering the participation of demand-side resources. By increasing carbon dioxide emission constraints, CET is introduced to limit carbon dioxide emissions, and energy trading prices are determined by a master–slave game to improve the system operation economy. The literature [26] proposes a two-layer optimization model of an operator–user master–slave game considering mixed carbon policies. The upper layer aims to maximize the operator’s revenue, and the lower layer aims to minimize the user’s energy purchase cost and the carbon emissions of the system by introducing ladder carbon trading and carbon tax costs. The literature [27] establishes a multi-objective cooperative competition game optimization model to obtain the optimal operation strategy of the park’s IES, to minimize the total operation cost and carbon dioxide emission. The literature [28] proposes an IES optimization operation model based on cooperative games, which considers the possibility of cooperation among various agents in the system, improves the energy utilization rate and operational flexibility of IES, and reduces carbon emissions. The unit equipment model constructed in the above research is relatively simple, and the constraints of electricity, heat, and gas networks have not been considered, which makes it difficult to reflect the energy coupling relationship between each unit and the internal energy flow situation. Moreover, the multiple utilization model of hydrogen energy has not been considered, and the carbon reduction potential of IES is not deeply explored.
In summary, this paper proposes an optimal scheduling method for industrial IES based on a master–slave game considering CCS–P2G joint operation. Firstly, the mathematical model and game frame of industrial IES are introduced. The IES is a multi-energy complementary operation mode of electricity, heat, gas, and hydrogen. Second, the integrated energy system operator (IESO) will be the leader and the energy supplier (ES) will be the follower, both of which will obtain the maximum benefit from setting the energy trading price and adjusting the output plan of each unit. Finally, through scenario analysis, it is verified that the method can make full use of the CET mechanism, improve CCS–P2G joint operation and hydrogen energy utilization capacity, and tap into the carbon reduction potential of industrial IES. The method proposed in this paper solves the problem of interest conflict by describing the behavior of various stakeholders in IES and clarifies the mechanism of multi-energy coupling IES optimization and coordination. The low-carbon operation, multi-energy complementarity and multiple utilization of hydrogen energy of IES are realized, and the carbon reduction potential of IES is deeply explored.
The rest of this paper is organized as follows: In Section 2, the mathematical model and operation constraints of IES are given. Section 3 briefly introduces the trading mechanism and the objective function. Section 4 demonstrates the simulation experiment and case analysis. Section 5 summarizes the conclusion of this paper and the prospect of future work.
2. IES Modeling
The specific structure of IES is shown in Figure 1.
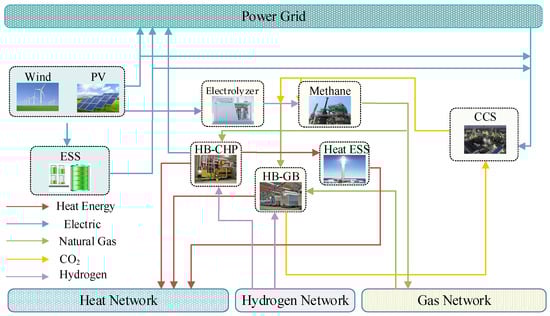
Figure 1.
Structure of IES.
2.1. Key Energy Supply Equipment Modeling
2.1.1. Hydrogen Blending Combined Heat and Power Modeling
Different equipment has different hydrogen mixing ratios, according to regulations, the hydrogen mixing range of a standard natural gas turbine is 0% to 30%. The combustion state of gas will become unstable with an increase in the hydrogen blending (HB) ratio, and the structure of the gas unit with a high HB ratio will also be a great challenge. Therefore, a 10% HB ratio with more mature technology and more stable and safe combustion is selected [29,30]. In the experiment of a fixed flue gas separation ratio, the HB ratios of 5%, 15%, 15% and 20% were compared, and the specific results are shown in Section 4.1.2. Its mathematical model is as follows
where , and represent the electrical output, thermal output and input power of the mixed gas of the HB–CHP, respectively. The output power of all the devices in this paper is MW. and represent the power generation efficiency of hydrogen blending HB–CHP and heat recovery efficiency of waste heat boiler, respectively. and represent the gas and hydrogen consumption of the hydrogen blending HB–CHP, respectively. Its units are and tons, respectively. and represent the volume power conversion coefficient of natural gas and mass power conversion coefficient of hydrogen.
2.1.2. Hydrogen Blending Gas-Fired Boiler Modeling
2.1.3. CCS–P2G Coupled Operation Modeling
CCS operation in flue gas separation mode can improve the flexibility of coupled operation of CCS system and P2G system. The specific mathematical model is as follows [31,32]
where is the amount of carbon dioxide actually captured by CCS. and represent the amount of carbon dioxide produced by HB–CHP and HB–GB, respectively. is the purchase of power. is the carbon emission intensity coefficient of coal-fired units. is gas separation ratio of CCS system. and represent the absorption efficiency and energy consumption coefficient of the absorber, respectively. represents the power that CCS will consume. and represent the operating and fixed energy consumption of CCS, respectively.
By installing a set of solution memory between the absorption tower and the resolution tower, the carbon dioxide absorption process and the resolution process are decoupled in the time dimension.
where and represent the time and time . and represent the volume of the rich and lean solvent, respectively. and represent the rich solvent volume flowing into the rich solvent reservoir and the lean solvent volume flowing out of the lean solvent reservoir, respectively. and represent the rich solvent volume flowing out of the rich solvent reservoir and the lean solvent volume flowing into the lean solvent reservoir, respectively. One thing to note is that the and , and are numerically equal. is the mass of regenerated carbon dioxide. represents the density of carbon dioxide. is the carbon dioxide absorption coefficient of alcohol amine solution.
The methanation of carbon dioxide includes two processes: hydrogen production by electrolytic water and methanation by methane reactor. Specifically, as follows
where Equation (5) is the process of hydrogen production by electrolytic water, and Equation (6) is the methanation process of methane reactor (the resulting methane consists of two components). and are the hydron production of electrolyzer and the hydron consumption of methane reactor, respectively. is the conversion efficiency of electrolyzer. is the power consumption of electrolyzer. represents the calorific value of hydrogen. is the methane production of reactor. is the conversion efficiency of methane reactor. represents the calorific value of methane.
2.1.4. Energy Storage System Modeling
This paper mainly considers the influence of heat storage, electric energy storage, and hydrogen storage tanks. The battery energy storage system uses lithium batteries as the energy storage medium, which is stored when the power of the distribution network is abundant and released when the power is scarce. The thermal energy storage system uses molten salt to store heat energy and stores and releases it when the heat energy is sufficient and scarce. Hydrogen storage tanks store hydrogen in a physical sense and release it when needed.
where represents the capacity of type ESS. represents the loss rate of type ESS, the self-loss rate of hydrogen storage tank is 0. and represents the charging and discharging power of type ESS. represents the charging and discharging efficiency of type ESS.
2.2. Operation Constraints
2.2.1. Output and Climbing Constraint of HB–CHP and HB–GB
2.2.2. Energy Storage System Output Constraint
2.2.3. Network Equilibrium Constraint
3. Transaction Mechanism Modeling and Objective Function
3.1. Carbon Emission Trading Mechanism
The stepped carbon trading market can enhance the enthusiasm of the carbon trading market and play a positive guiding role in IES to reduce carbon emissions [34].
where , , and represent the carbon quota obtained by the IES, HB–CHP, HB–GB and grid power purchasing, respectively. , and are, respectively, the carbon quota coefficients of HB–CHP, HB–GB and grid power purchasing. , and are the output power of CHP, output heat power of GB and the grid power purchasing, respectively. And the CET cost is calculated as follows
where is the carbon trading base price. is the range of price increase. is the length of the carbon emission interval. is the carbon emission rights, which is calculated as follows
where is the IES’s overall actual carbon emissions.
3.2. Objective Function
3.2.1. IESO Objective Function
Comprehensive energy operators need to consider the revenue from selling energy, the cost of purchasing energy and the interaction cost with the superior power, heat and gas network to maximize the revenue.
where is the IESO revenue from the sale of energy. is the energy purchase cost of IESO. is the interaction cost of IESO. This objective function describes the composition of IESO benefits in the running IES system, and optimizes each component to maximize IESO benefits.
- Energy Purchase Cost
- 2.
- Profit on Sale Energy
- 3.
- Interaction Cost
3.2.2. ES Objective Function
Based on IESO’s pricing strategy and load requirements, ES develops output plans for each unit to maximize its own benefits.
where is the ES revenue from the sale of energy, equal to the purchase cost of IESO. is the energy purchase cost of ES. is the operation and maintenance cost of ES. is the CET cost of ES.
- Energy Purchase Cost
- 2.
- Operation and Maintenance Cost
3.3. Master–Slave Game Modeling
The master–slave game model is mainly composed of three elements: players, strategy set and returns, and its mathematical model is as follows
where is game model. is participant set. and represent the IESO and ES income, respectively. and represent the policy sets of IESO and ES respectively, which can be expressed as follows
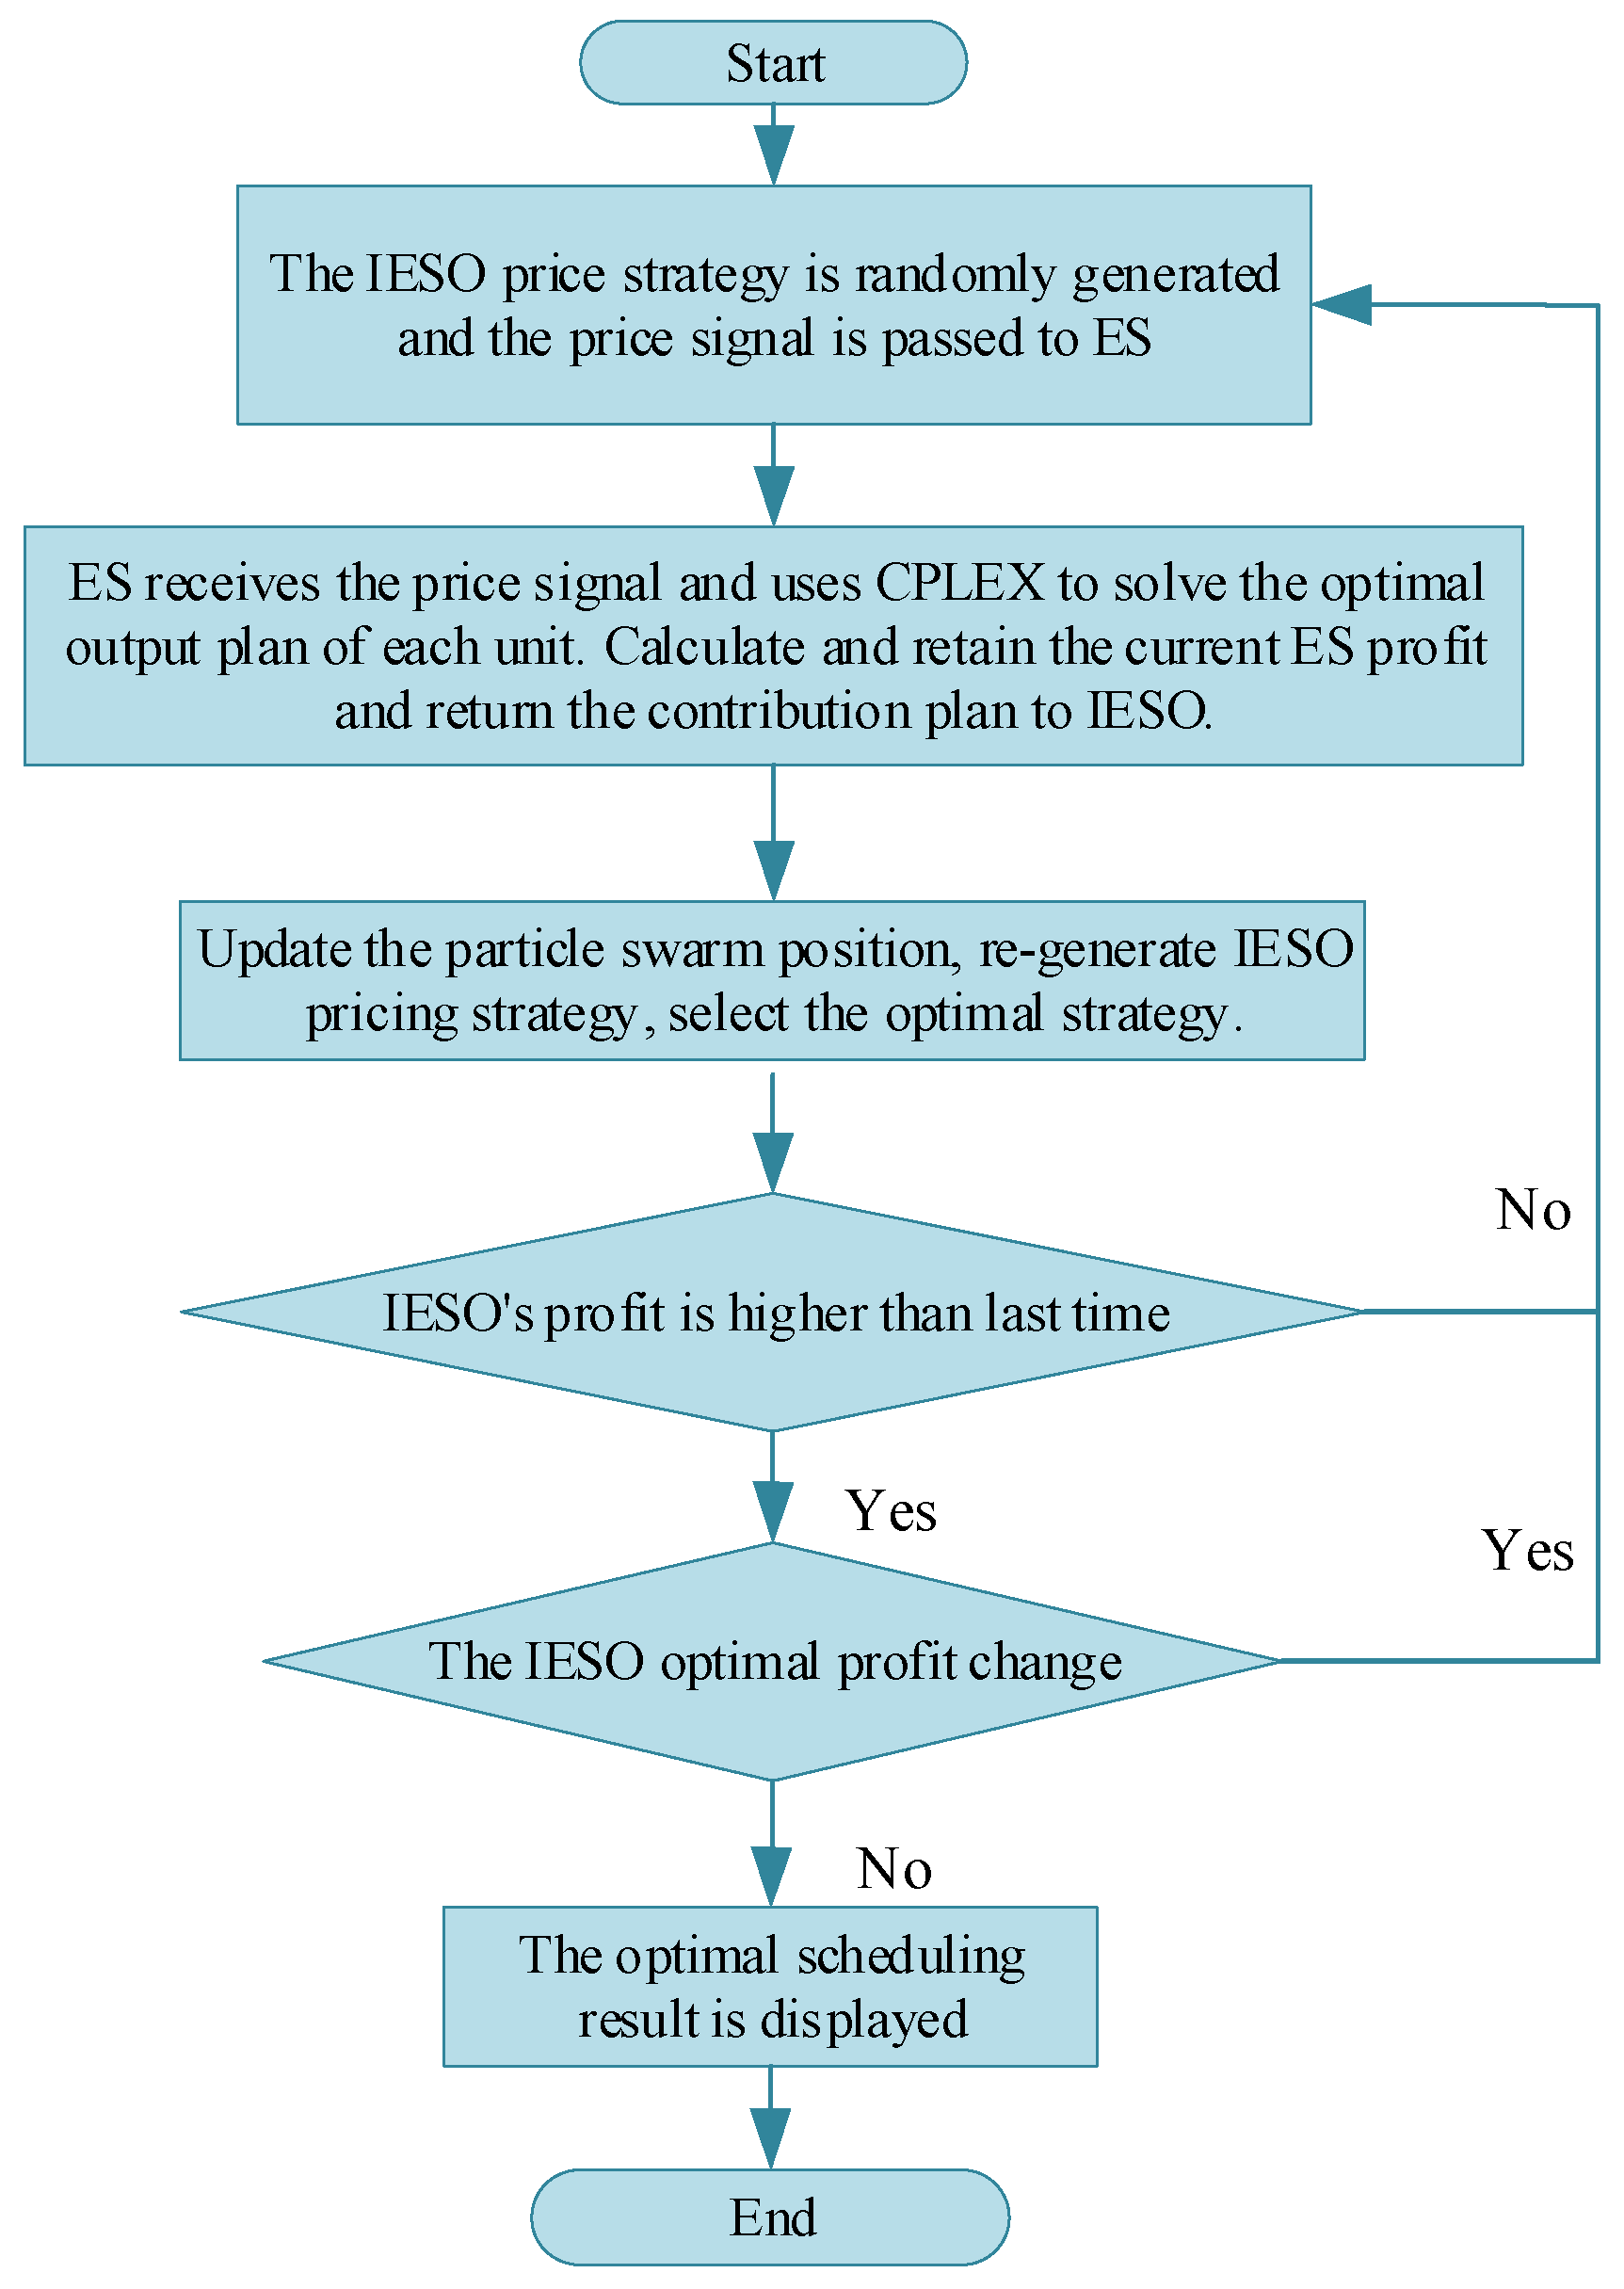
Within this framework, the strategies of the two participants need to be optimized separately. In this paper, mixed integer linear programming (MILP) involving PSO is adopted, which is not easy to fall into local optimal values. To sum up, the optimization process is shown in Figure 2.
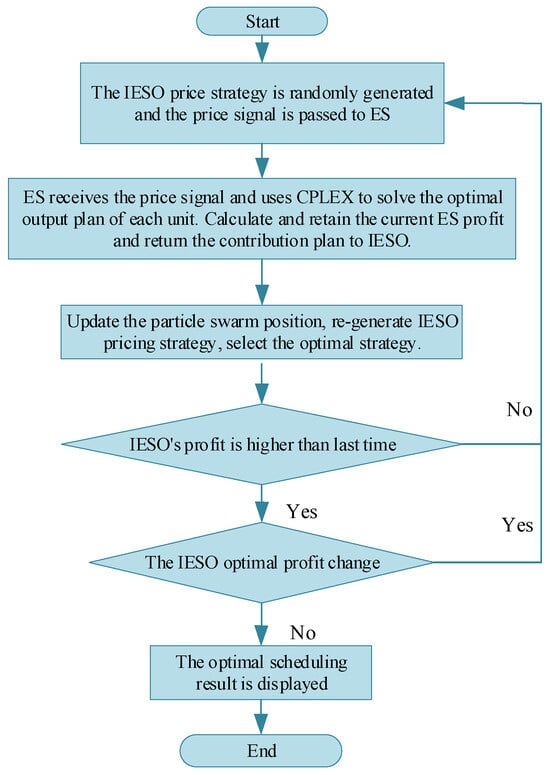
Figure 2.
IES system optimization dispatch flow chart.
4. Case Study
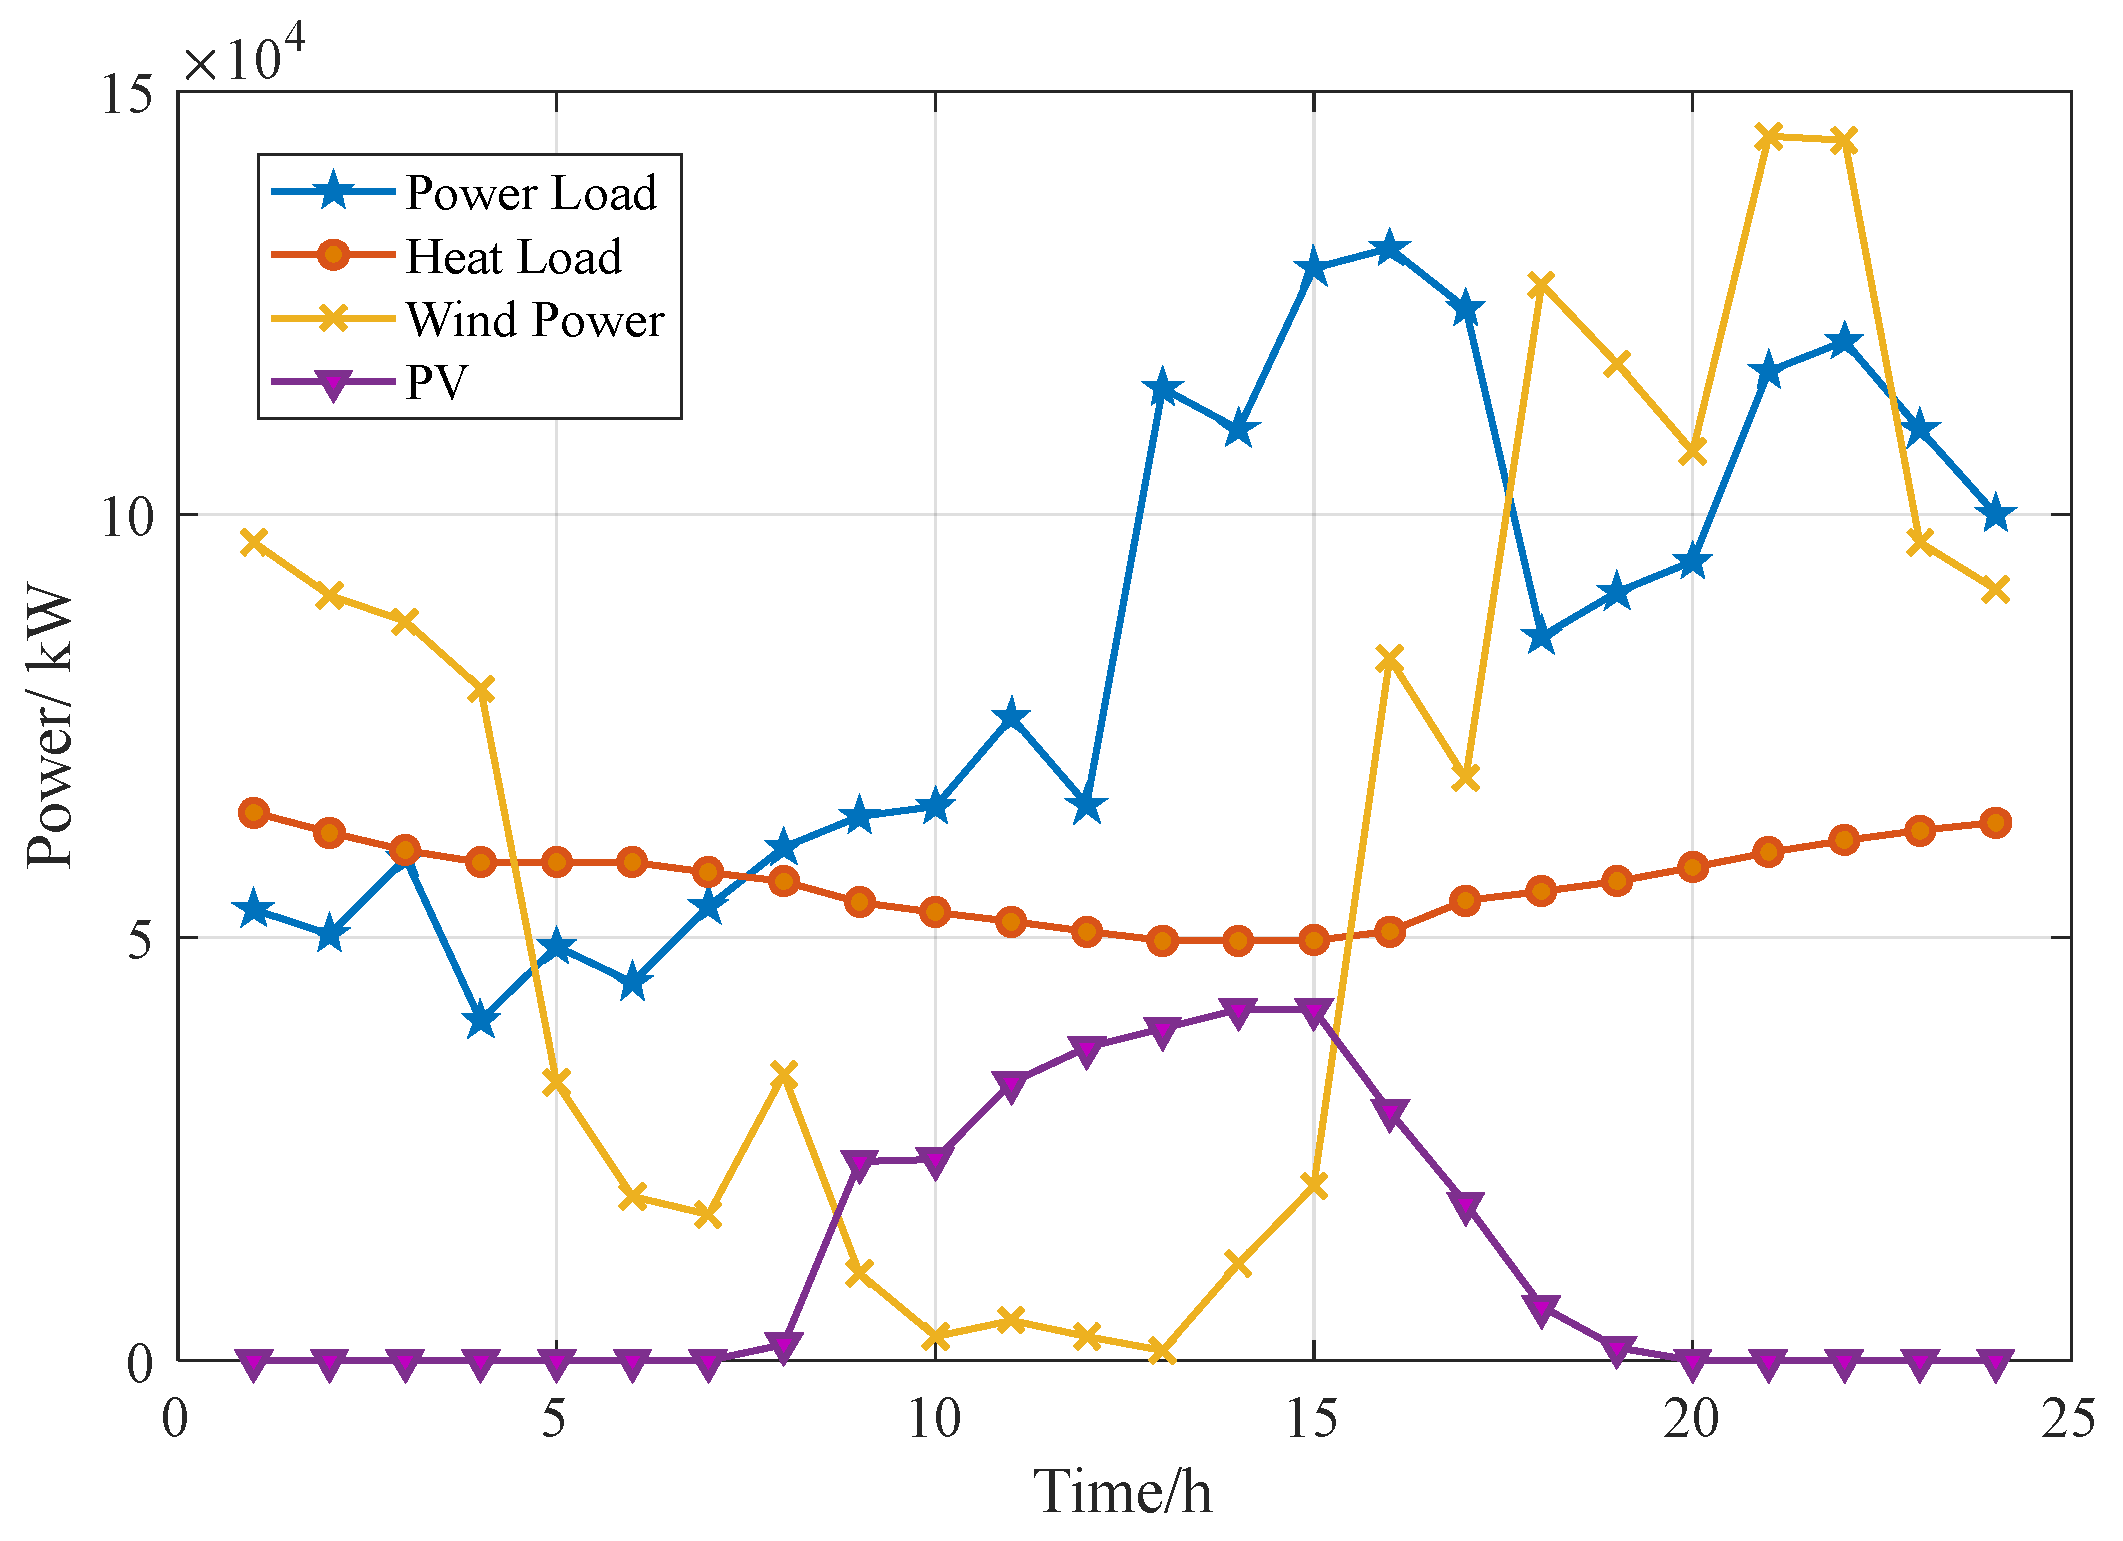
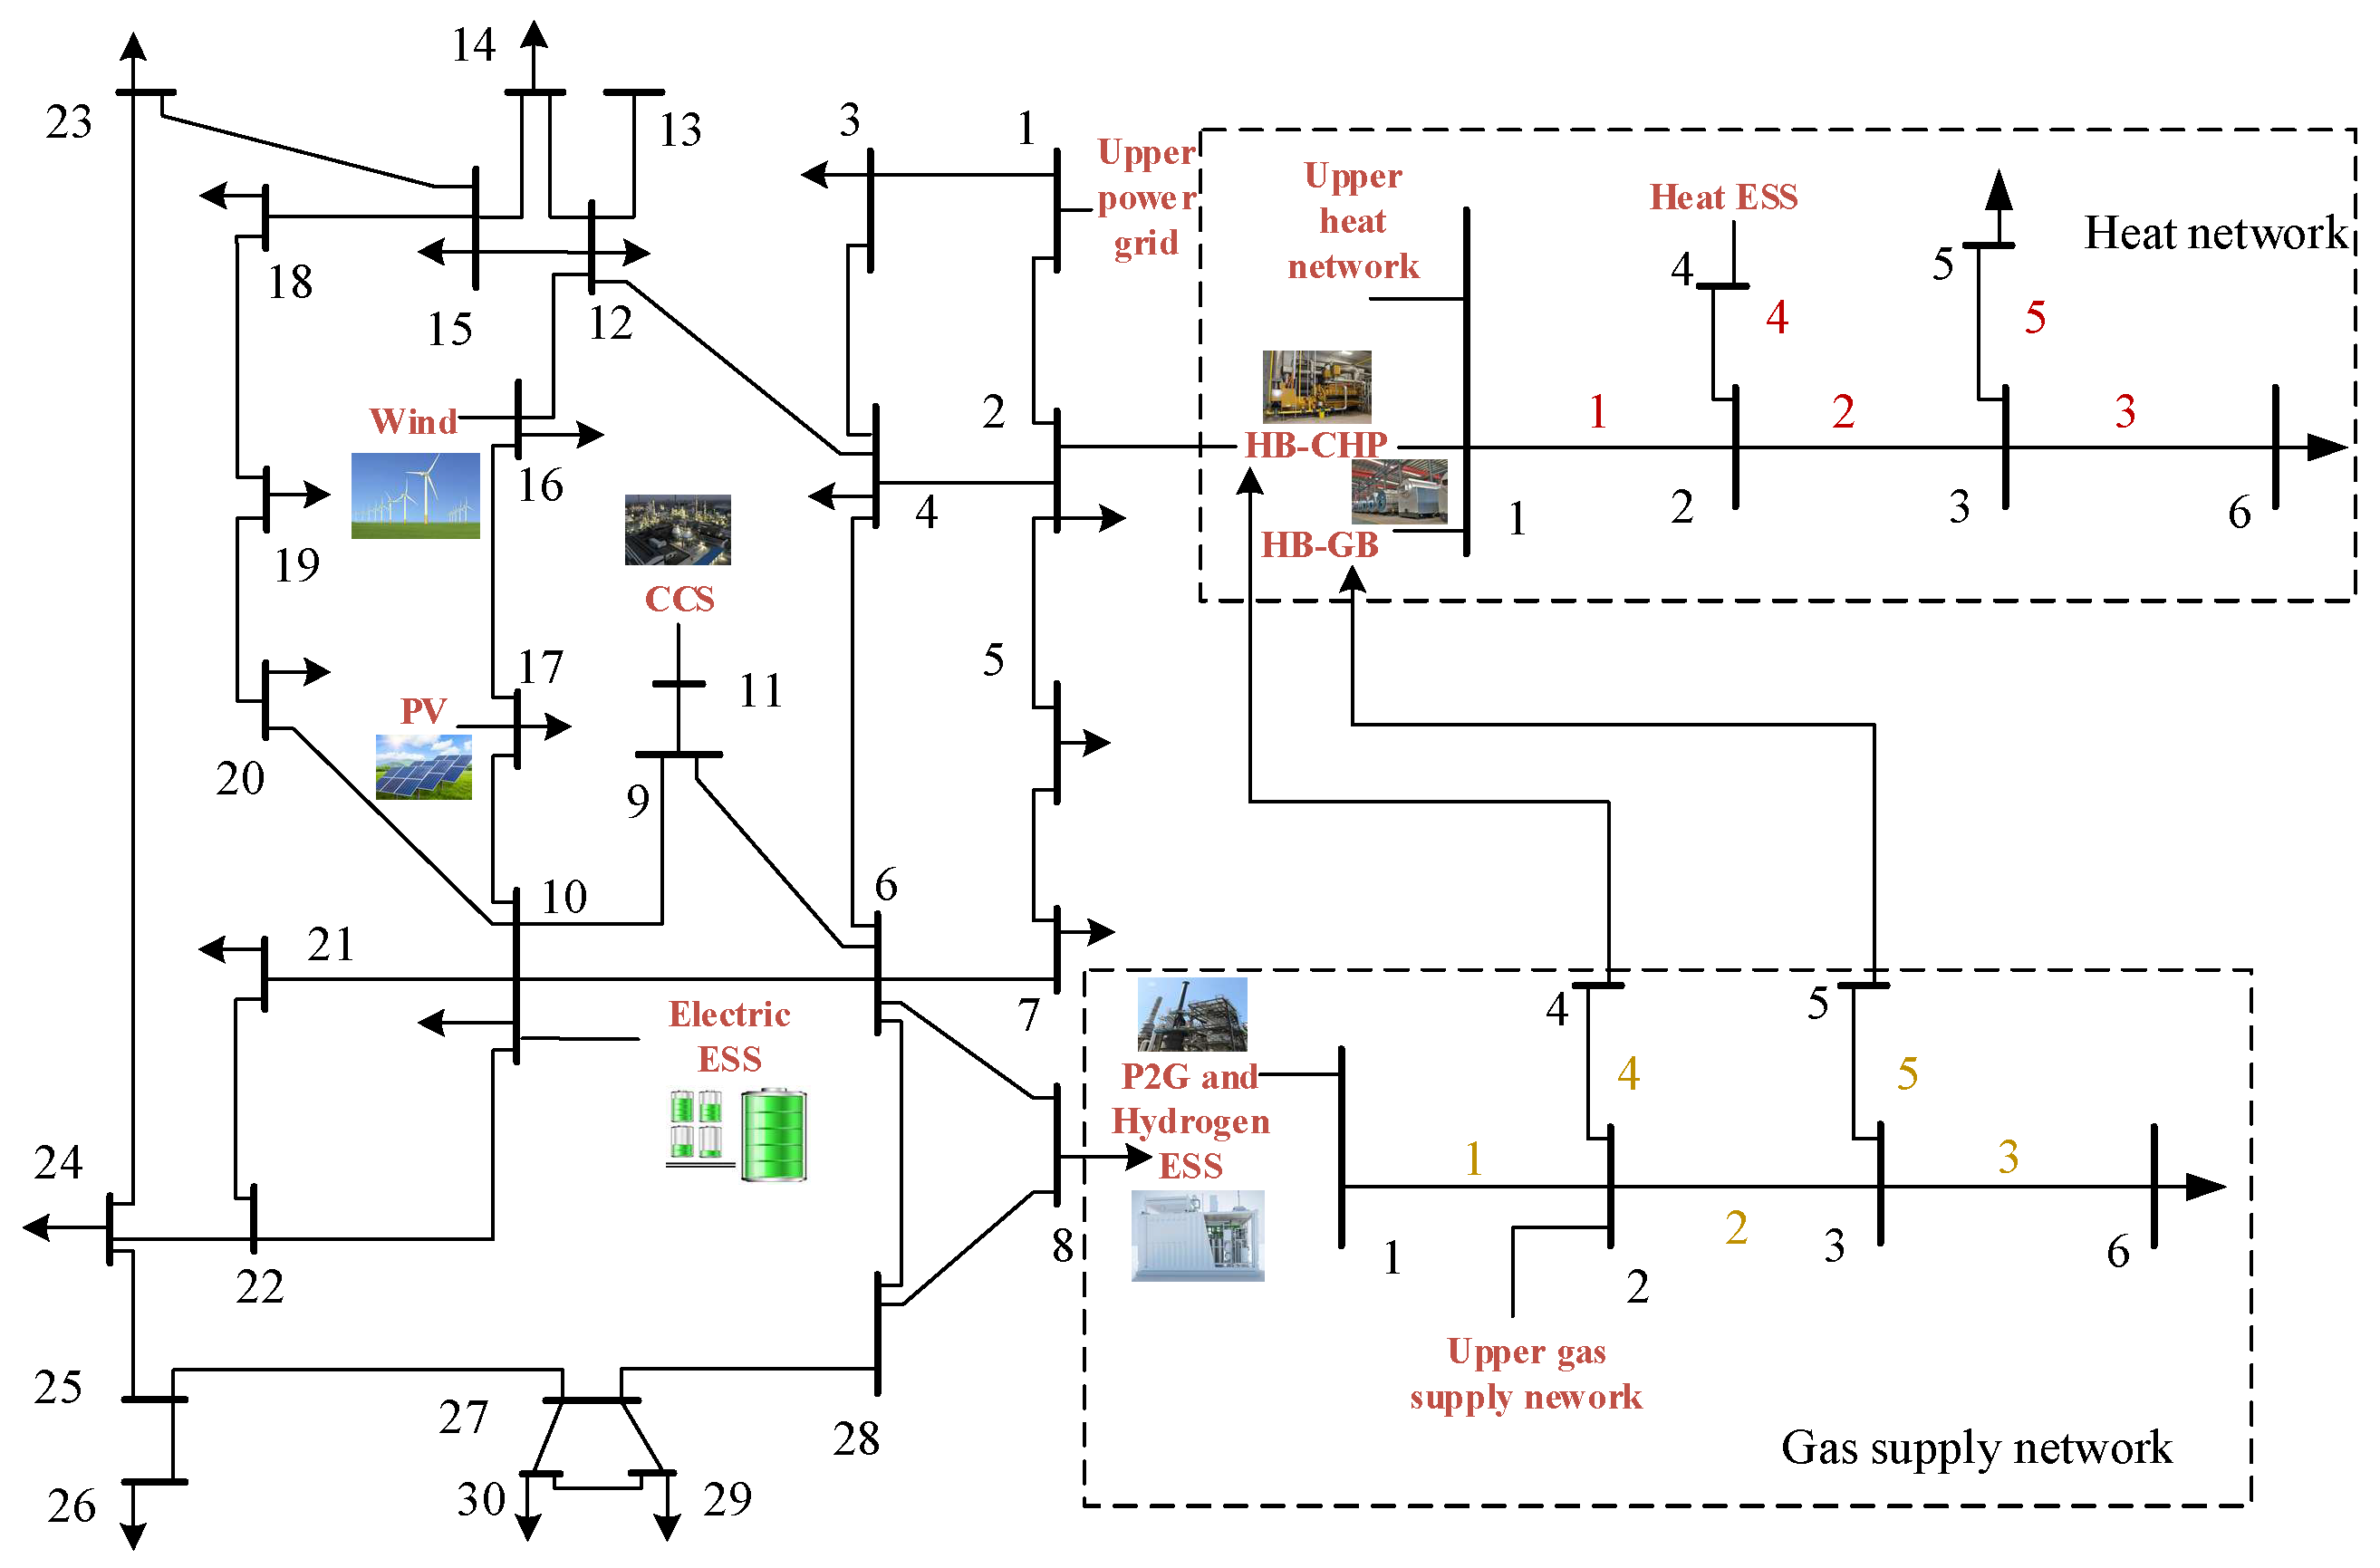
The IES structure used in this case is composed of an IEEE-30-node power grid, 6-node heating network and 6-node natural gas network. In addition, in the main scenario described in this paper, the hydrogen mixing ratio of HB–CHP and HB–GB is set to 10%, and the flue gas separation ratio of the CCS–P2G joint operation equipment is set to 0.8. In addition, the curves of electricity load, heat load, wind power output and photovoltaic output within one day after clustering are shown in Figure 3 [36]. The power load, heat load, wind power and photovoltaic power in Figure 3 are all clustered from one year of data. The electric load and photovoltaic output have obvious time fluctuation characteristics. However, there is no obvious relationship between the curves, and it is mainly determined by user behavior and climate. The specific IES topology is shown in Figure 4.
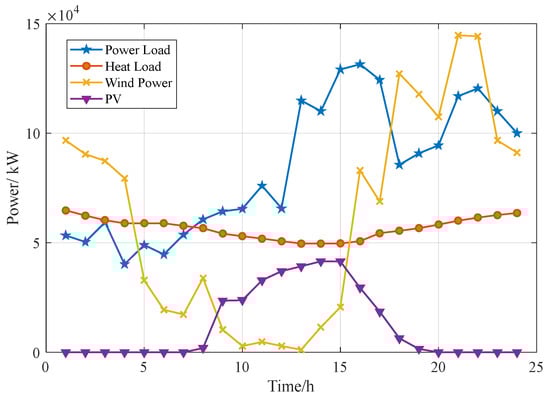
Figure 3.
Load and renewable energy output curve.
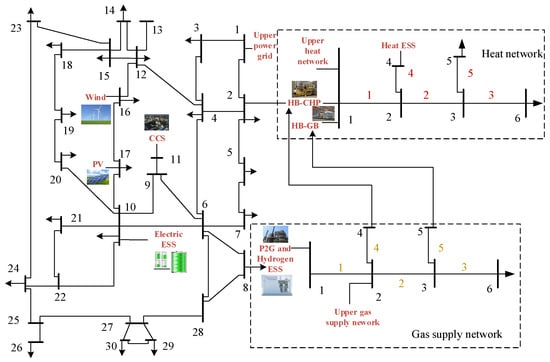
Figure 4.
IES system topology.
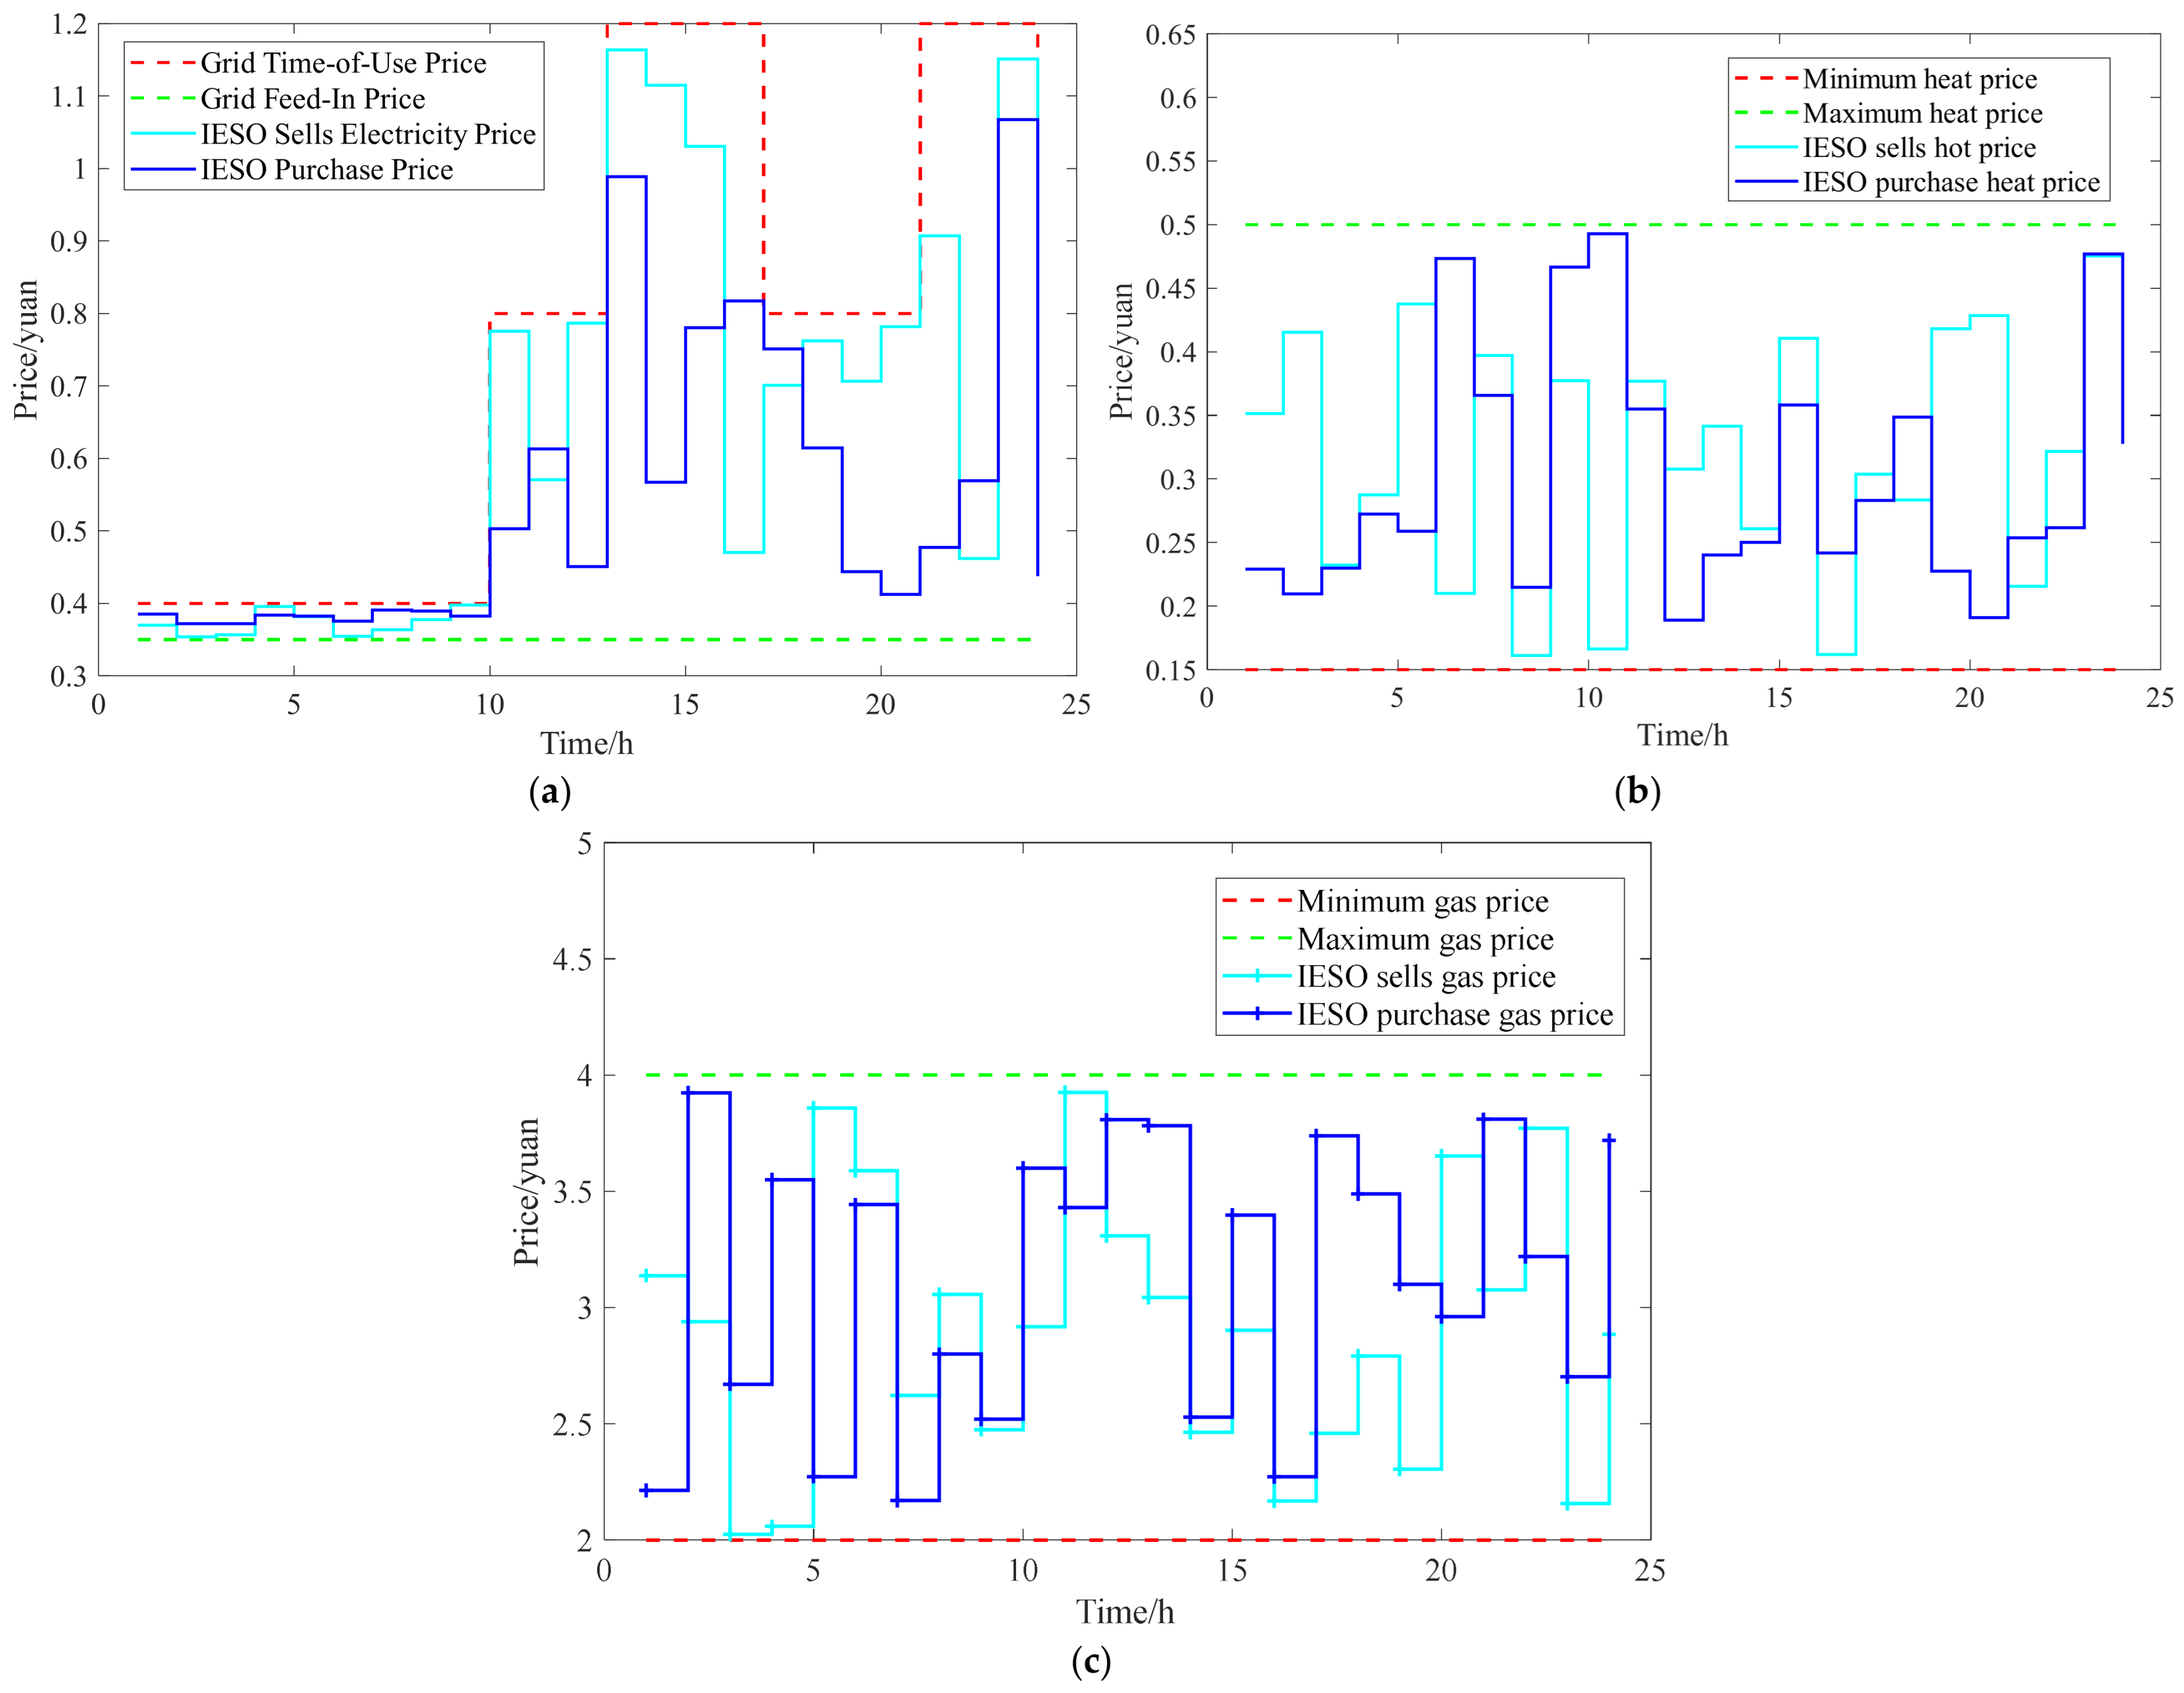
In the main scenario, the electricity price, heat price and natural gas price obtained by using the optimization method described in this paper and the game are shown in Figure 5. The pricing results in this paper come from the repeated interactions between the leader and the follower in the game structure, while pricing constraints, such as average price constraints and upper and lower bound constraints. Through the interaction process and constraints used in this paper, the final price is obtained. The balance of electrical load, heat load and natural gas load at all times is shown in Figure 6. It should be noted that each bar chart in Figure 6 is independent, and its height represents a specific value. The bar chart at the same time does not cover the phenomenon, which is the same with other similar figures. By observing Figure 5 and Figure 6, the solution results are in line with the set constraints, and the setting of electricity price, heat price and gas price is reasonable and within the prescribed range.
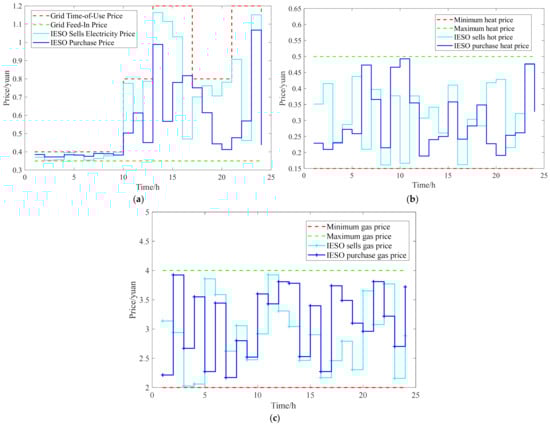
Figure 5.
IESO pricing strategy in main scenario: (a) electricity price; (b) heat price; (c) gas price.
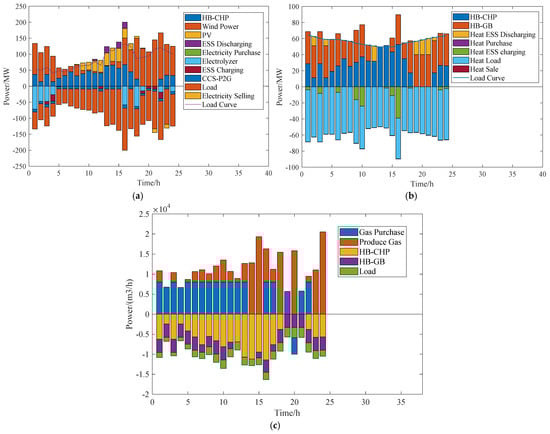
Figure 6.
Load balance of IES system in main scenario: (a) electricity load; (b) heat load; (c) gas load.
In addition, in order to verify the effectiveness of the master–slave game framework, the method used in this paper is compared with the conventional optimal scheduling method [31], and the results are shown in Table 1. In the absence of game participation, ES deals directly with the electricity, heat and gas network, so the electricity, heat and gas selling (buying) prices of ES are, respectively, online (time-sharing) electricity price, heat price lower (upper) limit and gas price lower (upper) limit. The real-time electricity, heat and gas prices set by IESO motivate each unit’s operation and bear the interaction cost with the energy grid. Therefore, in the operating state with game participation in Table 1, ES can obtain higher returns and lower hydrogen purchase, which verifies the effectiveness of the master–slave game in the balance of multi-agent interests.

Table 1.
Comparison of results with and without game participation in the main scenario.
All simulations in this article are run on a 13th Gen Intel(R) Core (TM) i5-13400 computer with 64 GB of memory in MATLAB R2023a.
4.1. CCS–P2G Coupling Analysis
4.1.1. Comparison of Flue Gas Separation Ratio
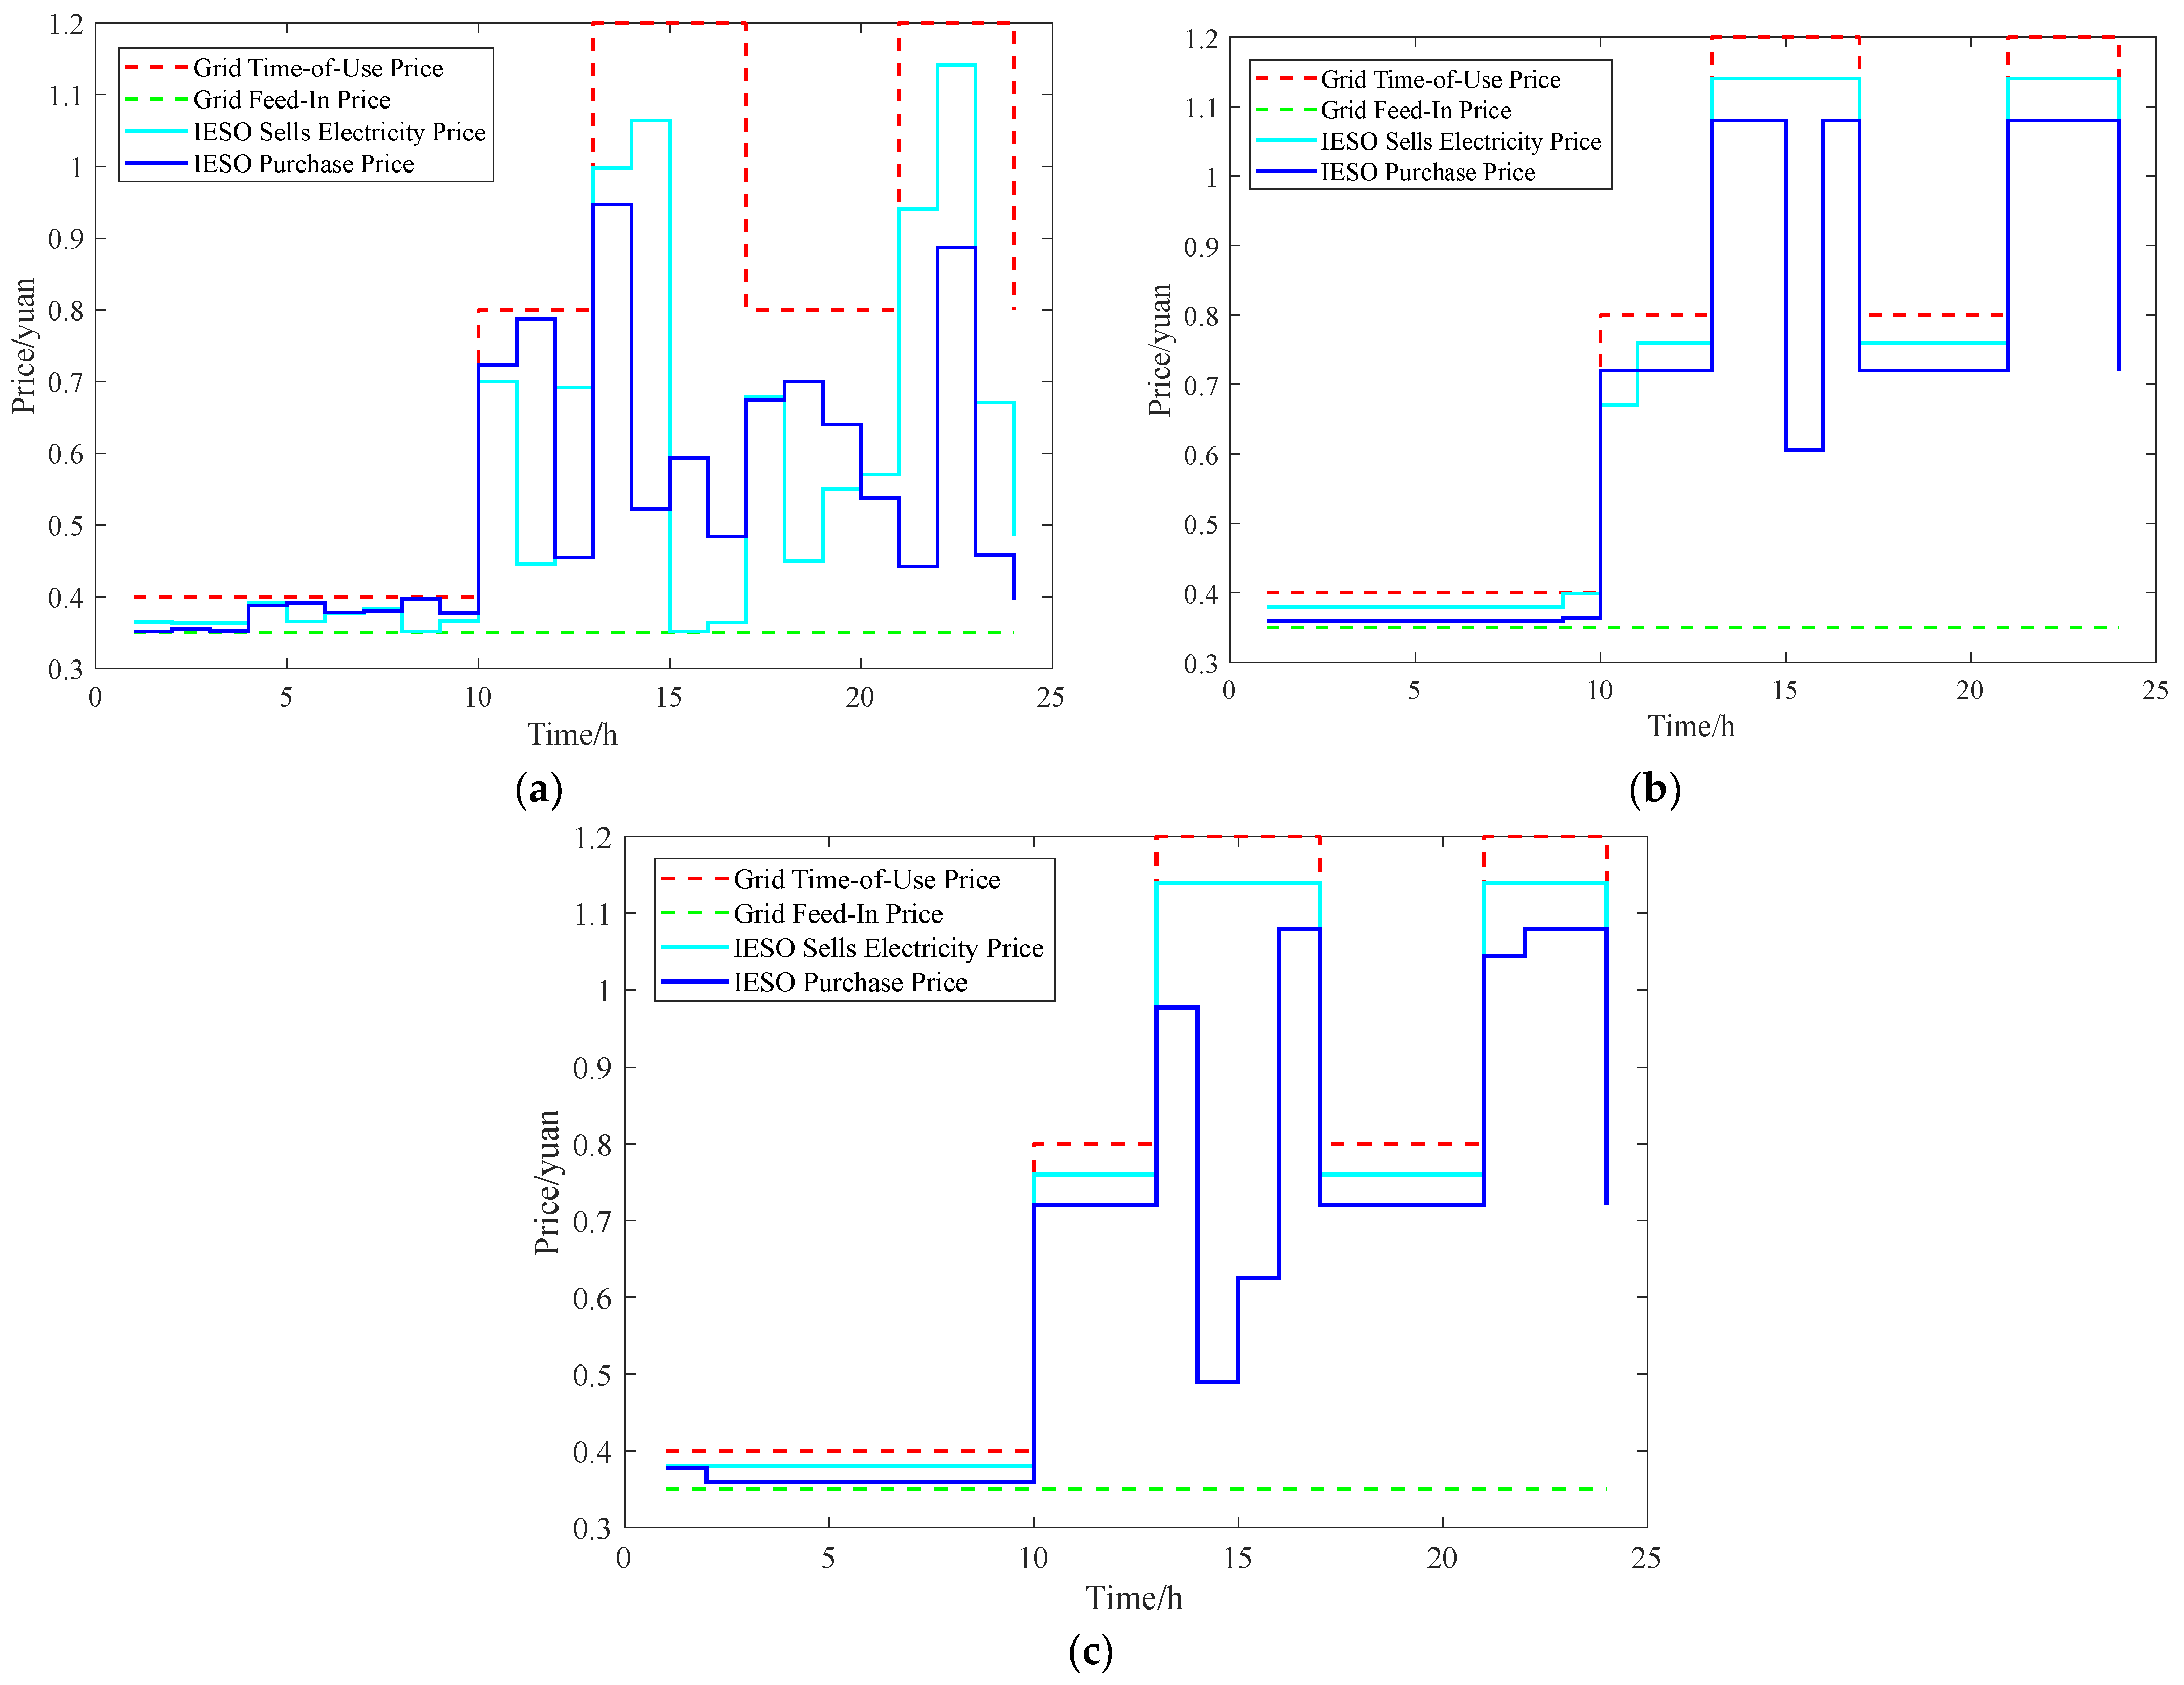
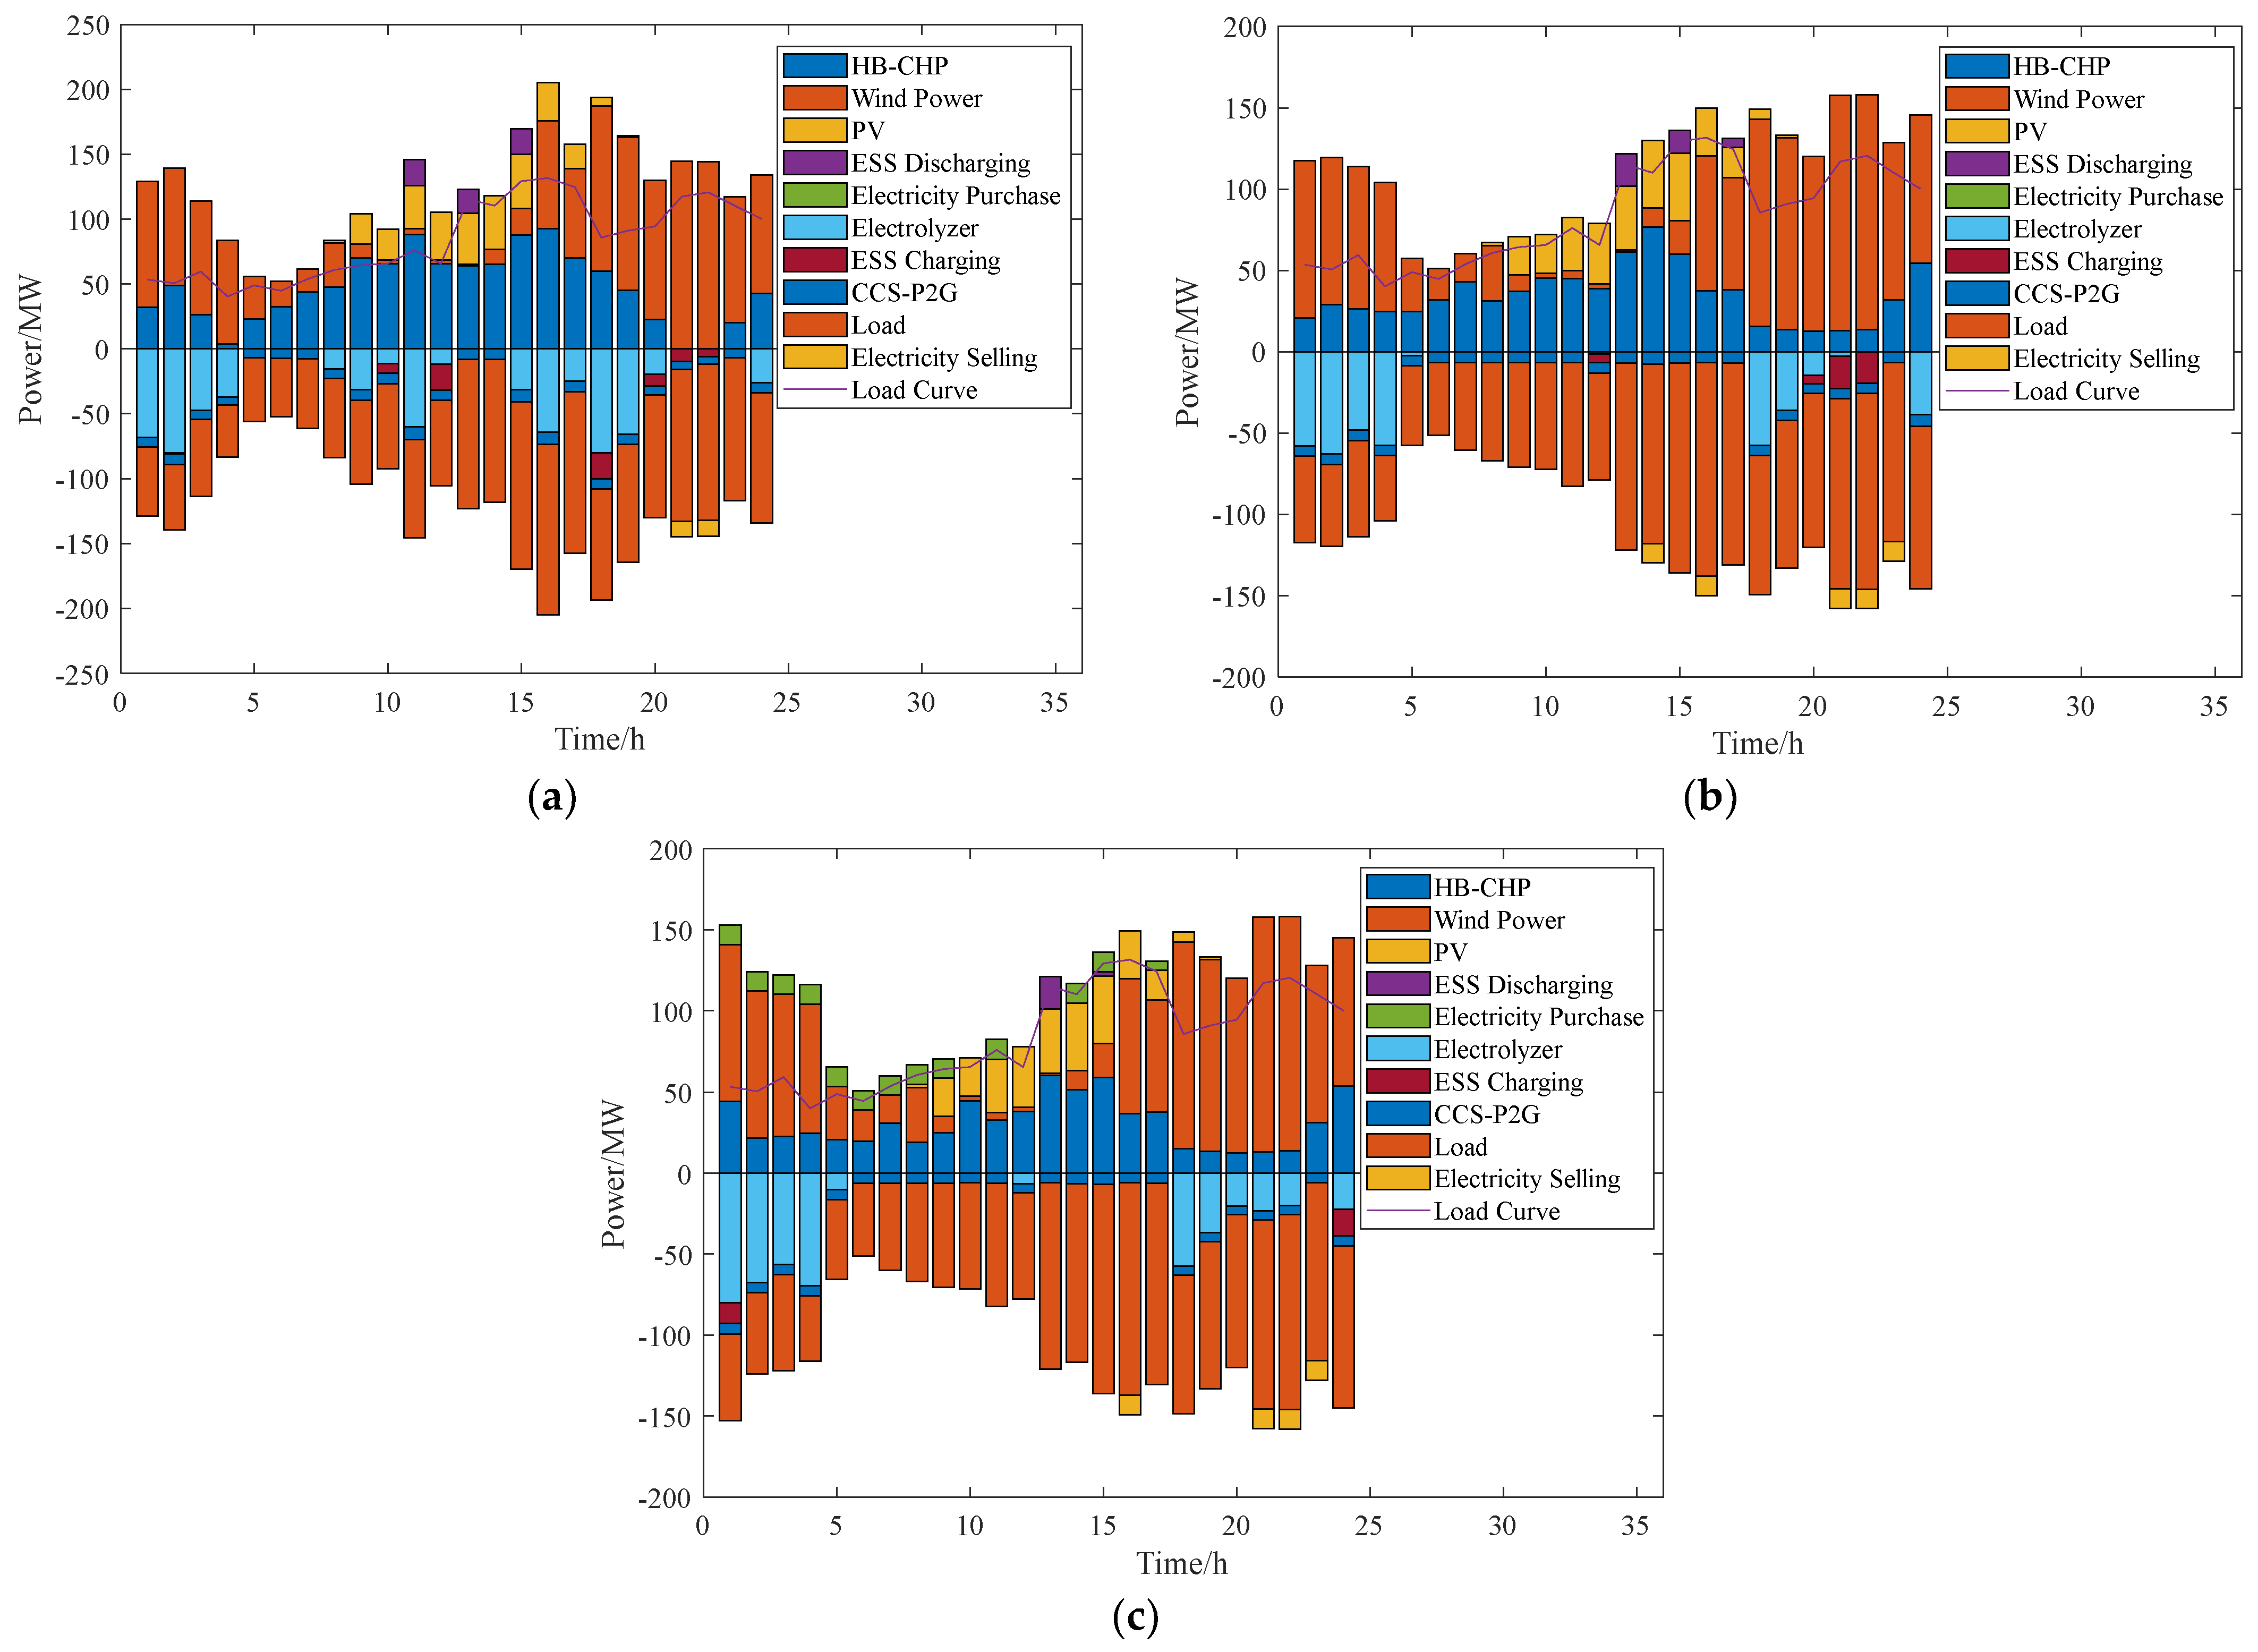
In this paper, the influence of CCS–P2G on the interests of game participants is discussed by setting different flue gas separation ratios. In the case of a fixed hydrogen blending ratio of 10%, the optimized results are shown in Table 2. All costs and benefits in the table are in tens of thousands of CNY. The IESO price strategy under different flue gas separation ratios is shown in Figure 7. Through the analysis of Figure 7 and Table 2, in the main scenario, the flue gas separation ratio is 0.8 and the energy consumption of the CCS–P2G system is high. In addition, the electric load balance of IES system under different flue gas separation ratio is shown in Figure 8. The electricity price strategy and electric load balance with flue gas separation ratio of 0.8 are shown in Figure 5a and Figure 6a. To ensure the balance between supply and demand, IESO continues to increase the price of electricity purchases, reduce the price of electricity sale, and encourage the output of HB–CHP units and the operation of CCS–P2G. However, with an increase in the internal natural gas production capacity of IES, the system reduces the energy purchase from the superior gas, but the hydrogen energy purchase cost increases, therefore, the profit of ES decreases with an increase in the flue gas separation ratio. This shows that the purchase cost of hydrogen accounts for a relatively high proportion of the total energy purchase cost of IES, therefore, achieving the low-cost and efficient production of hydrogen is a key factor in improving the revenue of ES. When the flue gas separation ratio is within 0.2–0.6, the energy consumption of the CCS–P2G system is small. Considering the reduction of CET cost and system energy consumption, ES reduces the output plan of each unit, while IESO appropriately increases the power purchase price during the peak load period to guide the output of each unit to ensure the balance of supply and demand.
Table 2.
Comparison results of different flue gas separation ratios.
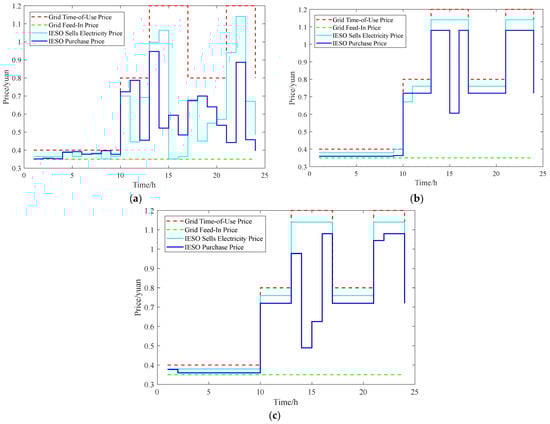
Figure 7.
IESO pricing strategy under different flue gas separation ratios: (a) 0.6; (b) 0.4; (c) 0.2.
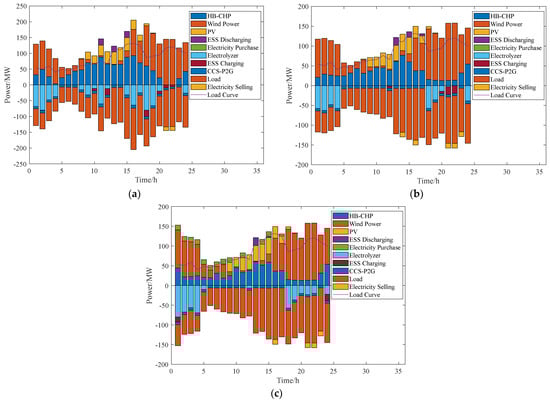
Figure 8.
Electric load balance of IES system under different flue gas split ratios: (a) 0.6; (b) 0.4; (c) 0.2.
4.1.2. Comparison of Hydrogen Blending Ratio
When the flue gas separation ratio of fixed CCS P2G is 0.8, the operation of IES is analyzed by changing the hydrogen blending ratio. The specific optimization results are shown in Table 3, and the electrical load balance of the IES system under different hydrogen mixing ratios is shown in Figure 9. The electric load balance with a hydrogen blending ratio of 10% is shown in Figure 6a. The results in Table 2 show that with an increase in the hydrogen blending ratio, the profit of ES increases, while the actual carbon emission decreases. This is because with an increase in the hydrogen blending ratio, the proportion of hydrogen in the operation process of HB–CHP and HB–GB is larger, thus reducing carbon emissions. At this time, by setting a higher energy purchase price, the low-carbon operation of the unit and the joint operation of CCS–P2G can further reduce carbon emissions, resulting in an increase in the income from the sale of ES energy. With an increase in the hydrogen mixing ratio, the cost of the hydrogen purchase increases, and the ratio of the hydrogen purchase cost to the total cost increases. This indicates that with an increase in the hydrogen blending ratio, IESO increases the internal hydrogen production of the system and reduces the proportion of external hydrogen supply in order to reduce the huge cost of hydrogen purchase. In general, the growth rate of ES’s revenue from selling energy is greater than that of purchasing energy cost and operation and maintenance cost, therefore, the profit of ES will increase with the increase in the hydrogen blending ratio.
Table 3.
Results of different hydrogen blending ratios.
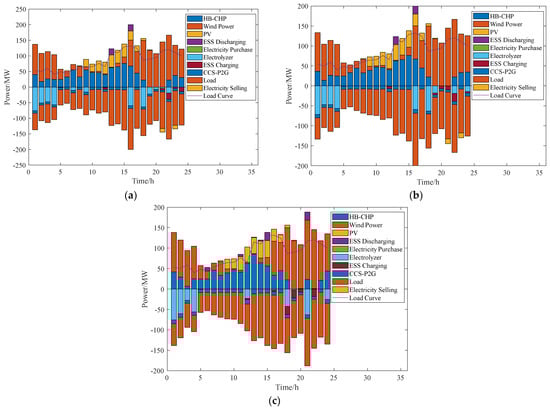
Figure 9.
Electric load balance of IES system under different hydrogen blending ratios: (a) 20%; (b) 15%; (c) 5%.
4.2. MILP–PSO Algorithm’s Limitations
Moreover, to facilitate CPLEX solving, the optimization of ES’s power output schedule was transformed into a MILP problem. The formulation of IESO’s optimal pricing strategy, being a nonlinear problem, is addressed using the PSO. The MILP–PSO hybrid approach combines the precision of MILP with the global search capability of PSO, yet this integration introduces significant computational complexity. When the particle swarm operates in high-dimensional search spaces, the updating and optimization processes may lead to prolonged computation times. Furthermore, the configuration of constraints and the objective function in MILP critically influences the overall solution quality. Consequently, future work will focus on refining the algorithm’s search mechanism and optimizing the constraint conditions and objective function settings in MILP.
5. Conclusions
This paper presents an IES optimization scheduling method based on the master–slave game, considering the joint operation of carbon trading and CCS–P2G. Firstly, the mathematical model and game frame of IES are introduced. Then, the MILP–PSO algorithm is used to solve IES. Finally, through the analysis of different gas separation ratios and hydrogen blending ratios of the operating state, the conclusions are as follows:
- (1)
- The purchase cost of hydrogen and natural gas plays a decisive role in the energy purchase cost. Therefore, how to achieve low cost of hydrogen production and high efficiency of utilization, as well as rational use of natural gas and improvement of joint operation efficiency of CCS–P2G are the key factors for improving the revenue of ES. The simulation results show that higher gas and hydrogen purchase costs will lead to higher energy purchase costs but not necessarily higher revenue from energy sales. For example, the comparison of the results of the 15% and 20% hydrogen mixing ratios in Table 2.
- (2)
- With the change of hydrogen blending ratios and flue gas separation ratios of the system, IESO promotes the active operation of each unit of the system through continuous optimization of the price strategy, which not only reduces the carbon emissions but also increases the profits of ES. Moreover, the price strategies of each energy source change with the change of the operating state of the system, and the interests of the game participants are maximized, which reflects the rationality of the game framework designed. Under the main scenario of a 10% hydrogen blending ratio and a 0.8 flue gas separation ratio, IESO and ES have an income of RMB 181,900 million and CNY 279,400, respectively, and the actual carbon emission is 106.75 tons, which is in the overall balance of income and carbon emission.
- (3)
- The carbon trading mechanism encourages IESO to reduce CET costs by optimizing price strategies, promoting the use of clean energy, stimulating carbon reduction potential, and maximizing its own profits while ensuring ES’s profits.
IESs with regard to future energy transformation, environmental protection, economic development and other aspects need more diversity of energy; therefore, achieving the utilization of both hydrogen energy and biomass energy is the future research direction.
Author Contributions
Writing—original draft preparation, S.S.; methodology, J.X.; writing—review and editing, Q.A.; software and formal analysis, Y.C.; resources, P.Y.; investigation, Y.W.; visualization, S.Y. All authors have read and agreed to the published version of the manuscript.
Funding
This research is funded by the Science and Technology Project of State Grid Shandong Electric Power Company (52062622000R, Research on Aggregation and Regulation Technology of Regional Integrated Energy System).
Data Availability Statement
Data are available upon request due to restrictions (e.g., privacy, legal or ethical reasons).
Conflicts of Interest
The authors declare that they have no known competing financial interests or personal relationships that could have appeared to influence the work reported in this paper.
Nomenclature
| Abbreviations | |
| CCS | carbon capture system |
| CET | carbon emission trading |
| CHP | combined heat and power |
| ES | energy supplier |
| ESS | energy storage system |
| GB | gas-fired boiler |
| HB | hydrogen blending |
| IES | integrated energy system |
| IESO | integrated energy system operator |
| P2G | power to gas |
| Parameters | |
| the interaction cost of IESO | |
| the CET cost of ES | |
| the ES operation and maintenance cost | |
| the carbon quota obtained by the IES | |
| the capacity of type k energy storage | |
| the ES revenue from sale of energy | |
| the IESO revenue from sale of energy | |
| the amount of carbon dioxide actually captured by CCS | |
| the hydron production of electrolyzer | |
| the hydron consumption of reactor | |
| the electrical output of the HB–CHP | |
| the power that CCS consume | |
| the thermal output of the HB–CHP | |
| the thermal output of the HB–GB | |
| the CET cost | |
| the methane production of reactor | |
| the volume of the rich solvent | |
| the volume of the lean solvent | |
References
- He, X.; Tang, Y.; Ma, S.; Ai, Q.; Tao, F.; Qiu, R. Redefinition of digital twin and its situation awareness framework designing toward fourth paradigm for energy internet of things. IEEE Trans. Syst. Man Cybern. Syst. 2024, 54, 6873–6888. [Google Scholar] [CrossRef]
- He, X.; Ai, Q.; Wang, J.B.; Tao, F.; Pan, B.; Qiu, R.; Yang, B. Situation awareness of energy internet of things in smart city based on digital twin: From digitization to informatization. IEEE Internet Things J. 2023, 10, 7439–7458. [Google Scholar] [CrossRef]
- Gao, Y.; Xu, Y.C.; Zhang, T.; Song, W.Y.; Wang, P.; Xi, L.; Lu, M. Multi-microgrid system optimization scheduling including electric vehicle coordinated charging and reward and punishment ladder carbon trading. Electr. Power Constr. 2025, 46, 174–188. [Google Scholar]
- He, B.; Yang, B.; Han, Y.M.; Zhou, Y.M.; Hu, Y.W.J.; Shu, H.C.; Su, S.; Yang, J.; Huang, Y.P.; Li, J.L.; et al. Optimal EVCS planning via spatial-temporal distribution of charging demand forecasting and traffic-grid coupling. Energy 2024, 313, 133885. [Google Scholar] [CrossRef]
- Yang, B.; Wang, J.T.; Chen, Y.X.; Li, D.Y.; Zeng, C.Y.; Chen, Y.J.; Guo, Z.X.; Shu, H.C.; Zhang, X.S.; Yu, T.; et al. Optimal sizing and placement of Energy storage system in power grids: A state-of-the-art one-stop handbook. J. Energy Storage 2020, 32, 101814. [Google Scholar] [CrossRef]
- Hu, Y.W.J.; Yang, B.; Wu, P.Y.; Wang, X.T.; Li, J.L.; Huang, Y.P.; Su, R.; He, G.B.; Yang, J.; Su, S.; et al. Optimal planning of electric-heating integrated energy system in low-carbon park with energy storage system. J. Energy Storage 2024, 99, 113327. [Google Scholar] [CrossRef]
- Sun, H.X.; Duan, J.D. Optimal dispatch of integrated energy system considering joint operation of oxy-fuel combustion power plants and hydrogen doped gas equipment. Therm. Power Gener. 2025, 54, 78–87. [Google Scholar]
- Wang, T.; Huang, Z.; Ying, R.; Valencia-Cabrera, L. A low-carbon operation optimization method of ETG-RIES based on adaptive optimization spiking neural p systems. Prot. Control Mod. Power Syst. 2024, 9, 162–177. [Google Scholar] [CrossRef]
- Huo, Q.H.; Liu, Q.R.; Deng, H.W.; Wang, W.Y.; Shi, C.L.; Wei, T.Z. Research on dual-layer optimization strategy of photovoltaic-storage-hydrogen system in coal chemical industry park. Renew. Energy 2024, 230, 120813. [Google Scholar] [CrossRef]
- Ma, H.R.; Wang, B.; Wang, W.; Dong, X.Z.; Liu, S.F. Review of collaborative regulation and interactive trading of urban integrated energy system. High Volt. Eng. 2024, 50, 1357–1375. [Google Scholar]
- Liang, T.; Zhang, X.C.; Tan, J.X.; Jin, Y.W.; Lv, L.N. Optimization and scheduling of electrothermal hydrogen coupled comprehensive energy system based on PPO algorithm. Acta Energiae Solaris Sin. 2024, 45, 73–83. [Google Scholar]
- Ren, H.B.; Zhang, Y.C.; Wu, Q.; Li, Q.F. Research review on planning and operation dispatch of integrated energy system for resilience enhancement. Autom. Electr. Power Syst. 2024, 1–16. Available online: https://link.cnki.net/urlid/32.1180.TP.20240604.1438.010 (accessed on 10 January 2025).
- Hu, X.; Li, S.L.; Wang, D.; Chen, Q.C.; Yu, J. Review and prospect of exergy in theory, modelling, and applications of integrated energy systems. Electr. Power Constr. 2024, 45, 1–15. [Google Scholar]
- Zhang, S.H.; Gu, W.; Yu, R.Z.; Lu, S.; Yao, S.; Zhuang, W.N. Modeling and simulation of integrated energy system: Review, reflection and prospects. Autom. Electr. Power Syst. 2024, 48, 1–12. [Google Scholar]
- Noble, D.; Wu, D.; Emerson, B.; Sheppard, S.; Angello, L. Assessment of current capabilities and near-term availability of hydrogen-fired gas turbines considering a low-carbon future. J. Eng. Gas Turbines Power 2021, 143, 41002. [Google Scholar] [CrossRef]
- Xia, S.W.; Cai, L.Y.; Tong, M.Z.; Wu, T.; Peng, L.; Gao, X. Regulation flexibility assessment and optimal aggregation strategy of greenhouse loads in modern agricultural parks. Prot. Control Mod. Power Syst. 2024, 9, 98–111. [Google Scholar] [CrossRef]
- Zhou, B.; Da, X.; Li, C.; Chung, C.Y.; Cao, Y.; Chan, K.W.; Wu, Q. Optimal scheduling of biogas solar-wind renewable portfolio for multi-carrier energy supplies. IEEE Trans. Power Syst. 2018, 33, 6229–6239. [Google Scholar] [CrossRef]
- Li, J.L.; Yang, B.; Huang, J.X.; Guo, Z.X.; Wang, J.B.; Zhang, R.; Hu, Y.W.J.; Shu, H.C.; Chen, Y.X.; Yan, Y.F. Optimal planning of electricity–hydrogen hybrid energy storage system considering demand response in active distribution network. Energy 2023, 273, 127142. [Google Scholar] [CrossRef]
- Kang, C.Q.; Du, E.S.; Li, Y.W.; Zhang, N.; Chen, Q.X. Key scientific problems and research framework for carbon perspective research of new power systems. Power Syst. Technol. 2022, 46, 821–833. [Google Scholar]
- Zhang, X.H.; Liu, X.Y.; Zhong, J.Q. Integrated energy system planning considering a reward and punishment ladder-type carbon trading and electric-thermal transfer load uncertainty. Proc. CSEE 2020, 40, 6132–6141. [Google Scholar]
- Tang, X.; Yuan, F.; Dai, Y.; Liu, W.M.; Zhang, H. Optimal scheduling of comprehensive energy systems considering tiered carbon trading mechanism and load response. Shandong Electr. Power 2024, 51, 74–84. [Google Scholar]
- Fang, S.Z.; Zhang, J.; Long, C.Y.; He, Y.; Ao, X. Multi-objective stochastic optimization of CCS coupled P2G hydrogen-containing integrated energy system. Electron. Sci. Technol. 2025, 38, 1–11. [Google Scholar] [CrossRef]
- Wang, S.; Ge, S.N.; Zhang, C.L.; Zhang, Y.; Han, W. Low-carbon optimal scheduling of integrated energy systems with source-load flexible response and joint CCPP-P2G operation. Proc. CSU-EPSA 2024, 1–11. [Google Scholar] [CrossRef]
- Ye, Y.J.; Xing, H.J.; Mi, Y.; Yan, Z.; Dong, J. Low-carbon optimal dispatching of integrated energy system considering low-carbon demand response and Stackelberg game. Autom. Electr. Power Syst. 2024, 48, 34–43. [Google Scholar]
- Chen, L.; Rong, S.M.; Wang, C. Low-carbon co-dispatch of integrated regional energy systems considering demand side resource participation. Electr. Power Constr. 2024, 45, 54–64. [Google Scholar]
- Zhang, H.; Zhang, R.F.; Zhou, J.C.; Sun, F.L.; Jiang, D.L. Low-carbon economic dispatch of integrated energy system in campus based on stackeberg game and hybrid carbon policy. Acta Energiae Solaris Sin. 2023, 44, 9–17. [Google Scholar]
- Kong, W.Z.; Wu, X.Y.; Dai, H.C.; Xu, K.W. Multi-objective optimal scheduling of park integrated energy system with cooperative game solving. Electr. Drive 2023, 53, 31–38. [Google Scholar]
- Zhu, R.; Reng, Y.F.; Meng, Q.T.; He, J.W.; Pan, Y. Electricity-heat-gas cooperative optimal operation strategy of integrated energy system based on cooperative game. Acta Energiae Solaris Sin. 2022, 43, 20–29. [Google Scholar]
- Cui, Y.X.; Liu, X.P.; Chen, M.M. Experimental study of natural gas mixed with hydrogen under full pressure of f-class heavy duty gas turbine burner. Gas Turbine Technol. 2021, 34, 38–42. [Google Scholar]
- Tian, S.Y.; Zhu, Z.J.; Jiang, J.; Liu, W.K.; Wan, Z.T. Research and development status and the latest techno-logical progress of hydrogen fuel gas turbine research. Energy Res. Manag. 2021, 4, 10–17+41. [Google Scholar]
- Chen, Q.X.; Ji, Z.; Kang, C.Q.; Ming, H. Analysis on relation between power generation and car-bon emission of carbon capture power plant in different operation modes. Autom. Electr. Power Syst. 2012, 36, 109–115+152. [Google Scholar]
- Yang, D.F.; Liu, H.W.; Sun, Y.; Li, B.J.; Liu, C. Multi-agent joint peak regulation optimal scheduling considering green certificate trading mechanism and deep peak regulation compensation for carbon capture power plant. Power Syst. Technol. 2024, 48, 100–109. [Google Scholar]
- Deng, H.W. Evaluating Nodal Energy Price of Carbon Emission-Embedded Electricity-Gas-Heat Integrated Energy System. Master’s Thesis, Northeast Electric Power University, Jilin, China, 2019. [Google Scholar]
- Chen, D.Y.; Liu, F.; Liu, S. Optimization of virtual power plant scheduling coupling with P2G-CCS and doped with gas hydrogen based on stepped carbon trading. Power Syst. Technol. 2022, 46, 2042–2053. [Google Scholar]
- Yang, B.; Li, J.L.; Shu, H.C.; Cai, Z.L.; Tang, B.; Huang, X.Y.; Zhu, M.M. Recent advances of optimal sizing and location of charging stations: A critical overview. Int. J. Energy Res. 2022, 46, 17899–17925. [Google Scholar] [CrossRef]
- Yang, B.; Yu, L.; Chen, Y.X.; Ye, H.Y.; Shao, R.N.; Shu, H.C.; Yu, T.; Zhang, X.S.; Sun, L.M. Modelling, applications, and evaluations of optimal sizing and placement of distributed generations: A critical state-of-the-art survey. Int. J. Energy Res. 2021, 45, 3615–3642. [Google Scholar] [CrossRef]


Disclaimer/Publisher’s Note: The statements, opinions and data contained in all publications are solely those of the individual author(s) and contributor(s) and not of MDPI and/or the editor(s). MDPI and/or the editor(s) disclaim responsibility for any injury to people or property resulting from any ideas, methods, instructions or products referred to in the content. |
© 2025 by the authors. Licensee MDPI, Basel, Switzerland. This article is an open access article distributed under the terms and conditions of the Creative Commons Attribution (CC BY) license (https://creativecommons.org/licenses/by/4.0/).