Abstract
Glass fiber filter media are widely used to remove submicron liquid droplets from air and gas streams. However, there is still a challenge to obtain filter media with high efficiency and low resistance. In this study, the electrospinning method was used to deposit a nanofiber membrane on the micron fiber filter media. The filtration performance and liquid distribution in the filters with different electrospinning area ratio were analyzed. The filtration performances of dual-layer filters with different combinations were investigated. The results show that with the increase in electrospinning area ratio, the filtration efficiency of oleophilic filters can be improved, while it seems to have no effect on the filtration efficiency of oleophobic filters. At the initial stage of filtration, there is liquid film forming on the electrospinning area for both the oleophilic and oleophobic filters, resulting in an increase airflow resistance on the non-electrospinning area. As the nanofiber membrane is coated on the up region of the first layer filter media, with the increase in the electrospinning area ratio, the steady pressure drop increases for the dual-layer combinations based on oleophilic filter media, while the filtration efficiency increases gradually for the dual-layer combinations based on both oleophilic and oleophobic filter media. The best filtration performance was found for Filter B-U75-D25.
1. Introduction
The emission of oil mists usually occurs in industrial processes such as engine crankcase ventilation, machine sealing and lubrication, natural gas transportation, resulting in air pollution, extra energy consumption, and machine damage [1,2,3]. Therefore, it is significant to separate oil mist from gas, for which one of the most effective methods is coalescence filtration. With the increasingly stringent requirements, there is a growing need to improve the filtration performance.
Electrospun nanofibers were widely applied in different areas such as ion-change membrane for green hydrogen application, which attributes higher efficiency for filtration due to the small fiber diameter and high porosity. A large number of works have been conducted for investigating the effect of structural parameters of nanofibers on particle filtration [4,5,6,7]. Wang et al. [8] prepared porous bead-on-string polylactic acid nanofibers by adjusting the concentration of electrospinning solution and solvent composition and found that moderate size and number of beads contributed to reduce pressure drop, while filtration efficiency was improved due to the nanopores and small fiber diameter on the beads. Zhang et al. [9] studied the effect of the gradually varied pore structures on filtration performance for integrated filter with microfiber and nanofiber layers. A filtration efficiency of 99.992% for 300 nm particles and a low pressure drop were obtained for the structure with gradually decreasing pores. Bian et al. [10] developed a semi-empirical model to predict the pressure drop of electrospun nanofiber filters. The results showed that the pressure drop was proportional to the face velocity and filter thickness.
There are still a few studies on the application of electrospun nanofibers in gas–liquid coalescence filtration. Hajra et al. [11] compounded a layer of polyamide nanofibers with an average fiber diameter of 0.15 μm on commercial glass fiber filter media. It was found that the addition of nanofiber membrane significantly improved the coalescence performance. Podgorski et al. [12] produced filters composed of micrometer and nanometer sized fibers by modified melt-blowing technology. The results showed that there was a greater penetration of sub-micrometer droplets when the nanofiber layer was too thin, even it had the lowest mean fiber diameter. With the increase in nanofiber layer thickness, aerosol particle penetration decreased gradually. Patel et al. [13] improved the gas–liquid filtration efficiency from 87% to 99% by combining nanofibers with glass fibers and inserting inclined drainage channels. The above studies indicate that the application of nanofibers in gas–liquid filtration can improve the filtration efficiency. However, due to the denser fiber structure and smaller pore size distribution of nanofibers, the pressure drop at steady state will remarkably increase, which is not conducive to the optimization of the overall performance.
Recently, Zhu et al. [14] proposed a method for surface modification of nanofibers to solve the problem of excessive pressure drop. A hierarchical SiO2@PTFE nanofiber membrane was prepared with the coaxial electrospinning method, and then the membrane was in situ was grafted with 1H,1H,2H,2H-perfluorooctyltrimethoxysilane to obtain amphiphobic characteristics, of which the filtration efficiency for oil mist with an average particle size of 0.26 μm was higher than 99%, while the pressure drop was low as 2.5 kPa during 60 min filtration. Zheng et al. [15] fabricated a nanofiber membrane with curled PVDF (Polyvinylidene Fluoride) nanofiber pattern through the electrospinning process. It was found that the optimized curled PVDF nanofibrous membrane had better filtration performance than the straight fiber. Gibson et al. [16] investigated the effect of electrostatic patterning on electrospun fibrous membranes and found that patterning over the range of grid spacings from 0.2 cm to 0.008 cm had no significant differences in mean pore size, flow resistance, or aerosol filtration. Liu et al. [17] proposed a patterned nanofiber membrane with periodic variation in packing density. For the arrangement that the dense and loose packing areas staggering between the layers, the initial pressure drop of the filter was significantly reduced. However, the filtration performance at the steady-state stage has not been studied.
In previous studies, it has been proved that coating nanofiber membrane on microfiber filter medium can improve the filtration performance. However, there are still few works investigating the effect of patterned nanofiber membrane on the filtration performance for coalescence filtration process. In this paper, nanofiber membranes are deposited on commercial glass fiber filter media. The influence of different nanofiber membrane areas and combinations on the filtration performance was explored. Liquid transportation in the filters was observed. It may inspire the development of low-resistance and high-efficiency nanofiber filter media for oil mist filtration.
2. Experimental Setup and Method
Two types of commercial glass fiber filter media were used as experimental materials, of which the properties are listed in Table 1. Fiber diameter was obtained according to the Davies formula [18]. The experimental oil is di-ethyl-hexyl-sebacate (DEHS) with a surface tension of 0.03 N/m, dynamic viscosity of 0.023 Pa·s, density of 912 kg/m3 at atmospheric pressure and room temperature. The contact angle of DEHS on the filter media was measured using an optical tensiometer (Attension Theta, BiolinScientific, Gothenburg, Sweden).

Table 1.
Properties of filter media.
Figure 1 shows the principle of electrospinning and SEM image of electrospun nanofibers. The electrospinning solution was obtained by dissolving 10 wt% polyacrylonitrile (PAN, relative molecular weight is 150,000, purchased from McLean Co., LTD., Shanghai, China) in N, N-dimethylformamide (DMF, purity is 99.5%, purchased from Aladdin Co., Ltd., Shanghai, China) under magnetic stirring for 24 h at 45 °C. A 5 mL syringe was fixed in the injection device of which the needle was connected to the positive electrode of the high-voltage power supply, while the collector was connected to the negative electrode. The injection speed was 0.2 mm/min, and the rotating speed of the collector was at 40 r/min. The ambient temperature was maintained at 22 °C and the ambient humidity was controlled in the range of 10–20% for electrospinning. The applied voltage was 19 kV. The distance between the needle and the center of the collector was 14 cm. The spinning time for one medium was 20 min. The patterned nanofiber membrane was prepared by covering an insulating thin sheet on the surface of the substrate. The composite filter material was dried in an oven at 60 °C for 1 h to enhance the combined strength between the nanofiber membrane and the substrate. The microstructure of the prepared nanofibers was shown in Figure 1b. The fiber diameter and distribution are uniform. The fiber surfaces are smooth and there are no beads on the fibers.

Figure 1.
(a) Illustration of electrospinning procedure; (b) SEM image of nanofibers.
The composite filter material was prepared based on one layer filter medium. The electrospinning area ratio (EAR) was used to define the ratio of the electrospinning surface area to the total surface area of the filter media:
where Af,elec is the electrospinning surface area in the filter media (m2), Af,treat is the total surface area of the filter media (m2).
Figure 2 shows the filter media with different EARs. Green section represents the substrate. Blue section represents the electrospinning area (nanofibers). The filters were named after the EAR, such as Filter A-50%, meaning that the filter was composed of 1 layer of Glass fiber A with the electrospinning surface area ratio of 50%. It is marked as 0% for the untreated filter.

Figure 2.
Schematic illustration of filter medium with different electrospinning area ratios.
Figure 3 shows the experimental set-up. After the filtration by a HEPA (High Efficiency Particulate Air Filter, Minneapolis, MN, USA), the compressed air flows in an aerosol generator (9306A, TSI, Minneapolis, MN, USA), where liquid aerosol is produced as the compressed passing through the atomizing nozzle. The aerosol is mixed with the clean air, and then it flows through the test filter. Small liquid droplets are captured by the fibers in the filter and then coalesced. The coalesced liquid drains out of the filter at the rear face. The filtered air is extracted by a vacuum pump. The area of the filter for air flow was 100 cm2. During the experiment, the pressure drop is measured by a differential pressure sensor (EJX-110A, Yokogawa, Tokyo, Japan). Scanning electromobility particle size spectrometer (SMPS 3936, TSI, Minneapolis, USA) is used to measure aerosol concentration and particle size distribution at the upstream and downstream of filters. The face velocity for all experiments is 0.12 m/s. The loading rate of liquid aerosol is maintained at 48 mg/(m2·s) during the whole experiment. The fluctuation of loading rate is than 2% within 10 h of continuous operation. Each layer filter medium in the filter is weighed immediately after the experiment. The saturation can be obtained from the mass before and after the experiment. The comprehensive filtration performance of filters could be determined by quality factor (QF), which was calculated based on filtration efficiency and pressure drop. The saturation (S) and quality factor (QF) can be calculated using the following equations:
where mf is saturated filter media mass (kg), mf,dry is dry filter media mass (kg), ρl is oil density (kg/m3), V is filter media volume (m3), ∆p is pressure drop (Pa), E is filtration efficiency (%).
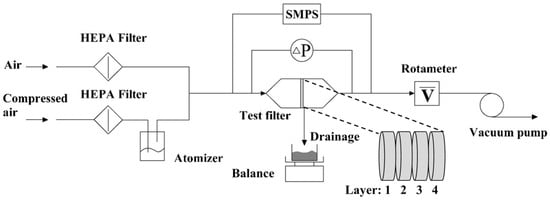
Figure 3.
Schematic of experimental setup.
To obtain the dynamic characteristics of liquid in the filters, an ultraviolet curing adhesive is used to generate the liquid aerosol. At the steady state stage, the liquid distribution could be obtained as the liquid droplets are cured instantaneously by irradiating the surface of the filter with ultraviolet light. At room temperature, the density of the adhesive is 1053 kg/m3, surface tension is 0.03 N/m, and dynamic viscosity is 0.021 Pa·s, which are similar as DEHS, meaning that the obtained results can represent the distribution of DEHS on the filter.
3. Results and Discussion
3.1. Effect of the Electrospinning Area Ratio
Figure 4 shows the evolution of pressure drop of Filter A and Filter B with different EARs. It can be seen from Figure 4a that the pressure drop curves show typical characteristic of oleophilic filters when the EAR is 0~75% according to the Jump-and-Channel model [19,20], in which the pressure drop first increases slowly (ΔPchannel), then rises sharply (ΔPjump) and finally remains stable. Accordingly, the evolution of pressure drop can be divided into the channel stage, jump stage, and steady stage. It was found that the pressure drop curves of Filter A-25%, A-50%, and A-75% were almost overlapped and in the same fashion as that of the Filter A-0%, implying that the electrospinning area had little influence on the pressure drop. However, the time for reaching the jump stage was reduced for the filters with nanofiber membranes, meaning that the time for the liquid to transport from the front side of the filter to the rear side is shortened. In fact, there is a liquid film forming on the surface of nanofiber membrane, leading to an increase in resistance for the movement of the liquid, because of which, however, the aerosols preferentially flow into the non-electrospinning area. In this case, both the gas flowrate and liquid loading rate in the non-electrospinning area increase within the same time, resulting in an acceleration for the liquid transportation in the filters. The above analysis is further confirmed by the result in the following study, which is the longer electrospinning time leads to the less time for the liquid transports in the non-electrospinning area. As the EAR is 100%, the pressure drop increased significantly at the beginning of the experiment. The prepared nanofiber membrane in this paper are oleophilic. Liquid droplets entrained by the air were intercepted by the nanofiber membrane as it flowed in the filter, resulting in the formation of a liquid film on the surface. As all the surface of filter medium was covered by the membrane, most pores were clogged in the front face of filter, leading to a remarkable increase in the flow resistance. Moreover, the time for the channel stage is further shortened, compared with other filters.
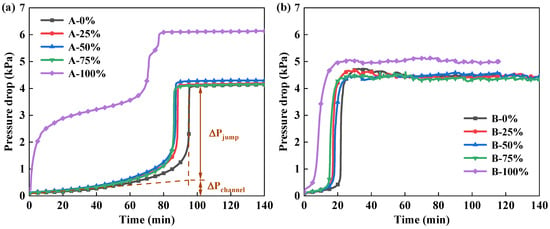
Figure 4.
Evolution of pressure drop of (a) Filter A and (b) Filter B with different electrospinning area ratios.
For oleophobic Filter B, the pressure drop is shown in Figure 4b. After the aerosols began to load, the liquid droplets flowed into the surface of the filter media at the front side of the filter, resulting in a small increase in pressure drop within 20 min. As the substrate is an oleophobic medium, the direction for liquid transportation is opposite to the capillary force, resulting in the captured liquid is not easy to move into the filter. When liquid in the filter media accumulates to some extent, the liquid film is formed and the pressure drop rises sharply. After the jump stage, the liquid transports inside the filter under the action of the air flow until the filter drains. As the filter medium B is oleophobic and with relatively large pore size, the fibers and pores in Filter B are not easily wettened and clogged. Therefore, the pressure drop is basically stable as liquid is transported in the filter at a steady rate.
The same as the oleophilic Filter A, the stable pressure drop of Filter B-25%, B-50%, and B-75% was almost the same as that of the filter without the nanofiber membrane. The time to reach the jump stage is reduced with the increase in the EAR. As the EAR is 100%, the steady pressure drop was obviously higher than that of other filters. Comparing the pressure drop curves between Filter B-0% and B-100%, it can speculate that the liquid film formed on the surface of the nanofiber membrane is denser than that on the surface of the micron fiber substrate, which could be confirmed in the following section.
Figure 5 shows the saturation of the non-electrospinning area and electrospinning area in Filter A and Filter B. It can be seen from Figure 5a that the saturation for both areas in Filter A gradually increases with the increase in the EAR. The saturation of Filter A-100% is 87% more than that of Filter A-0%. For filters with EAR of 25%, 50%, 75%, the saturation of the electrospinning area is higher than that of the non-electrospinning area, meaning that the liquid holding capacity of oleophilic filter material is improved by nanofiber membranes. The larger electrospinning area leads to a stronger liquid holding capacity. For Filter B, the saturation of both the non-electrospinning area and electrospinning area decreases with the increase in the EAR. The saturation of Filter B-100% is 54% lower than that of Filter B-0%. Moreover, the saturation of the electrospinning area is lower than that of the non-electrospinning area in the same filter. It seems that the liquid holding capacity of the oleophobic filter is reduced by the coating nanofiber membranes, which is totally different from the oleophilic filter. It should be noted that the difference in saturation between the non-electrospinning area and electrospinning area in Filter A and B is not caused by the non-uniformity of saturation in the longitudinal direction of the filter. According to previous studies, there is uniform saturation distribution for the glass fiber filter media with such size in this paper [19].
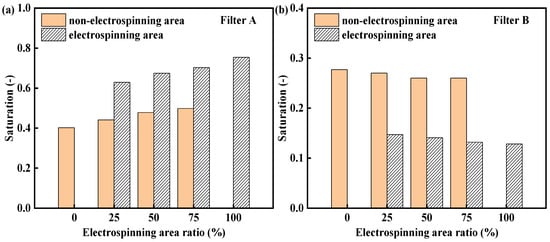
Figure 5.
Saturation of different electrospinning area ratios: (a) Filter A; (b) Filter B.
Figure 6 shows the overall filtration efficiency and quality factor of Filter A and B with different EARs for droplets greater than 100 nm. For Filter A, the filtration efficiency increases with the increase in the EAR. When the EAR is 100%, the filtration efficiency is significantly improved. In terms of quality factor, when the EAR increases from 0% to 50%, the filtration efficiency gradually increases and the pressure drop is almost the same, resulting in an increase in the quality factor. With the further increase in the EAR, both the filtration efficiency and pressure drop increases, resulting in the quality factors are in the same level. For Filter B, the changes in the filtration efficiency and quality factor are different from those of Filter A, as shown in Figure 6b. The filtration efficiency of filters with different EARs is in the range of 83% to 85%. However, the pressure drop of Filter B-100% is remarkably higher than that of other filters, resulting in a decrease in quality factor. The different results between the oleophilic filter and oleophobic filter indicates that the filtration performance of filters with nanofiber membrane is greatly affected by the wettability.

Figure 6.
Filtration efficiency and quality factor of (a) Filter A and (b) Filter B with different electrospinning area ratios.
3.2. Liquid Transportation and Distribution in the Filter Media
According to the results in Section 3.1, the filtration efficiency, pressure drop, and saturation of oleophilic and oleophobic filter media are affected to different degrees by the EARs, which means that the nanofibers membranes change the liquid transportation and distribution in the filters. The filter with EAR of 50% was taken as an example in this section, of which the liquid distribution at different times during the filtration process was investigated.
3.2.1. Oleophilic Filter Media
Figure 7 shows the saturation of the non-electrospinning area and electrospinning area in Filter A-50% at 10 to 90 min under the same conditions. As can be seen, the saturation of the electrospinning area is close to but always slightly lower than that of the non-electrospinning area at the channel stage (0–50 min). It is reasonable to speculate that the flow resistance for liquid in the electrospinning area is higher than that in the non-electrospinning area at this stage. For the electrospinning area, the nanofibers are relatively dense and with smaller pore size than the substrate, where it is easier to form liquid film after capturing liquid than in the non-electrospinning area, resulting in increased transportation resistance for liquid into the filter.
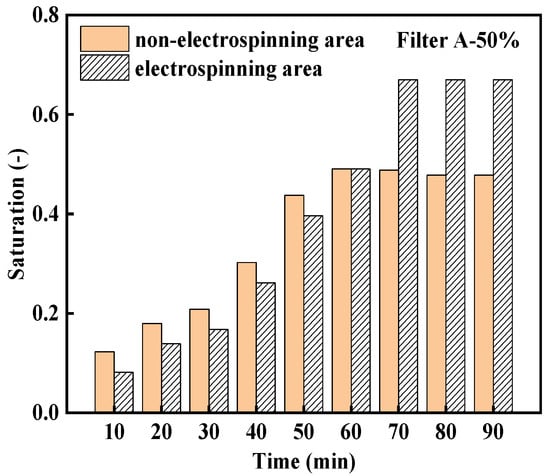
Figure 7.
Evolution of the saturation of Filter A-50% with time.
To confirm the above speculation, the liquid distribution on the front side of the Filter A-50% was obtained by using the ultraviolet curing method, as shown in Figure 8. It shows that there was a large surface area liquid film at the electrospinning area, in which most pores were clogged and there were only a small number of pores for the airflow. While there was no obvious liquid film forming at the non-electrospinning area. As the resistance to the airflow for the non-electrospinning area is lower than the electrospinning area, the aerosols preferentially flow into the non-electrospinning area, resulting in more liquid captured in the non-electrospinning area. However, it should be noted that the liquid film formed in the electrospinning area is thin, of which the resistance to gas flow is not strong. Moreover, there is the same wettability for the nanofiber membrane and the substrate, leading to the same direction for liquid transportation and the capillary force, for which the liquid captured by the liquid film could further flow into the following oleophilic substrate under the capillary force. Therefore, no significant difference in the saturation was shown between the electrospinning area and the non-electrospinning area at the channel stage. According to Figure 8a, it can be inferred that liquid film is formed on the front surface of Filter A-100%, resulting in a great increase in airflow resistance, which explains why there is the rapid rise in pressure drop in this filter at the beginning of the experiment, as shown in Figure 4. Furthermore, the liquid film formed in the electrospinning area effectively enhances the capture of liquid droplets, thus the filtration efficiency is improved.
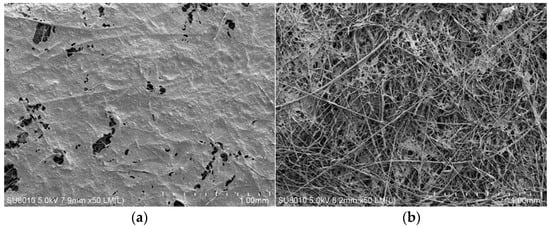
Figure 8.
SEM images of liquid distribution in (a) the electrospinning area and (b) the non-electrospinning area on the front face of Filter A-50%.
Further observation on Figure 7 shows that the non-electrospinning area reaches saturation near the jump stage (60 min), while the saturation of the electrospinning area continues to increase. At the jump stage and steady state stage (70~90 min), the saturation of the electrospinning area is higher than that of the non-electrospinning area, between which the difference (about 0.19) is greatly higher than that at the channel stage (about 0.04). According to the previous analysis, the liquid transportation resistance in the non-electrospinning area is small before reaching the jump stage, resulting that the liquid first transports to the rear side of the filter. With the liquid accumulation on the rear side, more and more pores were clogged and finally a liquid film was formed on the surface, which increases the resistance to airflow in the non-electrospinning area. When the airflow resistance of the non-electrospinning area exceeds that of the electrospinning area, the aerosols flow into the electrospinning area, in which the amount of liquid increases until it reaches the steady stage.
Figure 9 shows the liquid distribution on the rear side of the Filter A-50% at the steady stage. It shows that liquid film with different morphologies is formed on the surface of both electrospinning and non-electrospinning areas. The liquid film in the electrospinning area is thin and formed in the pores, in which there are large and irregular holes. In the non-electrospinning area, the liquid film is thick and completely covers the fibers, of which the surface is smooth and there are small circular holes. The liquid distribution characteristics are consistent with the results of Figure 7. At the jump stage, the liquid film is first formed in the non-electrospinning area. The liquid is adsorbed on the surface of the rear side under the capillary force and more liquid accumulates in the liquid film, resulting in a thicker one. For the electrospinning area, due to the nanofiber membrane with liquid film on the surface of the front side, the filtration velocity in this area is higher, which contributes to the liquid quickly draining out after reaching the rear side of the filter and no thick liquid film being formed.
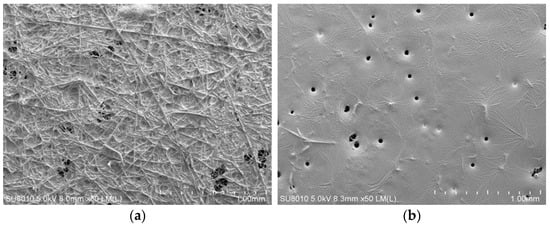
Figure 9.
SEM images of liquid distribution in (a) the electrospinning area and (b) the non-electrospinning area on the rear face of Filter A-50%.
Further, under the conditions of electrospinning time of 40 min and 60 min, the filters with EAR of 50% were prepared. Figure 10 shows the pressure drop of the filters with different electrospinning time. With the increase in electrospinning time, the time for the filters experiencing the channel stage is shorter. Obviously, more electrospinning time attributes the denser nanofibers, resulting in higher airflow resistance as liquid film is formed in the electrospinning area. Aerosols preferentially flow in the non-electrospinning area, which increases the filtration velocity in this region and correspondingly increases the liquid transportation velocity after being captured by the fibers. Therefore, the longer electrospinning time leads to less time for the liquid transports in the non-electrospinning area. On the other hand, for the Filter A-50%-40 min and A-50%-60 min, after the first jump in pressure drop, the “channel and jump” feature is again presented, which is caused by the liquid flow in the electrospinning area.
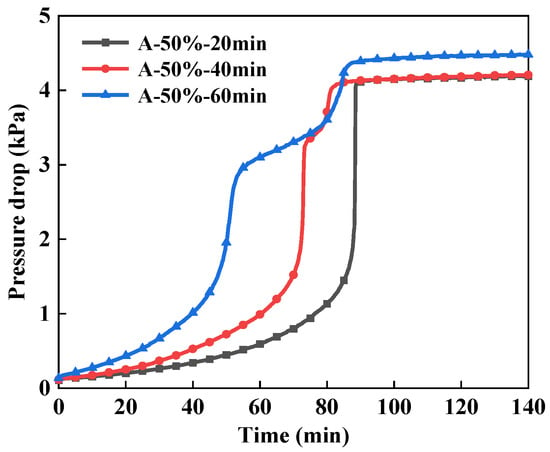
Figure 10.
Evolution of pressure drop of Filter A-50% with different electrospinning time.
Given the saturation changes in the above two filters, as shown in Figure 11, after reaching the first jump stage, the non-electrospinning area is saturated and its saturation no longer changes. However, the saturation of the electrospinning area is still increasing. When the liquid reaches the rear side of the filter, a second jump pressure drop occurs. The results further confirm that the nanofiber membrane on the surface of the oleophilic substrate can change the liquid transportation and distribution in the filter.
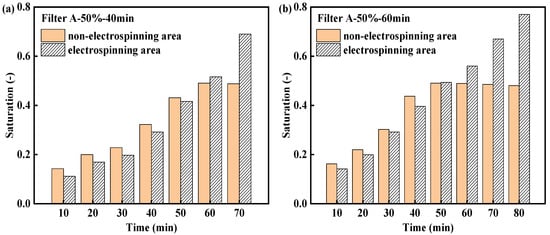
Figure 11.
Evolution of the saturation with time for Filter A-50% with different electrospinning time: (a) 40 min, (b) 60 min.
3.2.2. Oleophobic Filter Media
Figure 12 shows the saturation of the non-electrospinning area and electrospinning area in Filter B-50% at 5 to 30 min under the same conditions. The saturation of the electrospinning area is always lower than that of the non-electrospinning area, between which the difference gradually increases, indicating that the flow resistance for liquid in the electrospinning area is higher than that in the non-electrospinning area during the whole filtration process.
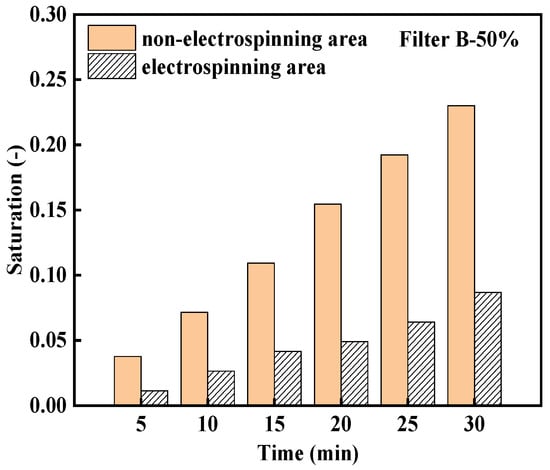
Figure 12.
Evolution of the saturation of Filter B-50% with time.
Figure 13 shows the liquid distribution on the front side of the Filter-B-50%. The electrospinning area was almost covered by liquid film. The area for gas flow is significantly less than Filter A-50%. Although liquid film also appears in the non-electrospinning area, it is much smaller than that of the electrospinning area. According to the Jump-and-Channel model, liquid film is formed on the surface of the front side of the oleophobic glass fiber filter. However, it should be noted that the liquid film distribution is closely related to filter parameters such as fiber diameter and pore size. As the average fiber diameter (≤1 μm) is small, the liquid film is dense [19], the morphology of which is similar to that in Figure 13a. In this study, the average fiber diameter of the filter medium is 2.9 μm, resulting in no large area of dense liquid film forming on the surface of the front side, which is also the reason for the slow rise in pressure drop at the initial stage rather than a jump in pressure drop in Figure 4b.
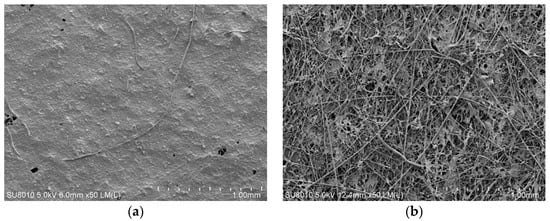
Figure 13.
SEM images of liquid distribution in (a) the electrospinning area and (b) the non-electrospinning area on the front face of Filter B-50%.
Nevertheless, the resistance to the airflow for the electrospinning area is higher than the non-electrospinning area, which the aerosols preferentially flow into. It should be noted that for oleophobic filter medium, the wettability of nanofiber membrane is different from the substrate, resulting in the direction of liquid transportation being opposite to the capillary force, for which the liquid captured by the liquid film is not easy to further flow into the following substrate. Therefore, the amount of liquid in the electrospinning area increased slowly, while the liquid accumulates fast in the non-electrospinning area due to low flow resistance, and the difference in saturation between the two areas is greater with the time.
Figure 14 shows the liquid distribution on the rear side of the filter at the steady stage. There are different liquid distributions for the electrospinning area and non-electrospinning area. Only a small amount of liquid can be observed in the electrospinning area, while there is a large surface area liquid film in the non-electrospinning area. Considering the results of Figure 13, the liquid film formed at the front side of the electrospinning area causes great resistance to the liquid flowing into the filter, which results in a small amount of liquid being transported to the rear side. A large amount of gas flows into the filter through the non-electrospinning area, where liquid transports to the rear side and drains out of the filter by gravity. When the liquid flows on the surface of the filter, the liquid bridges with each other to form liquid film.
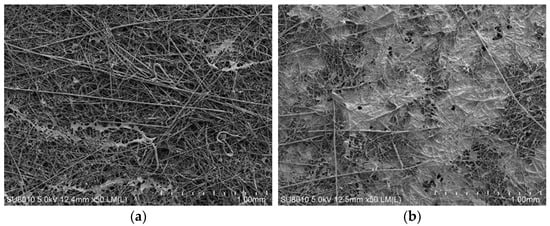
Figure 14.
SEM images of liquid distribution in (a) the electrospinning area and (b) the non-electrospinning area on the rear face of Filter B-50%.
The liquid distribution at the cross section of filter media are shown in Figure 15, in which the air flow direction is from top to bottom. For the electrospinning area, a thin liquid film can be clearly seen at the up surface of the filter medium (the front side). Some liquid transports into the filter medium, but no liquid is observed at the down surface (the rear side). For the non-electrospinning area, there is no liquid film covering on the up surface, but there is obvious liquid accumulation in the lower part of the filter medium. It is worth noting that the liquid distribution in the non-electrospinning area is not uniform, where there are still clean passages, which is different from the continuous large liquid film formed on the rear side of the oleophilic filter medium.
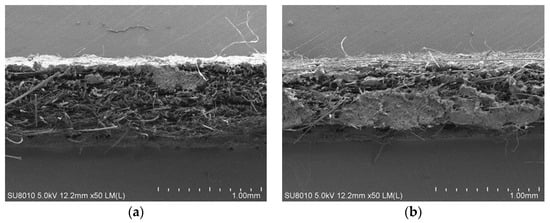
Figure 15.
Cross-sectional view of Filter B-50%: (a) the electrospinning area and (b) the non-electrospinning area.
3.3. Effect of the Combinations of Filter Media with Nanofiber Membrane
The different regions of the filter medium were covered by a nanofiber membrane to investigate the filtration performance of the different combinations of dual-layer filter media, as shown in Figure 16. The electrospinning area in the double layer is staggered. The total electrospinning area of two layers is equal to the area of the single layer filter medium, so that the air can flow uniformly through the medium at the initial experimental stage. The green section represents the substrate. The blue section represents the electrospinning area (nanofibers membrane). The filters are named after the type of filter medium, the location of electrospinning area and the EAR on the front and back layers. For example, Filter A-U25-D75 indicates that the substrate is filter medium A, and the nanofiber membrane on the first filter medium is at the up region with the EAR of 25%, while the nanofiber membrane on the second filter medium is at the down region with the EAR of 75%. The substrate without a nanofiber membrane was used as the control for comparison and named as Filter A/B-0-0.

Figure 16.
Schematically illustration of the combinations of dual-layer filter media.
Figure 17 shows the evolution of the pressure drop curve of dual-layer filters. For Filter A-0-0, Filter A-D25-U75, Filter A-D50-U50, and Filter A-D75-U25, the fashion of the pressure drop is almost the same and the steady-state pressure drop is similar, which is in the range of 4.6~5.1 kPa, implying that the nanofiber membrane located at the down region of the first layer does not change the liquid transportation and distribution in the filter. Interestingly, as the nanofiber membrane located the up region of the first layer, the pressure drop is significantly changed, for which the steady pressure drop increases with the increase in the EAR. The steady-state pressure drop of Filter A-U75-D25 is 48% higher than that of the control. The pressure drop curves of Filter A-U50-D50 and Filter A-U75-D25 are different from that of other combinations, but similar to that of Filter A-100% in Figure 4a, which indicates that a large surface area liquid film appears in the first layer. The nanofiber membrane at the up region captures liquid droplets and liquid film is formed. On the one hand, the liquid captured by the liquid film transports inside the filter with the air flow. On the other hand, a part of the captured liquid could flow to the non-electrospinning area at the down region of the filter medium by gravity. As a result, most of the surface areas of the front side of the filter are covered by the liquid film, resulting in a rapid rise in the pressure drop. However, when the nanofiber membrane is at the down region, the upper non-electrospinning area is not affected by liquid film. As can be seen from Figure 17b, the steady-state pressure drop of all combinations for dual-layer Filter B is relatively similar, ranging from 4.8 to 5.4 kPa. No matter where the nanofiber membrane is in the first layer, as the wettability of the nanofibers is opposite to that of the substrate, the jumps in pressure drop occur for all combinations at the initial stage, resulting in no great variation in the pressure drop for oleophobic filters with nanofiber membrane.
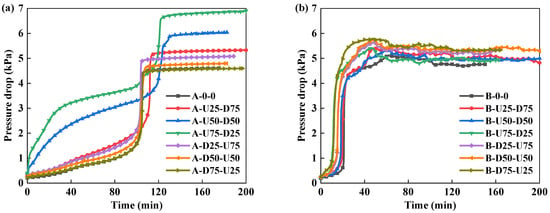
Figure 17.
Evolution of pressure drop of dual-layer (a) Filter A and (b) Filter B with different combinations.
Figure 18 shows the overall filtration efficiency and quality factor of dual-layer filter for droplets greater than 100 nm. For the nanofiber membrane located in the up region of the first layer, the filtration efficiency increases gradually with the increase in the EAR. According to Figure 17a, the increase rate in the pressure drop gradually speeds up for Filter A-U25-D75, Filter A-U50-D50 and Filter A-U75-D25 at the initial stage, indicating that the area for liquid film on the front side becomes larger, which contributes to more droplets can be captured. At the same time, the saturated liquid film that formed in the non-electrospinning area on the rear side of the filter medium is limited, leading to a reduction in the liquid re-entrainment. For the nanofiber membrane located at the down region of the first layer, the greater EAR results in the smaller non-electrospinning area, where a larger filtration velocity is shown for air flows through the saturated liquid film, resulting in more liquid re-entrainment. Therefore, the filtration efficiency gradually decreases with an increase in the EAR.

Figure 18.
Filtration efficiency and quality factor of dual-layer (a) Filter A and (b) Filter B with different combinations.
In terms of quality factor, the quality factor of different combinations of Filter A is almost maintained at 0.28, which only slightly decreases for Filter A-U75-D25 due to the great high steady-state pressure drop. For different combinations of Filter B, there is no obvious difference in steady-state pressure drop. The trend of quality factor is the same as that of filtration efficiency. Filter B-U75-D25 has the highest quality factor, which is 11% higher than Filter B-0-0.
4. Conclusions
In this paper, oleophilic and oleophobic glass fiber filters were treated by electrospinning, and composite nanofiber composite filters were prepared. The filtration performance and liquid distribution in the filters with different electrospinning area ratio were analyzed. The filtration performances of dual-layer filters with different combinations were investigated. The results show that with the increase in electrospinning area ratio, the filtration efficiency of oleophilic filters can be improved, while it seems to have no effect on the filtration efficiency of oleophobic filters. At the initial stage of filtration, the electrospinning area for both the oleophilic and oleophobic filters could form liquid film, resulting that airflow resistance increases and the aerosols preferentially flows the substrate through the non-electrospinning area. At the jump stage, the saturation of the non-electrospinning area of the oleophilic filter no longer increases, while the liquid in the liquid film on the rear side continues to accumulate. As the flow resistance in the non-electrospinning area exceeds the electrospinning area, the aerosol turns to preferentially flow into the electrospinning area, in which a further increase in the saturation is shown. For oleophobic filters, due to the difference in wettability between the nanofiber membrane and the substrate, the direction of liquid transportation is opposite to the capillary force, resulting in greater resistance for liquid flowing into the following substrate in the electrospinning area. The amount of liquid in the electrospinning area increases slowly during the experiment.
For the dual-layer combinations with oleophilic filter media, the nanofiber membrane coated at the down region of the first layer does not change the liquid transportation and distribution in the filter. While as the nanofiber membrane is coated in the up region, the steady pressure drop increases with the increase in the electrospinning area ratio. For the dual-layer combination with oleophobic filter media, the steady-state pressure drop is close to each other for all structures. In terms of filtration efficiency, the trends of oleophilic and oleophobic filters are the same. For the combinations with the nanofiber membrane coated in the up region of the first layer, the filtration efficiency increases gradually with the increase in the electrospinning area ratio. The best filtration performance was found for Filter B-U75-D25.
Author Contributions
Conceptualization, Y.C.; methodology, R.S.; validation, K.J. and K.C.; formal analysis, R.S. and K.J.; investigation, Y.C. and J.Z.; writing—original draft preparation, Y.C. and J.Z.; funding acquisition, F.C.; writing—review and editing, F.C.; visualization, K.C. All authors have read and agreed to the published version of the manuscript.
Funding
This research was funded by the research project of Gas Storage Co., Ltd., PetroChina Xinjiang Oilfield Company (HTBCQK-2024-044), Fundamental Research Funds for the Central Universities (2462024QNXZ002).
Data Availability Statement
The raw data supporting the conclusions of this article will be made available by the authors on request.
Conflicts of Interest
Authors Yuee Chen, Rongjun Song and Kang Ji were employed by Gas Storage Co., Ltd., PetroChina Xinjiang Oilfield Company. The remaining authors declare that the research was conducted in the absence of any commercial or financial relationships that could be construed as a potential conflict of interest. The companies had no role in the design of the study, in the collection, analyses, or interpretation of data, in the writing of the manuscript, or in the decision to publish the results.
References
- Hossam, A.K.; Hossam, A.G. Review of pipeline integrity management practices. Int. J. Press. Vessel. Pip. 2010, 87, 373–380. [Google Scholar] [CrossRef]
- Melissa, W.; Wei, H. Technology review of modern gas turbine inlet filtration systems. Int. J. Rotating Mach 2012, 2012, 128134. [Google Scholar]
- Dai, L.S.; Wang, D.P.; Wang, T.; Feng, Q.S.; Yang, X.Q. Analysis and comparison of long-distance pipeline failures. J. Pet. Eng. 2017, 2017, 3174636. [Google Scholar] [CrossRef]
- Ratna, B.; Christina, W.K.; Takashi, O.; Leon, G.; Li, B.; Kazuya, S.; Kikuo, O. Synthesis and evaluation of straight and bead-free nanofibers for improved aerosol filtration. Chem. Eng. Sci. 2015, 137, 947–954. [Google Scholar] [CrossRef]
- Shen, L.D.; Yu, X.F.; Chen, C.; Song, C.L.; Wang, X.F.; Zhu, M.F.; Benjamin, S.H. High filtration performance thin nanofibrous composite membrane prepared by electrospraying technique and hot-pressing treatment. J. Membr. Sci. 2016, 499, 470–479. [Google Scholar] [CrossRef]
- Ki, M.Y.; Christopher, J.H.J.; Yasuko, M.; Masaaki, K.; Ferry, I.; Kikuo, O. Nanoparticle filtration by electrospun polymer fibers. Chem. Eng. Sci. 2007, 62, 4751–4759. [Google Scholar] [CrossRef]
- Jonas, M.; Linas, K.; Tadas, P.; Dalia, B.; Dainius, M. The comparative study of aerosol filtration by electrospun polyamide, polyvinyl acetate, polyacrylonitrile and cellulose acetate nanofiber media. J. Aerosol Sci. 2015, 441, 121–129. [Google Scholar]
- Wang, Z.; Zhao, C.C.; Pan, Z.J. Porous bead-on-string poly (lactic acid) fibrous membranes for air filtration. J. Colloid Interface Sci. 2015, 441, 121–129. [Google Scholar] [CrossRef] [PubMed]
- Zhang, S.C.; Tang, N.; Cao, L.T.; Yin, X.; Yu, J.Y.; Ding, B. Highly integrated polysulfone/polyacrylonitrile/polyamide-6 air filter for multilevel physical sieving airborne particles. ACS Appl. Mater. Interfaces 2016, 8, 29062–29072. [Google Scholar] [CrossRef] [PubMed]
- Bian, Y.; Zhang, L.; Chen, C. Experimental and modeling study of pressure drop across electrospun nanofiber air filters. Build. Environ. 2018, 142, 244–251. [Google Scholar] [CrossRef]
- Hajra, M.G.; Mehta, K.; Chase, G.G. Effects of humidity, temperature, and nanofibers on drop coalescence in glass fiber media. Sep. Purif. Technol. 2003, 30, 79–88. [Google Scholar] [CrossRef]
- Albert, P.; Anna, B.; Leon, G. Application of nanofibers to improve the filtration efficiency of the most penetrating aerosol particles in fibrous filters. Chem. Eng. Sci. 2006, 61, 6804–6815. [Google Scholar] [CrossRef]
- Shagufta, U.P.; Prashant, S.K.; Sarfaraz, U.P.; George, G.C. Glass fiber coalescing filter media augmented with polymeric submicron fibers and modified with angled drainage channels. Sep. Purif. Technol. 2013, 120, 230–238. [Google Scholar] [CrossRef]
- Zhu, X.; Feng, S.S.; Zhao, S.F.; Zhang, F.; Xu, C.; Hu, M.; Zhong, Z.X.; Xing, W.H. Perfluorinated superhydrophobic and oleophobic SiO2@PTFE nanofiber membrane with hierarchical nanostructures for oily fume purification. J. Membr. Sci. 2020, 594, 117473. [Google Scholar] [CrossRef]
- Zheng, G.F.; Shao, Z.G.; Chen, J.Y.; Jiang, J.X.; Zhu, P.; Wang, X.; Li, W.W.; Liu, Y.F. Self-supporting three-dimensional electrospun nanofibrous membrane for highly efficient air filtration. Nanomaterials 2021, 11, 2567. [Google Scholar] [CrossRef] [PubMed]
- Phillip, W.G.; Heidi, S. Patterned electrospray fiber structures. Int. Nonwovens J. 2004, 13, 34–40. [Google Scholar]
- Liu, Y.F.; Shao, H.; Wang, H.X.; Ji, Z.L.; Bai, R.X.; Chen, F.; Li, B.; Chang, C.; Lin, T. Improvement of air filtration performance using nanofibrous membranes with a periodic variation in packing density. Adv. Mater. Interfaces 2021, 9, 2101848. [Google Scholar] [CrossRef]
- Davies, C.N. Air Filtration; Academic Press, Inc.: London, UK, 1973. [Google Scholar]
- Kampa, D.; Wuster, S.; Buzengeiger, J.; Meyer, G.; Kasper, J. Pressure drop and liquid transport through coalescence filter media used for oil mist filtration. Int. J. Multiph. Flow 2014, 58, 314–324. [Google Scholar] [CrossRef]
- Kampa, D.; Wurster, S.; Mayer, J.; Kasper, G. Validation of a new phenomenological “jump-and-channel” model for the wet pressure drop of oil mist filters. Chem. Eng. Sci. 2015, 122, 150–160. [Google Scholar] [CrossRef]
Disclaimer/Publisher’s Note: The statements, opinions and data contained in all publications are solely those of the individual author(s) and contributor(s) and not of MDPI and/or the editor(s). MDPI and/or the editor(s) disclaim responsibility for any injury to people or property resulting from any ideas, methods, instructions or products referred to in the content. |
© 2025 by the authors. Licensee MDPI, Basel, Switzerland. This article is an open access article distributed under the terms and conditions of the Creative Commons Attribution (CC BY) license (https://creativecommons.org/licenses/by/4.0/).