Abstract
Pitaya peels are an underutilized by-product rich in antioxidant phenolics and betalains but highly unstable under environmental and gastrointestinal conditions. This study aimed to produce bioactive-rich particles with improved bioaccessibility by applying ultrasound-assisted extraction (UAE) followed by freeze-drying encapsulation with maltodextrin (MD) and gum Arabic (GA) at different ratios (MD:GA 100:0, 75:25, 50:50, 25:75, 0:100, w/w). A rotatable central composite design (pH 4–8, time 10–50 min) was applied to optimize UAE conditions. Optimum conditions (pH 6.2, 35 min) yielded a pitaya peel extract with TPC 166.85 mg GAE·100 g−1 DW. Although the betalain model was not significant, contents ranged from 30.20 to 51.99 mg·100 g−1 DW across treatments. Particles produced with GA only (G100) had the highest phenolic (316.33 mg GAE∙100 g−1 DW) and betalain (17.58 mg·100 g−1 DW) contents, high solubility (~80%), low hygroscopicity (~11 g H2O·100 g−1 DW), and amorphous morphology. G100 showed enhanced in vitro bioaccessibility of betalains and phenolics compared to the non-encapsulated extract (p < 0.05). Betalain bioaccessibility decreased in the intestinal phase (~55%), consistent with pH-driven degradation, while phenolic bioaccessibility was higher (~140%). Overall, gum Arabic proved to be an effective carrier for stabilizing pitaya peel bioactives, supporting their valorization into functional food and nutraceutical ingredients.
1. Introduction
Pitaya fruits (Hylocereus spp.), native to the tropical regions of Mexico, Central, and South America, are currently cultivated in tropical and subtropical areas worldwide due to their adaptability and commercial value [,]. Beyond its sensory appeal, pitaya is a rich source of bioactive phytochemicals, including betalains, phenolics, and terpenoids, which are associated with antioxidant, anti-inflammatory, and antimicrobial effects [,]. From a market perspective, pitaya has shifted from a niche crop to a global commodity, with recent estimates indicating ~2 million tons (Mt) of worldwide production in 2024–2025 [,].
Currently, only pitaya pulp is used for food processing []. Approximately 26–35% of the fruit’s mass is in the peel, depending on the cultivar and pulp color []. Based on current production volumes, this accounts for ~0.5–0.7 Mt of pitaya peel generated annually worldwide. Pitaya peels are betalain-rich sources (>50 mg/g DW), containing levels far exceeding those of more known sources such as beetroot peels (≈1 mg/g DW), establishing them as sustainable and abundant alternatives for pigment recovery []. Despite this, pitaya peels are still mostly treated as low-value residues [,]. Their common destinations include landfilling, composting, and animal feed, while smaller volumes are exploited for their pigments, pectin, mucilage, functional ingredients, and experimental bioproducts such as adsorbents and bioplastics []. Although animal feed and composting provide some benefits (nutrient cycling; substitution of conventional inputs), landfilling poses clear environmental drawbacks due to methane and greenhouse gas emissions. Recent life cycle assessments indicate the production of ~54 kg of CH4 per ton of discarded food even under gas capture systems, equivalent to ~1.5 t CO2-eq over 100 years. This underscores that valorization pathways offer a far more favorable environmental balance than disposal [,].
The practical use of pitaya-derived bioactives; however, is limited by their instability against temperature, pH, light, and enzymes, which accelerate pigment fading and the loss of antioxidant capacity [,]. Encapsulation techniques have been employed to enhance stability, bioavailability, and controlled release of sensitive compounds in food and pharmaceutical systems. The process is often carried out with carriers to increase efficiency and reduce costs, and their correct choice is crucial for the efficiency and functionality of the final product []. Maltodextrin and gum Arabic are popular choices: maltodextrin is soluble, inexpensive, and neutral in flavor, while gum Arabic offers excellent emulsifying and film-forming properties, effectively retaining volatile compounds and creating stable protective barriers [].
Ultrasound-assisted extraction (UAE) is a green processing technology that enhances mass transfer through acoustic cavitation, the formation and collapse of microbubbles that generate hot spots, shear forces, and microjets capable of disrupting cell walls and accelerating solute diffusion [,]. Compared to conventional solvent extraction, UAE generally achieves higher yields in shorter times, operates at lower temperatures (preserving thermolabile pigments such as betalains), and requires less solvent and energy []. UAE has been successfully applied to extract natural pigments, polyphenols, pectin, and other phytochemicals from fruit by-products, including pitaya peels [,,].
The main variables governing UAE include ultrasonic amplitude/power, frequency, solvent type and composition, solid-to-liquid ratio, temperature, time, duty cycle, and specific energy input (SEI). Recent studies on pitaya peel show that UAE can significantly enhance the extraction of betalains and phenolics, often reducing extraction time by ~50–75% compared to conventional methods, while also enabling greener solvent systems and direct integration with microencapsulation processes [].
Therefore, this study addresses a knowledge gap by coupling optimized UAE with freeze-drying encapsulation to transform pitaya peel into functional, bioactive-rich particulate ingredients. In this work, the UAE applied to pitaya peels was first optimized using a rotatable central composite design (RCCD). The optimized extract was used to produce freeze-dried particles that were characterized for their physicochemical, bioactivity, and bioaccessibility attributes. By quantifying extraction performance and product functionality, this work supports the valorization of the ~0.5–0.7 Mt of pitaya peel generated annually worldwide, shifting waste management away from landfilling and toward the production of high-value ingredients capable of stabilizing and adding commercial value to pitaya phytochemicals for food, nutraceutical, and other innovative applications.
2. Materials and Methods
2.1. Materials
Pitaya fruits (Hylocereus polyrhizus, consisting of fruits with red peel and red pulp) were sourced locally in Fortaleza, CE, Brazil, at degree 5 of ripeness. The fruits were washed and sanitized with a sodium hypochlorite solution (200 ppm). Peels were manually separated from the pulp with a stainless-steel knife, cut into smaller pieces (≈1 × 1 cm), and stored at −10 °C until further use. All reagents employed in this study were of analytical grade. Maltodextrin (DE 20) and gum Arabic (CAS 9000-01-5; 104228) were supplied by Quimica Contemporanea Ltda (São Paulo, Brazil).
2.2. Pitaya Peel Extracts
Pitaya peels were freeze-dried using a pressure of 202 µHg and a temperature of −50 °C for 30 h (Terroni, model LS3000, São Paulo, Brazil), followed by milling in a knife mill and sieving through a 20-mesh stainless steel sieve prior to extraction. This protocol was used to increase and standardize the surface area of resulting pitaya peel powder that was used to prepare aqueous solutions (1:40 w/v) further submitted to UAE (Ultrasonic bath, Model Unique USC, 40 kHz, 150 W, 3 L tank volume; Unique, São Paulo, Brazil) and optimization experiments. Extractions were carried out in 250 mL glass beakers and the bath temperature was kept between 28 and 35 °C. After that, the material was centrifuged at 17,709× g (15 min, 4 °C). These parameters, defined in preliminary trials, were chosen to clarify the extract and minimize the loss of phenolic compounds and betalains during processing. All extractions were conducted in the dark to minimize pigment degradation. Treatments were processed at different pH levels and extraction times, as defined by a rotatable central composite design (RCCD, Table 1) to optimize the dependent responses total phenolic content (TPC) and betalain content. The pH was adjusted by acid/base using a digital pH meter previously calibrated with pH 4.0 and 7.0 buffer solutions. The obtained aqueous extracts were filtered using an 18 cm-diameter stainless steel sieve and stored at −18 °C in the dark.

Table 1.
RCCD matrix with real and codified values for UAE of bioactives from pitaya peel powder ©—Central points.
RCCD was developed with four central points and two independent variables, thereby resulting in 12 runs (2 factor points, 4 axial points and 4 central points; Table 1). The results were evaluated using response surfaces, Pareto charts and ANOVA validation by Statistic 10.0 software program (StatSoft, Tulsa, OK, USA). The regression coefficients were estimated according to Equation (1).
Z = β0 + β1X + β2Y + β11X2 + β22Y2 + β12XY + ε
In which Z represents the dependent variables (responses) Z1 = TPC, mg GAE. 100 g−1 and Z2 = betalains mg. 100 g−1, β0 is the overall average, β1 and β2 are the linear coefficients, β12 is the coefficient of interaction, β11 and β22 are the quadratic coefficients, and ε is the template error. The independent variables were X (pH) and Y (time).
2.3. Freeze-Dried Particles Produced from the Optimized Pitaya Peel Extract
Drying carriers maltodextrin (MD) and gum Arabic (GA) were added to the optimized pitaya peel extract. Carriers were added alone or blended to pitaya aqueous extract (PAE) (1.8 °Brix, corresponding to 1.8 g of soluble solids per 100 g of extract) according to Table 2 to yield five experimental groups. Carriers were added in a ratio 1:10 (PAE: carrier) to reach a final solids concentration of 20% (w/w). The mixtures were freeze-dried, resulting in powder yields ranging from ~11 to 13% (w/w, based on the initial mixture mass).
Table 2.
Experimental groups of freeze-dried particles produced from the optimized pitaya peel extract.
Solutions were thoroughly homogenized using a magnetic stirrer for 30 min until complete homogenization, followed by freezing at −18 °C and freeze-drying (Terroni, model LS3000) operating under a pressure of 202 µHg. The condenser temperature was maintained at −50 °C and the shelf temperature at −24 °C, with a programmed setpoint of +30 °C. The process was conducted with a primary drying time of 24 h and a secondary drying time of 12 h. The resulting freeze-dried particles were packed in metallic packaging under vacuum until further use.
2.4. Determination of Betalain Content
The betalain content in pitaya peel powder, PAE, freeze-dried PAE (FD-PAE) or freeze-dried particles was determined according to Lim et al. []. Briefly, 1 g of sample was added to 20 mL of distilled water and processed in an ultrasonic bath (Unique USC Model, 15 kHz, 150 W; Unique, São Paulo, Brazil) for 30 min. Next, the samples were centrifuged (at 17,709× g for 15 min at 4 °C) and the supernatants were collected to analyze the betalain content spectrophotometrically at 538 nm.
The betalain content was calculated according to Equation (2), in which A538 = absorbance at 538 nm, L (cuvette optical path length) = 1.0 cm, DF = dilution factor at the time of reading, V = extract volume (mL), and M = mass used for extraction (g). For betalains, ε (molar absorptivity coefficient) = 60,000 L/mol−1 cm in H2O, and MM (molecular mass) = 550 g/mol−1. Results were expressed as mg of betalains 100 g−1 of dry weight (DW).
2.5. Determination of Total Phenolic Content (TPC)
The TPC of the optimized PAE, freeze-dried PAE, and freeze-dried particles was determined using the Folin–Ciocalteu method, following Obanda et al. [] with modifications. Samples were solubilized in distilled water at final concentrations of 12.5 mg·mL−1 (freeze-dried PAE) and 50 mg·mL−1 (freeze-dried PAE). Aliquots of 150 µL of liquid PAE, 200 µL of freeze-dried PAE solution, and 100 µL of freeze-dried PAE solution (diluted 1:4, v/v) were adjusted with distilled water to a final reaction volume of 250 µL. Then, 250 µL of diluted Folin–Ciocalteu reagent (1:3, v/v), 500 µL of sodium carbonate solution (20%, w/v), and 500 µL of distilled water were added. The mixture was incubated in the dark at room temperature for 30 min, and absorbance was measured at 700 nm using a microplate reader (SynergyMx, Biotek, Miami, FL, USA). Results were calculated from a gallic acid calibration curve (0–50 µg·mL−1, R2 = 0.997) and expressed as mg gallic acid equivalents (GAE) per 100 g DW.
2.6. Antioxidant Activity (AA)
The AA of PAE and freeze-dried particles was determined by the Ferric Reducing Antioxidant Power (FRAP) method according to Pulido et al. [], with modifications. Encapsulated powders (0.5 g) were solubilized in 5 mL of distilled water. For the assay, 90 µL of sample solution was mixed with 2.7 mL of freshly prepared FRAP reagent, consisting of 25 mL of acetate buffer (0.3 M, pH 3.6), 2.5 mL of 2,4,6-tris(2-pyridyl)-s-triazine (TPTZ, 10 mM in 40 mM HCl), and 2.5 mL of FeCl3·6H2O (20 mM), followed by 270 µL of distilled water. The mixture was incubated in a water bath at 37 °C for 30 min in the dark, and absorbance was recorded at 595 nm using a microplate reader (SynergyMx, Biotek, USA). The FRAP solution was used as the blank. Results were calculated from a ferrous sulfate calibration curve (500–1500 µM, y = 0.0004x + 0.0097, R2 = 0.995) and expressed as µmol Fe2+ equivalents per gram of DW (µmol Fe2+ eq·g−1 DW).
2.7. Physicochemical Characterization of Freeze-Dried Pitaya Particles
Measurements of pH (AOAC 981.12) and percentage of malic acid (%) (AOAC 942.15) in PAE and freeze-dried particles were performed according to AOAC []. For pH determination in powder samples, approximately 0.5 g of sample was dissolved in 5 mL of distilled water, thoroughly mixed, and measured using a calibrated pH meter. Moisture (AOAC 934.01) was determined gravimetrically [] and water activity (Aw) was determined using Aqualab 3TE equipment (Decagon, Pullman, Washington, USA).
Hygroscopicity was determined according to Cai and Corke [], with minor modifications. Briefly, 1 g of sample was placed in a pre-weighed Petri dish and stored in a hermetically sealed glass container with a saturated NaCl solution (≈75% RH) at 25 °C. After 90 min of exposure, samples were weighed, and hygroscopicity was expressed as g of moisture adsorbed per 100 g of DM.
Solubility was evaluated based on the method described by Cano-Chauca et al. [], with some modifications. Sample (25 mg) was solubilized in 25 mL of distilled water at room temperature for 30 min, then centrifuged at 3000× g for 5 min. 25 mL-aliquots of the supernatant were transferred to a Petri dish and oven dried at 105 °C for 5 h. Solubility was calculated gravimetrically, and results were expressed in percentage (%).
Color parameters luminosity L* [0 (black) to 100 (white)], chromaticity a* [green (−) to red (+)] and b* [ blue (−) to yellow (+)], as well as color intensity, Chroma (C *), and hue angle (H) [0° (pure red color), 90° (pure yellow color), 180° (green color pure) and 270° (pure blue color)] were determined using a colorimeter (ColoQuest XE, HunterLab, Reston, VA, USA).
2.8. Microstructure of Freeze-Dried Pitaya Particles
The microstructure of freeze-dried pitaya particles was examined using scanning electron microscopy (SEM FEI®; Quanta 4550 FEG microscope, FEI Company, Hillsboro, OR, USA). Samples were mounted on double-sided carbon adhesive tape, placed on aluminum stubs, and sputter-coated with a thin layer of platinum (≈10 nm) for 60 s using a metallizer (Quorum Q1550T ES, QUORUM®, UK). Images were acquired at a working distance of 10–12 mm, dwell time of 30 µs, and an accelerating voltage of 20 kV. The relatively high accelerating voltage was used to improve image sharpness and surface contrast, as lower voltages (<10 kV) did not provide sufficient resolution for these highly porous biopolymeric particles.
2.9. In Vitro Simulated Digestion
The bioaccessibility of phenolics and betalains in G100 and FD-PAE was evaluated using the standardized in vitro digestion protocol proposed by INFOGEST [], with minor adaptations. Samples were subjected to three sequential digestion phases: oral, gastric, and intestinal. The composition and concentration of the fluids used is presented in Table S1. Briefly, for the oral phase (pH 7.0, final oral bolus ≈ 5.0 mL), samples (0.5 g of G100 and 0.12 g of freeze-dried PAE) were accurately weighed and mixed with 4 mL of simulated salivary fluid (SSF), 25 µL of CaCl2 (0.3 M), and 975 µL of distilled water. The mixture was incubated under agitation for 2 min. For the gastric phase (pH 3.0, gastric mixture ≈ 11.0 mL), the resulting oral bolus was combined with 5.6 mL of simulated gastric fluid (SGF) and 3.5 µL of CaCl2 (0.3 M). The pH was adjusted to 3.0 using HCl (6 M), and the acid volume added was recorded and adjusted with water to a final volume of 1 mL. Pepsin (2000 U. mL−1) solution (350 µL) was then added, and the samples were incubated for 2 h under continuous agitation. Finally, for the intestinal phase (pH 7.0, intestinal mixture ≈ 19.8 mL), 4.675 mL of simulated intestinal fluid (SIF) and 22 µL of CaCl2 (0.3 M) were added to the digested gastric contents. The pH was adjusted to 7.0 using NaOH (6 M), and the volume was corrected with distilled water to reach 2.20 mL. Pancreatin (100 U. mL−1) solution (2.75 mL) and bile solution (10 mM) (1.375 mL) were added, followed by incubation for an additional 2 h under agitation. All digestion steps were performed in a shaking water bath (Dubnoff, digital model Q226M, Quimis, São Paulo, Brazil). Aliquots (3 mL) were collected from each digestive phase for the quantification of TPC and betalains content, as described in previous sections. The assay was conducted in triplicate. Bioaccessibility was expressed as the percentage (Equation (3)) of phenolics or betalains released after intestinal digestion relative to their initial content in each sample, ensuring comparability between formulations.
2.10. Statistical Analysis
Model RCCD adequacy was evaluated through residual analysis, including normality, homoscedasticity, and lack of fit tests. The overall significance of the regression models and their terms (linear, quadratic, and interaction) was evaluated by analysis of variance (ANOVA) using the F-test, with significance established at p < 0.05. In addition to the coefficient of determination (R2), the adjusted R2 and the root mean square error (RMSE) were reported to provide a more robust model assessment. ANOVA F-test results were used to evaluate models significance, while the lack of fit test was applied to verify model adequacy. A non-significant lack-of-fit (p > 0.05) indicates that the model adequately represented the experimental data. The experimental runs were performed in randomized order to minimize systematic bias and improve the reliability of the results. The central points correspond to independent replicates, allowing the estimation of pure error.
Analyzes were performed in triplicate unless noted. Data were reported as values ± standard deviation and statistically analyzed using analysis of variance (ANOVA). Tukey’s test (p < 0.05) was used to assess differences between samples.
Principal Component Analysis (PCA) and hierarchical cluster were used to analyze results correlations. Data were mean-centered and auto scaled (unit variance scaling) prior to PCA to ensure that all variables contributed equally, regardless of scale. Hierarchical clustering was performed using Ward’s linkage method and Euclidean distance as a measure of dissimilarity.
Statistical tests were performed using the Statistica 10.0 program (StatSoft, Tulsa, OK, USA). OriginPro 2022b software (Northampton, MA, USA) was used to obtain average comparison charts.
3. Results and Discussion
3.1. RCCD Model
Recognized as a sustainable solvent for green separation processes, water combines favorable physicochemical properties, safety, affordability, and food-grade status [], making it a sensible choice for this study.
The experimental results for the RCCD model, as well as ANOVA results are shown in Table 3. Two independent regression models were built for TPC (Equation (4)) and betalain content (Equation (5)).
Z1 (mg GAE · 100 g−1) = 78.90 + 9.04X − 0.86X2 + 4.64Y − 0.08Y2 − 0.01XY
Z2 (mg · g−1) = 34.83 + 7.71X − 0.87X2 − 0.72Y + 0.002 Y2 + 0.09XY
Table 3.
RCCD and ANOVA results in aqueous extraction of phenolic compounds and betalains from pitaya peel powder.
The regression models were validated by ANOVA using the F-test and p-value. Both models showed significant (p < 0.05) lack of fit values. Nevertheless, the TPC model was significant at 95% confidence level, since the calculated F value was higher than the critical F value listed (p < 0.05) (Table 3). Although the regression model for betalains was not statistically significant (p = 0.703), indicating no relevant effect of the studied factors, the experimental results were maintained for comparative purposes.
The linear and quadratic effects were analyzed using the Pareto diagram (Figure 1A,B). Only pH was significant and positive for betalain extraction (Figure 1A). However, the model test was not significant for this variable; therefore, it was not possible to predict any behavior in relation to the variables, so the response surface was not generated.
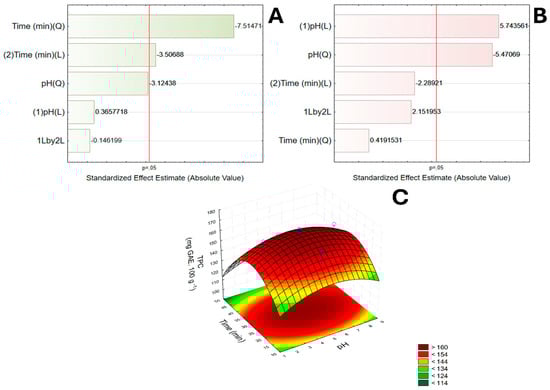
Figure 1.
Pareto diagrams for betalains (A) and TPC (B) extracted from pitaya peels by UAE. Variables exceeding the dotted line are statistically significant (p < 0.05). Response surface plot (C) showing the combined effects of extraction time (min) on TPC. TPC = total phenolic content.
Regarding TPC, results show that time (linear or quadratic) had a significant and negative effect on phenolic extraction (Figure 1B), indicating a curvilinear relationship. This means that TPC does not decrease monotonically with time but reaches a local maximum within the tested range. Thus, the response surface (Figure 1C) shows that the optimal region for TPC extraction is around 30–35 min. pH had no direct influence on TPC extraction at a 95% confidence level. The best extraction conditions generated by the model were obtained when UAE was conducted at pH 6.2 and 35 min, with a predicted TPC value of 166.85 mg GAE 100 g−1.
It should be noted that pH was not statistically significant for TPC alone (p > 0.05). Nevertheless, the global optimum predicted at pH 6.2 and 35 min reflects the multi-response desirability function, in which betalain content and antioxidant activity were jointly considered. Accordingly, this optimum should be interpreted as lying within a robust region of favorable conditions rather than as a single critical point. The response-surface plot (Figure 1C) illustrates the confidence region surrounding this operating window.
Figure 1C shows the response-surface plot for TPC, illustrating the combined effect of extraction time and pH and the local region of maximum predicted TPC (centered near 35 min and pH ≈ 6). The response surface highlights the curvature introduced by the quadratic time term and supports the selection of an intermediate extraction time as part of the multi-response optimization.
When Vieira et al. [] carried out the UAE of betalains and total phenolics from red pitaya (Hylocereus polyrhizus) pulp using hydroalcoholic extraction (30% ethanol), they reported optimized conditions using a ratio of 1:40 (juice: solvent) and extraction time of 20 min. Similarly to our study, the parameter extraction time was the only significant one among the variables for phenolic extraction.
3.2. TPC and Betalains Content of Optimized Pitaya Peel Extract (PAE) and Freeze-Dried Pitaya Particles
The TPC and betalains content of freeze-dried pitaya particles were significantly lower compared to optimized PAE (Table 4). Vieira et al. [] obtained higher results than those found here in hydroalcoholic extracts (UAE) of bioactive compounds from red pitaya pulp 860 mg GAE.100 g−1 and 108 mg.100 g−1 for TPC and betalains, respectively.
Table 4.
TPC, betalains, and antioxidant activity (AA) of optimized pitaya aqueous extract (PAE) and freeze-dried pitaya particles.
Among freeze-dried pitaya particles, M100 had the lowest TPC and betalain contents (155.52 mg GAE.100 g−1 DW and 5.57 mg.100 g−1 DW, respectively; p < 0.05) followed by M75G (210.6 mg GAE.100 g−1 of DW and 12.87 mg.100 g−1 DW, respectively). These results suggest an influence of the wall material on the preservation of pitaya polar bioactive compounds. GA, being more branched and film-forming, might enable a more efficient barrier that can better retain small polar compounds []. On the other hand, because the antioxidant activity is influenced by multiple compounds of different polarities, no clear trend was observed for the influence of the drying carrier used (Table 4) [].
When encapsulating Ruta chalepensis L. extract with GA, Gali et al. [] obtained particles stable under pH and temperature variations. The authors reported that encapsulation delivers a promising colloidal system for the delivery of plant bioactive-rich extracts, facilitating their incorporation into foods or pharmaceutical products. Šturm et al. [] observed that GA performed better as an encapsulation carrier for bioactive-rich propolis extract compared to MD, inulin or and their blends. They also stated that freeze-dried particles retained higher levels of phytochemicals compared to spray drying.
3.3. Characterization of Freeze-Dried Pitaya Particles
A significant difference between the optimized aqueous pitaya peel extract PAE and freeze-dried pitaya particles was observed regarding pH and malic acid content (Figure 2A,B). G100, M100 and PAE showed the lowest pH values (p < 0.05) among treatments. Also, freeze-dried particles had a substantially higher malic acid concentration compared to liquid PAE (p < 0.05). This is probably due to acid concentration caused by freeze-drying. When the malic acid content was evaluated, lower results (p < 0.05) were observed when MD only (not blended) was used as the wall material, with an upper tendency when GA was added in increasing ratios (Figure 2B). Similar trend was observed for TPC and betalain content, suggesting that GA enabled a denser, more protective barrier against the degradation of polar bioactive molecules [].
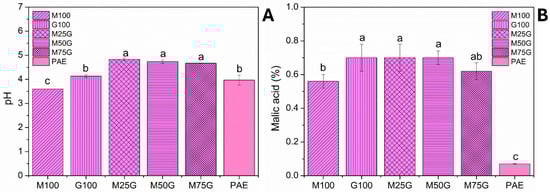
Figure 2.
pH (A) and malic acid quantification (B) of freeze-dried pitaya particles. Different letters in the same column indicate significant differences between samples (p < 0.05). Legend: PAE = optimized pitaya peel extract; M100 = freeze-dried particles obtained from PAE with MD only; G100 = freeze-dried particles obtained from PAE with GA only; M25G = freeze-dried particles obtained from PAE with 25% (w/w) MD and 75% (w/w) GA; M50G = freeze-dried particles obtained from PAE with 50% (w/w) MD and 50% (w/w) GA; M75G = freeze-dried particles obtained from PAE with 75% (w/w) MD and 25% (w/w) GA. Different letters indicate a significant difference among samples (p < 0.05).
Differently from M100 and G100, particles produced with carrier blends had a desirable moisture level lower than 5% (Table 5). The moisture content of a particular food influences storage, packaging, and processing. Rezende et al. [] found similar values for moisture and Aw with 3.12% to 7.05%, and 0.07 to 0.26, respectively, when producing freeze-dried acerola particles with MD and GA. Yamashita et al. [] studied the spray drying microencapsulation of anthocyanins with MD (20 DE) and showed an average moisture of 5% and higher Aw value (0.53) compared to our results.
Table 5.
Physicochemical parameters of freeze-dried pitaya particles.
Solubility is a key functional attribute that influences food processing and determines the potential uses of food products. The selection of drying carriers is very important, not only for the solubility itself, but also for its influence on the crystallinity of particles []. All freeze-dried particles showed similarly high solubility (p > 0.05), around 80% (Table 5), which can be attributed to the high solubility of the encapsulating carriers used in this study.
High hygroscopicity can promote hardening when food powders are exposed to moisture during storage and distribution []. Overall, all particles had desirably low results (below 1.6%), with M100 and G100 showing the lowest results among all experimental groups (p < 0.05; Table 5). Higher values were found by Alam et al. [], who obtained an average value of 20.29% for freeze-dried kinnow peel paste using combinations of MD and GA. Similarly, freeze-dried acerola particles produced with a combination of MD and GA [], higher hygroscopicity was reported (9.24%). This behavior was also seen by Saikia et al. [].
High water activity (Aw) favors biochemical and microbiological reactions, compromising product’s shelf life, and therefore, marketability. Freeze-dried pitaya particles showed very low Aw levels (Table 5), which warrant stability against microbial growth and hydrolytic and enzymatic reactions since Aw < 0.6 is considered microbiologically stable []. Overall, MD and GA blends had lower Aw compared to M100 and G100 (p < 0.05). Regarding the instrumental color, all freeze-dried pitaya particles showed similar CIELAB parameters (Table 5), with bright and intense pink tonalities resulting from the presence of natural phytochemicals extracted from pitaya peels.
3.4. Morphology
As shown in Figure 3, the morphology of freeze-dried pitaya particles observed by SEM resembled broken-glass structures with irregular and fractured surfaces, a feature commonly observed in freeze-dried powders [,,].
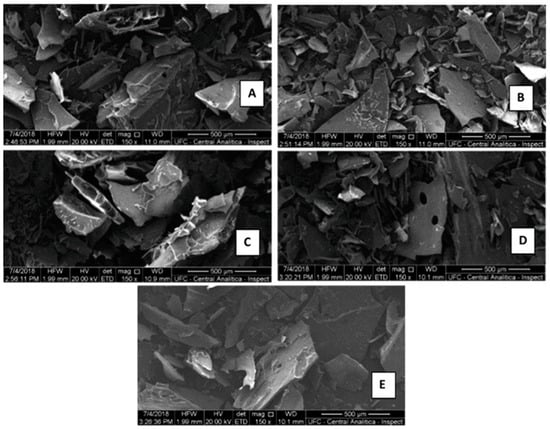
Figure 3.
Scanning electron micrographs of freeze-dried pitaya particles obtained with different carrier formulations. Images are shown with scale bars of 50 µm. Legend: (A) M100 = freeze-dried pitaya particles obtained from PAE with MD only; (B) G100 = freeze-dried pitaya particles obtained from PAE with GA only; (C) M25G = freeze-dried pitaya particles obtained from PAE with 25% (w/w) MD and 75% (w/w) GA; (D) M50G = freeze-dried pitaya particles obtained from PAE with 50% MD and 50% GA; (E) M75G = freeze-dried pitaya particles obtained from PAE with 75% MD and 25% GA.
Alves et al. [] demonstrated that carrier agents dictate morphological aspects of pitaya peel microparticles, corroborating the present study. Although particle size in this study was assessed qualitatively by SEM coupled with ImageJ (version 1.54f, National Institutes of Health, Bethesda, MD, USA) analysis, a clear trend was observed: formulations with higher MD content were larger and more stable, while lower concentrations resulted in smaller but more hygroscopic structures.
3.5. Multivariate Analysis
The correlation between freeze-dried pitaya particles obtained with varying GA and MD concentrations is shown in Figure 4A, whereas Figure 4B illustrates the correlations among all parameters evaluated in this study. Together, principal components (PC) 1 and 2 account for 85.19% (PC1 = 49.81%, PC2 = 35.36%) of the total variance.
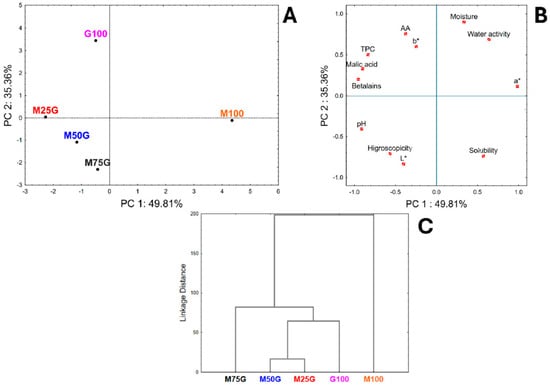
Figure 4.
Principal component analysis and cluster analysis representations of results for freeze-dried pitaya particles. (A) PC1 × PC2 scores coordinate system; (B) PC1 × PC2 loadings showing the correlations between physical, physicochemical and chemical parameters considered in this study for freeze-dried pitaya particles; (C) Cluster analysis. Legend: TPC = total phenolic content; AA = antioxidant activity; M100 = freeze-dried particles obtained from PAE with MD only; G100 = freeze-dried particles obtained from PAE with GA only; M25G = freeze-dried particles obtained from PAE with 25% (w/w) MD and 75% (w/w) GA; M50G = freeze-dried particles obtained from PAE with 50% (w/w) MD and 50% (w/w) GA; M75G = freeze-dried particles obtained from PAE with 75% (w/w) MD and 25% (w/w) GA.
A clear separation is observed for treatments using only one drying carrier (M100 and G100) and blends (Figure 4A). M100 and G100 (positive side of PC1) are mainly linked to higher moisture values, water activity, a* values, and solubility, while M50G, M75G, and M25G (grouped on the negative side of PC1) showed higher AA, TPC, malic acid, pH, betalains, hygroscopicity, and b* and L* color parameter values. In addition, there is a greater separation between M100 and G100 for PC2. M100 resulted in larger, higher solubility, a* and L* values, betalains, hygroscopicity, and pH, while G100 showed higher values for AA, TPC, acid malic, and the b* color values. Moreover, although M25G, M50G, and M75G are in different quadrants (positive and negative), they are spatially close to axes zero. Figure 4B shows a correlation with betalains and TPC (negative axis of PC1), which confirms that the antioxidant activity of the powders is related to these bioactive quantified herein, with TPC providing the highest antioxidant activity.
A similar pattern is observed in Figure 4C, where cluster analysis is applied to group samples according to the similarity of their principal component scores. The resulting dendrogram reveals that the Euclidean distance between M100 and G100 powders is the greatest, indicating pronounced differences across the evaluated parameters. In contrast, M50G and M75G cluster closely together and are also positioned near M25G, suggesting higher similarity among these samples.
3.6. Simulated In Vitro Digestion
Bioaccessibility values are reported as percentages relative to the initial phenolic and betalain contents of each sample, in accordance with the INFOGEST protocol and commonly adopted in the literature. FD-PAE has an initial content of 3714.00 ± 82.79 mg GAE∙100 g−1 DW of TPC and 391.70 ± 11.36 mg∙100 g−1 DW of betalains. When freeze-dried pitaya particles were compared, higher TPC and antioxidant activity (p < 0.05), as well as desirable betalain content was observed for G100 (Table 4). Therefore, experimental group G100 was prioritized for further investigation regarding its in vitro bioaccessibility based on simulated gastrointestinal digestion.
Results showed that when the non-encapsulated pitaya extract (freeze-dried PAE, no carrier) was subjected to simulated gastrointestinal conditions, only a small fraction of betalains and phenolic compounds from the extract remained available after in vitro digestion (Figure 5A,B). In contrast, after encapsulation with GA (G100), both the betalains and phenolics in vitro bioaccessibility was significantly enhanced. While betalains were released and digested more rapidly (Figure 5A), phenolic compounds exhibited a slower and more controlled release throughout the digestion phases (Figure 5B).
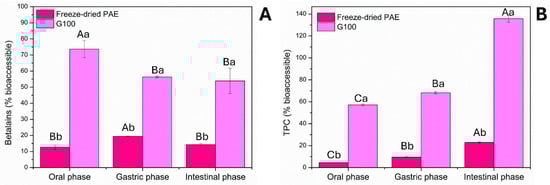
Figure 5.
Bioaccessibility of betalains (A) and phenolics (B) from freeze-dried PAE and freeze-dried pitaya particle G100. Different uppercase letters above the bars indicate significant differences (p < 0.05) between the phases of simulated in vitro digestion within the same sample. Different lowercase letters above the bars indicate significant differences (p < 0.05) between samples within the same digestion phase. Freeze-dried PAE = Freeze-dried optimized pitaya peel extract; G100 = freeze-dried particles obtained from PAE with GA only.
For betalains, the bioaccessibility of the free, non-encapsulated pitaya extract reached only ~20%. In contrast, the freeze-dried pitaya particles showed markedly higher values, with a rapid release in the oral phase (~75%), a notable reduction in the gastric phase (~55%), and subsequent stability thereafter (Figure 5A). The lower final bioaccessibility of betalains compared to TPC may be attributed to their structural instability under adverse pH conditions, particularly their low stability in alkaline environments.
The observed bioaccessibility patterns of betalains can be explained by their pH-sensitivity and interaction with the encapsulating matrix. Betalains, including both betacyanins (red violet) and betaxanthins (yellow orange), are highly susceptible to alkaline degradation []; however, bioaccessibility of betalains of G100 was similar for the intestinal (pH ~7) and gastric phases (pH ~3; p > 0.05). Our hypothesis is that encapsulation with GA preserves betalains by forming a protective matrix around the molecules []. This mechanism is two-fold: the GA matrix acts as a physical barrier, sequestering the pigments and partially shielding them from the hostile alkaline environment and enzymatic activity []. Subsequently, during the intestinal phase, bile salts and pancreatin disrupt this matrix, facilitating a more controlled and sustained release of the compounds rather than their immediate degradation []. The higher bioaccessibility of betalains in G100 compared to the free, non-encapsulated extract is confirmed by the significant difference observed in the intestinal phase.
For phenolics, a gradual increase in their release from the encapsulated extract was observed throughout the digestion phases (Figure 5B), starting at approximately 60% in the oral phase, increasing to 70% in the gastric phase, and reaching its peak (~140% higher than the encapsulated content before digestion) in the intestinal phase. This behavior can be attributed to the partial disintegration of the GA matrix under simulated physiological conditions, particularly in the intestinal environment, where pancreatin activity and the presence of bile salts favor capsule rupture. In contrast, the free extract exhibited a very low release of these compounds, around 20% at the end of digestion. Thus, the release of phenolics previously retained in the GA structure allows for greater solubilization and controlled availability of these compounds.
Previous studies reiterate the efficiency of GA as wall material for the delivery of bioactive compounds. Ma et al. [] reported that increasing GA content in lutein microcapsules provided a more controlled release during simulated digestion (2:1 GA: buttermilk ratio), which was attributed to the polysaccharide coating around the droplet/particles. Similarly, Peanparkdee et al. [] found that higher GA concentration enhanced intestinal release and antioxidant activity of encapsulated bromelain, increasing both stability and bioaccessibility.
Oliveira et al. [] investigated pitaya peels as a source of natural pigments and antioxidants but did not employ encapsulation technology. Their results showed oven-dried pitaya peel powders with considerable levels of betacyanins with preserved antioxidant activity even after simulated gastrointestinal digestion. However, betalain degradation was evident, with only 2.30% and 2.09% of the initial content remaining bioaccessible in the gastric and intestinal phases, respectively. In contrast, our study applied UAE followed by freeze-drying with GA and MD carriers, which not only produced bioactive-rich pitaya particles, but also markedly increased their bioaccessibility during digestion. While direct drying of the peel produces functional powders suitable for use as natural colorants, our results show that encapsulation strategies, particularly with GA (G100), provide additional protection of bioactives and broaden the potential for food and nutraceutical applications.
4. Conclusions
Ultrasound-assisted extraction of pitaya peel bioactives was optimized using RCCD, resulting in an extract with 736.00 mg GAE·100 g−1 DW of phenolics and 42.61 mg∙100g−1 of DW of betalains under the best conditions (pH 6.2, 35 min). Freeze-drying with gum Arabic only (G100) produced soluble (>75%) powders with higher phenolic and betalain contents and antioxidant activity.
Overall, this study not only optimized the extraction of bioactive compounds from pitaya peels but also provides, to our knowledge, the first evidence that the integration of ultrasound-assisted extraction and gum Arabic–based freeze-drying can synergistically improve the stability and bioaccessibility of betalains and phenolic compounds. The integration of physicochemical characterization, morphological analysis, and in vitro digestion assays provided a comprehensive understanding of how carrier selection influences compound preservation and release. By valorizing pitaya peels—an underutilized agro-industrial by-product—through a green and scalable process, this work offers a dual contribution: advancing encapsulation science and supporting circular economy practices in the food industry. The findings open new opportunities for developing functional, pigment-rich ingredients with controlled release properties, suitable for diverse applications in food, nutraceutical, and pharmaceutical formulations.
Supplementary Materials
The following supporting information can be downloaded at: https://www.mdpi.com/article/10.3390/pr13113628/s1, Table S1: Volumes of electrolyte stock solutions of digestion fluids for a volume of 500 mL diluted with distilled water.
Author Contributions
Conceptualization, L.M.F.S., J.D.G.C., R.T.H. and L.d.S.O.; Methodology, L.M.F.S., C.R.d.S.R., A.C.d.S.L. and A.R.N.L.; Software, N.L.d.S.F.; Formal analysis, L.M.F.S., C.R.d.S.R., L.M.S., A.C.d.S.L. and A.R.N.L.; Investigation, L.M.F.S., C.R.d.S.R., L.M.S. and N.L.d.S.F.; Resources, J.D.G.C.; Data curation, R.T.H.; Writing—original draft, L.M.F.S., M.R.d.S.P. and L.d.S.O.; Writing—review and editing, J.D.G.C., M.R.d.S.P., R.T.H. and L.d.S.O.; Supervision, L.d.S.O.; Project administration, L.d.S.O. All authors have read and agreed to the published version of the manuscript.
Funding
This research received no external funding.
Data Availability Statement
The original contributions presented in this study are included in the article/Supplementary Material. Further inquiries can be directed to the corresponding authors.
Acknowledgments
The authors gratefully acknowledge the Conselho Nacional de Desenvolvimento Científico e Tecnológico (CNPq) and the Central Analítica-UFC/CT-INFRA/MCTI-SISANO/Pró-Equipamentos CAPES for the support.
Conflicts of Interest
The authors declare no conflicts of interest.
Abbreviations
The following abbreviations are used in this manuscript:
| AA | Antioxidant Activity |
| DW | Dry weight |
| FD-PAE | Freeze-dried pitaya aqueous extract |
| FRAP | Ferric reducing antioxidant power |
| G100 | Powder formulated with 100% GA |
| GA | Gum arabic |
| GAE | Gallic acid equivalent |
| M100 | Powder formulated with 100% MD |
| M25G | Powder formulated with 25% MD and 75% GA |
| M50G | Powder formulated with 50% MD and 50% GA |
| M75G | Powder formulated with 75% MD and 25% GA |
| MD | Maltodextrin |
| PAE | Pitaya aqueous extract |
| RCCD | Rotatable Central Composite Design |
| SGF | Simulated gastric fluid |
| SIF | Simulated intestinal fluid |
| SSF | Simulated salivary fluid |
| TPC | Total phenolic content |
| UAE | Ultrasound-assisted extraction |
References
- Shah, K.; Chen, J.; Chen, J.; Qin, Y. Pitaya Nutrition, Biology, and Biotechnology: A Review. Int. J. Mol. Sci. 2023, 24, 13986. [Google Scholar] [CrossRef]
- Jiang, H.; Zhang, W.; Li, X.; Shu, C.; Jiang, W.; Cao, J. Nutrition, Phytochemical Profile, Bioactivities and Applications in Food Industry of Pitaya (Hylocereus Spp.) Peels: A Comprehensive Review. Trends Food Sci. Technol. 2021, 116, 199–217. [Google Scholar] [CrossRef]
- Joshi, M.; Prabhakar, B. Phytoconstituents and Pharmaco-therapeutic Benefits of Pitaya: A Wonder Fruit. J. Food Biochem. 2020, 44, e13260. [Google Scholar] [CrossRef]
- Song, H.; Chu, Q.; Xu, D.; Xu, Y.; Zheng, X. Purified Betacyanins from Hylocereus undatus Peel Ameliorate Obesity and Insulin Resistance in High-Fat-Diet-Fed Mice. J. Agric. Food Chem. 2016, 64, 236–244. [Google Scholar] [CrossRef]
- Chen, S.-Y.; Xu, C.-Y.; Mazhar, M.S.; Naiker, M. Nutritional Value and Therapeutic Benefits of Dragon Fruit: A Comprehensive Review with Implications for Establishing Australian Industry Standards. Molecules 2024, 29, 5676. [Google Scholar] [CrossRef]
- Barroso-Torres, N.; Lobo, M.G.; Dorta, E. Bibliometric Analysis of Papaya and Dragon Fruit By-Products. Foods 2025, 14, 2275. [Google Scholar] [CrossRef]
- Hay, T.O.; Nastasi, J.R.; Prakash, S.; Fitzgerald, M.A. Comparison of Gidyea Gum, Gum Arabic, and Maltodextrin in the Microencapsulation and Colour Stabilisation of Anthocyanin-Rich Powders Using Freeze-Drying and Spray-Drying Techniques. Food Hydrocoll. 2025, 163, 111023. [Google Scholar] [CrossRef]
- Pham, V.T.; Vu, N.D.; Nguyen, T.N.P.; Minh Truong, N.; Bui, Q.M.; Bui, T.T.T.; Phan, N.Q.T. Study of Using Ultrasonic Waves in the Producing Dried Dragon Fruit Peel Processes. Int. J. Food Sci. 2024, 2024, 8619783. [Google Scholar] [CrossRef]
- Martins, I.R.; Martins, L.H.D.S.; Chisté, R.C.; Picone, C.S.F.; Joele, M.R.S.P. Betalains from Vegetable Peels: Extraction Methods, Stability, and Applications as Natural Food Colorants. Food Res. Int. 2024, 195, 114956. [Google Scholar] [CrossRef] [PubMed]
- Khoo, H.E.; He, X.; Tang, Y.; Li, Z.; Li, C.; Zeng, Y.; Tang, J.; Sun, J. Betacyanins and Anthocyanins in Pulp and Peel of Red Pitaya (Hylocereus polyrhizus Cv. Jindu), Inhibition of Oxidative Stress, Lipid Reducing, and Cytotoxic Effects. Front. Nutr. 2022, 9, 894438. [Google Scholar] [CrossRef]
- Nitisuk, P.; Wanyo, P.; Chamsai, T.; Charoenjit, K. Sustainable Valorization of Tropical Fruit Peels for Sustainable Production of Natural Antioxidants and Functional Food Ingredients. Sustain. Food Technol. 2025, 3, 1189–1202. [Google Scholar] [CrossRef]
- Taharuddin, N.H.; Jumaidin, R.; Mansor, M.R.; Hazrati, K.Z.; Tarique, J.; Asyraf, M.R.M.; Razman, M.R. Unlocking the Potential of Lignocellulosic Biomass Dragon Fruit (Hylocereus polyrhizus) in Bioplastics, Biocomposites and Various Commercial Applications. Polymers 2023, 15, 2654. [Google Scholar] [CrossRef]
- Haider, M.W.; Abbas, S.M.; Saeed, M.A.; Farooq, U.; Waseem, M.; Adil, M.; Javed, M.R.; Haq, I.U.; Osei Tutu, C. Environmental and Nutritional Value of Fruit and Vegetable Peels as Animal Feed: A Comprehensive Review. Anim. Res. One Health 2025, 3, 149–164. [Google Scholar] [CrossRef]
- Pal, P.; Singh, A.K.; Srivastava, R.K.; Rathore, S.S.; Sahoo, U.K.; Subudhi, S.; Sarangi, P.K.; Prus, P. Circular Bioeconomy in Action: Transforming Food Wastes into Renewable Food Resources. Foods 2024, 13, 3007. [Google Scholar] [CrossRef]
- Nurhadi, B.; Qonit, M.A.H.; Mubarok, S.; Saputra, R.A. Enhancing Betacyanin Stability: Comparison of Dragon Fruit (Hylocereus Polyrhizus) Pulp and Peel Powders through Encapsulation Technology during Storage. Food Sci. Nutr. 2024, 12, 3251–3264. [Google Scholar] [CrossRef]
- Pudžiuvelytė, L.; Petrauskaitė, E.; Stabrauskienė, J.; Bernatonienė, J. Spray-Drying Microencapsulation of Natural Bioactives: Advances in Sustainable Wall Materials. Pharmaceuticals 2025, 18, 963. [Google Scholar] [CrossRef]
- Baltrusch, K.L.; Torres, M.D.; Domínguez, H. Optimizing Ultrasound-Assisted Extraction with Custom Design and Response Surface Methodology: A Case Study Using Ulva Spp. Ultrason. Sonochem. 2025, 120, 107443. [Google Scholar] [CrossRef]
- Loan, L.T.K.; Thao, L.T.N.; Vinh, B.T.; Mansamut, C.; Tai, N.V. Enhancing Antioxidant Extraction Efficiency from Red Dragon Fruit Peel by Green Approach Using Novel Optimization Technique. Curr. Res. Green Sustain. Chem. 2025, 11, 100474. [Google Scholar] [CrossRef]
- Lim, S.D.; Yusof, Y.A.; Chin, N.L.; Talib, R.A. Effect of Extraction Parameters on the Yield of Betacyanins from Pitaya Fruit (Hylocereus polyrhyzus) Pulps. J. Food Agric. Environ. 2011, 9, 158–162. [Google Scholar]
- Obanda, M.; Owuor, P.O.; Taylor, S.J. Flavanol Composition and Caffeine Content of Green Leaf as Quality Potential Indicators of Kenyan Black Teas. J. Sci. Food Agric. 1997, 74, 209–215. [Google Scholar] [CrossRef]
- Pulido, R.; Bravo, L.; Saura-Calixto, F. Antioxidant Activity of Dietary Polyphenols As Determined by a Modified Ferric Reducing/Antioxidant Power Assay. J. Agric. Food Chem. 2000, 48, 3396–3402. [Google Scholar] [CrossRef]
- Cai, Y.Z.; Corke, H. Production and Properties of Spray-dried Amaranthus Betacyanin Pigments. J. Food Sci. 2000, 65, 1248–1252. [Google Scholar] [CrossRef]
- Cano-Chauca, M.; Stringheta, P.C.; Ramos, A.M.; Cal-Vidal, J. Effect of the Carriers on the Microstructure of Mango Powder Obtained by Spray Drying and Its Functional Characterization. Innov. Food Sci. Emerg. Technol. 2005, 6, 420–428. [Google Scholar] [CrossRef]
- Brodkorb, A.; Egger, L.; Alminger, M.; Alvito, P.; Assunção, R.; Ballance, S.; Bohn, T.; Bourlieu-Lacanal, C.; Boutrou, R.; Carrière, F.; et al. INFOGEST Static in Vitro Simulation of Gastrointestinal Food Digestion. Nat. Protoc. 2019, 14, 991–1014. [Google Scholar] [CrossRef] [PubMed]
- Rodrigues Vieira, T.R.; Lima, A.B.; Ribeiro, C.M.C.M.; De Medeiros, P.V.Q.; Converti, A.; Dos Santos Lima, M.; Maciel, M.I.S. Red Pitaya (Hylocereus polyrhizus) as a Source of Betalains and Phenolic Compounds: Ultrasound Extraction, Microencapsulation, and Evaluation of Stability. LWT 2024, 196, 115755. [Google Scholar] [CrossRef]
- Gali, L.; Bedjou, F.; Ferrari, G.; Donsì, F. Formulation and Characterization of Zein/Gum Arabic Nanoparticles for the Encapsulation of a Rutin-Rich Extract from Ruta chalepensis L. Food Chem. 2022, 367, 129982. [Google Scholar] [CrossRef]
- Šturm, L.; Osojnik Črnivec, I.G.; Istenič, K.; Ota, A.; Megušar, P.; Slukan, A.; Humar, M.; Levic, S.; Nedović, V.; Kopinč, R.; et al. Encapsulation of Non-Dewaxed Propolis by Freeze-Drying and Spray-Drying Using Gum Arabic, Maltodextrin and Inulin as Coating Materials. Food Bioprod. Process. 2019, 116, 196–211. [Google Scholar] [CrossRef]
- Rezende, Y.R.R.S.; Nogueira, J.P.; Narain, N. Microencapsulation of Extracts of Bioactive Compounds Obtained from Acerola (Malpighia emarginata DC) Pulp and Residue by Spray and Freeze Drying: Chemical, Morphological and Chemometric Characterization. Food Chem. 2018, 254, 281–291. [Google Scholar] [CrossRef]
- Yamashita, C.; Chung, M.M.S.; Dos Santos, C.; Mayer, C.R.M.; Moraes, I.C.F.; Branco, I.G. Microencapsulation of an Anthocyanin-Rich Blackberry (Rubus Spp.) by-Product Extract by Freeze-Drying. LWT 2017, 84, 256–262. [Google Scholar] [CrossRef]
- Cortés-Rojas, D.F.; Souza, C.R.F.; Oliveira, W.P. Optimization of Spray Drying Conditions for Production of Bidens pilosa L. Dried Extract. Chem. Eng. Res. Des. 2015, 93, 366–376. [Google Scholar] [CrossRef]
- Syamaladevi, R.M.; Insan, S.K.; Dhawan, S.; Andrews, P.; Sablani, S.S. Physicochemical Properties of Encapsulated Red Raspberry (Rubus idaeus) Powder: Influence of High-Pressure Homogenization. Dry. Technol. 2012, 30, 484–493. [Google Scholar] [CrossRef]
- Alam, M.; Sid, S.; Giri, S.; Das, R.; Kishore, A.; Kumar, N. Encapsulated Kinnow Peel Powder Using Freeze Drying: Effect of Maltodextrin and Gum Arabic Concentrations on Physiochemical, Functional and Thermal Properties. Food Humanity 2025, 4, 100546. [Google Scholar] [CrossRef]
- Saikia, S.; Mahnot, N.K.; Mahanta, C.L. Optimisation of Phenolic Extraction from Averrhoa Carambola Pomace by Response Surface Methodology and Its Microencapsulation by Spray and Freeze Drying. Food Chem. 2015, 171, 144–152. [Google Scholar] [CrossRef]
- Che Man, Y.; Irwandi, J.; Abdullah, W. Effect of Different Types of Maltodextrin and Drying Methods on Physico-Chemical and Sensory Properties of Encapsulated Durian Flavour. J. Sci. Food Agric. 1999, 79, 1075–1080. [Google Scholar] [CrossRef]
- Tonon, R.V.; Brabet, C.; Pallet, D.; Brat, P.; Hubinger, M.D. Physicochemical and Morphological Characterisation of Açai (Euterpe oleraceae Mart.) Powder Produced with Different Carrier Agents. Int. J. Food Sci. Technol. 2009, 44, 1950–1958. [Google Scholar] [CrossRef]
- Lorenzoni Nunes, G.; Marques Da Silva, T.; Tasch Holkem, A.; Da Cunha Schley, V.; Ragagnin De Menezes, C. Microencapsulação de culturas probióticas: Princípios do método de spray drying. Ciênc. E Nat. 2015, 37, 132. [Google Scholar] [CrossRef]
- De Carvalho Alves, J.N.; Oliveira, N.L.; De Oliveira Meira, A.C.F.; Pio, L.A.S.; De Resende, J.V. Valorization of the Peel of Pitaya’s Fruit (Hylocereus polyrhizus) Producing Betalain-Rich Freeze-Dried Microparticles. Waste Biomass Valorization 2024, 15, 1097–1111. [Google Scholar] [CrossRef]
- Widianto, R. Encapsulation of Betacyanin Extract from Red Dragon Fruit Peel with Maltodextrin and Inulin: Storage Stability and Simulated Gastrointestinal Digestion. Food Biosci. 2024, 61, 104566. [Google Scholar] [CrossRef]
- Peanparkdee, M.; Janchai, P.; Aksornsri, T.; Vaithanomsat, P. Design and Evaluation of Bromelain-Encapsulated Alginate Beads Reinforced with Gum Arabic: Formulation, Characterization, and Stability in Simulated Gastrointestinal Conditions. J. Agric. Food Res. 2025, 19, 101698. [Google Scholar] [CrossRef]
- De Oliveira, G.; De Lima Costa, I.H.; Dos Santos Lima, M.; Macedo Dantas, A.; Guerra Dias, A.R.; Da Silva Campelo Borges, G. Pitaya (Hylocereus polyrhizus) Peel Powder: A Source of Pigments, Phenolic and Antioxidants Activity for Use in Food Hydrocolloids. Food Biosci. 2025, 68, 106512. [Google Scholar] [CrossRef]
Disclaimer/Publisher’s Note: The statements, opinions and data contained in all publications are solely those of the individual author(s) and contributor(s) and not of MDPI and/or the editor(s). MDPI and/or the editor(s) disclaim responsibility for any injury to people or property resulting from any ideas, methods, instructions or products referred to in the content. |
© 2025 by the authors. Licensee MDPI, Basel, Switzerland. This article is an open access article distributed under the terms and conditions of the Creative Commons Attribution (CC BY) license (https://creativecommons.org/licenses/by/4.0/).