Abstract
In this study, syntactic composite foams were developed by incorporating cenosphere (CS) particles recovered from recycled fly ash into a one-component polyurethane (PU) foam system. During production, CS was added to the spray-applied PU foam at specific ratios, and the foaming reaction was simultaneously initiated via manual mixing. This approach minimized particle settling caused by the filler–matrix density difference and promoted a more homogeneous structure. Two types of CS, with mean sizes of approximately 70 µm and 130 µm, were incorporated at five loadings ranging from 5 wt% to 15 wt%. The resulting composites were evaluated for their acoustic, mechanical, and thermal performance. Thermal analyses revealed that CS addition increased the glass-transition temperature (Tg) by ≈12 °C and delayed the 5% mass-loss temperature (T5%) by ≈30–35 °C compared with the neat N2 foam, confirming the stabilizing role of cenospheres. The refoaming process with manual mixing promoted finer cell diameters and thicker walls, enhancing the sound absorption coefficient (α), particularly at medium and high frequencies. Moreover, increasing the filler content improved both the sound transmission loss (STL) and compressive strength, alongside density, although further gains in α and STL were limited beyond a 10 wt% filler content. Significant enhancements in compressive strength were achieved at filler ratios above 12.5 wt%. Unlike conventional two-component PU foams, this study demonstrates a sustainable one-component PU system reinforced with recycled cenospheres that simultaneously achieves acoustic, mechanical, and thermal multifunctionality. To the best of our knowledge, this is the first report on incorporating recycled cenospheres into a one-component PU foam system, overcoming dispersion challenges of conventional two-component formulations and presenting an environmentally responsible route for developing versatile insulation materials.
1. Introduction
One of the fundamental approaches to mitigating noise pollution is to enhance sound absorption efficiency [1]. To this end, the mechanical strength, surface area, and structural morphology of materials are optimized. Sound-absorbing materials dissipate acoustic energy into heat through the continuous interaction of sound waves with porous cell walls via viscous friction and thermal conduction in open-cell structures [2,3,4,5,6,7,8]. In this context, open-cell polyurethane (PU) foams provide effective sound absorption in the mid-to-high frequency range. They also offer additional advantages such as vibration damping, ease of application to diverse surfaces, chemical resistance, long service life, and cost-effective production [9,10,11,12,13,14]. Nevertheless, most of these systems are based on conventional two-component PU formulations, whereas one-component foams have received limited attention despite their practical advantages in application and curing.
Furthermore, open-cell PU foams limit sound propagation and attenuate waves through the voids, channels, and folds within their structure [9,13]. However, these foams also present certain limitations, such as low thermal resistance, limited compressive strength, and insufficient corrosion resistance [15,16,17]. To overcome these shortcomings, recent research has focused on developing multifunctional foam systems with combined mechanical, acoustic, and thermal capabilities [18,19,20]. For example, Zhang et al. [21] reported the thermal and structural optimization of polyurethane foams reinforced with lightweight ceramic microspheres, achieving simultaneous improvements in stiffness and thermal reliability. The low mechanical strength and poor impact energy absorption of open-cell PU foams necessitate simultaneous improvements in acoustic and mechanical performance. Consequently, there is increasing interest in multifunctional syntactic foams reinforced with low-density hollow particles [22,23,24,25].
Syntactic foams are produced by incorporating low-density hollow particles into a polymer matrix [26,27,28,29]. Such fillers not only reduce the foam density but also improve compressive strength and acoustic absorption due to their closed-cell morphology and high specific strength [25,30,31]. Among these fillers, cenospheres recovered from flue gas filters in thermal power plants stand out as a sustainable material due to their low specific gravity, high melting point, and inert ceramic shell structure [32,33,34]. However, most existing studies are primarily limited to mechanical characterization [35,36]. Although cenospheres have been incorporated into various polymer matrices, their integration into one-component PU foams has scarcely been investigated. The effect of cenosphere addition on acoustic parameters such as α and STL has not been sufficiently investigated across a broad range of polymer matrix systems [22,26]. While some studies have explored this area [37,38], comprehensive investigations remain limited. For example, Yi et al. [37] developed cenosphere-filled polyester plates rather than foams; however, their results similarly demonstrated improved mid-frequency absorption with increasing filler content, which aligns with the present observations. Similarly, Moulya et al. [38] evaluated acoustic performance by incorporating 5–12 wt% cenospheres into a polyester resin matrix, reporting that α increased with filler content—particularly within the 1000–4000 Hz range—and that the highest sound insulation was achieved at 12 wt%. Despite these efforts, comprehensive studies evaluating the mechanical, acoustic, and thermal properties of cenosphere-filled foams in an integrated manner remain limited.
Several other investigations have also reported on cenosphere-reinforced foams, but their focus has been confined to selected functional properties. Zhang et al. prepared PU syntactic foams by infiltration and showed that compressive behavior was strongly affected by density and particle size [39]. Fan et al. studied dynamic compression of PU-cenosphere foams, with and without reinforcement, and emphasized strain-rate effects and failure mechanisms [40]. Functionally graded syntactic foams have also been introduced using layered cenospheres, which revealed anisotropic compression behavior [41]. Kumar et al. developed carbon–cenosphere foams with improved EMI shielding and thermal insulation [42]. None of these works, however, examined refoaming or double foaming strategies in single-component PU systems, nor did they integrate acoustic, mechanical, and thermal evaluations within a single framework. In contrast, the present study introduces a one-component PU foam system reinforced with recycled cenospheres, which simultaneously addresses acoustic, mechanical, and thermal properties within a unified methodology. The present study addresses these gaps by applying a refoaming approach to create sustainable PU–CS foams with multifunctional performance.
In syntactic foam production, the compatibility between matrix viscosity and filler properties is of critical importance. In two-component PU systems, the density mismatch between matrix and filler can cause phase separation before foaming, preventing uniform filler dispersion and leading to irregular cell morphology [1]. Conversely, increasing filler content can raise system viscosity, reducing mixability and adversely affecting foaming behavior. Therefore, the filler ratio is generally kept below 15–20 wt% [24,27,43,44]. To address these challenges, moisture-curing single-component PU systems can be used as an alternative, as they react directly with ambient moisture, eliminating the need for pre-mixing in commercial applications. This approach reduces production time and facilitates practical application. In this study, a manual mixing process was performed prior to application to initiate a refoaming reaction, which ensured uniform filler dispersion and maintained the structural integrity of the final product. Additionally, the spray-form system exhibited strong adhesion to various substrates, enabling improved interfacial interaction between the filler and the matrix. Nonetheless, there are limited studies in the literature on these advantages, and further comprehensive experimental validation is needed.
In this study, cenosphere (CS) particles with mean diameters of approximately 70 µm and 130 µm were incorporated into single-component PU foam at five loadings ranging from 5 wt% to 15 wt%. Although PU foams and CS fillers have been extensively investigated individually, here a single-component system was used to initiate foaming uniformly throughout the matrix, thereby mitigating production-related inhomogeneities such as filler–matrix separation. Additionally, the effects of filler particle size on performance parameters—including α, STL, compressive strength, and thermal stability—were examined in conjunction with structural morphology. The findings indicate that smaller CS particles disperse more uniformly within the foam and substantially improve acoustic performance via multiple reflection, internal friction, and resonance mechanisms. However, increases in α and STL beyond a 10 wt% filler content were limited. In terms of mechanical properties, EA and SEA showed modest gains up to 12.5 wt% filler content, while improvements of approximately 50% were observed above this threshold. Thermal analysis revealed that CS incorporation positively influenced glass transition temperature and thermal degradation behavior. To the best of our knowledge, this is the first study to incorporate cenospheres into a one-component PU foam system, enabling a homogeneous filler distribution and multifunctional performance.
Based on the experimental data, a correlation matrix was constructed to evaluate the relationships between filler ratio and particle size with key properties such as density, EA, SEA, α, and STL. The analysis indicated that filler ratio exhibited strong correlations with multiple performance metrics, whereas particle size had a secondary effect under specific conditions. This work not only highlights the potential of recycled materials in multifunctional PU foam systems but also presents an applied methodology enabling the simultaneous enhancement in acoustic, mechanical, and thermal properties. This novel approach differentiates the present work from previous studies on two-component PU foams, filling an important gap in the literature.
2. Experimental
2.1. Materials
In this study, single-component polyurethane-based Akfix 805P (Akkim Yapı Kimyasalları A.Ş., Istanbul, Turkey) foam was used as the primary matrix material. This commercial aerosol product cures with ambient moisture and expands at low temperatures to form a semi-rigid cellular structure, which makes it suitable for insulation applications.
As the filler phase, cenosphere (CS) particles were produced in-house from fly-ash residues obtained from the Tunçbilek Thermal Power Plant (Kütahya, Turkey). To isolate the lightweight, hollow microspheres, the fly ash was first dispersed in distilled water, and only the floating cenospheres were collected from the surface. The recovered particles were then oven-dried at 100 °C for 12 h to remove residual moisture. After drying, the cenospheres were sieved through a stainless-steel sieve stack to obtain two controlled size fractions with mean diameters of approximately 70 µm and 130 µm (±15 µm). The morphology and particle-size range were verified by optical microscopy and SEM, confirming the spherical geometry and narrow distribution.
The bulk densities of the fine and coarse fractions were measured as 245 kg/m3 and 320 kg/m3, respectively. This flotation–sieving classification ensured both compositional purity and a consistent particle-size distribution, providing uniform dispersion and repeatable performance in the polyurethane matrix.
2.2. Sample Preparation Process
Sample preparation consisted of four basic steps, which are illustrated schematically in Figure 1. In the first step, a predetermined amount of single-component polyurethane (PU) foam was transferred into a cylindrical polypropylene container (diameter ≈ 100 mm, height ≈ 150 mm). Cenosphere filler was then added to the PU foam, which began to expand upon reaction with ambient moisture. Immediately afterward, the PU–CS mixture was mechanically stirred using an ISOLAB 615.01.001 Overhead Stirrer (ISOLAB GmbH, Eschau Germany) equipped with a four-bladed stainless-steel propeller (paddle diameter ≈ 50 mm) at 300 rpm for 40 s to obtain a homogeneous dispersion. No active temperature control was applied during this short mixing period, and all operations were carried out under ambient laboratory conditions (23 ± 1 °C). The prepared mixture was then poured into test molds, where the refoaming process was initiated. All samples were allowed to cure under atmospheric conditions for 24 h, after which the foam structure stabilized, and sufficient mechanical integrity was achieved prior to testing.
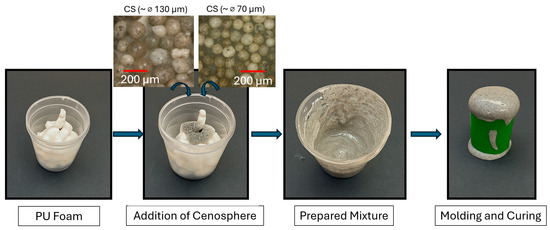
Figure 1.
Schematic representation of the PU-CS foam preparation process. The large blue arrows indicate the sequence of steps, the blue curly arrows represent the addition of cenospheres (CS), and the red lines in the inset micrographs are the 200 µm scale bars.
In this study, polyurethane foam-based composite samples were prepared for impedance tube tests. Each sample, designed to be 30 mm in height and 30 mm and 100 mm in diameter, was cast into rigid shells with a thickness of 0.4 mm to ensure that sound transmission was not affected (Figure 2). These samples have been used for acoustic performance measurements as well as differential scanning calorimetry (DSC), thermogravimetric analysis (TGA), and compression tests. For comparison purposes, pure PU foam samples without any filler were also tested under similar conditions.
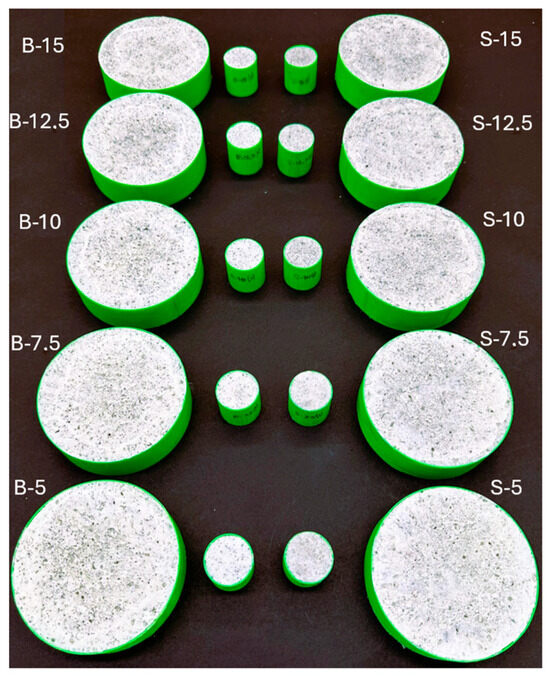
Figure 2.
PU-CS acoustic specimens for impedance tube testing.
2.3. Experimental Design and Specimen Configuration
The experiments were designed based on a sample matrix defined by CS particle size and filler ratio. Two main variables were considered: cenosphere (CS) filler ratios of 5 wt%, 7.5 wt%, 10 wt%, 12.5 wt%, and 15 wt%, and CS average particle sizes of ~70 µm and ~130 µm. Each filler ratio was evaluated in combination with both particle sizes, resulting in the preparation of 10 different composite samples. In this setup, a two-factor matrix (2 × 5 design) was established by combining the two variables. However, no numerical optimization or statistical modeling was used in the present work. Two additional control samples were prepared for comparative analysis. Sample N1 was obtained by allowing the PU foam to cure by self-expansion. Sample N2 was prepared by refoaming the foam structure after it was mechanically disrupted. These control samples enabled independent assessment of the effects of filler content and production method on foam structure.
In sample coding, the letters “S” and ‘B’ denote small (~70 µm) and large (~130 µm) CS particle sizes, respectively, while the numerical values following them indicate the filler ratio wt%. For example, the code “S-10” represents a sample containing 10% small-sized CS. The experimental design includes 10 composite samples classified according to different CS ratios and particle sizes, along with two reference samples. This structure is summarized in Table 1.

Table 1.
Design matrix of PU-CS composite specimens classified by cenosphere content and particle size.
2.4. Characterizations
The PU-CS composite samples developed in this study were analyzed based on specific physical and structural properties. The primary parameters measured included density, mechanical strength, acoustic performance, thermal behavior, and microstructure morphology. Each test method was applied to evaluate the corresponding material properties. Measurement accuracies and test conditions are detailed in the relevant subsections. These analyses have revealed the effects of cenosphere ratio and particle size on the structural and functional properties of the foams.
2.4.1. Bulk Density Measurement
The density of each sample was determined from its mass and volume. Mass was measured with a digital scale (ISOLAB GmbH, Wertheim, Germany; ±0.001 g). Three replicates were tested for each formulation, and the mean value was reported. Bulk density was used to evaluate the influence of CS addition on foam structure.
Theoretical density (ρtheoretical) was estimated by assuming a void-free mixture of neat PU (1140 kg/m3) and the bulk densities of the cenospheres (70 µm: 245 kg/m3; 130 µm: 320 kg/m3). Total porosity (P) was then calculated using Equation (1):
These values describe the overall porosity of the foams. No separation between open and closed pores was attempted. The bulk density, theoretical density, and porosity results are summarized in Table 2.
Table 2.
Bulk density values of PU-CS composite foams with varying CS content and particle size.
2.4.2. Mechanical Characterization
The mechanical behavior of composite samples was evaluated using quasi-static compression tests. For each test group, three cylindrical samples with a diameter of 30 mm and a height of 30 mm were prepared. The tests were conducted at room temperature using a Shimadzu universal testing machine (Shimadzu Corp., Kyoto, Japan) with a capacity of 5 kN at a constant speed of 5 mm/min.
The EA, MCF, and SEA values were calculated separately for each specimen using the data obtained from the load–displacement curves. EA (J) was determined as the integral of the load–displacement curve. MCF (N) was defined as the average force sustained during deformation, and SEA (J/g) was calculated by normalizing EA to the sample mass and is used to evaluate the strength-to-weight ratio of lightweight structures.
These parameters and density data were evaluated together to analyze the mechanical performance according to the filler content and particle size. The mechanical data played a complementary role in clarifying the relationship with acoustic performance.
2.4.3. Acoustic Performance
The acoustic properties of the composite samples were evaluated using the two-microphone impedance-tube method in accordance with ASTM E1050-19 [45]. Measurements were performed using a two-microphone acoustic testing system (TestSens®, Ankara, Turkey) capable of operating in the 100–6400 Hz frequency range.
Prior to testing, all foam specimens were allowed to fully cure for seven days under ambient laboratory conditions (23 ± 2 °C and 45 ± 5% RH) to ensure moisture stabilization. Before measurement, the samples were pre-conditioned at 23 ± 2 °C and 50 ± 5% RH for at least 24 h to equilibrate temperature and humidity. Tests were carried out immediately after sample insertion, with the test chamber maintained at 22.5 °C and 48% RH, while ambient air pressure was recorded for data correction. Each measurement was repeated three times, and the average values were used for further analysis.
STL and α values were obtained for each sample depending on frequency. STL represents the portion of incident sound energy blocked by the material before it can pass through, and is calculated using Equation (2):
Here, the sound energy received refers to the energy transmitted by the material. The α indicates the proportion of the received sound that is absorbed and is calculated using Equation (3):
α = 1 − |R|2 = 1 − |RT|2 − |Ri|2
Here, R is the reflection coefficient of the material surface, which is expressed as real (RT) and imaginary (Ri) components.
2.4.4. Thermal Analysis
The thermal behavior of composite samples was analyzed using DSC and TGA methods. The analyses were conducted to reveal the responses of the foam structure to temperature changes and the effect of CS addition on these responses.
DSC tests were conducted using a TA Instruments DSC 25 device (TA Instruments, New Castle, DE, USA) under an argon atmosphere at a heating–cooling rate of 5 °C/min. Approximately 5–10 mg samples were scanned in the temperature range of 25–300 °C to determine important thermal transition points such as the glass transition temperature. The effect of CS addition on transition temperatures was also analyzed. TGA analyses were performed using a Shimadzu DTG-60H instrument (Shimadzu Corp., Kyoto, Japan) at a temperature range of 30–800 °C and a heating rate of 10 °C/min under a nitrogen atmosphere. Mass losses were monitored as a function of temperature in samples weighing 5–10 mg. These thermal analyses provided important data for understanding the relationships between the filler content and particle size with other parameters.
3. Results and Discussion
3.1. Microstructural Evolution with Particle Size and Loading
The effects of cenosphere fillers on the cellular structure of polyurethane foams were investigated. Structural changes induced by different filler ratios and particle sizes in the cell diameter, wall thickness, and matrix–particle interaction zones were analyzed using digital microscopy and SEM images. The effect of the foaming method on cell homogeneity and porosity was demonstrated through quantitative measurements.
3.1.1. Distribution of Cenosphere Fillers Within the Matrix
To better examine the distribution of cenosphere (CS) particles within the polyurethane matrix, digital microscopy was employed, as SEM resolution was insufficient to capture filler distribution at this scale. The images in Figure 3 reveal distribution differences depending on the filler ratio and particle size. In samples S-5 and S-15, it was observed that as the filler ratio increased, the particles became more densely distributed both in the cell voids and on the walls. In contrast, in sample B-15, larger particles were found to have difficulty settling on the walls and tended to cluster in the cell voids. Moreover, it was observed that the filler size had no significant effect on the cell morphology.
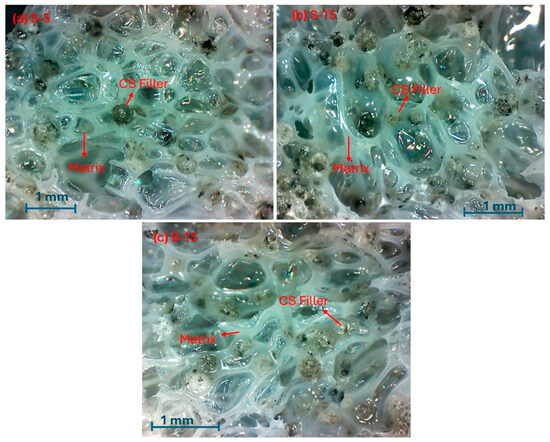
Figure 3.
(a–c) Optical microscope images of PU foam samples: S-5, S-15, and B-15, respectively.
Filler size was evaluated at the highest loading level (15 wt%), where morphological differences were most visible. In this context, S-15 and B-15 were compared to assess the size effect, while the influence of filler ratio was examined using S-5 and S-15. At lower loadings (e.g., 5 wt%), the effect of particle size was negligible, and therefore, the B-5 micrograph was not presented.
Figure 4 shows that the differences observed in the smaller cell diameters and thickened cell walls of the polyurethane foams subjected to refoaming are attributed to physical and chemical changes during the production process. In compressed and remixed foam systems, the original reactive ratios and gas formation balance were disrupted. This led to changes in nucleation conditions. Thus, the expansion capacity of the foams decreased, leading to denser cell structures. Increased viscosity has reduced matrix flowability, leading to thicker cell walls. These results indicate that increased cell density and reduced gas permeability enhance the morphological integrity and structural stability of the foams.
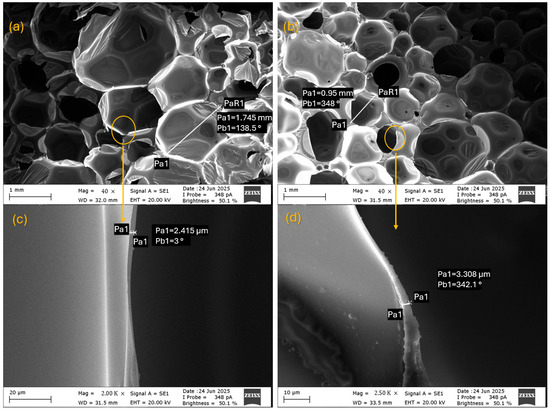
Figure 4.
SEM images of cell structure (a,b) and cell wall (c,d) for N1 and N2 samples.
Figure 5 shows that the mean cell diameter gradually decreases with increasing cenosphere content, while the cell walls become thicker. This reciprocal trend indicates that higher filler loadings lead to smaller cells and stronger walls, resulting in a denser foam structure. Although the effect of particle size is less pronounced compared to filler ratio, the B-series samples with larger particles exhibited slightly higher wall thickness at comparable loadings. These findings demonstrate that filler-induced structural modifications play a dominant role in controlling foam morphology and, consequently, directly influence the mechanical integrity and functional performance of the composites.
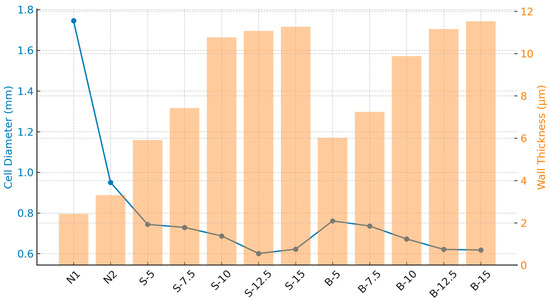
Figure 5.
Variation in mean cell diameter and wall thickness of PU–CS foams as a function of filler ratio and particle size.
3.1.2. Foam Morphology Analysis
Quantitative microstructural analyses were conducted to evaluate the cellular morphology of the foams. The samples were imaged using a ZEISS scanning electron microscope (Carl Zeiss AG, Oberkochen, Germany) and an Insize ISM-PM200SA digital microscope (Insıze Co., Ltd., Shanghai, China). For each foam specimen, micrographs were taken from three randomly selected cell-wall regions to ensure representative sampling. From each region, at least 15 individual measurements of both cell diameter and wall thickness were recorded using the digital microscope software (Insıze ISM-PM200SA Software, version 2.1), yielding a total of no fewer than 45 data points per sample. The reported values represent the mean ± standard deviation (SD) of these measurements, confirming good repeatability and negligible local variation in cell geometry. These measurements were evaluated to compare the effects of different filler ratios and production methods on foam morphology. Likewise, the mechanical test results presented in Table 2 were obtained from three replicate specimens for each sample and are expressed as mean ± SD, ensuring statistical consistency across both morphological and mechanical analyses.
3.1.3. Effect of Filler Parameters on Cell Structure
SEM images were used to evaluate the effect of filler ratio on cell morphology. Figure 6 compares S-5 and S-15 samples. When the filler content increased from 5 wt% to 15 wt%, the cells became noticeably smaller, while the walls thickened. In the cross-sectional views, S-15 shows a denser structure with narrower cells compared to S-5. These changes suggest that higher filler levels promote foam densification, which in turn can influence both mechanical and acoustic responses.
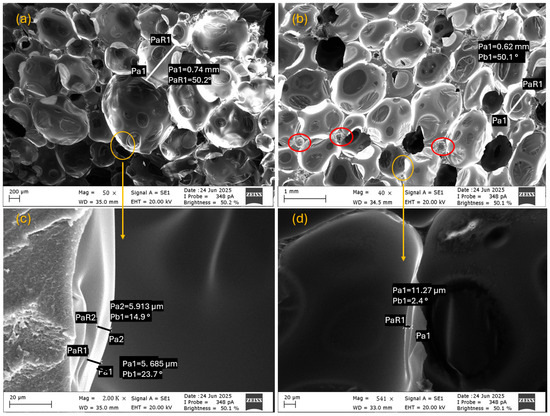
Figure 6.
SEM images of cell structure (a,b) and cell wall (c,d) for S-5 and S-15 samples.
3.2. Mechanical Results
The mechanical properties of the developed PU foams were evaluated based on the cenosphere (CS) filler ratio and particle size. The effect of cell structure changes in samples subjected to the refoaming process on mechanical performance was also analyzed.
Figure 7a shows the force–displacement curves of the N1 control samples obtained by single-stage foaming and the N2 samples subjected to the refoaming process. Across the entire deformation range, the N2 sample exhibited higher compressive forces than N1. For the N2 sample, cell walls thickened, cell diameters decreased, and density increased by approximately 30%. These structural changes made the foam more compact and rigid, thereby enhancing its resistance under external loads. Similar observations have been reported previously, where denser foams exhibited improved compressive strength [46].
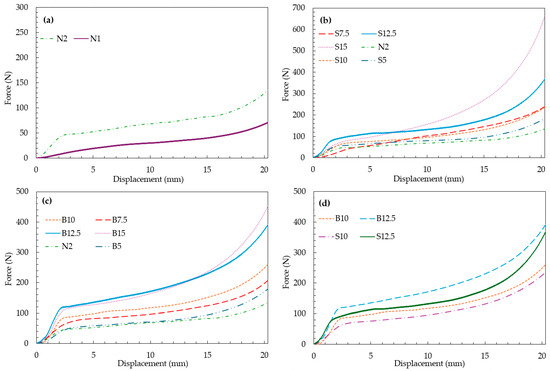
Figure 7.
Quasi-static compression behavior of polyurethane foams and PU-CS composites: (a) neat foams (N1, N2); (b) samples with small particle size; (c) samples with large particle size; (d) comparison of medium and high filler ratios.
Figure 7 highlights the quasi-static compression behavior of the foams, showing the combined effects of CS filler ratio and particle size. Load-carrying capacity increased with higher filler content across all sample groups. This improvement is attributed to CS particles supporting the cell walls and acting as load-bearing components, which delayed matrix collapse during deformation. Comparable reinforcing effects of hollow particles have been reported in earlier studies [39]. Similar load-bearing behavior of hollow microspheres in polyurethane syntactic foams was also observed by Fan et al. [40], confirming that the dispersed cenospheres act as secondary stress-transfer nodes that delay local cell wall collapse during compression.
Quantitative values of Energy Absorption (EA), Specific Energy Absorption (SEA), Maximum Compressive Force (MCF), and Compressive Modulus () are summarized in Table 3. The mechanical performance of the foams was mainly governed by the cenosphere (CS) filler content, while particle size had a minor effect. The value increased from 1.06 MPa for the neat N2 foam to 3.06 MPa for the B-15 composite, confirming the significant stiffness enhancement with increasing filler content. All CS-reinforced foams exhibited higher EA, SEA, and MCF values than the neat foam, with a sharp rise observed beyond 10 wt% filler loading. The S-15 sample, having the highest CS ratio, reached the maximum EA (3.98 J) and MCF (≈615 N). Samples with similar filler ratios but different particle sizes (e.g., S-12.5 vs. B-12.5) showed comparable performance, indicating that particle size was not a dominant factor. The relatively high SEA value of B-12.5 (2.07 J/g) is mainly attributed to the balance between reinforcement efficiency and composite density. Similar conclusions on the role of density normalization in energy absorption have also been reported in previous studies [47].
Table 3.
Mechanical Compression Test Results of PU Foam Samples with Different Cenosphere (CS) Filler Ratios and Particle Sizes.
In summary, filler concentration is the main parameter controlling the mechanical properties of these foams, while particle size exerts a measurable but secondary influence. Finally, the sharp increase in MCF and values above 10 wt% support the view that CS particles start to actively participate in load transfer beyond a critical threshold, a behavior also reported in other particle-reinforced foams [40].
3.3. Acoustic Characterization
3.3.1. Sound Absorption Coefficient (α)
The sound absorption performance of PU foams was evaluated in terms of cenosphere (CS) filler ratio and particle size. Frequency-dependent α curves are shown in Figure 8. As seen in Figure 8a, the refoamed N2 sample exhibited higher α values than the directly foamed N1, owing to its smaller cells and thicker walls, which promoted scattering and viscoelastic attenuation of sound waves.
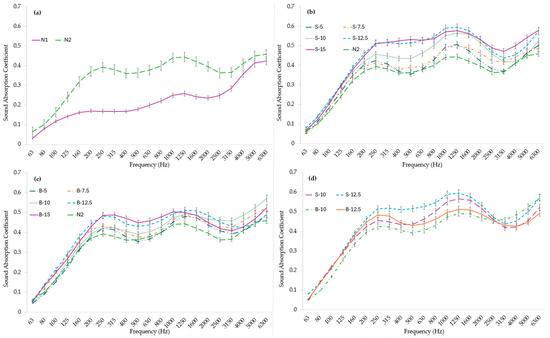
Figure 8.
Frequency-dependent sound absorption coefficient (α) of PU-CS composite foams: (a) control group (N1 and N2), (b) small-sized CS-filled samples (S series), (c) large-sized CS-filled samples (B series), and (d) comparison of particle size effect at equal filler ratios.
For the S-series samples (Figure 8b), α increased notably with filler ratio, especially above 7.5%. Samples S-12.5 and S-15 showed the best performance in the 100–2000 Hz range. This was attributed to multiple internal reflections created by uniformly dispersed hollow CS particles, which enhanced dissipation of acoustic energy [1].
In the B-series (Figure 8c), high-density B-12.5 and B-15 samples provided strong absorption at low frequencies, while B-10 showed comparable performance in the mid-frequency range. This suggests that ~10% is close to the optimum loading for large particles; beyond this, increased viscosity led to less homogeneous dispersion and reduced absorption. Figure 8d compares the S and B series at equal filler ratios. Smaller particles consistently yielded higher α in the 200–3000 Hz range, due to more regular distribution and extended sound paths. Larger particles, in contrast, caused irregular zones and local resonances, which limited absorption at mid–high frequencies. Nonetheless, their hollow nature contributed to multiple reflections, enhancing low-frequency attenuation.
Overall, these results confirm the frequency-dependent character of sound absorption: smaller particles improve mid–high frequency dissipation, while larger particles contribute more at lower frequencies. These findings are consistent with previous studies on open-cell polyurethane and syntactic foams, where the incorporation of hollow ceramic fillers enhanced sound absorption through multiple scattering and viscous losses [1,48].
3.3.2. Sound Transmission Loss (STL)
The STL behavior of PU foams is presented in Figure 9. In Figure 9a, the unfilled control samples N1 and N2 are compared. The refoamed N2 specimen exhibited higher STL values than the directly foamed N1 in the 250–1250 Hz range. This improvement can be attributed to the smaller cell diameters, thicker walls, and higher density of the N2 sample, as such a morphology hinders the propagation of sound waves within the material.
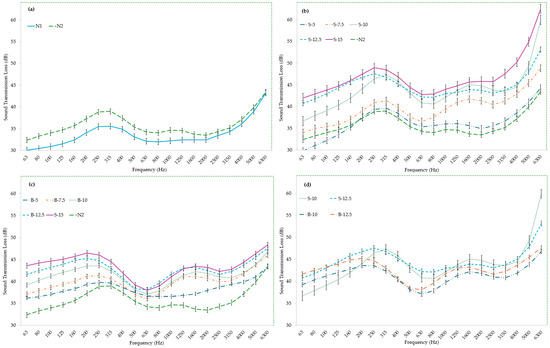
Figure 9.
Frequency-dependent STL of PU–CS composite foams: (a) control group (N1 and N2), (b) small-sized CS-filled samples (S series), (c) large-sized CS-filled samples (B series), and (d) comparison of particle size effect at equal filler ratios.
For the S-series samples (Figure 9b), all CS-filled foams displayed higher STL values than the neat N2, with S-15 achieving the best overall performance. Notably, S-10 and S-12.5 showed similar STL levels in the 250–2000 Hz range, suggesting that a filler content of around 10 wt% is particularly effective in the medium-frequency region. In the B-series (Figure 9c), all filled samples again surpassed N2, with B-12.5 and B-15 showing the highest STL values. However, the improvement became less pronounced when the filler ratio exceeded 7.5 wt%. This limitation is associated with increased mixture viscosity, which reduces the homogeneity of particle distribution and introduces irregularities in the cell structure. Such morphological degradation weakens the mechanisms of scattering and damping that are critical for sound attenuation, a trend also observed by Zhang et al. [27] in hollow microsphere–filled polyurethane composites, where excessive filler loading led to reduced acoustic performance due to structural non-uniformity.
Figure 9d compares the effect of particle size at equal filler ratios. Samples containing smaller particles consistently exhibited higher STL values. This effect can be explained by the larger number of small particles creating more interfaces within the foam, which enhances multiple scattering and internal friction, thereby promoting more effective attenuation of sound energy. Overall, these results demonstrate that both the production method and the incorporation of CS fillers markedly improve acoustic insulation. Particle size introduces a frequency-dependent contribution: smaller particles are more effective at medium and high frequencies, while larger particles enhance insulation at lower frequencies.
3.4. Thermal Behavior
The TGA and DTA results, which evaluate the thermal degradation behavior of the polyurethane (PU) foams, are presented in Figure 10. The analysis focused on N2, S-10, and S-15 samples, where N2 was selected as the reference to examine the effect of the refoaming process, while S-10 and S-15 represented the optimum and maximum filler loadings, respectively. These three samples were chosen to illustrate the influence of filler concentration at critical formulations rather than presenting all compositions.
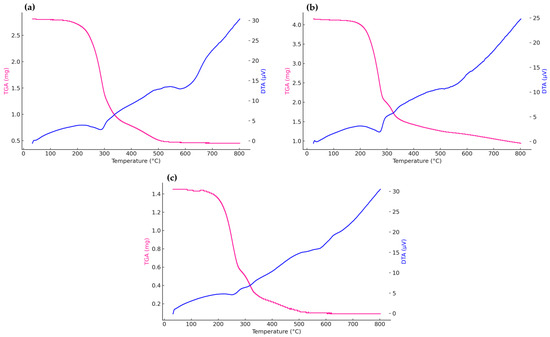
Figure 10.
TGA/DTA curves of (a) S-10, (b) S-15, and (c) N2 samples.
All foams exhibited a two-step degradation pattern characteristic of polyurethane systems. The first stage, beginning around 200–250 °C, was attributed to the cleavage of urethane linkages and the initial breakdown of hard segments. The second stage, observed between 300 and 450 °C, corresponded to the decomposition of the soft polyether segments and the release of volatile degradation products.
The quantitative degradation parameters (T5 %, Tmax, and residual mass at 800 °C) are summarized in Table 4. Increasing the cenosphere content clearly delayed the onset and maximum decomposition temperatures—from 200 °C and 300 °C for N2 to 230 °C and 320 °C for S-15—indicating enhanced thermal stability. Furthermore, the residual mass increased from 6.2% to 22.7%, confirming the char-forming and heat-shielding effects of the ceramic microspheres. The improved thermal resistance can be attributed to the intrinsic ceramic nature and low thermal conductivity of the cenospheres, which act as physical barriers to heat and oxygen diffusion within the polymer matrix.
Table 4.
Thermal degradation and residual mass data of PU–CS foams.
The DTA curves further corroborate these results, showing more pronounced endothermic transitions with increasing filler content, which implies higher energy absorption capacity before structural collapse. These observations are consistent with Pakdel et al. [25], who reported similar improvements in thermal reliability and residue formation in polymer composites containing hollow glass microspheres due to their barrier and insulation effects.
DSC analyses for S-5, S-10, and S-15 samples are presented in Figure 11. The B-series samples were excluded from this evaluation, as previous microstructural and mechanical analyses had demonstrated that particle size had a comparatively limited effect on overall performance. The DSC thermograms were presented in separate plots rather than in a single combined figure to ensure a clear visualization of transition peaks, as overlapping curves would obscure subtle distinctions, particularly in the high-temperature transition region.
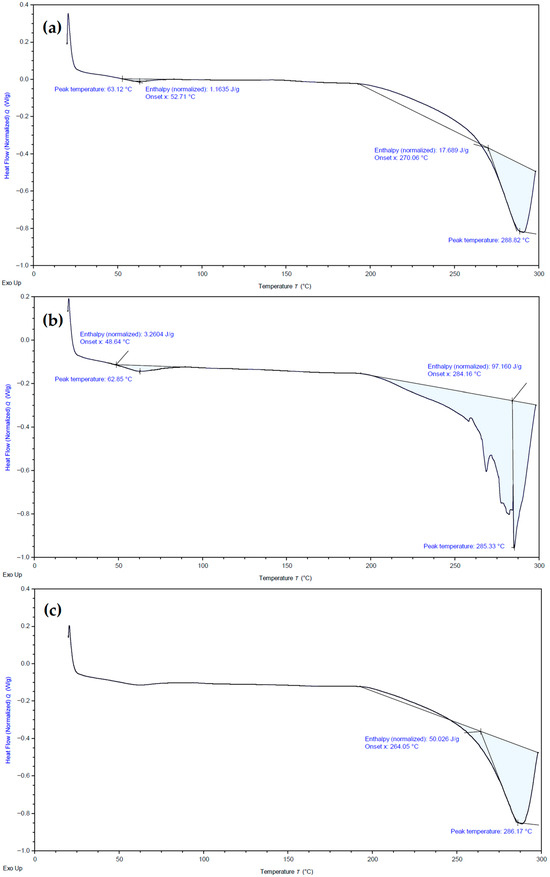
Figure 11.
DSC curves of (a) S-5, (b) S-10, and (c) S-15 samples. The shaded blue region represents the endothermic transition area corresponding to the glass-transition behavior of the PU–CS composites.
In all DSC curves, two endothermic transition regions were identified. The first transition occurred in the 60–90 °C range and is definitely attributed to the glass-transition temperature (Tg) of the flexible polyether soft segments. This low-enthalpy transition indicates the onset of segmental mobility at operational temperatures. The second transition was observed between 250 and 300 °C and corresponds to the dissociation and reorganization of the rigid urethane hard segments within the polymer network—a characteristic thermal event for semi-rigid polyurethane foams [49].
By contrast, a relative decrease in endotherm intensity was observed in the S-15 sample, where the filler content reached 15 wt%. This observation is consistent with studies confirming that the inclusion of ceramic micro-fillers enhances the dimensional and thermal stability of composites by restricting polymer-chain segmental motions and promoting matrix hardening, mechanisms crucial for maintaining performance at elevated temperatures [50]
In conclusion, cenosphere fillers positively influenced the thermal performance of the foams. These thermal analysis findings align with the mechanical and acoustic results, where excessive filler ratios (>12.5–15%) introduced viscosity-driven irregularities that limited performance despite the increase in filler content. Although direct thermal measurements for the B-series were not available, the overall thermal analysis clearly demonstrated the stabilizing influence of cenosphere fillers on the polyurethane matrix, confirming that particle size exerted only a minor effect on the thermal response.
3.5. Structure–Property Correlation
The Pearson correlation heatmap in Figure 12 depicts the relationships among the structural, acoustic, and morphological properties obtained from the experiments. The heatmap compares the effects of varying cenosphere filler contents and particle sizes on foam density, α, STL, and energy absorption parameters (EA and SEA).
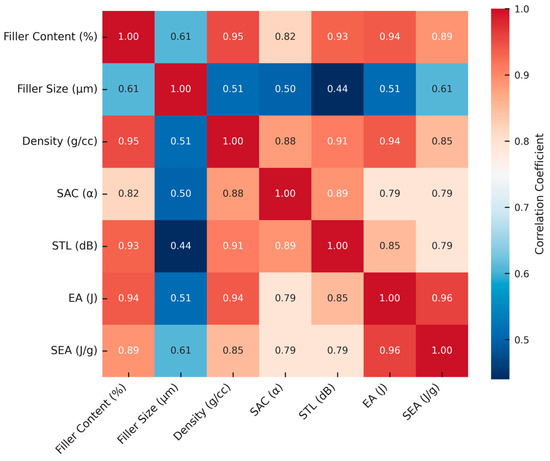
Figure 12.
Pearson correlation heatmap between structural and functional characteristics.
Correlation analysis has revealed significant positive relationships between the filler ratio and density (r = 0.95), EA (r = 0.94), SEA (r = 0.89), α (r = 0.82), and STL (r = 0.93). These results indicate that filler content is a key parameter influencing both acoustic and mechanical performance. In contrast, the effect of particle size was comparatively limited. Moderate correlations were observed between particle size and SEA (r = 0.61), while weaker correlations were found with α (r = 0.50) and STL (r = 0.44). The strong correlation between density and acoustic/mechanical parameters highlights the central role of microstructural densification in governing multifunctional performance. The findings reveal that the filler ratio plays a decisive role in system behavior, while particle size has more limited and context-dependent effects.
Overall, this study adopted a direct experimental observation approach rather than a parametric optimization method. The relationships between material composition, cell morphology, and performance outputs were analyzed separately. The effects of filler ratio and particle size on the mechanical, acoustic, and thermal performance of foam were comprehensively addressed experimentally. The findings revealed the influence of filler–matrix interactions on foam performance through an interdisciplinary approach.
4. Conclusions
In this study, single-component polyurethane (PU) foams reinforced with recycled cenosphere (CS) have been developed. The production process, which utilized a spray method, simultaneously initiated the filling and foaming reactions, thereby preventing matrix filler separation and improving homogeneity. Ten different samples were produced using two different CS types with particle sizes of ⌀70 µm and ⌀130 µm, and filler ratios ranging from 5% to 15% for each type. Structural, mechanical, acoustic, and thermal properties were systematically evaluated.
An increased filler ratio enhanced viscoelastic damping by increasing foam density and cell wall thickness. In particular, small CS particles were more homogeneously distributed within the matrix and had a more positive effect on the α and STL. The refoaming process led to a significant increase in acoustic performance by reducing cell diameter and increasing wall thickness.
Mechanical tests demonstrated that CS acts not merely as a volumetric filler but also as a load-bearing phase. At a 12.5% filler ratio, approximately a 50% increase in energy absorption (EA) and specific energy absorption (SEA) values was achieved. The refoaming process enhanced EA by a factor of 2.5 and SEA by a factor of 2.
Thermal analyses showed that CS addition increased the glass transition and decomposition temperatures of the PU matrix. This improvement arose not only from increased thermal mass but also from the diffusion-limiting effect of the particles. As the filler content increases, segmental mobility decreases, and enthalpy-dependent transitions become more pronounced.
Correlation analysis revealed that the filler ratio is highly correlated (r > 0.90) with performance parameters such as foam density, α, STL, EA, and SEA. In contrast, particle size showed limited effects (r ≈ 0.44–0.61) and was considered a secondary variable.
The results demonstrate that the addition of CS significantly improves the multifunctional performance of single-component PU foams. Accordingly, this study provides an innovative contribution by showing that recycled cenospheres can simultaneously enhance acoustic damping, load-bearing capacity, and thermal stability. The developed foams represent promising candidates for multifunctional systems requiring sound, impact, and thermal insulation across automotive, aerospace, building acoustics, and multilayer composite applications.
Author Contributions
Conceptualization, H.Ö. and A.B.B.; methodology, H.Ö.; software, A.B.B.; validation, H.Ö. and A.B.B.; formal analysis, A.B.B.; investigation, A.B.B.; resources, H.Ö.; data curation, A.B.B.; writing—original draft preparation, A.B.B.; writing—review and editing, H.Ö.; visualization, A.B.B.; supervision, H.Ö.; project administration, H.Ö.; funding acquisition, H.Ö. All authors have read and agreed to the published version of the manuscript.
Funding
This research received no external funding.
Data Availability Statement
The original contributions presented in this study are included in the article. Further inquiries can be directed to the corresponding author.
Acknowledgments
The authors would like to thank Mehmet Tiritoğlu from the Department of Textile Engineering at Bursa Uludağ University for his valuable support in conducting the mechanical compression tests. The authors also acknowledge DTA Mühendislik (Bursa, Türkiye) for performing the sound insulation measurements. Additionally, the authors express their gratitude to Tunçbilek Thermal Power Plant (Kütahya, Türkiye) for kindly supplying the cenosphere filler materials used in this study.
Conflicts of Interest
Author Anıl Burak Bektaşoğlu was employed by the Turkish Aerospace Industries Inc. (TUSAŞ). The remaining authors declare that the research was conducted in the absence of any commercial or financial relationships that could be construed as a potential conflict of interest.
References
- Boztoprak, Y.; Ünal, M.; Özada, Ç.; Kuzu, E.; Özer, H.; Ergin, F.; Yazıcı, M. Sound Insulation Performance of Honeycomb Core Aluminum Sandwich Panels with Flexible Epoxy-Based Foam Infill. Compos. Struct. 2023, 319, 117149. [Google Scholar] [CrossRef]
- Belda, R.; Palomar, M.; Marco, M.; Vercher-Martínez, A.; Giner, E. Open Cell Polyurethane Foam Compression Failure Characterization and Its Relationship to Morphometry. Mater. Sci. Eng. C 2021, 120, 111754. [Google Scholar] [CrossRef]
- Polaczek, K.; Kurańska, M.; Prociak, A. Open-Cell Bio-Polyurethane Foams Based on Bio-Polyols from Used Cooking Oil. J. Clean. Prod. 2022, 359, 132107. [Google Scholar] [CrossRef]
- Wang, Y.; Zhang, C.; Ren, L.; Ichchou, M.; Galland, M.A.; Bareille, O. Influences of Rice Hull in Polyurethane Foam on Its Sound Absorption Characteristics. Polym. Compos. 2013, 34, 1847–1855. [Google Scholar] [CrossRef]
- Özer, H. Elektrikli araçlar için esnek epoksi ve geri dönüştürülmüş poliüretan köpük tabanlı ses yalıtımı. Uludağ Univ. J. Fac. Eng. 2025, 30, 155–168. [Google Scholar] [CrossRef]
- Sung, G.; Kim, J.S.; Kim, J.H. Sound Absorption Behavior of Flexible Polyurethane Foams Including High Molecular-Weight Copolymer Polyol. Polym. Adv. Technol. 2018, 29, 852–859. [Google Scholar] [CrossRef]
- Moradi, G.; Nassiri, P.; Ershad-Langroudi, A.; Monazzam, M.R. Acoustical, Damping and Thermal Properties of Polyurethane/Poly(Methyl Methacrylate)-Based Semi-Interpenetrating Polymer Network Foams. Plast. Rubber Compos. 2018, 47, 221–231. [Google Scholar] [CrossRef]
- Choi, J.; Oh, S.J.; Baeck, S.H.; Shim, S.E.; Qian, Y. Multifunctional High Fatigue Resistant Silica Aerogel Reinforced by Polyurethane via Ambient Pressure Drying for Improved Thermal and Sound Insulation, Water Proofing, and Vapor Permeability. Constr. Build. Mater. 2025, 460, 139826. [Google Scholar] [CrossRef]
- Sandten, C.S.; Kreyenschmidt, M.; Albach, R. The Autoxidation of Polyether-Polyurethane Open Cell Soft Foam: An Analytical Aging Method to Reproducibly Determine VOC Emissions Caused by Thermo-Oxidative Degradation. J. Hazard. Mater. 2024, 474, 134747. [Google Scholar] [CrossRef]
- Ennazii, A.E.; Beaudoin, A.; Fatu, A.; Doumalin, P.; Bouyer, J.; Jolly, P.; Henry, Y.; Laçaj, E.; Couderc, B. Pore-Scale Numerical Analysis of Fluid Flows in Compressed Polyurethane Foams with a Workflow of Open-Cell Foams Modeling. J. Fluids Struct. 2024, 125, 104065. [Google Scholar] [CrossRef]
- Hayrullin, A.; Sinyavin, A.; Haibullina, A.; Ilyin, V. Experimental Investigation of the Heat Transport and Pressure Drop in Open-Cell Polyurethane Foams. Int. J. Heat Mass Transf. 2023, 217, 124709. [Google Scholar] [CrossRef]
- Akdogan, E.; Erdem, M. A Comprehensive Research of Low-Density Bio-Based Rigid Polyurethane Foams from Sugar Beet Pulp-Based Biopolyol: From Closed-Cell Towards Open-Cell Structure. Ind. Crops Prod. 2023, 200, 116809. [Google Scholar] [CrossRef]
- Lee, J.; Jung, I. Tuning Sound Absorbing Properties of Open Cell Polyurethane Foam by Impregnating Graphene Oxide. Appl. Acoust. 2019, 151, 10–21. [Google Scholar] [CrossRef]
- Hyuk Park, J.; Suh Minn, K.; Rae Lee, H.; Hyun Yang, S.; Bin Yu, C.; Yeol Pak, S.; Sung Oh, C.; Seok Song, Y.; June Kang, Y.; Ryoun Youn, J. Cell Openness Manipulation of Low Density Polyurethane Foam for Efficient Sound Absorption. J. Sound Vib. 2017, 406, 224–236. [Google Scholar] [CrossRef]
- Wang, Z.; Wang, C.; Gao, Y.; Li, Z.; Shang, Y.; Li, H. Porous Thermal Insulation Polyurethane Foam Materials. Polymers 2023, 15, 3818. [Google Scholar] [CrossRef] [PubMed]
- Olszewski, A.; Kosmela, P.; Piasecki, A.; Żukowska, W.; Szczepański, M.; Wojtasz, P.; Barczewski, M.; Barczewski, R.; Hejna, A. Comprehensive Investigation of Stoichiometry–Structure–Performance Relationships in Flexible Polyurethane Foams. Polymers 2022, 14, 3813. [Google Scholar] [CrossRef]
- Martwong, E.; Yingshataporn-a-nan, T.; Minanandana, T.; Puksuwan, K.; Junthip, J.; Sukhawipat, N. Sound Absorption and Thermal Insulation Materials from Waste Palm Oil for Housing Application: Green Polyurethane/Water Hyacinth Fiber Sheet Composite. Constr. Build. Mater. 2024, 438, 137007. [Google Scholar] [CrossRef]
- Fu, Y.; Qiu, C.; Ni, L.; Ye, H.; Zou, H.; Luo, Y.; Liang, M. Cell Structure Control and Performance of Rigid Polyurethane Foam with Lightweight, Good Mechanical, Thermal Insulation and Sound Insulation. Constr. Build. Mater. 2024, 447, 138068. [Google Scholar] [CrossRef]
- Mistry, M.; Prajapati, V.; Dholakiya, B.Z. Redefining Construction: An In-Depth Review of Sustainable Polyurethane Applications. J. Polym. Environ. 2024, 32, 3448–3489. [Google Scholar] [CrossRef]
- Pop, M.A.; Croitoru, C.; Matei, S.; Zaharia, S.M.; Coșniță, M.; Spîrchez, C. Thermal and Sound Insulation Properties of Organic Biocomposite Mixtures. Polymers 2024, 16, 672. [Google Scholar] [CrossRef]
- Zhang, X.; Ding, S.; Guan, Q.; Wang, Z.; Xie, H. Enhancing Thermal Properties, Flame Retardant and Mechanical of Multifunctional Rigid Polyurethane Foam Modified with Zinc Borate and Aluminum Diethyl Hypophosphite. Appl. Therm. Eng. 2025, 278, 127427. [Google Scholar] [CrossRef]
- Shi, Z.; Hu, J.; Zhang, M.; You, F.; Jiang, X.; Zheng, H.; Yao, C.; Zhao, P. Reinforced Sound Insulation Properties of Styrene-Acrylonitrile Copolymer Composites via Using Organo-Montmorillonite Loaded Polymethylmethacrylate Microspheres. Polymer 2025, 321, 128140. [Google Scholar] [CrossRef]
- Moges, K.A.; Yi, N.H.; Pyo, S. Novel Material Design to Enhance Sound Absorption and Strength of Cementitious Materials with a Hollow Glass Microsphere. J. Build. Eng. 2025, 106, 112628. [Google Scholar] [CrossRef]
- Gao, G.; Hu, Y.; Jia, H.; Liu, P.; Du, P.; Xu, D. Acoustic and Dielectric Properties of Epoxy Resin/Hollow Glass Microsphere Composite Acoustic Materials. J. Phys. Chem. Solids 2019, 135, 109105. [Google Scholar] [CrossRef]
- Pakdel, E.; Naebe, M.; Kashi, S.; Cai, Z.; Xie, W.; Yuen, A.C.Y.; Montazer, M.; Sun, L.; Wang, X. Functional Cotton Fabric Using Hollow Glass Microspheres: Focus on Thermal Insulation, Flame Retardancy, UV-Protection and Acoustic Performance. Prog. Org. Coat. 2020, 141, 105553. [Google Scholar] [CrossRef]
- Yang, X.; Tang, S.; Shen, X.; Peng, W. Research on the Sound Insulation Performance of Composite Rubber Reinforced with Hollow Glass Microsphere Based on Acoustic Finite Element Simulation. Polymers 2023, 15, 611. [Google Scholar] [CrossRef]
- Zhang, Z.; Jiang, H.; Li, R.; Gao, S.; Wang, Q.; Wang, G.; Ouyang, X.; Wei, H. High-Damping Polyurethane/Hollow Glass Microspheres Sound Insulation Materials: Preparation and Characterization. J. Appl. Polym. Sci. 2021, 138, 49970. [Google Scholar] [CrossRef]
- Buddhacosa, N.; Galos, J.; Das, R.; Khatibi, A.; Kandare, E. Vibration Damping and Acoustic Properties of Syntactic Foam Incorporating Waste Tyre-Derived Rubber Particles. Sustain. Mater. Technol. 2024, 41, e01013. [Google Scholar] [CrossRef]
- Kincses, D.B.; Károly, D.; Bukor, C. Production and Testing of Syntactic Metal Foams with Graded Filler Volume. Mater. Today Proc. 2020, 45, 4225–4228. [Google Scholar] [CrossRef]
- Pei, L.; Ya, B.; Ding, Z.; Fan, Z.; Zhang, X. Effect of Curing Agents and Hollow Glass Microspheres on the Compression Properties of Syntactic Foams. J. Mater. Res. Technol. 2023, 27, 5321–5331. [Google Scholar] [CrossRef]
- Mahesh, V. Study on Slurry Erosion Resistance and Damage Mechanism in Cenosphere Reinforced Syntactic Foams for Light Weight Applications. Int. J. Lightweight Mater. Manuf. 2024, 7, 285–292. [Google Scholar] [CrossRef]
- Kumar, J.; Negi, S. Dynamic Mechanical Analysis of Additively Manufactured Cenosphere-Filled PETG Syntactic Foam Composite. Int. J. Polym. Anal. Charact. 2024, 29, 647–657. [Google Scholar] [CrossRef]
- Daoud, A.; Abou El-Khair, M.T.; Shenouda, A.Y.; Fairouz, F.; Mohamed, E.; Abdel Aziz, M.E.; Yanamandra, K.; Gupta, N. Aging Behavior and Thermal Expansion of Novel Pb Alloys Reinforced with Fly Ash Cenospheres Composite Foams. Int. J. Lightweight Mater. Manuf. 2022, 5, 178–187. [Google Scholar] [CrossRef]
- Braszczyńska-Malik, K.N.; Kamieniak, J. Analysis of Interface Between Components in AZ91 Magnesium Alloy Foam Composite with Ni-P Coated Fly Ash Cenospheres. J. Alloys Compd. 2017, 720, 352–359. [Google Scholar] [CrossRef]
- Pragya, A.; Young, N.; Ghosh, T.K. Elastomer-Based Soft Syntactic Foam with Broadly Tunable Mechanical Properties and Shapability. Compos. Part B Eng. 2024, 286, 111794. [Google Scholar] [CrossRef]
- Cao, M.; Jiang, F.; Guo, C.; Li, Y.; Yu, T.; Qin, R. Interface Characterization and Mechanical Property of an Aluminum Matrix Syntactic Foam with Multi-Shelled Hollow Sphere Structure. Ceram. Int. 2022, 48, 18821–18833. [Google Scholar] [CrossRef]
- Yi, Y.; Li, C.; Han, Y.; Nie, J.; Fan, C.; He, Q. Preparation and Sound Absorption Performance of Low-Carbon Fly Ash Cenosphere Plates. Int. J. Ceram. Eng. Sci. 2024, 6, e10204. [Google Scholar] [CrossRef]
- Moulya, H.V.; Vasu, V.K.; Praveena, B.A.; Rajesh, M.; Ruthuparna, S.A.; Rahul, K. Study on Acoustic Properties of Polyester—Fly Ash Cenosphere\Nanographene Composites. Mater. Today Proc. 2022, 52, 1272–1277. [Google Scholar] [CrossRef]
- Zhang, B.; Fan, Z.; Hu, S.; Shen, Z.; Ma, H. Mechanical Response of the Fly Ash Cenospheres/Polyurethane Syntactic Foams Fabricated through Infiltration Process. Constr. Build. Mater. 2019, 206, 552–559. [Google Scholar] [CrossRef]
- Fan, Z.; Miao, Y.; Wang, Z.; Zhang, B.; Ma, H. Effect of the Cenospheres Size and Internally Lateral Constraints on Dynamic Compressive Behavior of Fly Ash Cenospheres Polyurethane Syntactic Foams. Compos. Part B Eng. 2019, 171, 329–338. [Google Scholar] [CrossRef]
- Fan, Z.; Yang, X.; Guo, Y.; Cui, Y. Anisotropic Compression Response of Functionally Gradient Syntactic Foam Comprising of Fly Ash Cenosphere and Polyurethane. Polym. Test. 2024, 133, 108415. [Google Scholar] [CrossRef]
- Kumar, R.; Mondal, D.P.; Chaudhary, A.; Shafeeq, M.; Kumari, S. Excellent EMI Shielding Performance and Thermal Insulating Properties in Lightweight, Multifunctional Carbon-Cenosphere Composite Foams. Compos. Part A Appl. Sci. Manuf. 2018, 112, 475–484. [Google Scholar] [CrossRef]
- Chen, L.; Xiang, P.; Tong, H.; Xin, S.; He, J.; Li, W.; He, C. High-Strength Polyurethane-Reinforced Glass Fiber Spacer Fabric for Cost-Effective, Lightweight, and High-Temperature Insulation Applications. Compos. Commun. 2025, 54. [Google Scholar] [CrossRef]
- Zygmunt-Kowalska, B.; Pielichowska, K.; Trestka, P.; Ziąbka, M.; Kuźnia, M. The Effect of Ash Silanization on the Selected Properties of Rigid Polyurethane Foam/Coal Fly Ash Composites. Energies 2022, 15, 2014. [Google Scholar] [CrossRef]
- ASTM E1050-19; Test Method for Impedance and Absorption of Acoustical Materials Using a Tube, Two Microphones and a Digital Frequency Analysis System. ASTM International: Conshohocken, PA, USA, 2019.
- Pech-Can, G.E.; Flores-Johnson, E.A.; Carrillo, J.G.; Bele, E.; Valadez-Gonzalez, A. Mechanical Properties of Polyurethane Foam Reinforced with Natural Henequen Fibre. J. Compos. Sci. 2024, 8, 343. [Google Scholar] [CrossRef]
- Yang, J.; Mahato, J.; Moon, J. Effects of Various Sizes of Cenospheres on Microstructural, Mechanical, and Thermal Properties of High-Strength and Lightweight Cementitious Composites. J. Build. Eng. 2023, 76, 107214. [Google Scholar] [CrossRef]
- Yu, T.; Jiang, F.; Wang, J.; Wang, Z.; Chang, Y.; Guo, C. Acoustic Insulation and Absorption Mechanism of Metallic Hollow Spheres Composites with Different Polymer Matrix. Compos. Struct. 2020, 248, 112566. [Google Scholar] [CrossRef]
- Gu, R.; Sain, M.M. Effects of Wood Fiber and Microclay on the Performance of Soy Based Polyurethane Foams. J. Polym. Environ. 2013, 21, 30–38. [Google Scholar] [CrossRef]
- Verdolotti, L.; Oliviero, M.; Lavorgna, M.; Santillo, C.; Tallia, F.; Iannace, S.; Chen, S.; Jones, J.R. “Aerogel-like” Polysiloxane-Polyurethane Hybrid Foams with Enhanced Mechanical and Thermal-Insulating Properties. Compos. Sci. Technol. 2021, 213, 108917. [Google Scholar] [CrossRef]
Disclaimer/Publisher’s Note: The statements, opinions and data contained in all publications are solely those of the individual author(s) and contributor(s) and not of MDPI and/or the editor(s). MDPI and/or the editor(s) disclaim responsibility for any injury to people or property resulting from any ideas, methods, instructions or products referred to in the content. |
© 2025 by the authors. Licensee MDPI, Basel, Switzerland. This article is an open access article distributed under the terms and conditions of the Creative Commons Attribution (CC BY) license (https://creativecommons.org/licenses/by/4.0/).