Abstract
Proppant crushing seriously affects the efficiency and effectiveness of oil and gas production. In conventional studies, multi-particle crushing research often adopts the particle replacement method; however, this method results in a relatively rough and discontinuous crushing simulation process, making energy conservation difficult to maintain before and after crushing, neglects complex mechanical behaviors such as internal stress distribution and crack propagation of particles, and thus lacks mechanical authenticity. Thus, this study employs the bonded crushing method and establishes a calibration method for mesoscopic parameters. By constructing a particle flow numerical model, the force and crushing processes of proppants under different mesoscopic parameter conditions for both single-particle clusters and multi-particle clusters are simulated, enabling comprehensive monitoring of internal crack propagation within particle clusters. The study systematically analyzes and investigates the influence of key mesoscopic parameters including the tensile strength of parallel bonds (pb-ten), cohesion of parallel bonds (pb-coh), effective modulus (emod), and stiffness ratio (kratio) on the maximum force required for particle crushing. Additionally, orthogonal experiment analysis is used to study the influence of different mesoscopic parameters on the proppant crushing rate. The results show that the larger the pb-ten and pb-coh, the less likely the proppant particle clusters are to crush; conversely, the higher the emod, the more likely the particle clusters are to crush. Within a certain range, pb-ten has the most significant impact on the proppant crushing rate, followed by pb-coh and emod, while kratio has a smaller impact. Based on the research results regarding the influence of laws of different mesoscopic parameters on proppant crushing performance, the mesoscopic parameters of the proppant were calibrated using the post-experiment proppant crushing rate as the fitting index. The simulation results were then compared with the experimental results, verifying the accuracy of the model. The findings of this study clarify the influence of laws of mesoscopic parameters on proppant crushing performance, providing a basis for the subsequent calibration of mesoscopic parameters for numerical proppants and helping to accurately characterize the macroscopic crushing performance of numerical proppants.
1. Introduction
During the development of oil and gas resources, hydraulic fracturing technology, as a crucial stimulation measure, has been widely applied globally [,,]. This technology creates fractures in the formation by injecting high—pressure fluid into it, thus creating channels for the flow of oil and gas [,,,]. Proppant is one of the core materials in hydraulic fracturing technology. Its function is to support the fractures formed during the fracturing process, preventing the fractures from closing, and thereby ensuring that oil and gas can continuously and efficiently flow from the reservoir to the wellbore [,,]. The quality of proppant performance is directly related to the fracturing effect, as well as the production and lifespan of oil and gas wells.
However, in the actual downhole environment, proppants are subject to the influence of various complex factors such as high closure pressure, which can lead to the crushing of some proppants [,]. Proppant crushing not only reduces fracture conductivity but also decreases the seepage channels for oil and gas, thus affecting the oil and gas production []. Moreover, the fine particles generated by crushing may migrate with the fluid, blocking pores and throats and further damaging the reservoir permeability []. Therefore, in-depth research on the influencing factors and laws of proppant crushing is of crucial significance for improving the performance of proppants and the effectiveness of hydraulic fracturing.
Traditional research methods mainly focus on testing and analyzing the performance of proppants from a macroscopic perspective [,]. Man et al. [] and Stephens et al. [] studied the compression and crushing characteristics of ceramic proppants and sand under high-stress conditions. Ramlan et al. [] and Alzanam et al. [] studied the mechanical strength of the coated proppant. W.T. Stephens et al. [] believe that compressive strength and particle size distribution are two indicators for proppant selection. Gaurav et al. [] studied and measured the mechanical properties of three ultra—lightweight proppant packs and individual proppants. They considered that proppants with a larger elastic modulus, minimal deformation, and obvious brittle characteristics are prone to form powder under high stress. Shuai Man et al. [] believe that it is extremely important to understand the compression and crushing of proppants. If proppants are not strong enough, they may experience particle crushing. Proppant particles with uneven surfaces are more likely to creep due to progressive damage under continuous loading. However, there is currently insufficient understanding of the influence of the internal mesoscopic structure of proppants and the interaction between particles on the crushing process. In recent years, the particle flow method, as a numerical method capable of simulating the mesoscopic mechanical behavior of granular materials, has been gradually and widely applied in fields such as geotechnical engineering and materials science [,,]. By establishing the contact model and mechanical constitutive relationship between particles, this method can realistically reproduce the deformation, failure, and other behaviors of granular materials during the loading process [,,]. Applying the particle flow method to the study of proppant crushing problems can reveal the movement of internal particles in proppants, the transfer of contact forces, and the initiation and propagation mechanisms of crushing at the mesoscopic level, providing a new approach for in—depth understanding of the essence of proppant crushing. Currently, there is limited research on the influence of mesoscopic parameters on proppant crushing performance and the precise characterization of their mechanical properties.
Based on the aforementioned background, the model in this study employs the Bonded Particle Method (BPM). A cemented particle cluster template was created. Based on this template, both single-cluster and multi-cluster numerical crushing models that match the template’s morphology and mechanical properties were established. In the multi-cluster model, to simplify calculations, all proppant clusters were assumed to have completely identical morphology and mechanical properties, ignoring potential performance differences among actual particles. Programming was used to achieve bonding within each particle cluster, while ensuring that clusters remained independent and unbonded from one another. To accurately characterize the mechanical properties of the proppant, a systematic mesoscopic parameter calibration method was then proposed. Numerical simulations were conducted using the established single-cluster and multi-cluster mechanical models to analyze the sensitivity of various mesoscopic parameters to the maximum crushing force and crushing rate. The influence weight of each mesoscopic parameter on the cluster crushing rate was clarified. This method uses the proppant crushing rate measured in laboratory experiments as the fitting target. It prioritizes the calibration of highly sensitive parameters that significantly affect crushing behavior, while keeping low-sensitivity parameters with minor effects fixed. This effectively avoids interference caused by parameter coupling and equivalence. Finally, the calibrated model was compared and validated against experimental data. The results of this study not only contribute to a deeper understanding of the mesoscopic mechanism of proppant crushing and provide a theoretical basis for the optimal design and performance improvement of proppants but also have important practical application value for enhancing the effectiveness and reliability of hydraulic fracturing technology and promoting the efficient development of oil and gas resources.
2. Principles of Discrete Element Particle Flow Code
This paper primarily uses the Particle Flow Code (PFC) software (version 6.0) to simulate the force-induced fragmentation characteristics of multi-particle clusters and discrete particles through programming. PFC is a software that supports secondary development. It allows users to customize contact models and boundary conditions, and by programming with Fish functions and script files, it can simulate and solve various complex practical problems.
The Discrete Element Particle Flow Code (PFC) operates by discretizing rock and soil into disk particles or spherical particles. Particle movement is governed by their interactions through contact with one another and is not entirely unconstrained. The principles governing particle motion are depicted in Figure 1, wherein the constitutive relationship based on the contact model uses the force-displacement law to calculate contact forces and displacement changes between particles []. Subsequently, Newton’s second law of motion is used to update particle positions, identify contact points, and determine stacking distances. These processes are iteratively refined until system equilibrium is achieved or failure occurs in the rock-soil, as illustrated in Figure 1.
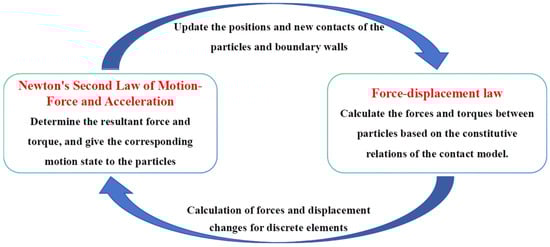
Figure 1.
Principles of particle motion.
2.1. Force-Displacement Law
Based on the constitutive relations of the contact model, the forces and torques between particles are calculated according to the force-displacement law. As shown in Figure 2, in a two-dimensional model, the contact point of the particle element is located in the ‘overlap’ region of the two solid elements. When particles come into contact, the normal direction of the contact plane aligns with the line connecting their centers. When a particle contacts a wall, this normal direction is defined as the direction of the shortest distance from the particle’s center to the wall.
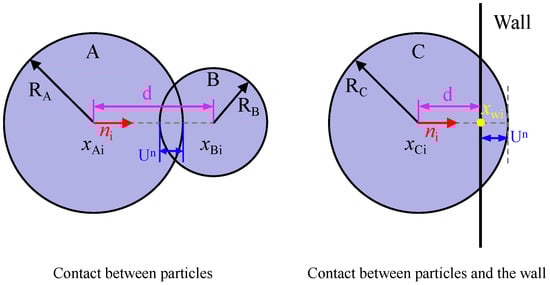
Figure 2.
Schematic representation of various contact types in the discrete element particle flow method. A, B, and C represent any different particles respectively.
The unit normal vector ni of the contact plane between two particles, as well as the ni of the contact plane between a particle and a wall, can be calculated using the following formula:
In Equation (1), xAi, xBi, and xCi represent the positions of the centers of particles A, B, and C, respectively. xWi represents the intersection point of the unit normal vector ni with the wall. d denotes the distance between the centers of particles or the distance from a particle center to the wall. The formula for calculating this distance d is as follows:
The equation for determining the position xδi of the contact point across various contact modes is presented as follows:
In Equation (3), RA denotes the radius of particle A, RB signifies the radius of particle B, and RC indicates the radius of particle C. Additionally, Un quantifies the extent of overlap between particles or between particles and the wall.
The contact force vector Fi acting between two interacting bodies can be resolved into a normal component and a tangential component:
The formula for calculating the normal component, , is as follows:
In Equation (5), Kn denotes the normal stiffness at the contact point.
The tangential contact force generated by the contact force vector is calculated in incremental form, and the formula for the incremental tangential component is calculated as follows:
2.2. Principles of Motion
Based on the resultant force and torque acting on the particles, combined with Newton’s Second Law of Motion, the motion state of the particles can be determined. This manifests in two forms: translation and rotation. The basic equations of motion are as follows:
Equation (7) delineates the translational equation, represents acceleration. m denotes the mass of the particle unit. gi represents the vector of volumetric force acceleration, such as gravitational load. Equation (8) articulates the rotational equation. signifying angular acceleration. Mi refers to the resultant moment acting on the particles. I indicate the principal moment of inertia.
2.3. Linear Parallel Bonding Model
There are various contact models in the discrete element method for particles, and this study primarily focuses on the linear parallel bond model (Figure 3). The Linear Parallel Bond Model is a core model in the discrete element method used to simulate the mechanical behavior of cemented granular materials. It combines linear contact elements in parallel with finite-sized parallel bond elements to simultaneously transmit forces and moments, providing resistance to rotation. The model exhibits irreversible brittle fracture once the stress in the parallel bond exceeds its strength limit []. In this model, key mesoscopic parameters collectively determine the macroscopic mechanical response of the material.
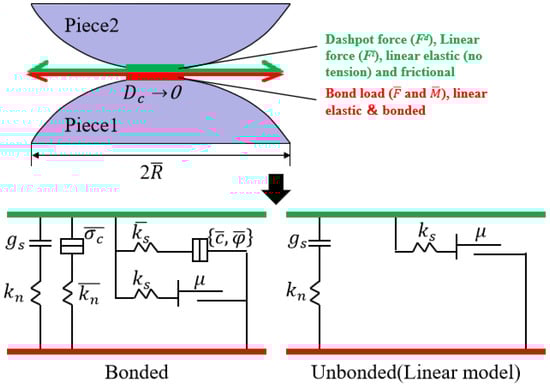
Figure 3.
Linear parallel bonding model.
As shown in Figure 3, in the linear parallel bond model, the linear contact stiffness parameters kn (kn) and ks (ks) govern the elastic deformation resistance between particles without bonds. The parallel bond stiffness parameters pb_kn () and pb_ks () control the normal and tangential stiffness of the bonded beams, collectively influencing the macroscopic elastic modulus and Poisson’s ratio of the model. The parallel bond tensile strength pb_ten (), cohesion strength pb_coh (), and internal friction angle pb_fa () define the tensile strength, shear strength, and internal friction characteristics of the bonds, directly determining the material’s brittle fracture behavior. The particle parameters emod and kratio indirectly regulate the overall elastic response by coordinating contact stiffness distribution, where emod defines the particle’s inherent elastic modulus and kratio determines the ratio between normal and tangential stiffness. The friction coefficient controls the residual strength and particle flow behavior after fracture. Through coupled interactions, these parameters collectively govern the model’s elastic deformation, strength properties, and fracture evolution process [].
The mathematical expressions for the contact force and moment within the linear parallel bonding model are as follows:
In Equation (9), denotes the linear force; represents the damping force; and signifies the parallel bonding force. In Equation (10), indicates the parallel bonding moment. The formulas for calculating both the parallel bonding force and moment are presented as follows:
In Equation (11), denotes the normal parallel bonding force; signifies the tangential parallel bonding force; represents the normal component of the unit direction vector. In Equation (12), indicates the rotational torque, which is consistently equal to zero in the two-dimensional model presented in this article; refers to the bending moment.
A parallel bond is capable of simultaneously transmitting both forces and torques. If the maximum normal or shear force on the parallel bond exceeds its normal or shear strength, the failure of the bond will occur.
3. Influence of Mesoscopic Parameters on Particle Crushing Performance
3.1. Establishment of Numerical Proppant Model
First, it is assumed that the disk particles inside single and multiple particle clusters are rigid and non-deformable. The simulation is conducted under two-dimensional conditions with zero rotational torque. When the applied external force causes the stress at the bonding points inside the particle cluster to exceed the set threshold, the bonds break and cracks appear inside the particle until the entire particle is crushed.
As shown in Figure 4, when simulating a single 40-mesh proppant (with a diameter of 0.000425 m), a certain number of disk particles with specific sizes are filled into a circular wall of 0.000425 m in diameter in a specific arrangement. They are bonded with a specific bond strength. The circular wall is then removed, and the model is saved as a particle cluster template. Loading plates are placed above and below the particle cluster. The lower loading plate remains fixed while the upper loading plate continuously applies force at a specific loading rate until the particle cluster breaks. The force applied by the upper loading plate at different time steps is recorded. The peak force applied by the upper loading plate is denoted as Fpeak, and the variation in Fpeak under different meso-parameters is investigated.
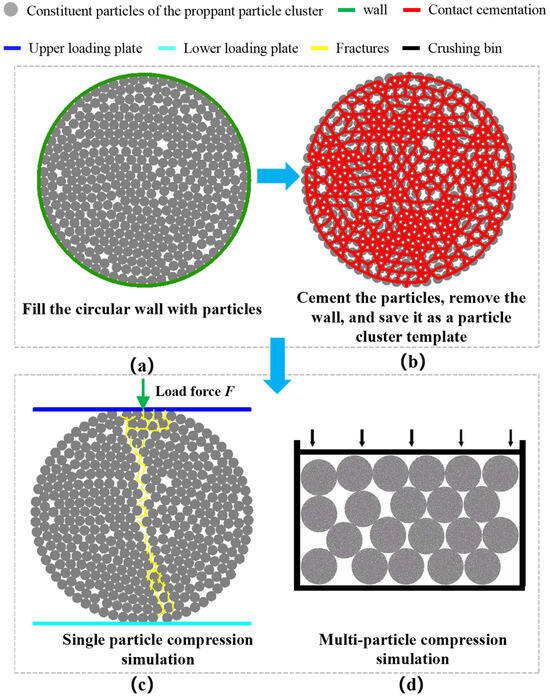
Figure 4.
Flow chart of establishing the numerical proppant model. (a) shows schematic diagram of particle filling in circular walls. (b) shows schematic diagram of cemented particle cluster template. (c) shows schematic diagram of single particle cluster compression simulation. (d) shows schematic diagram of multi-particle cluster compression simulation.
As shown in Figure 4, when simulating multi-particle breakage of 40-mesh proppants (with a diameter of 0.000425 m), a certain number of disk particles with specific sizes are filled into a circular wall of 0.000425 m in diameter in a specific arrangement. They are bonded with a specific bond strength. The circular wall is then removed, and the model is saved as a particle cluster template. Next, in a crushing chamber with specific length and width, a certain number of initial particles with a diameter of 0.000425 m are generated, and all initial particles are replaced with the saved particle cluster template. How to replace them with particle clusters that have the same mechanical properties as the saved template is one difficulty in this study. Ensuring that particles inside each cluster are bonded while clusters are independent of each other, with no bonding between them, is the second difficulty. In the crushing chamber, the walls on both sides and at the bottom remain fixed. Servo stress is applied on the top wall to simulate and record the breakage rate of proppant clusters under different meso-parameters and stress conditions.
3.2. The Influence of Mesoscopic Parameters on Particle Breakage Characteristics
To thoroughly investigate the influence of key mesoscopic parameters—including the tensile strength of contact bonding (pb-ten), cohesion (pb-coh), effective modulus (emod), and stiffness ratio (kratio)—on the crushing behavior of individual proppant particles, a single-proppant loading model was established as depicted in Figure 4c.
The dynamic variation in the force exerted by the upper platen on the proppant particle is meticulously recorded throughout the loading process.
The fundamental parameters of the model are summarized in Table 1, while the variation in the applied force on the upper platen is shown in Figure 5.

Table 1.
Basic Model Parameters.
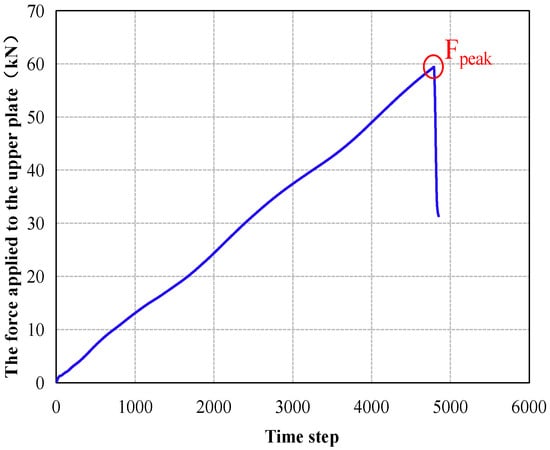
Figure 5.
Variation in applied force on upper platen.
Under constant other conditions, a single-particle crushing simulation study was conducted by individually varying the mesoscopic parameters (pb-ten, pb-coh, emod, kratio), etc. The peak force (Fpeak) applied by the upper loading platen was recorded during each simulation. The influence of different mesoscopic parameters on proppant crushing was investigated, and the results are shown in the figure below.
Figure 6a shows that as the tensile strength of the contact bond (pb-ten) increases, the peak force applied by the upper platen gradually increases, but the rate of increase gradually slows. This indicates that higher pb-ten values make the proppant particle more resistant to crushing, requiring a greater maximum applied force to achieve failure, albeit with diminishing returns.
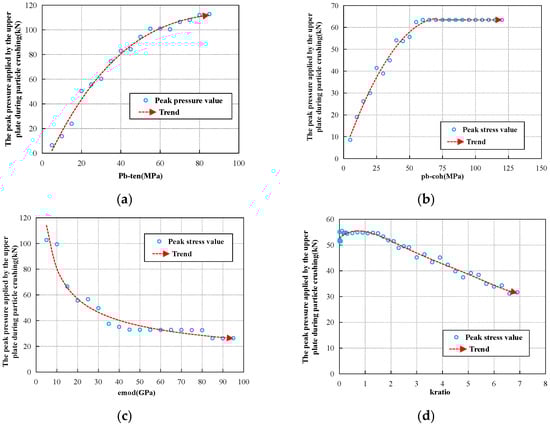
Figure 6.
Variation in peak force from the upper platen under different mesoscopic parameters. (a) shows the variation curves of the peak force of particle cluster fragmentation under different pb-ten. (b) shows the variation curves of the peak force of particle cluster fragmentation under different pb-coh. (c) shows the variation curves of the peak force of particle cluster fragmentation under different emod. (d) shows the variation curves of the peak force of particle cluster fragmentation under different kratio.
As shown in Figure 6b, within a certain range, the peak force applied by the upper platen gradually increases with the cohesion of the contact bond (pb-coh), though the rate of increase decelerates. Beyond a specific threshold, further increases in pb-coh have no additional effect on the peak force. Within this effective range, higher pb-coh enhances the particle’s resistance to crushing, raising the maximum force needed for failure, until the peak crushing force eventually stabilizes at a constant value.
Figure 6c demonstrates that as the effective modulus (emod) increases, the peak applied force from the upper platen gradually decreases, with a slowing rate of reduction. This suggests that higher emod values make the proppant particle easier to crush, reducing the maximum force required for failure, but the effect becomes less pronounced as emod continues to rise.
As illustrated in Figure 6d, within a certain interval, the peak force fluctuates slightly with increasing stiffness ratio (kratio), but without a significant change. Beyond this range, further increases in kratio lead to a gradual decrease in the peak force. Thus, above a critical kratio value, higher stiffness ratios make the particle easier to crush, progressively lowering the maximum force required for failure.
3.3. Analysis of the Influence Weight of Mesoscopic Parameters on Proppant Crushing Rate
Taking single-sized (40-mesh) particles as an example, a multi-particle breakage model was established by using PFC2D software, as shown in Figure 4d. The particles are placed in a crushing chamber with a fixed bottom and walls. A servomechanism is utilized to apply a target stress (50 MPa in this simulation) to the upper platen until the model reaches equilibrium. After equilibration, the particle breakage ratio within the crushing chamber is statistically analyzed.
To eliminate the influence of proppant arrangement, four random packing configurations were generated as shown in Figure 7. The breakage ratios under these different arrangements were recorded and averaged to obtain the mean breakage rate.
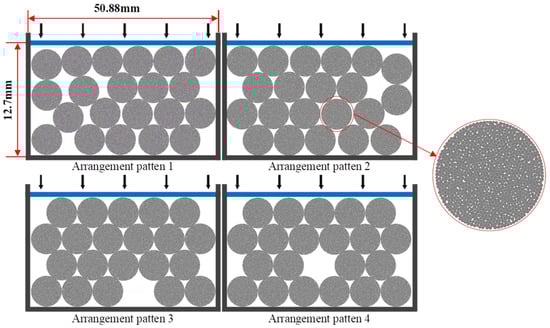
Figure 7.
Schematic of proppant packing with different arrangements in crushing chamber.
To investigate the influence weighting of mesoscopic parameters on the proppant breakage ratio, four factors—namely the tensile strength of contact bonds (pb-ten), cohesion of contact bonds (pb-coh), effective modulus (emod), and stiffness ratio (kratio)—were selected and assigned seven levels each. A four-factor, seven-level orthogonal experimental design was implemented to simulate the proppant breakage ratio under varying parameter combinations. Through comparative analysis, the influence weighting of each factor was quantitatively determined. The specific values corresponding to the seven levels of the four parameters are presented in Table 2, while the orthogonal experimental plan and corresponding simulation results are summarized in Table 3.
Table 2.
Specific values of factors at seven levels.
Table 3.
Orthogonal experimental plan and simulation results.
Based on the simulation results of the four-factor, seven-level orthogonal experimental plan, the comprehensive average value Ki for each factor was calculated using Equation (12) shown below. The results are presented in Table 4, and the variation curves of Ki for different factors are plotted in Figure 8.
where M stands for factor A, B, C, or D, yij is the simulation result corresponding to the level i of the factor, and n is the number of times this level appears in the orthogonal experiment.
Table 4.
Calculation of comprehensive average values Ki.
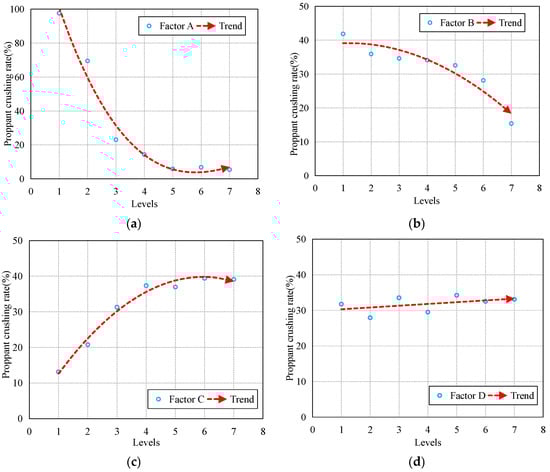
Figure 8.
Variation curves of Ki values under different factors. (a) shows variation curves of Ki values under different factor A (pb-ten). (b) shows variation curves of Ki values under different factor B (pb-coh). (c) shows variation curves of Ki values under different factor c (emod). (d) shows variation curves of Ki values under different factor D (kratio).
As shown in Figure 8, it can be observed that within the range of 100–700 MPa for Factor A (pb-ten), the proppant crushing rate generally decreases with increasing pb-ten, though the rate of decrease gradually diminishes. For Factor B (pb-coh) in the range of 200–800 MPa, the crushing rate shows an overall decreasing trend as pb-coh increases, with the reduction magnitude progressively accelerating. Regarding Factor C (emod) ranging from 5 to 95 GPa, the crushing rate exhibits an overall increasing trend with higher emod values, though the rate of increase gradually slows down. For Factor D (kratio) in the range of 0.01–6, the crushing rate demonstrates relatively minimal variation with changing kratio values.
Based on the calculated comprehensive average values (Ki), the range values (R) for different factors were determined as follows:
R_A = max(K_Ai) − min(K_Ai) = 92.11%
R_B = max(K_Bi) − min(K_Bi) = 26.45%
R_C = max(K_Ci) − min(K_Ci) = 26.27%
R_D = max(K_Di) − min(K_Di) = 6.321%
Based on the comparative analysis of the range values, it can be concluded that among Factor A (pb-ten, 100–700 MPa), Factor B (pb-coh, 200–800 MPa), Factor C (emod, 5–95 GPa), and Factor D (kratio, 0.01–6), Factor A (pb-ten) exhibits the most significant influence on the proppant crushing rate, followed by Factor B (pb-coh) and Factor C (emod). Factor D (kratio) demonstrates the least significant effect on the crushing rate.
This study investigates the influence of mesoscopic parameters on particle breakage patterns using PFC2D simulations and determines the relative weighting of mesoscopic parameters on particle breakage rates through orthogonal experimental results. When the value ranges of main mesoscopic parameters, such as the tensile strength of the contact bond (pb-ten), cohesion of the contact bond (pb-coh), effective modulus (emod), and stiffness ratio (kratio) change, the influence weights of different mesoscopic parameters on the particle cluster crushing rate may vary. Meanwhile, if the values of some mesoscopic parameters exceed the studied parameter range and approach critical values, simulation failure may occur due to violating the mathematical domain of the constitutive model, resulting in non-convergence or loss of physical meaning. In addition, when the values of some mesoscopic parameters exceed the performance thresholds of real materials, such as the strength limit controlled by chemical bonds or the elastic modulus limit determined by crystal structure, the simulation results will lose practical reference value.
3.4. Proppant Mesoscopic Parameter Calibration and Validation
David et al. [], both two-dimensional and three-dimensional models exhibit highly consistent linear elastic behavior and deviatoric stress responses during small deformation stages, while their isotropic stress levels converge under critical state conditions. Although the two-dimensional model demonstrates higher isotropic stress, lower deviatoric stress, and more pronounced stress softening at peak stage, its consistency with three-dimensional behavior in key mechanical states including both critical state and small deformation stages, combined with substantially superior computational efficiency, enables the two-dimensional model to effectively capture the fundamental mechanical characteristics of three-dimensional experiments and provides a viable approach for parameter calibration, despite its inherent limitations in fully replicating all aspects of actual three-dimensional complex scenarios.
A sufficient quantity of 40-mesh ceramic proppant was selected and placed in a crushing chamber with a diameter of 50.88 mm and a height of 88.9 mm according to experimental standards (as shown in Figure 9). The target stress was applied to the chamber. Upon completion of the test, crushed particles were sieved using a vibrating screen, and the crushing rate was calculated. Multiple repeated experiments were conducted to plot the proppant crushing rate curve under different stress conditions.
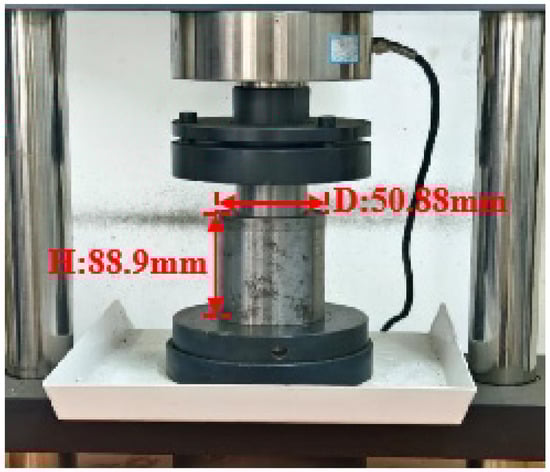
Figure 9.
Experimental setup for proppant breakage ratio measurement.
Similarly, numerical reconstruction of the proppant was performed using PFC. Given the high sphericity of ceramic particles, they could be approximated as circular disks in the simulation. The crushing chamber was filled with 40-mesh proppant particle clusters in random packing arrangements. A FISH loop function was programmed to continuously increase the force applied to the upper wall of the crushing chamber until the applied stress reached the target value, at which point the loop terminated. The central challenge in calibrating mesoscopic parameters lies in the coupling and equivalence among parameters, where identical macroscopic responses may correspond to multiple distinct parameter combinations.
To ensure the rationality and reliability of the fitting results, this study employs parameter sensitivity analysis as a constraint strategy. As detailed in Section 3.2 of the paper, the influence of different mesoscopic parameters on crushing force is analyzed. Section 3.3 summarizes the use of orthogonal experimental simulations to examine the effects and relative weights of various mesoscopic parameters on crushing rate. During calibration, highly sensitive parameters were prioritized while low-sensitivity parameters remained fixed, thereby mitigating the impact of parameter coupling and equivalence on the results. The simulation was repeated multiple times until the numerical results converged with the experimental data. The final results are shown in Figure 10, where the red curve represents the simulation results and the black dashed line denotes the experimental data. The close agreement between the two curves and an error within 10% confirms the successful calibration of the numerical proppant. The calibrated parameter values are summarized in Table 5.
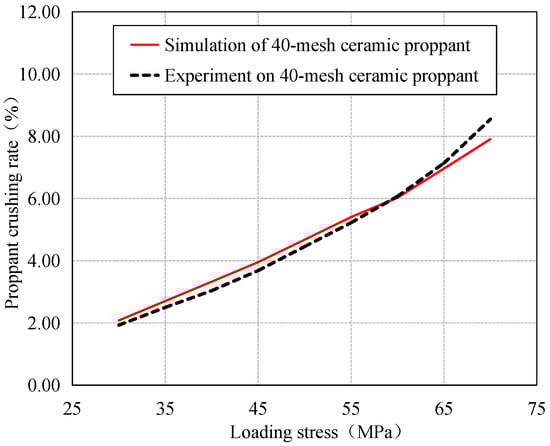
Figure 10.
Comparison curve of simulation and experimental results for breakage ratio.
Table 5.
Calibrated mesoscopic parameters for 40-mesh ceramic proppant.
To verify the accuracy of the parameter calibration results, the crushed particles of 40-mesh (425 μm) ceramsite obtained from experiments conducted under 35 MPa, 50 MPa, and 65 MPa were first sorted. These collected crushed particle clusters were then subjected to particle size classification using sieves with mesh sizes of 40 (425 μm), 50 (300 μm), 60 (250 μm), and 70 (212 μm). The proportions of crushed particle clusters smaller than 425 μm, 300 μm, 250 μm, and 212 μm, relative to all crushed particles, were recorded and subsequently compared with the simulation results. As shown in Figure 11, the error between the simulation and experimental results was within 5%, indicating that the model is accurate.
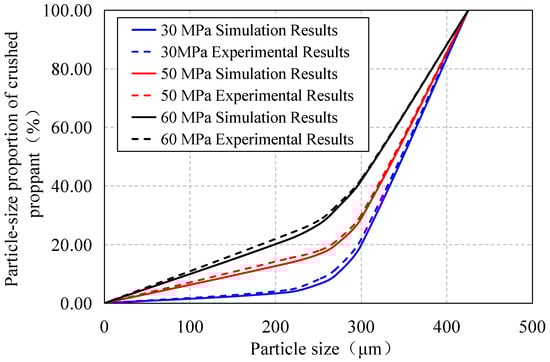
Figure 11.
Comparative grading of crushed proppants from experiments and simulations under different stress conditions.
Moreover, proppants subjected to experimental stresses of 35 MPa, 50 MPa, and 65 MPa were examined under a microscope. The resulting micrographs were compared with the corresponding numerically simulated visualizations under equivalent stress conditions. The comparative results are presented in Figure 12. Experimental observations revealed that when ceramic proppant particles were subjected to stress in the crushing chamber, the screened fragmented particles exhibited two distinct failure modes: primarily abrasive wear and fractural breakage. When the stress is relatively low, a small amount of proppants has a certain degree of wear on their boundaries. The greater the stress, the more broken particles there will be. These findings show good agreement with the simulation results. The calibrated numerical proppant parameters demonstrate a capable accuracy in characterizing the macroscopic breakage behavior of proppants.
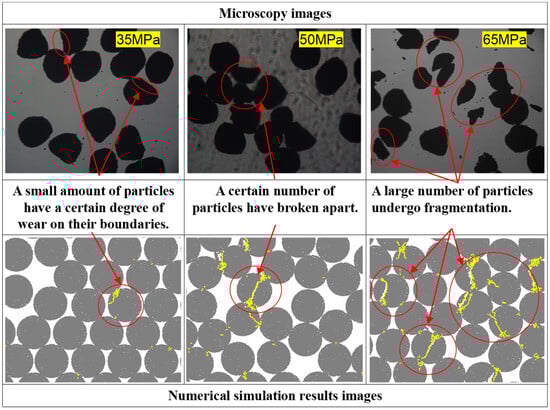
Figure 12.
Macroscopic fracture effects of proppant.
4. Particle Breakage Characteristics Under Different Mesoscopic Parameters
Understanding particle breakage characteristics under different mesoscopic parameters is crucial for revealing the deformation and strength mechanisms of granular materials. This knowledge provides a foundation for accurately characterizing the macroscopic breakage behavior of proppants in particle flow models, thereby enabling more precise simulations of numerical proppants under reservoir conditions and guiding the optimization of field proppant selection. Therefore, building upon previous research, this section discusses the particle breakage characteristics under various mesoscopic parameters.
As shown in Figure 13 and Figure 14, which illustrate the breakage patterns of a single proppant particle under varying pb-ten and pb-coh values, respectively, while keeping other parameters constant, the following observations can be made:
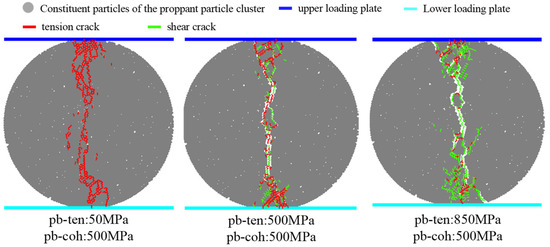
Figure 13.
Proppant breakage patterns under different pb-ten values.
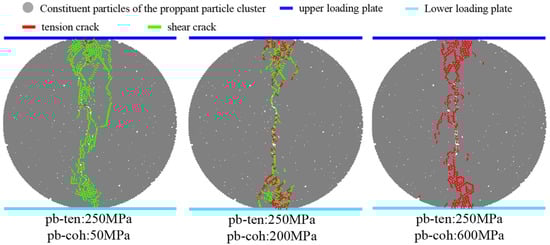
Figure 14.
Proppant breakage patterns under different pb-coh values.
When the pb-ten value is significantly lower than pb-coh under otherwise constant conditions, particle failure primarily results in tensile cracks. As pb-ten increases to values comparable to pb-coh, the particle failure involves both tensile and shear cracks. When pb-ten further increases to substantially exceed pb-coh, shear cracks become the dominant failure mode.
Similarly, when pb-coh is much lower than pb-ten under constant other parameters, particle failure mainly produces shear cracks. As pb-coh increases to approach pb-ten values, both shear and tensile cracks are observed. When pb-coh increases to greatly exceed pb-ten, tensile cracks prevail.
These results demonstrate that the predominant failure mode—whether tensile or shear cracking—is primarily determined by the relative difference between pb-ten and pb-coh values.
The above Figure 15 is the stress fracture diagram of a single particle under different emod conditions. As shown in the above figure, when the effective modulus emod value is small, the cracks generated from the upper and lower loading points have a certain deflection angle, denoted as α and β, respectively. During the expansion process, the deflection angles α and β gradually decrease until the cracks that extend from the upper and lower loading points meet. When the effective modulus emod value is small, the initial deflection angle of the crack at the upper and lower loading points is small, that is, the crack is easier to expand along the direction of the vertical loading plate.
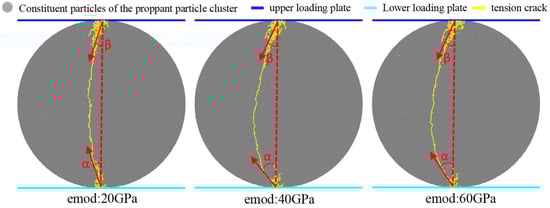
Figure 15.
Proppant crushing diagram under different emods.
Figure 16 shows the crushing diagram of proppant under different kratios. From the perspective of particle crushing morphology, there is no obvious rule under different kratios. Therefore, the change curve of the applied force of the loading plate on different kratios is compared, as shown in Figure 17 above. Under different kratio, the maximum force required for proppant crushing is different. The larger the kratio, the smaller the maximum force required for particle crushing, and the smaller the slope of the curve.
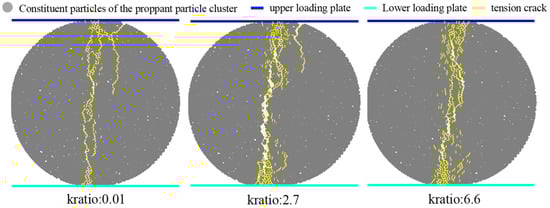
Figure 16.
Fracture diagram of proppant under different kratio.
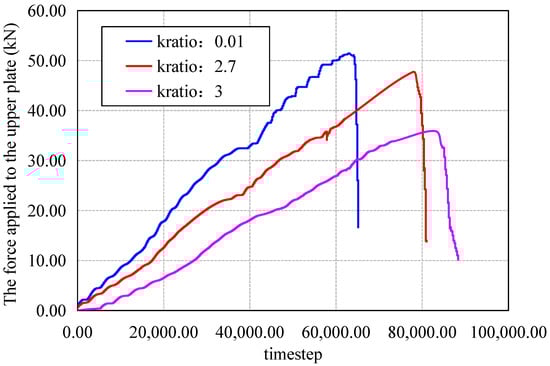
Figure 17.
Variation in applied force on upper platen under different kratio values.
5. Conclusions
This study employs the bonded crushing method and establishes a calibration method for mesoscopic parameters. By constructing a particle flow numerical model, the force and crushing processes of proppants under different mesoscopic parameter conditions for both single-particle clusters and multi-particle clusters are simulated, enabling comprehensive monitoring of internal crack propagation in particle clusters. The study systematically analyzes and investigates the influence of key mesoscopic parameters, including the tensile strength of parallel bonds (pb-ten), cohesion of parallel bonds (pb-coh), effective modulus (emod), and stiffness ratio (kratio), on the maximum force required for particle crushing. Additionally, orthogonal experiment analysis is used to study the influence weights of different mesoscopic parameters on the proppant crushing rate. Analyze and summarize the following conclusions:
- (1)
- The higher values of pb-ten and pb-coh reduce the susceptibility of proppant particles to crushing, whereas a larger emod facilitates particle breakage.
- (2)
- Among Factor A (pb-ten, 100–700 MPa), Factor B (pb-coh, 200–800 MPa), Factor C (emod, 5–95 GPa), and Factor D (kratio, 0.01–6), Factor A (pb-ten) has the most significant influence on the proppant crushing rate, with a range value of 92.11%. This is followed by Factor B (pb-coh) and Factor C (emod), which have a range value of approximately 26%. Factor D (kratio) has the least significant effect on the crushing rate, with a range value of only 6.321%.
- (3)
- The type of fractures (tension crack or shear crack) produced by the fragmentation of the proppant mainly depends on the relative difference between pb-ten and pb-coh. When the effective modulus emod value is small, the initial deflection angle of the crack at the upper and lower loading points is also small; that is, the crack is easier to expand along the direction of the vertical loading plate.
- (4)
- Investigating the influence of mesoscopic parameters on proppant crushing behavior is crucial, as it provides a reference for calibrating numerical parameters of synthetic proppants and contributes to the accurate characterization of their macroscopic crushing performance.
Author Contributions
Y.Z.: Conceptualization and Writing—Original Draft Preparation; D.Z.: Conceptualization and Writing—Review and Editing; Y.W.: Formal Analysis and Investigation; C.L.: Validation; H.W.: Methodology and Writing—Review and Editing; Q.W.: Data Curation. All authors have read and agreed to the published version of the manuscript.
Funding
This work was supported by the National Natural Science Foundation of China (Grant Nos. 52504036, U23B2089), the Shaanxi Provincial Natural Science Basic Research Program Project (grant number 2024JC-YBQN-0554), and the Scientific Research Program Funded by Shaanxi Provincial Education Department (Program No. 24JK0597).
Data Availability Statement
All data have been described in detail in the text; for further information, please contact the corresponding authors.
Conflicts of Interest
The authors declare no conflicts of interest.
References
- Lei, Q.; Xu, Y.; Cai, B.; Guan, B.; Wang, X.; Bi, G.; Li, H.; Li, S.; Ding, B.; Fu, H.; et al. Progress and prospects of horizontal well fracturing technology for shale oil and gas reservoirs. Pet. Explor. Dev. 2022, 49, 191–199. [Google Scholar] [CrossRef]
- Li, Y.; Xu, Y. Recent advances in tight oil reservoir development: Integrated technology of horizontal drilling and hydraulic fracturing. Adv. Resour. Res. 2024, 4, 300–317. [Google Scholar] [CrossRef]
- Lu, Y.; Yang, Z.; Li, X.; Han, J.; Ji, G. Problems and methods for optimization of hydraulic fracturing of deep coal beds in China. Chem. Technol. Fuels Oils 2015, 51, 41–48. [Google Scholar] [CrossRef]
- Zhang, X.; Jeffrey, R.G. Role of overpressurized fluid and fluid-driven fractures in forming fracture networks. J. Geochem. Explor. 2014, 144, 194–207. [Google Scholar] [CrossRef]
- Al-Muntasheri, G.A. A critical review of hydraulic-fracturing fluids for moderate-to ultralow-permeability formations over the last decade. SPE Prod. Oper. 2014, 29, 243–260. [Google Scholar] [CrossRef]
- Li, Y.; Xu, H.; Fu, S.; Zhao, H.; Chen, Z.; Bai, X.; Li, J.; Xiu, C.; Zhang, L.; Wang, J. Analysis of the Effectiveness Mechanism and Research on Key Influencing Factors of High-Pressure Water Injection in Low-Permeability Reservoirs. Processes 2025, 13, 2664. [Google Scholar] [CrossRef]
- Zhou, H.; Yan, T.; Ma, C.; Wang, B.; Zhou, F. Characteristics of Propped Fracture Propagation in Volcanic Clastic Reservoirs: A Multiscale Study of Conductivity Sustainability and Fracture Network Complexity. Rock Mech. Rock Eng. 2025, 1–26. [Google Scholar] [CrossRef]
- Wang, J.; Elsworth, D. Role of proppant distribution on the evolution of hydraulic fracture conductivity. J. Pet. Sci. Eng. 2018, 166, 249–262. [Google Scholar] [CrossRef]
- Liang, F.; Sayed, M.; Al-Muntasheri, G.A.; Chang, F.F.; Li, L. A comprehensive review on proppant technologies. Petroleum 2016, 2, 26–39. [Google Scholar] [CrossRef]
- Coulter, G.; Wells, R. The advantages of high proppant concentration in fracture stimulation. J. Pet. Technol. 1972, 24, 643–650. [Google Scholar] [CrossRef]
- Ghosh, S.; Rai, C.S.; Sondergeld, C.H.; Larese, R.E. Experimental Investigation of Proppant Diagenesis. In Proceedings of the SPE/CSUR Unconventional Resources Conference, Calgary, AB, Canada, 30 September–2 October 2014. [Google Scholar]
- Mittal, A.; Rai, C.S.; Sondergeld, C.H. Proppant conductivity testing under simulated reservoir conditions: Impact of crushing, embedment, and diagenesis on long-term production in shales. SPE J. 2018, 23, 1304–1315. [Google Scholar] [CrossRef]
- Terracina, J.M.; Turner, J.M.; Collins, D.H.; Spillars, S. Proppant Selection and Its Effect on the Results of Fracturing Treatments Performed in Shale Formations. In Proceedings of the SPE Annual Technical Conference and Exhibition, Florence, Italy, 20–22 September 2010. [Google Scholar]
- Kaiser, M.J.; Yu, Y. A scenario-based hydrocarbon production forecast for Louisiana. Nat. Resour. Res. 2012, 21, 143–162. [Google Scholar] [CrossRef]
- Simo, H.; Pournik, M.; Sondergeld, C.H. Proppant crush test: A new approach. In Proceedings of the SPE Oklahoma City Oil and Gas Symposium/Production and Operations Symposium, Oklahoma, OK, USA, 23–26 March 2013; SPE: Bellingham, WA, USA, 2013; p. SPE-164506-MS. [Google Scholar]
- Aderibigbe, A.A.; Valdes, C.C.; Heidari, Z.; Fuss-Dezelic, T. Mechanical-damage characterization in proppant packs by use of acoustic measurements. SPE Prod. Oper. 2017, 32, 168–176. [Google Scholar] [CrossRef]
- Man, S.; Wong, R.C.K. Compression and crushing behavior of ceramic proppants and sand under high stresses. J. Pet. Sci. Eng. 2017, 158, 268–283. [Google Scholar] [CrossRef]
- Stephens, W.T.; Schubarth, S.K.; Dickson, K.R.; Snyder, E.M.; Doles, K.J.; Herndon, D.C. Behavior of proppants under cyclic stress. In Proceedings of the SPE Hydraulic Fracturing Technology Conference and Exhibition, College Station, TX, USA, 29 January 2007; SPE: Bellingham, WA, USA, 2007; p. SPE-106365-MS. [Google Scholar]
- Ramlan, A.S.; Zin, R.M.; Abu Bakar, N.F.; Othman, N.H.; Jarni, H.H.; Hussain, M.H.; Najib, N.I.M.; Zakran, M.Z. Characterisation of graphene oxide-coated sand for potential use as proppant in hydraulic fracturing. Arab. J. Geosci. 2022, 15, 1126. [Google Scholar] [CrossRef]
- Alzanam, A.A.A.; Ishtiaq, U.; Muhsan, A.S.; Mohamed, N.M. A multiwalled carbon nanotube-based polyurethane nanocomposite-coated sand/proppant for improved mechanical strength and flowback control in hydraulic fracturing applications. ACS Omega 2021, 6, 20768–20778. [Google Scholar] [CrossRef]
- Stephens, W.T.; Schubarth, S.K.; Rivera, D.I.; Snyder, E.M.; Herndon, D.C. Statistical Study of the Crush Resistance Measurement for Ceramic Proppants. In Proceedings of the SPE Annual Technical Conference and Exhibition? San Antonio, TX, USA, 24–27 September 2006; SPE: Bellingham, WA, USA, 2006; p. SPE-102645-MS. [Google Scholar]
- Gaurav, A.; Dao, E.K.; Mohanty, K.K. Evaluation of ultra-light-weight proppants for shale fracturing. J. Pet. Sci. Eng. 2012, 92, 82–88. [Google Scholar] [CrossRef]
- Zheng, W.; Tannant, D.D. Influence of proppant fragmentation on fracture conductivity-insights from three-dimensional discrete element modeling. J. Pet. Sci. Eng. 2019, 177, 1010–1023. [Google Scholar] [CrossRef]
- Deng, S.; Li, H.; Ma, G.; Huang, H.; Li, X. Simulation of shale–proppant interaction in hydraulic fracturing by the discrete element method. Int. J. Rock Mech. Min. Sci. 2014, 70, 219–228. [Google Scholar] [CrossRef]
- Bolintineanu, D.S.; Rao, R.R.; Lechman, J.B.; Romero, J.A.; Jove-Colon, C.F.; Quintana, E.C.; Bauer, S.J.; Ingraham, M.D. Simulations of the effects of proppant placement on the conductivity and mechanical stability of hydraulic fractures. Int. J. Rock Mech. Min. Sci. 2017, 100, 188–198. [Google Scholar] [CrossRef]
- Kulkarni, M.C.; Ochoa, O. Mechanics of light weight proppants: A discrete approach. Compos. Sci. Technol. 2012, 72, 879–885. [Google Scholar] [CrossRef]
- Zhou, W.; Yang, L.; Ma, G.; Chang, X.; Lai, Z.; Xu, K. DEM analysis of the size effects on the behavior of crushable granular materials. Granul. Matter 2016, 18, 64. [Google Scholar] [CrossRef]
- Zheng, W.; Tannant, D. Grain breakage criteria for discrete element models of sand crushing under one-dimensional compression. Comput. Geotech. 2018, 95, 231–239. [Google Scholar] [CrossRef]
- Itasca, C.G. PFC2D-Particle Flow Code in 2 Dimensions, Version 6.0 User’S Manual; Itasca Consulting Group: Minneapolis, MN, USA, 2019. [Google Scholar]
- Wang, H.; Zhou, D.; Zou, Y.; Zheng, P. Effect mechanism of seepage force on the hydraulic fracture propagation. Int. J. Coal Sci. Technol. 2024, 11, 43. [Google Scholar] [CrossRef]
- David, C.T.; García-Rojo, R.; Herrmann, H.J.; Luding, S. Powder flow testing with 2d and 3d biaxial and triaxial simulations. Part. Part. Syst. Charact. 2007, 24, 29–33. [Google Scholar] [CrossRef]
Disclaimer/Publisher’s Note: The statements, opinions and data contained in all publications are solely those of the individual author(s) and contributor(s) and not of MDPI and/or the editor(s). MDPI and/or the editor(s) disclaim responsibility for any injury to people or property resulting from any ideas, methods, instructions or products referred to in the content. |
© 2025 by the authors. Licensee MDPI, Basel, Switzerland. This article is an open access article distributed under the terms and conditions of the Creative Commons Attribution (CC BY) license (https://creativecommons.org/licenses/by/4.0/).