1. Introduction
The mechanical dry transfer method of placing carbon nanotubes onto substrates is known to be very clean and therefore results in exceptional device performance. With this type of production process, a distinction can be made between deterministic and non-deterministic placement. With the non-deterministic placement, as reported in [
1], carbon nanotubes are scattered randomly over a device substrate. With this method, a very high number of transfers per hour (TPH) can be achieved, but there is no control over the position and orientation of the individual carbon nanotubes. The deterministic mechanical dry transfer manufacturing technique of carbon nanotube devices, on the other hand, utilizes a growth substrate as a carbon nanotube donor to integrate those into a device substrate. The growth substrate has cantilever pairs that form trenches in which a carbon nanotube can be suspended. In [
2,
3,
4,
5,
6,
7,
8,
9], nanotubes are suspended on such cantilever pairs and are transferred to the device substrate by mechanically breaking them off their support structure. Van der Waals forces guarantee adhesion to the device electrodes. This procedure is schematically depicted in
Figure 1. As, however, each single carbon nanotube has to be transferred individually, the achievable production rate is a severe disadvantage. Moreover, as it is necessary to use a motion system for the positioning of carbon nanotubes, travel distances and ranges need to be considered as well.
The growth substrate’s geometry also affects the carbon nanotube synthesis. During the synthesis procedure, the number of nanotubes which are suspended across the cantilevers is determined. In addition, their relative angle to the substrate and their actual length are defined as well. Depending on the application, it can be desired to have multiple carbon nanotubes on a single device. As the number of tubes which are suspended on the same pair of cantilevers varies, a selection regarding the desired number of tubes per trench (TPT) is required too. Hence, substrate geometries must be optimized to increase the production rate while taking effectiveness of growth, selection and assembly into account.
Growth substrates are already commercially available and do not have to be manufactured in-house. However, their use does not address large batch fabrication. As shown in [
8], only eight devices are fabricated with a growth substrate of 48 cantilevers and a cantilever pitch of 60
m.
The selection of the optimal type of growth substrate geometry can be based on a multi-criteria decision-making model [
10,
11]. The approach presented in this work, however, focuses on how the growth substrate geometry parameters affect both productivity and accuracy throughout the whole process chain, from synthesis to assembly, using simulation.
2. Productivity
The geometry of a substrate has a significant impact on the overall process efficiency. In addition to the growth parameters, the geometry of the part where the nanotubes are suspended on the substrate dictates the density of harvestable tubes. Hence, the achievable productivity is mainly characterized by these features besides the growth process requirements. Therefore, the process scheme shown in
Figure 2 is carried out. A simple simulation of nanotube growth is introduced which considers the cantilever geometries and the growth density of the CVD process. The output of this simulation yields a list of the coordinates of each transferable nanotube. Experimentally grown carbon nanotube substrates validate the proportion of harvestable tubes determined by simulations and the parameters used. The resulting tube list serves, together with the substrate geometry and trajectory parameters of the manipulator, as input for a consecutive time study. The final result is a transfer rate in transfers per hour (TPH) for a given substrate geometry that is achievable with a manipulator’s positioning performance. Furthermore, hints about the replacement rate of the growth substrate are given by the number of transferable trenches.
2.1. Simulation of Nanotube Growth and Selection
The first step that is required for the growth simulation is the substrate geometry. The simulation only considers a two-dimensional substrate geometry in order to keep the level of complexity low. The input parameters for the creation of the substrate geometry are the length
and width
of the cantilevers and their pitch
as shown in
Figure 3. With these parameters given and additional knowledge of the total substrate edge width
, sufficient information is given to create the desired substrate. As shown in
Figure 3, the resulting number of cantilevers
for carbon nanotube growth can be calculated as
After the determination of the substrate geometry the growth can be simulated. Additional required parameters for this are the maximum length of carbon nanotubes to be grown and the growth density with which they are distributed across the substrate. The growth density therefore denotes the density of the carbon nanotubes of the desired type, such as semiconducting and/or metallic.
For the sake of simplicity, it is assumed that grown carbon nanotubes are always straight and that they are defect-free. Only their length, position and orientation is required to determine the location of the cantilever pair between which they are suspended. In order to reduce computational load, the growth area of simulated nanotube synthesis is constrained to twice the cantilever length
times the substrate edge width
as depicted in
Figure 4 in light green.
The simulation considers small variations in growth density via uniform distribution and over a sample size of in total. Those affect the position and orientation of the suspended nanotubes. Larger variations in growth density resulting from experimental imperfections, however, have not been considered.
The tubes designated for transfer can be determined once there is a given substrate geometry with carbon nanotubes distributed across its cantilevers. At this step a distinction between tubes that are suspended and tubes that are not suspended is made. A tube is considered suspended if it has at least two intersections with the contour of the substrate geometry that are at least one nominal trench width () apart along the tube axis. All other tubes are disregarded.
Since multiple carbon nanotubes can be suspended on a single pair of cantilevers, it is important to categorize each trench by the count of tubes per trench . This is required in order to be able to filter the trenches later by this number, as it may be necessary to assemble devices with a specific number of carbon nanotubes.
In
Figure 4, the trenches chosen for transfer are indicated with a red “x”. It is the outcome of a filter criterion of one carbon nanotube per trench
with a maximum relative angle
. The resulting list of tubes contains an address table of all trenches to be transferred.
2.2. Time Study
With the tube list as information it is feasible to derive an expected productivity of the assembly. The result is quantified in transfers per hour (
) and is a measure of the achievable productivity with the parameters applied. It can be calculated based on the substrate geometry and trajectory parameters. Assuming an acceleration limited trajectory over a distance
D and a maximum acceleration
, the duration
for a positioning step is calculated depending on whether maximum velocity
can be reached or not. If
is true, maximum velocity
is reached. For this case the duration is calculated as
and for the case where maximum velocity
is not reached the duration is calculated as
The sequence of
X,
Y and
Z motions for one assembly cycle are taken from [
12] where the required travel distances are calculated according to the addresses in the tube list and the substrate geometry. In order to have sufficient statistical significance, the simulation is repeated
times for one type of substrate geometry. Each type of substrate geometry has
of differently distributed sets of carbon nanotubes that are suspended between the substrate’s cantilevers. From these simulation samples, an average transfer rate is calculated from the ratio of the total number of assembly cycles that have been performed and the sum of their duration. The number of trenches with the specified amount of tubes per trench
is tracked as well. This value can be associated with the frequency of growth substrate replacements.
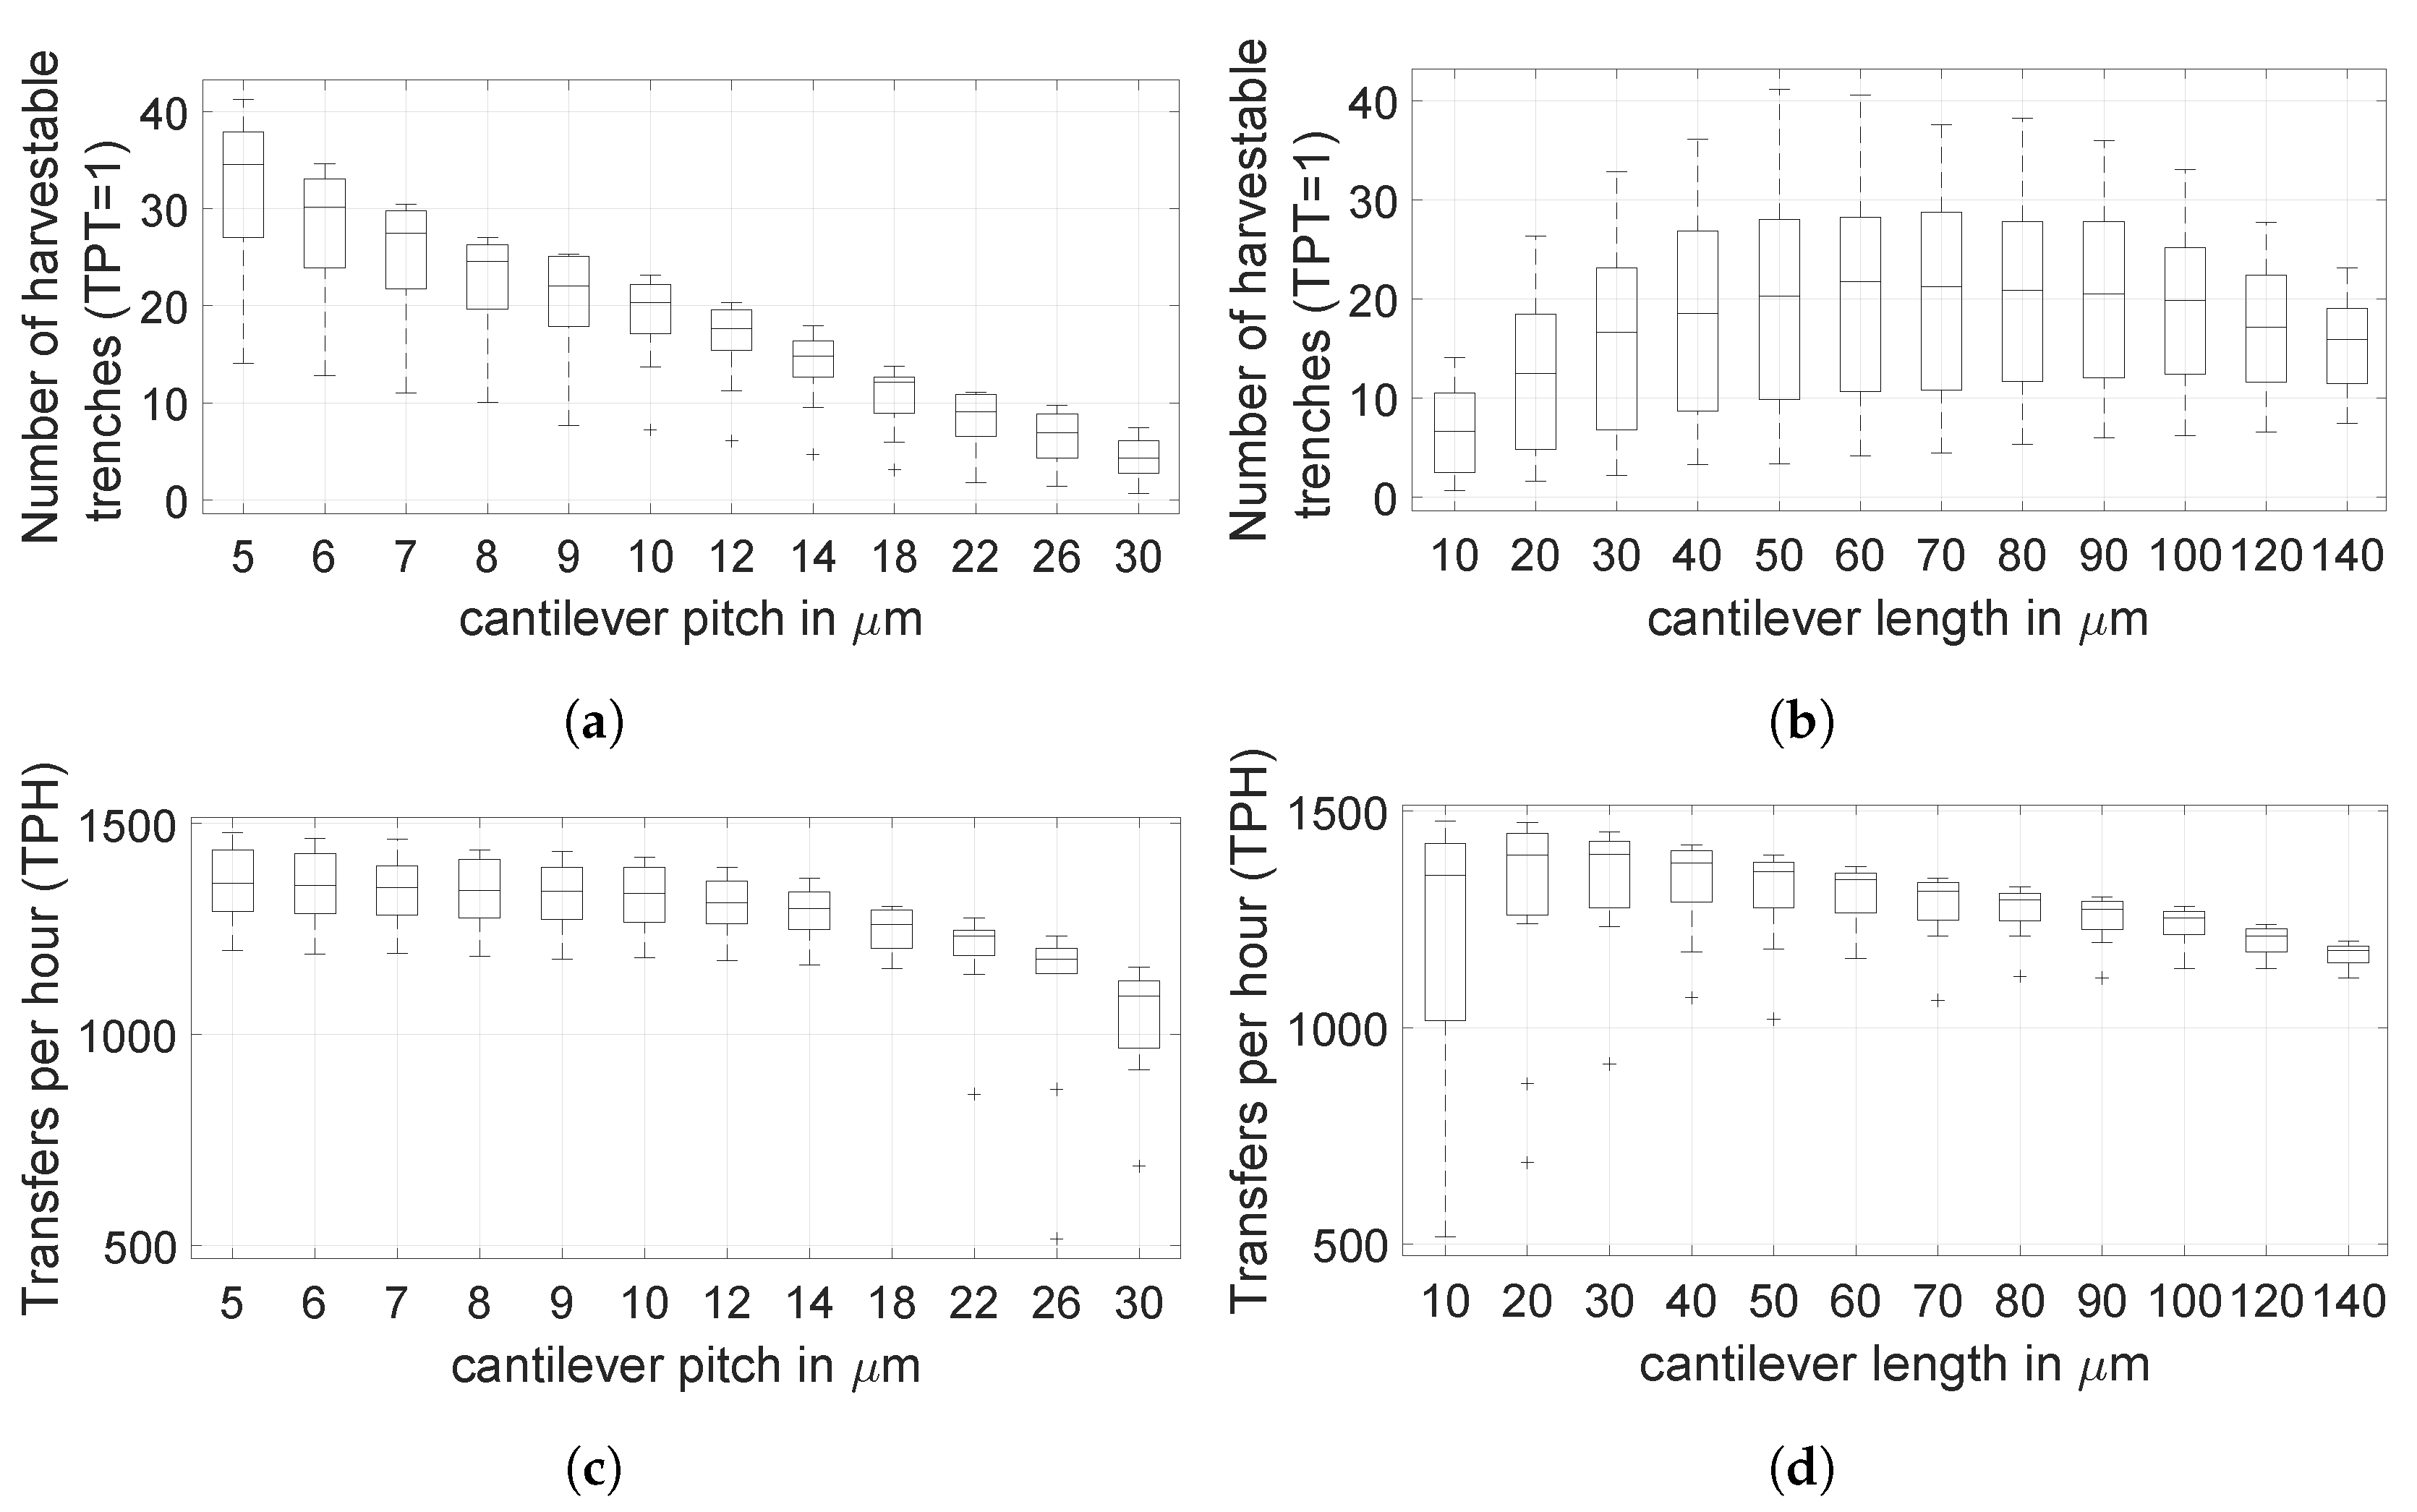
In
Figure 5, the productivity
P in terms of
and number of harvestable trenches
with
is shown over the geometry parameters of the cantilever pitch
and the cantilever length
. While the productivity in form of
only takes manipulator movements into account, the replacement rate of the substrate itself is considered by the number of harvestable trenches
. The substrates need to be replaced less frequently if the number of harvestable trenches
is high.
Conclusions from
Figure 5a,c show that substrate geometries with narrow cantilevers are preferable. The overall productivity is higher since substrates with such a cantilever geometry offer a higher trench density. This leads to a higher number of harvestable trenches
while at the same time the travel distance is shortened. In contrast, and as it can be seen in
Figure 5b,d, the cantilever length
is limited to the lower and upper end. Short cantilevers cannot suspend as many carbon nanotubes and long cantilevers suspend too many carbon nanotubes. Hence, the optimum cantilever length lies somewhere in between and depends on
and the growth parameters chosen.
The results from
Section 2 stipulate to minimize the cantilever pitch
for a maximum productivity, while adjusting the cantilever length
to a desired carbon nanotube growth. However, due to the finite accuracy of the manipulator, which has to move the growth substrate for the nanotube transfer, the cantilever pitch
is limited on the lower end.
The simulation results of the cantilever geometry used in [
8] show a median productivity of 128
for the same simulation parameters only with an adapted maximum nanotube length
= 120
m. This clearly shows the potential for optimizing growth substrate geometries for large-scale production.
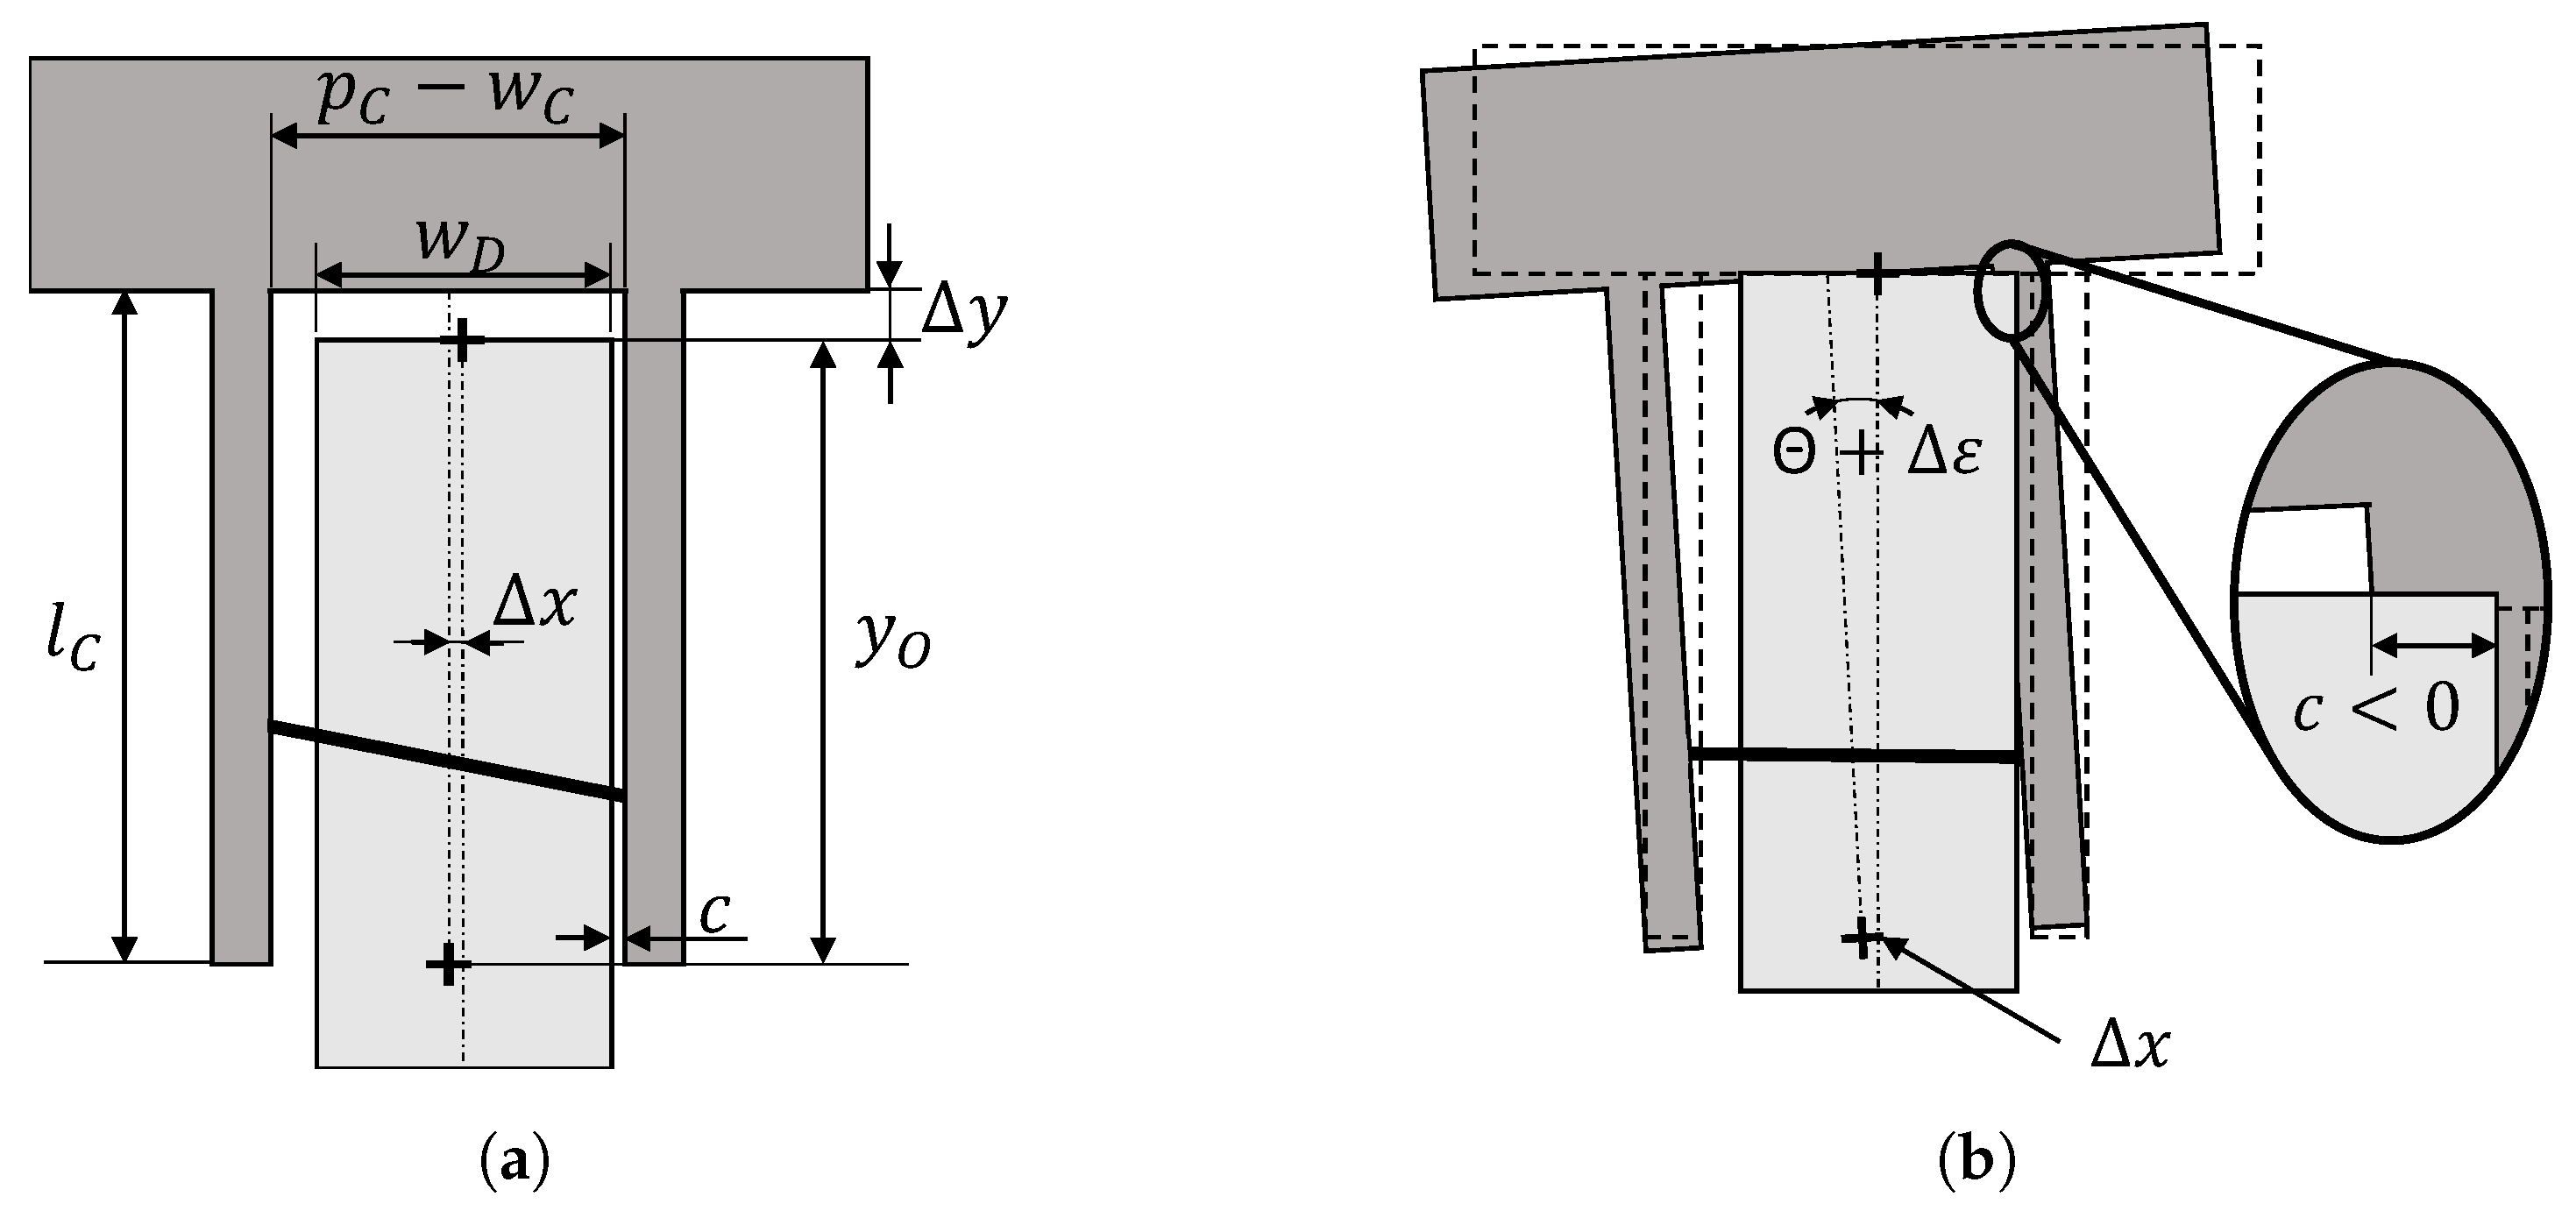
2.3. Clearance Due to Geometry and Accuracy
Figure 6 depicts the schematic trench and device geometry during transfer. The clearance
c is the horizontal minimal distance between both substrates,
is the device width and the errors
and
are the total positioning errors along the x and y coordinate axes. Those include errors from the manipulator and measurements errors, but also the error due to imprecise substrate fabrication. Depending on the application it may be desirable to manufacture devices with aligned carbon nanotubes. If this is the case the inclination angle
has to correct for the angle of the tube. The error
of
must then also be taken into account. Based on these considerations, the available clearance
c can be defined as
If the positioning and preparation of the growth substrate is inaccurate, the transfer of carbon nanotubes becomes less efficient and less reliable, as the probability of collisions between the two substrates is higher. With a comparison of coefficients in Equation (
5), it can be seen that
impacts clearance the most. The angular deviation
and the deviation in
are rather uncritical. However, if those deviations are underestimated, it becomes apparent that the two substrates are likely to crash with another. Depending on the magnitude of error, it can happen such that only individual cantilevers break off or even the whole substrate.
As collision must be avoided at all times,
c must in any case be greater than zero. It is not required to have an overlap
equal to the full length
for a successful transfer. Hence, the clearance along the y direction is chosen such that it is equal to the maximum expected error
. However, the number of harvestable trenches
decreases proportionally with
as carbon nanotubes located deeper in the trench cannot be reached. The consequence is a productivity reduction (TPH) by a factor of
.
With a more precise manipulator and accurate substrate fabrication, can be increased because of a smaller error margin .
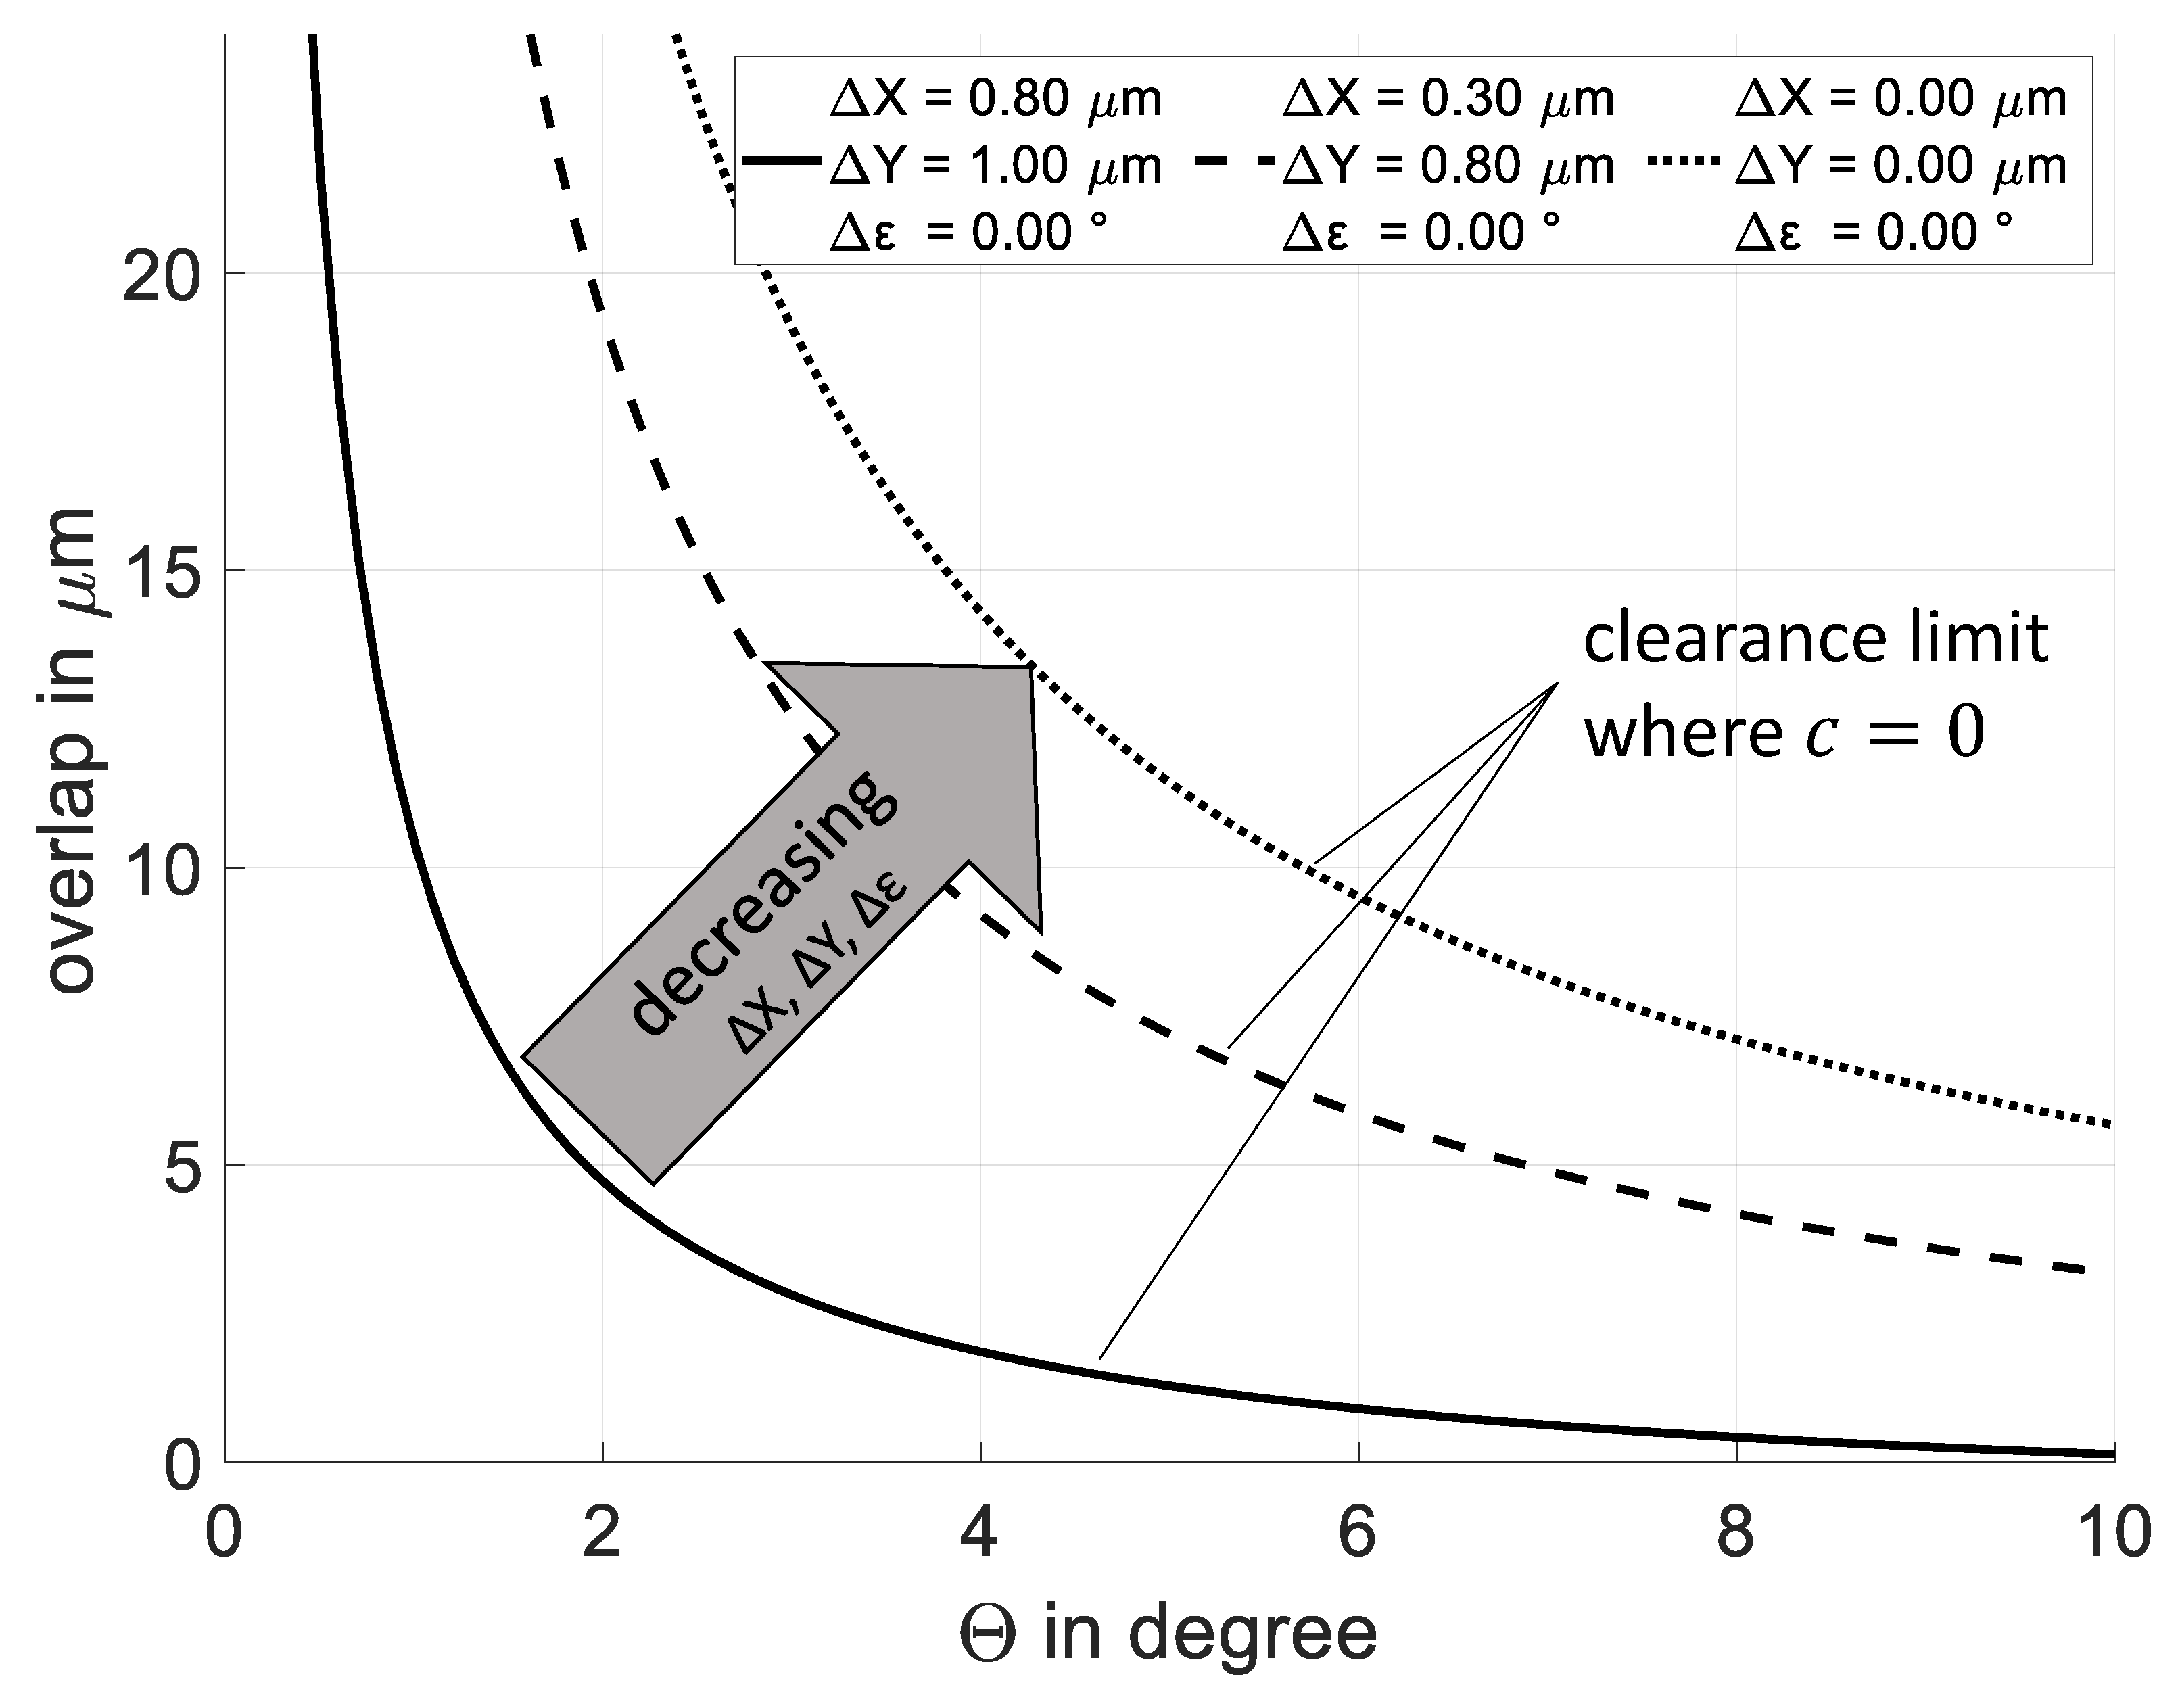
For the case of automatized carbon nanotube assembly, where device after device is approached like in
Figure 6, the overshoots have to be taken into account. In [
12], the average overshoots
and
for a parallel kinematic micromanipulator are 0.3
m for the x axis and 0.8
m for the y axis, respectively. Assuming perfect substrate fabrication and negligibly small measurements errors, it can be concluded that
and
. Following this assumption, a family of curves, as in
Figure 7, shows the transfer parameters overlap
over
where the clearance
.
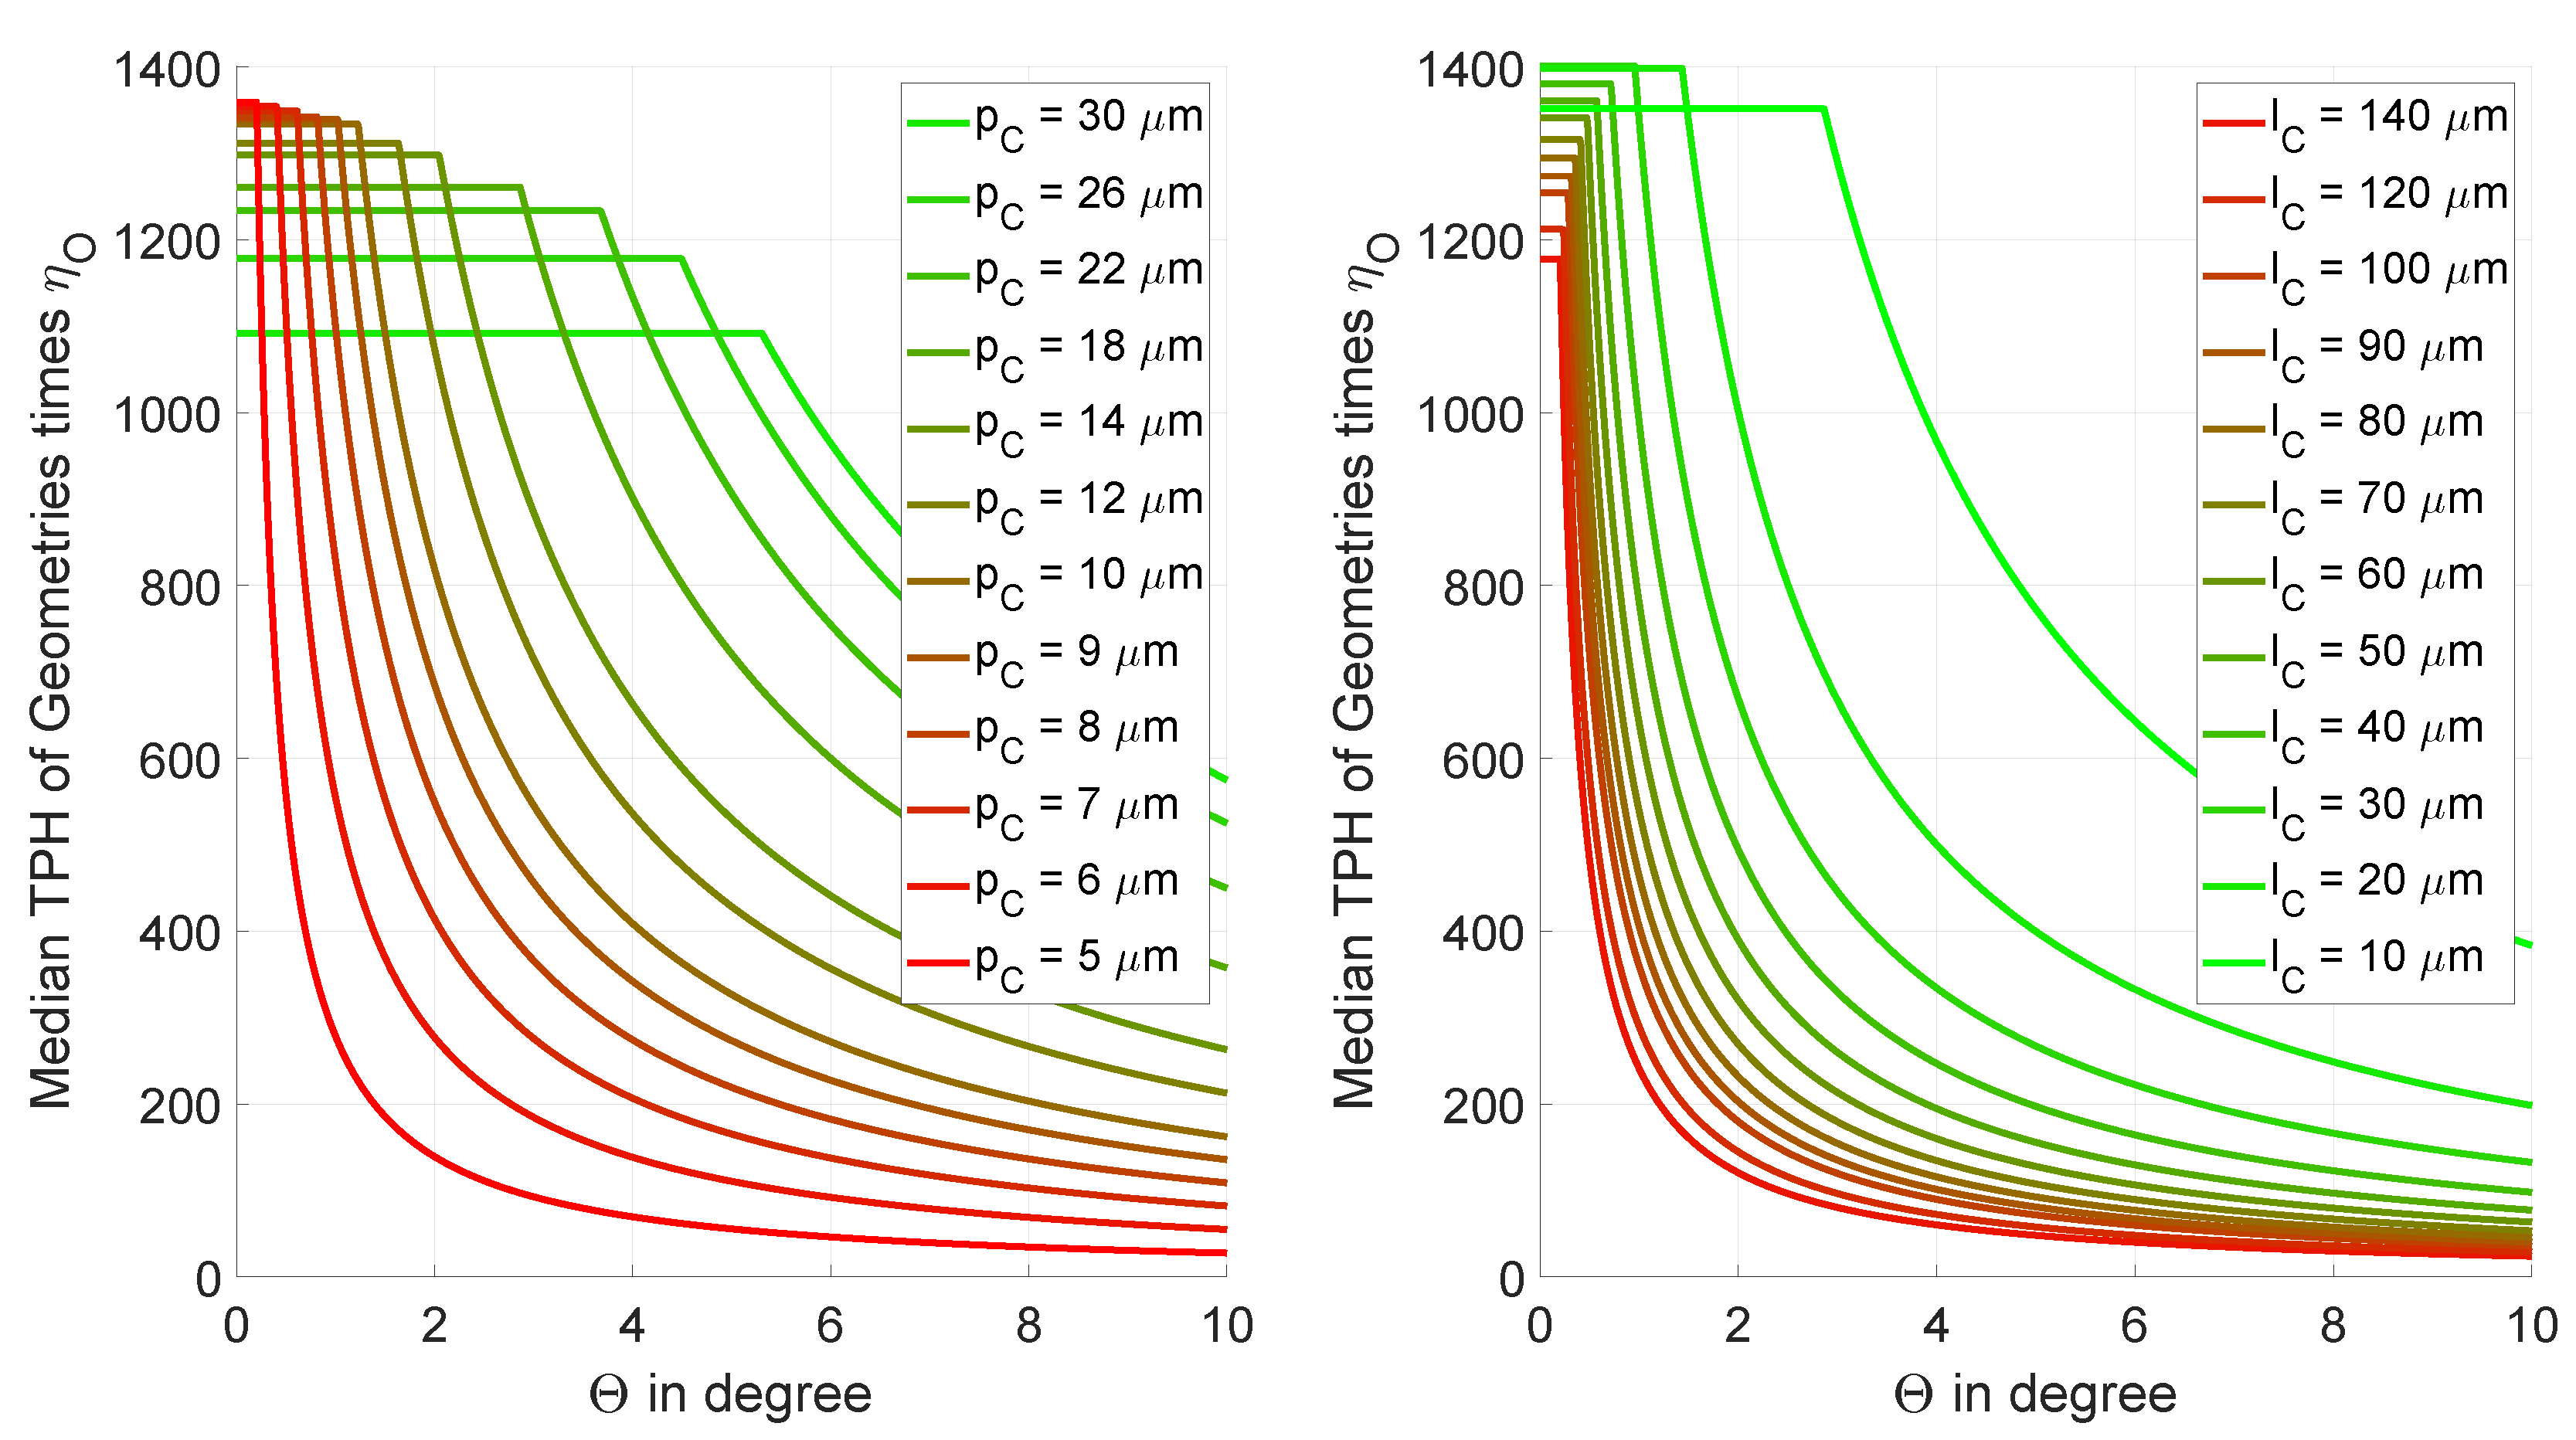
2.4. Implications to Productivity
Analogous to
Figure 7, the accuracy and the substrate geometry affect the maximum possible overlap
. The maximum possible overlap for a given accuracy and geometry can be calculated by inserting
in
As it can be seen from Equation (
6),
is also a function of
and the cantilever length
. Since the different geometry affects productivity (TPH) and the overlap factor
alike, the cantilever geometries need to by chosen according to
in
Figure 8 for the desired overlap to reach maximum productivity.
Considering the geometric accuracy constraints from Equation (
5), it is apparent that for
, the total error
shows the highest sensitivity for a given substrate geometry. Therefore,
, which is the sum of the individual errors of overshoot
, static positioning of the axis
, substrate fabrication
and re-referencing
, must be kept low by machine design or tight fabrication tolerances. Otherwise, re-referencing of relative substrate positions or mapping is required. With re-referencing, the relative distance between the two substrates can be measured very close to the tool center point by optical means and thus allowing an appropriate compensation. However, this approach can also lead to an error
, which must be taken into account.
As the accuracy demands to the x axis is more crucial, the overshoot error should be targeted to be minimized first. This means damping plays an important role, but also the moved masses, which affect the eigenfrequencies, take substantial influence. To reduce the moved mass of the x axis, it is placed on top of the axes stack.
3. Design for Automation
With the introduction of fully automated assembly, it is either required to choose a substrate geometry which offers sufficient tolerance or add a re-referencing mechanism to compensate for position errors. Beyond that, the number of harvestable trenches is the decisive parameter for the frequency of substrate exchanges. The higher their number, the less frequent substrate exchanges are required. On top of cantilever geometry optimization, substrates with multiple edges can be introduced to decrease the required time until an exchange. This enhances the time a substrate can be used but also requires an additional rotation axis. Therefore, the total duration of the positioning motion has to be considered for an additional axis with its jerk, acceleration, velocity, travel distance and settling time. Based on this consideration, the number of substrate edges has to be optimized for a corresponding rotation axis. Since the substrates are of polygonal shape, the circumcircle diameter d can be chosen as their size factor. Increasing the number of harvestable trenches by increasing the diameter d of the growth substrate would reduce the total number of substrates that can be produced in one batch. Furthermore, as the diameter of the growth substrate increases, the distance between the axis of rotation and the tool center point increases, resulting in a longer settling time and worse accuracy.
The number of substrate edges
influences the edge width
and the angular travel distance to bring the next edge into position.
The value of
can also be calculated after Equation (
1) with the number of cantilevers per edge
and their respective geometry parameters
and
.
As shown in
Figure 9, the diameter
d of the circumcircle is selected as a constant in order to make substrates of different shapes comparable to another. Continuing from this assumption, the procedure described in
Section 2 is carried out for all substrate edges. Additionally, trajectory parameters and the settling time of a rotation axis are added to the assessment. The parameters for nanotube growth are not changed to be able to compare it to the results from
Section 2.
If Equations (
8) and (
9) are combined, the relationship between the number of edges
and the number of cantilevers
can be written as
Equation (
10) points out the inverse relationship between the number of edges
and the number of cantilevers per edge
. At one point while increasing the number of substrate edges
the number of trenches, which is the number of cantilevers
, will become zero and nanotubes could only be suspended across substrate edges. However, for practical reasons, like maintaining parallelism between cantilevers, this case is avoided in consequent investigations. With the condition that the number of cantilevers per substrate edge
, the upper limit of the number of substrate edges
can be calculated for a certain geometry.
According to Equation (
10), the number of cantilevers per edge
scale linearly with the circumcircle diameter
d. Hence, the number of harvestable trenches
also scales with this diameter, since the nanotube distribution is uniform. This allows one to approximate the average number of harvestable trenches
for one edge and to assume that each substrate edge has a similar number. This effectively eliminates the time-consuming simulation of growth and selection for each individual edge.
Figure 10 exemplarily shows the influence of the different number of substrate edges
and the trajectory parameters of the rotation axis onto productivity. The substrate design in terms of number of edges
can be assessed by its required median exchange frequency
. This value is the quotient of the median transfers per hour
and the median number of trenches
.
In
Table 1, the median exchange frequency
indicates how many times the substrate must be exchanged per hour for continuous production. Taking the average required exchange time
per whole growth substrate into account, the median effective productivity
can be calculated as
Taking an average required exchange time
of 2 min into account, the preferable number of substrate edges
would be 1007 according to the values from
Table 1. This example is, however, only valid for the rotation axis with its chosen trajectory parameters and settling time. As depicted in
Figure 11, a change in these parameters could cause a shift of the optimum substrate geometry with another number of edges
. A prototype of an assembly machine verifies the movement parameters used for the simulation and leads to a comparable effective productivity if overhead time is excluded. The proposed growth substrate design for automation already considers positioning-related factors, and a proof of concept has successfully been demonstrated. However, for future industrial utilization it is necessary to also consider the Mean Time Between Failure (MTBF) of various components to assess effective productivity.
4. Conclusions
The productivity of the mechanical dry transfer of carbon nanotubes from a growth substrate to a device substrate relies on the cantilever geometry. While the length of the cantilevers must be adjusted to the growth of the nanotubes and the desired number of tubes per trench, the cantilever pitch must be reduced to achieve the maximum productivity.
However, as positioning errors are present at all times, the cantilever pitch is limited on the lower end. With the total errors decreasing, higher device-trench-overlaps at higher angles can be achieved. This leads to an increase in the number of harvestable tubes and thus to a less frequent exchange of substrates. Furthermore, it is shown how the overlap factor affects the median transfer speed for various angles and cantilever pitches and lengths.
By adding a rotation axis, it becomes feasible to use substrates with multiple edges. This approach of increasing the total number of harvestable trenches leads to less frequent substrate exchanges. The analysis of the number of these edges shows that, depending on the trajectory parameters and the settling time of the rotation axis, the optimum number of substrate edges can be selected in order to reduce the substrate exchange frequency. Consequently, productivity is significantly amplified and also cost-effectiveness of the assembly process is improved. However, with each additional axis, system complexity increases. Therefore, the machine design with its configuration of axes must be considered already at early design stages when the required assembly motions are known.


