Article

Investigation of Heat Transfer Performance in Deionized Water–Ethylene Glycol Binary Mixtures during Nucleate Pool Boiling

1
School of Naval Architecture, Ocean and Energy Power Engineering, Wuhan University of Technology, Wuhan 430070, China
2
Yazhou Bay Innovation Institute, Hainan Tropical Ocean University, Sanya 572022, China
*
Author to whom correspondence should be addressed.
Processes 2024, 12(2), 368; https://doi.org/10.3390/pr12020368
Submission received: 14 January 2024 / Revised: 3 February 2024 / Accepted: 5 February 2024 / Published: 10 February 2024
(This article belongs to the Topic Applied Heat Transfer)

Abstract

:
Pool boiling heat transfer is recognized as an exceptionally effective method, widely applied across various industries. The adoption of non-azeotropic binary mixtures aligns with the environmental objectives of modern industrial development and enhances the coefficient of performance (COP) in numerous systems. Therefore, investigating the boiling heat transfer characteristics of these mixtures is crucial to improving their industrial usability. In this study, mixtures of ethylene glycol and deionized water (EG/DW) in varying concentrations were chosen as the working fluids. A comprehensive experimental setup was developed, followed by a series of experiments to assess their pool boiling performance. Simultaneously, the thermophysical parameters of these mixtures underwent detailed examination and analysis. The research revealed that the concentration of EG in the mixture markedly affects its thermal properties and temperature glide, both of which are crucial in influencing the heat transfer coefficient. Additionally, six established heat transfer coefficient prediction correlations, primarily designed for pure fluids, have been employed. However, their application to non-azeotropic mixtures under experimental conditions revealed significant deviations. To address this issue, the present study modified existing correlations with the temperature slip characteristics of non-azeotropic mixtures. This process involved recalibrating the wall superheat values in the correlations to reflect the local temperature differential at the boiling point, thereby customizing them for application to non-azeotropic mixtures. The modified correlations highlighted the unique behaviors of non-azeotropic mixtures in boiling heat transfer, demonstrating improved compatibility with these mixtures in a deviation within a permissible 20% range compared with experimental results.

1. Introduction

Boiling heat transfer, and more specifically, phase change boiling heat transfer, is a critical mechanism for heat dissipation in the advancement of industrial technologies. This topic has been extensively explored by numerous researchers [1,2,3]. With the evolution of compact heat dissipation devices, such as microchips, the quest for enhancing heat transfer efficiency has emerged as a prominent research area within the field of boiling heat transfer. Central to this area of study is the heat transfer coefficient (HTC), which is fundamental to our comprehension of efficient boiling heat transfer. A higher HTC at a given heat flux implies the requirement for a smaller heated surface area.
Historically, research has predominantly concentrated on the enhancement of heat transfer using pure working fluids. Peng et al. [4] enhanced the HTC by up to 29.7% by incorporating CuO nanoparticles into the R113 refrigerant. Similarly, Xu et al. [5] observed an increase in the HTC of acetone when using a foam-coated heated copper rod, despite variations in the foam’s pores per inch. Tang et al. [6] investigated the use of porous interconnected microchannels for pool boiling heat transfer enhancement, resulting in a significant increase in the HTC of deionized water. Suriyawong et al. [7] conducted experimental analyses on the heat transfer characteristics of water mixed with TiO2, achieving a 15% increase in HTC compared to the base fluid. Further contributions by Mohammed et al. [8,9,10,11] encompassed both experimental and numerical studies on the boiling performance of different refrigerants and nanofluids in tubes with various characteristics, leading to various degrees of improvement in boiling performance.
In the past two decades, there has been a marked shift towards the use of more environmentally friendly working fluids [12]. This trend is largely driven by the increasing energy demands associated with reducing carbon emissions, a challenge that traditional pure working fluids struggle to meet. Additionally, the suboptimal thermal performance of pure refrigerants with low Global Warming Potential (GWP) presents a significant area of concern [13]. To address these issues, mixed refrigerants are being recognized as a potent alternative to conventional working fluids. These mixtures not only help in reducing the GWP but also capitalize on the benefits derived from each individual component [14]. A key advantage of mixtures lies in their tunable chemical and thermophysical properties. By carefully selecting and adjusting the concentration of each component in the mixture, it is possible to intentionally modify the overall characteristics of the mixture. For instance, the phase change temperature, physical properties, or ignition point of the mixture can be altered by varying the proportion of its constituents, while maintaining constant pressure. Consequently, mixed working fluids offer a high degree of customization, allowing them to be tailored to specific operational requirements.
During the boiling of mixed working fluids, components with lower boiling points vaporize more quickly than those with higher boiling points. This leads to a gradual increase in the concentration of higher boiling point components in the remaining liquid, which causes an increase in the boiling temperature. This phenomenon, known as temperature slip, occurs when the saturation temperature changes under constant pressure. Binary mixtures are classified into two types based on the degree of temperature slip: azeotropic and non-azeotropic. Azeotropic mixtures maintain a constant boiling point and composition during boiling, acting like a single substance. In contrast, non-azeotropic mixtures show a varying boiling point and composition due to the different volatilities of their components. This classification is important for determining the effectiveness of these fluids in heat transfer applications.
The substantial temperature glide in non-azeotropic mixtures can significantly mitigate or even prevent the burning out of cooling media. This characteristic has crucial implications for the cooling of electronic component equipment, particularly in scenarios demanding high heat flux dissipation within a small area. Additionally, the temperature glide attribute of non-azeotropic mixtures during constant pressure phase change can effectively reduce irreversible losses in heat exchangers, such as evaporators and condensers. This is attributed to the reduced temperature differential between the inlet and outlet.
In their study, Markmann et al. [15] utilized a natural ammonia/water pair to optimize a 50 kW hybrid absorption–compression heat pump. The simulation results indicated a maximum Coefficient of Performance (COP) of 2.5. Vorster et al. [16] conducted a comprehensive investigation on heat pumps using various mixtures, including 34 pure refrigerants and 31 non-azeotropic binary mixtures at different concentrations. Their findings highlighted that numerous non-azeotropic refrigerant mixtures yielded higher COPs compared to pure refrigerants. Zhang et al. [17] also explored heat pump systems employing non-azeotropic refrigerant mixtures. Their experiments demonstrated that these mixtures not only achieved higher COPs but also exhibited enhanced discharge temperatures and increased heating capacities relative to pure working fluids.
While mixed refrigerants offer several advantages in industrial applications, it is important to note that their heat transfer coefficients (HTCs) can exhibit varying degrees of degradation compared to pure refrigerants, primarily due to the temperature glide characteristic. For instance, an observed decrease in HTC was noted with increasing concentrations of LiBr. FUJITA et al. [18] measured the HTC of various binary mixtures, including methanol/water, ethanol/water, methanol/ethanol, ethanol/n-butanol, and methanol/benzene. They found that the boiling heat transfer performance of these mixtures was significantly lower than that of their pure components. Similarly, Jung et al. [19] investigated the HTC of new refrigerant mixtures like HFC32/HFC134a, HFC125/HFC134a, and HFC32/HFC125 in different compositions, revealing up to a 40% degradation in HTC. Gong et al. [20] conducted visualization experiments to study the nucleate pool boiling heat transfer characteristics of ethane, isobutane, and their binary mixtures. Their findings indicated a considerable reduction in the HTC of the mixture. The authors identified the key factor behind this reduction as the mass transfer resistance between different components, which is related to the viscosity of the components in the mixtures.
Despite the extensive research on mixed refrigerants, the existing literature provides a limited analysis of how the volume concentration of components affects mass transfer resistance. While numerous studies have been conducted, this aspect remains under explored. In a comprehensive review of nucleate pool boiling in binary mixtures, Gupta et al. [21] emphasized that the preferential evaporation of lighter components significantly impacts the bubble dynamics during boiling. They also posited that the vapor–liquid equilibrium between components is a crucial factor in the boiling process of binary mixtures. Understanding the thermophysical characteristics of the solution is key to gaining insight into the interactions between its components. This area warrants further investigation to develop a more comprehensive understanding of the boiling behavior and heat transfer characteristics of binary and other multi-component mixtures.
In summary, binary non-azeotropic mixtures present several advantages including improved thermodynamics, economic benefits, and environmental friendliness. However, they also exhibit varying degrees of reduction in boiling heat transfer coefficients, which is a notable limitation in their application. This study focuses on ethylene glycol/distilled water (EG/DW) as the experimental working fluid, examining the effects of EG concentration changes on boiling performance through pool boiling experiments. Six existing HTC prediction correlations were applied to analyze the experimental data.
A significant challenge in studying these mixtures is the initial evaporation of volatile components during boiling, which changes the gas–liquid concentration and complicates the determination of the gas–liquid equilibrium interface, component concentration, and saturation temperature. To address this, a new method combining wall superheat determination with experimental techniques was developed, leading to an improved HTC prediction formula. This method is simple and accurate, offering practical guidance for using binary non-azeotropic mixed working fluids. The predictive approach enables the quantification of HTC deterioration in the selected working fluid and helps determine its acceptability for industrial applications. This ensures the effective and efficient use of these mixtures in various settings.

2. Experiments

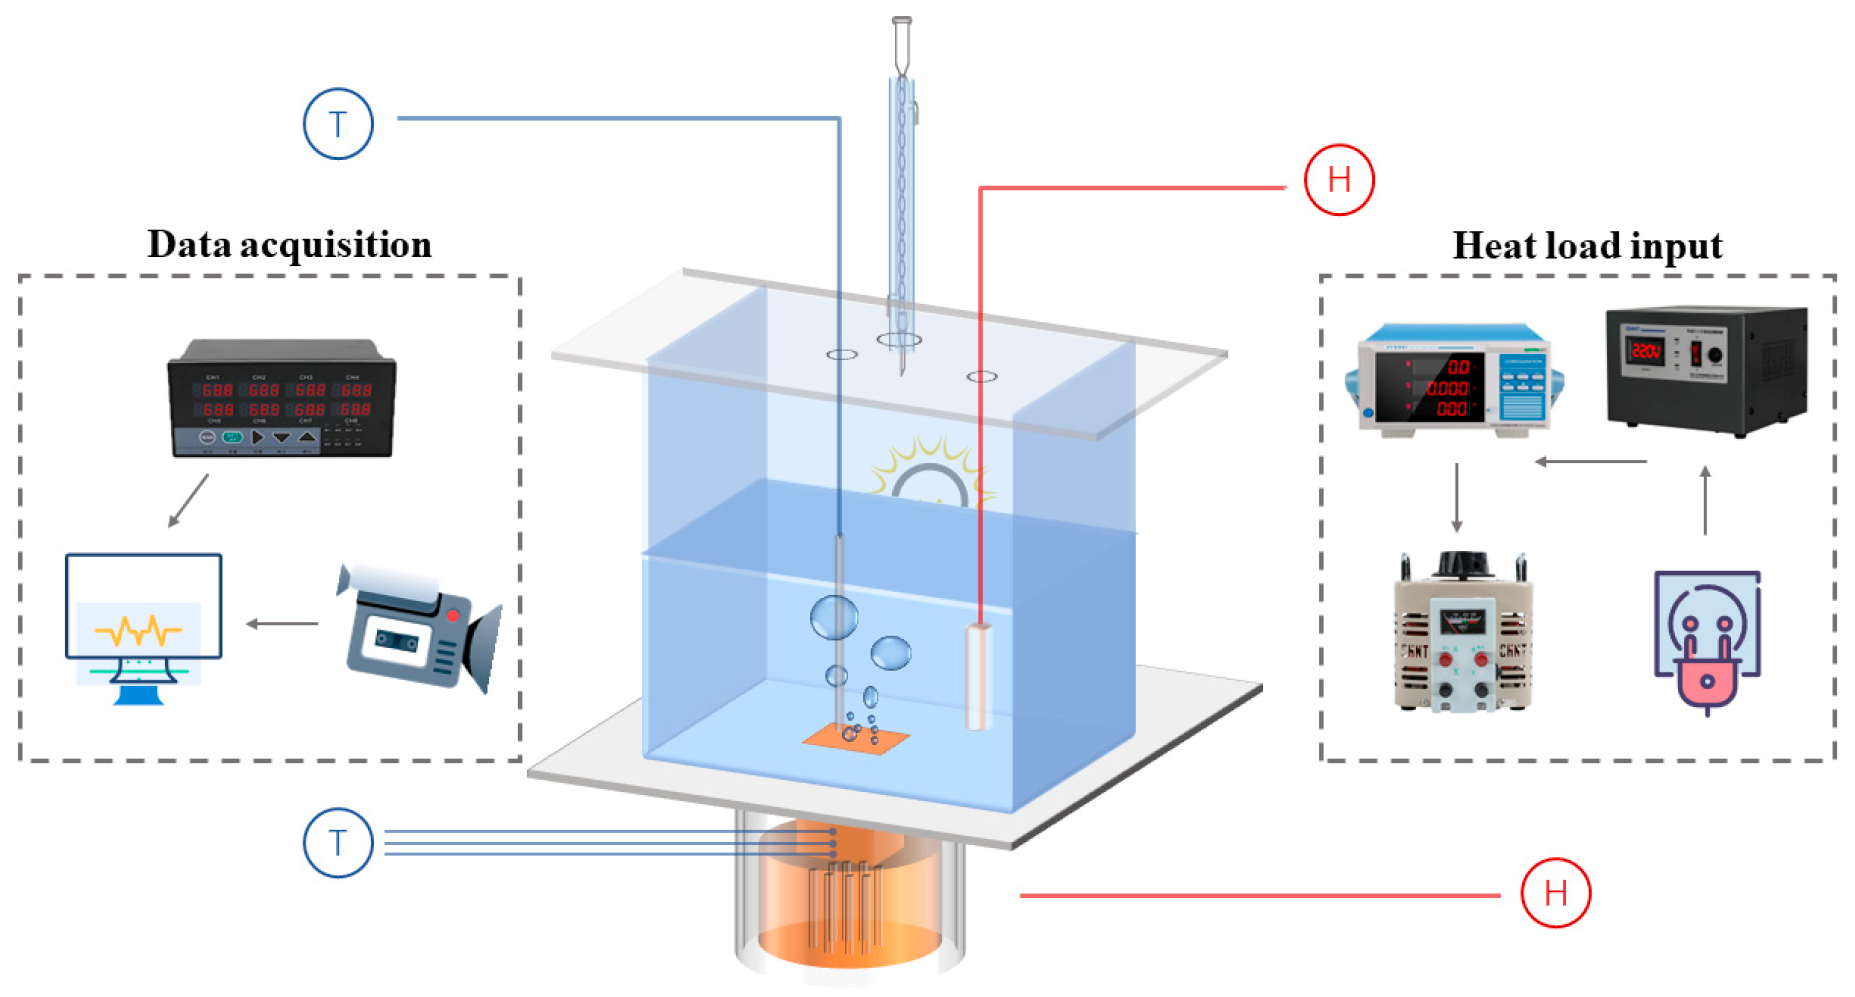
2.1. Experimental Apparatus and Procedure

An experimental setup was designed to investigate the pool boiling heat transfer performance of non-azeotropic mixtures, as shown in Figure 1. The heat load input system uses a voltage regulator to stabilize the input current while connecting to the voltage regulator, ensuring that the heating temperature increases steadily with the input heat flux density. At the same time, the input values are displayed on the power meter to ensure experimental safety and stability.
The heat load is input to an integrated heating column connected to the bottom of the reaction vessel through 7 heating rods. The heating column is made of red copper, which has characteristics of fast thermal conductivity, high-temperature resistance, and uniform heating. Below the heating surface of the copper column, there are three insertion points to place K-type thermocouples for temperature collection, with a spacing of 12 mm between each point. At the same time, high-temperature insulation cotton and polytetrafluoroethylene board are wrapped externally to prevent heat loss.
The boiling reaction vessel is a square container made of 5 mm thick high borosilicate glass, with an external size of 10 × 10 × 10 cm3. The selection of high borosilicate glass is due to its high physical strength and fire resistance, making it more suitable for high-temperature experiments compared to ordinary glass. At the same time, observation ports are left on both sides of the glass container, which not only clearly display the bubble behavior during boiling, but also facilitate the use and adjustment of light sources at any time.
To ensure that the accuracy of the experiment will not be affected by changes in saturation pressure in the reaction vessel during boiling, the glass reflection cover above the vessel is connected to the condenser pipe and the external circulating water pump, and cooling is carried out at all times during the experiment. In addition, the glass reflective cover above the container is also connected to a specially designed high-temperature and corrosion-resistant heating rod for preheating before boiling the working fluid. A K-type thermocouple is placed 2 cm above the heating surface to measure the saturation temperature during boiling.
Except for the observation ports, the rest sides of the vessel are wrapped in high-temperature insulation material. The externally mounted ceramic electrically controlled temperature regulating heater is used as an auxiliary insulation system to ensure stability during boiling inside the container. A digital display recorder was used to connect all K-type thermocouples to collect temperature information, which has built-in software to monitor temperature changes. The recorder also is connected to the computer and uses Matlab 2016 software to process temperature data in real time.
Before the experiment began, the heated copper surface was polished with 600 #, 800 #, and 2000 # sandpaper. Then, a polishing machine was used for secondary polishing, followed by careful scrubbing with copper detergent and deionized water. Placing experimental thermocouples and high-temperature mercury thermometers in the thermal oil, and heating the thermal oil to increase the mercury thermometer by 5 °C until 200 °C each time. At the same time, the temperatures of thermocouples are recorded with the digital display recorder. Then, the temperature data will be liner fitted by calculate software so that the temperature sensor can be rectified using the least squares method.
Firstly, inject a certain amount of experimental working fluid into the glass container to ensure that it is higher than the preheating rod, and seal the container. Mark the height of the liquid level surface to ensure the repeatability of the experiment, and leave it for 1 h to check the sealing of the container. Next, turn on the power control system, give an initial power (usually 10 W) to heat the working medium, and use a preheating heating rod to preheat the working medium in the container to saturation temperature to remove insoluble gases from the working medium. Wait for the working fluid temperature to approach the saturation boiling temperature, then open the data acquisition system for temperature recording and image recording. Subsequently, turn on the condensing device and auxiliary heating system, gradually increase the power value, and wait for the temperature sensor value to change less than 1 °C within 5 min before gradually increasing the heating load until it approaches the critical heat flux density.

2.2. Data Reduction

Due to the integrated design of the heating rod, the rapid and uniform overall heat transfer characteristic of red copper makes the entire heat transfer process of the heating surface regarded as one-dimensional steady-state heat conduction. By combining the real-time temperature values measured by the copper columns with Fourier’s law, the heat transfer coefficient can be calculated as the following equation.
h = q / Δ T
q = λ [ ( T 3 T 1 ) / ( ε 3 ε 1 ) + ( T 2 T 1 ) / ( ε 2 ε 1 ) + ( T 3 T 2 ) / ( ε 3 ε 2 ) ] / 3
T = T w T s a t
In the equation, Ti (i = 1,2,3) is the temperature at the corresponding measurement point of the thermocouple, and ε is the distance between the corresponding measurement point and the top heating surface. Tw is the temperature of the heated surface, which is also calculated as one-dimensional steady-state heat conduction:
T w = i = 1 2 [ T i δ ε i ( T i + 1 T i ) ] / 2 δ
where δ is the distance between two measurement points.
Tsat is the saturation temperature of the liquid, which is measured by the thermocouple above the heated surface. Because the two components of the non-azeotropic mixture have different boiling points, the saturated temperature of the mixture is influenced by the fraction of EG. λ is the thermal conductivity of the heating rod, which is associated with the heated surface temperature:
λ = 4.1631 5.904 × 10 4 · T w + 7.0872 × 10 5 / T w 3 .

2.3. Uncertainty Analysis

Heat flux could be calculated through input heat load as the following equation [22]:
q / A = I · V · cos φ
cos φ is the error caused by the solenoid effect in the heating part, which can be seen as 1 since the voltage regulator used in this article.
The instrument will be calibrated before each experiment, and each experiment will be repeated 2–3 times. Therefore, random uncertainty brought about by the experimental process could be ignored, and the uncertainty was calculated based on the instrument measurement error range provided by the manufacturer’s documents, as follows:
q / q = ( I / I ) 2 + ( V / V ) 2 1 / 2
T = T 2 + T K 2 1 / 2
T K = 1 / n i = 1 n T K , i
h / h = [ ( I / I ) 2 + ( V / V ) 2 + ( T / T ) 2 ] 1 / 2
TK is the average measurement value of thermocouples. Based on the measurement data, the parameter range and calculation uncertainty of experiments are listed in Table 1.
In order to verify the reliability of the experimental system, widely studied deionized water was selected for pool boiling experiments, and the experimental results were applied to the Rohsenow [23] equation for comparison:
c p · T / h f g = C s f { q / μ · h f g [ σ / g · ( ρ l ρ v ) ] 1 / 2 } 0.33 ( c p · μ / λ ) n .
Csf is the empirical constant of heat transfer between solids and fluids, which is 0.013 for water and smooth plane. Comparing the experimental results with the calculated heat flux, as shown in Figure 2, it can be found that the deviations are all within 10%, indicating the reliability of the experimental bench.

3. Results and Discussion

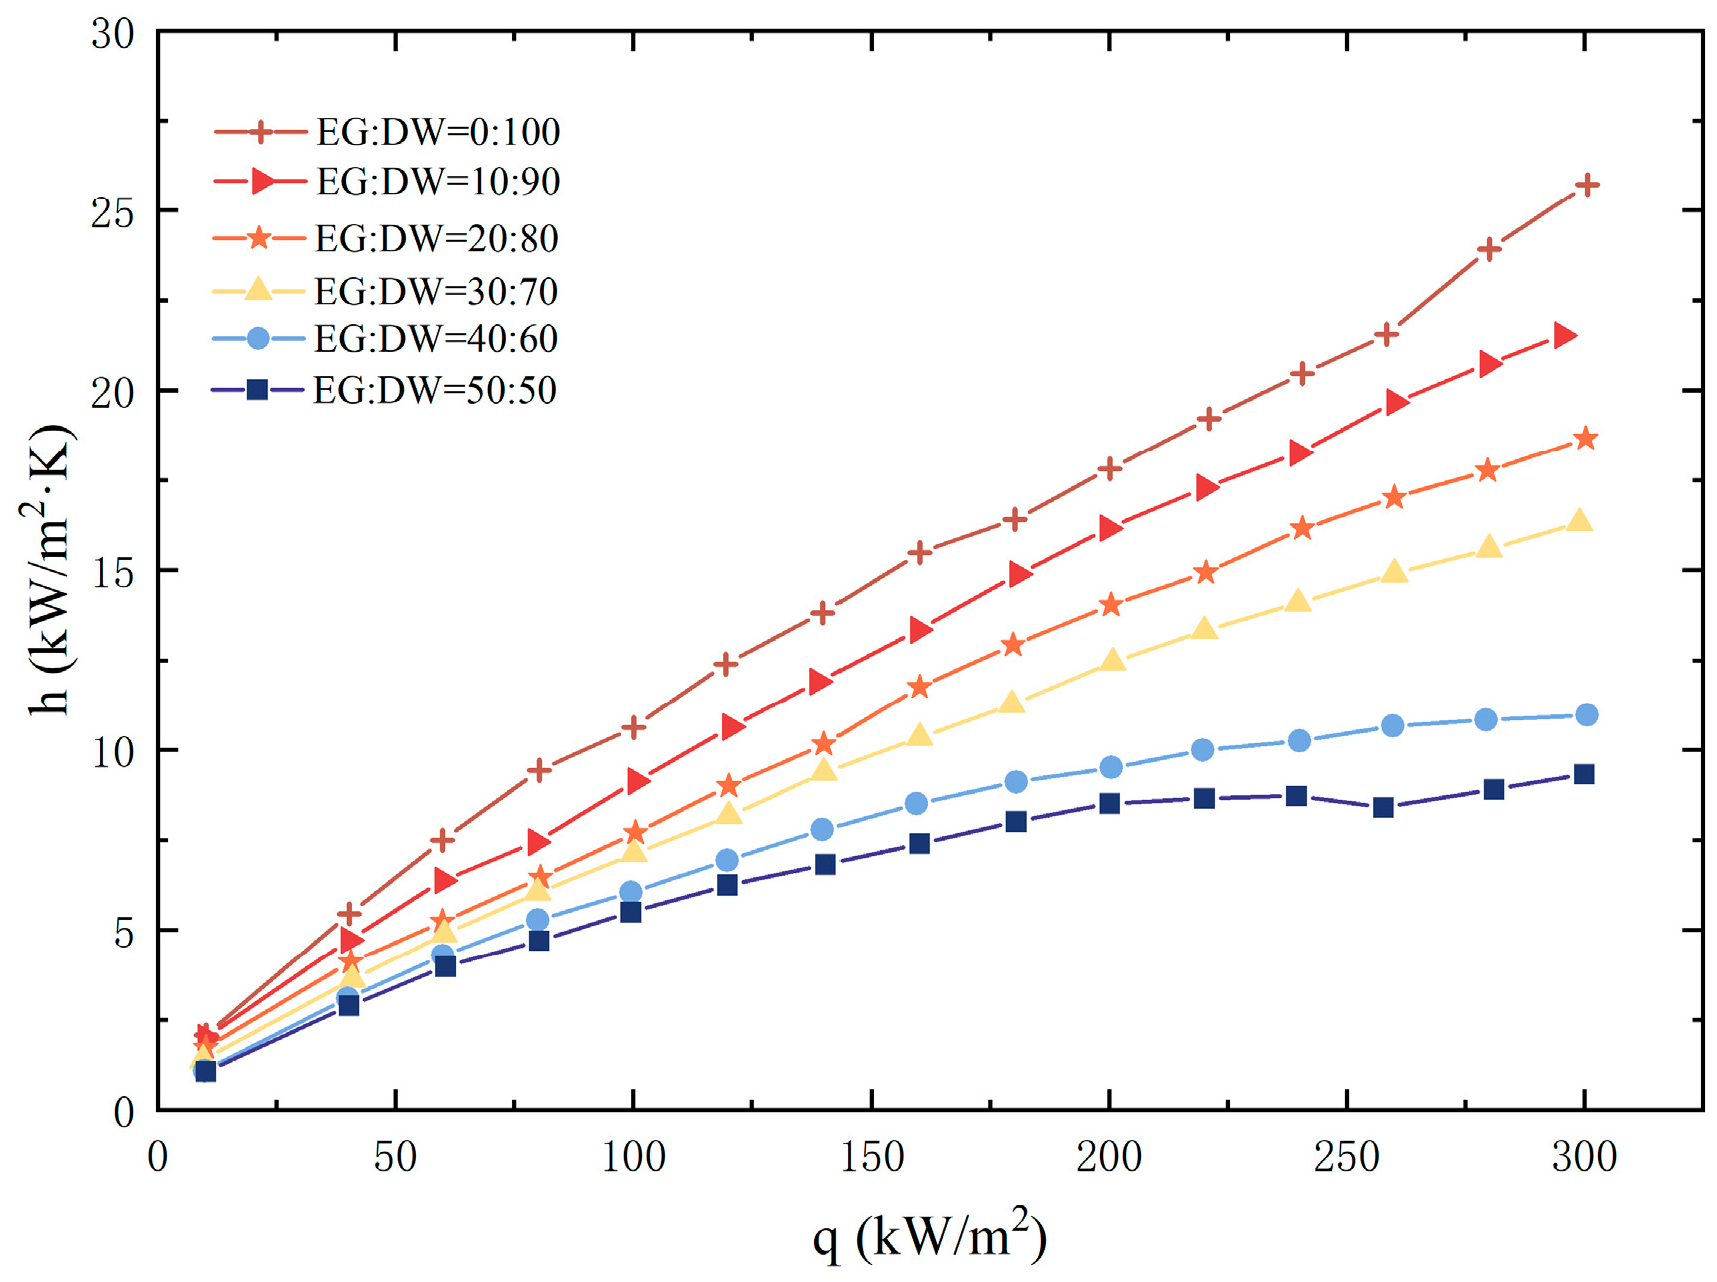
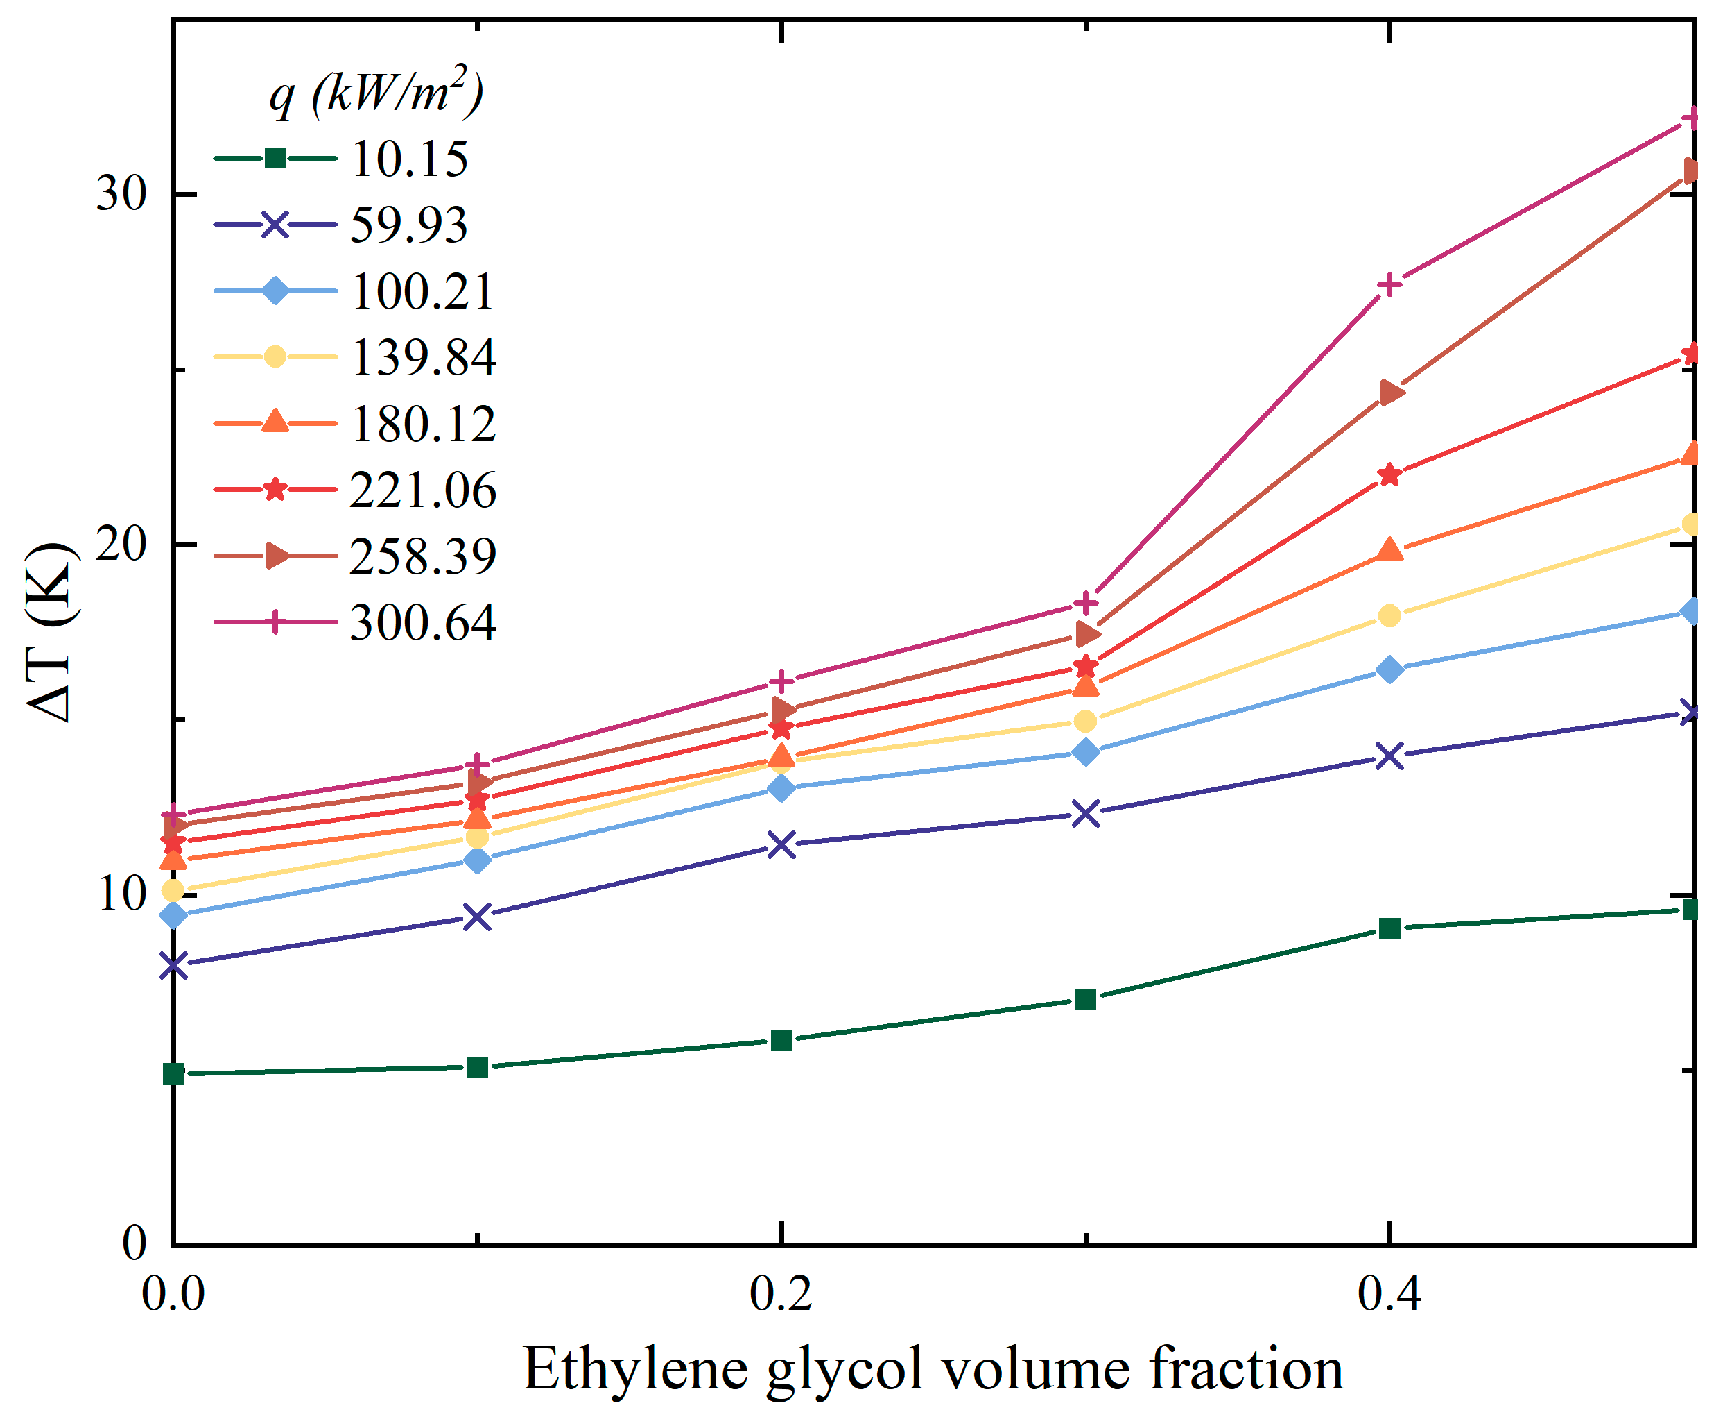
3.1. Pool Boiling Heat Transfer Performance

The pool boiling performance of the EG/DW non-azeotropic mixture is shown in Figure 3. It could be seen from the figure that for the same heat flux, the HTC of the mixture decreased with the growth of EG concentration. What is more, the decrease sharply grew when heat flux increased. When the EG weight fraction was 10%, the difference of HTC between DI water and the mixture was near 2 as the heat flux was 100 kW/m2, although this difference became higher than 5 when the heat flux enhanced to 300 kW/m2. When the EG volume fraction increased to 50%, the HTC difference expanded to 20. This heat transfer degradation phenomenon was consistent with the previous literature research on the boiling of binary mixtures.
Figure 4 shows that the increasing volume fraction of EG in the mixtures also enlarged the wall superheat temperature. This indicated that if the working fluids want to transmit the same amount of heat, the higher the concentration of EG, the higher the temperature that the heating surface needed to reach, and the greater the input heat load that needed to be consumed. In particular, when the heat flux was 300.64 kW/m2, the mixture with 50% EG needed 20 K larger superheat compared to DI water. The temperature glide of mixtures when boiling started was plotted in Figure 5. According to the visualization results, the growing volume fraction of EG also amplified the saturated temperature of mixtures. The delay in the onset temperature of boiling implied that greater input power was required to cause boiling to occur. Similarly, this phenomenon also means that the interactions between the components in the mixture cause significant changes in the properties of the mixture even before boiling occurs.

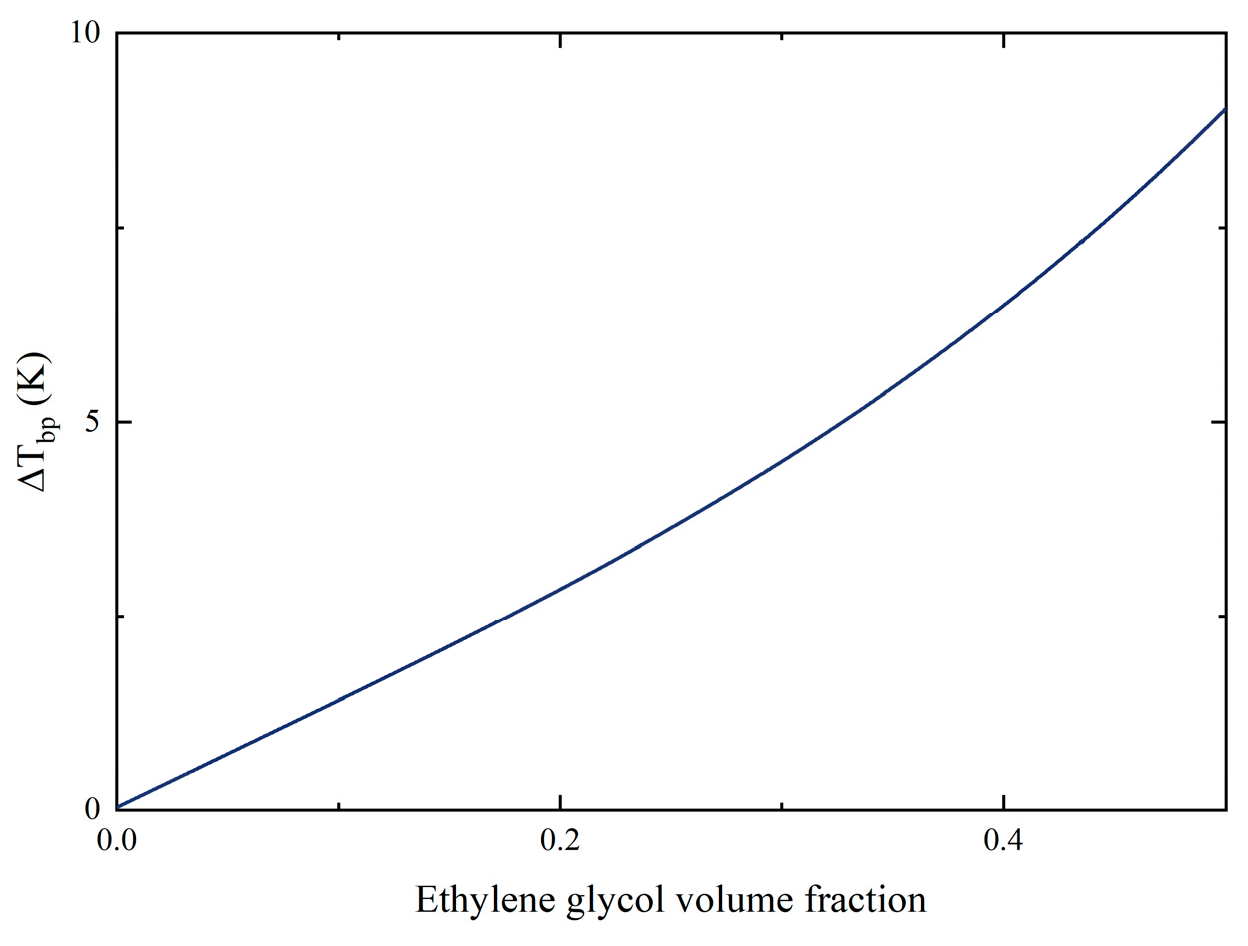
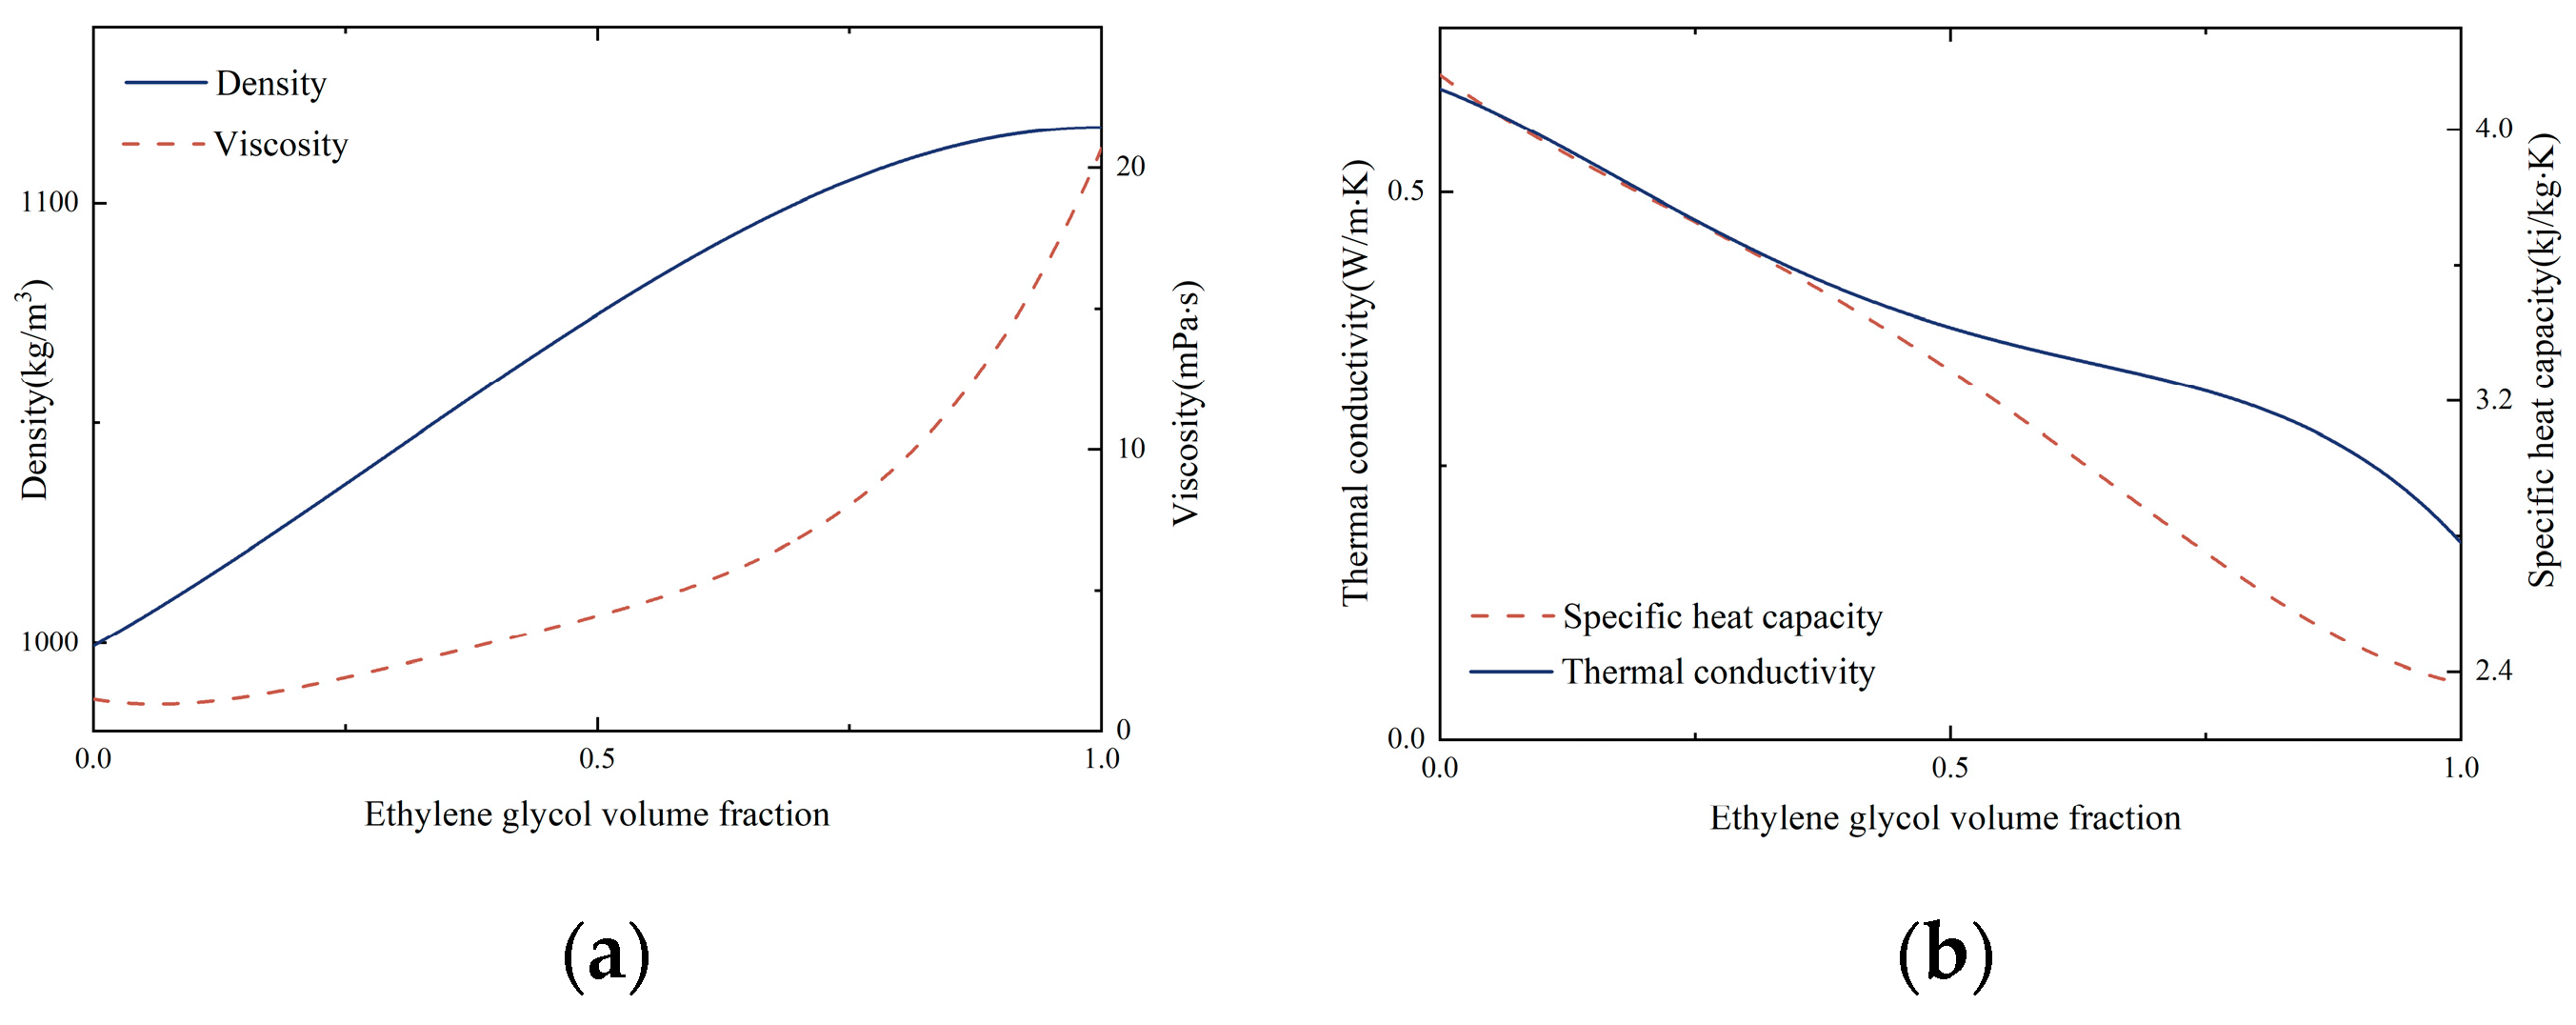
3.2. Thermophysical Properties

In order to investigate the reasons for the decrease in boiling performance, the surface tension and static contact angle of the binary mixtures were measured, as shown in Figure 6. As the concentration of EG increased, the surface tension and contact angle of the mixtures both decreased. The difference lies in that the surface tension continuously reduced with the addition of EG, but the contact angle no longer significantly changed when the EG volume fraction was greater than 50%. The value of the contact angle fluctuated until the mixture became pure working fluid EG. The factor that contributes to this situation may be the addition of EG into pure water enriches molecule aggregation on the surface since the polarity of ethylene glycol molecules is strong. The aggregation leads to a negative increase in surface excess at the solid–liquid interface of the mixture, which would reduce the surface tension and enlarge wettability, thereby promoting a decrease in contact angle. As the concentration of EG continues to grow, the decreasing molecular diffusion rate results in a decrease in surface tension decline rate. Subsequently, the scale-down on the contact angle of mixtures no longer continues.
According to most previous studies on pool boiling, the decline in surface tension and contact angle usually improves the boiling performance of working fluids. However, the results of the EG/DW pool boiling experiments showed the opposite performance. This indicates that the pool boiling process of a non-azeotropic mixture is different from that of pure working fluids. Two different components and variable concentrations make the boiling process of non-azeotropic mixtures more complex. By querying the ASHRAE2005, some physical parameters of the EG/DW mixture working fluids were obtained, as shown in Figure 7.
It could be seen from the figure that the volume fraction of EG had a significant influence on the thermophysical properties of mixtures. What is more, the thermal conductivity and specific heat capacity both declined with the growth of EG while the viscosity constantly escalated. This may be the factor that contributes to the degradation of boiling performance. The larger wettability between the liquid–solid surface can produce smaller bubbles during boiling, which indicates a higher bubble departure frequency. However, the increased viscosity of the mixture may have an impact on the bubble detachment speed. Figure 8 depicts the dynamic contact angle of binary mixtures to exhibit the hysteresis of non-azeotropic mixtures.
Increasing the volume fraction of EG did not significantly affect the advancing angle of the mixtures so that, when the temperature reached saturation temperature, all mixtures started saturating boiling, and forming bubbles. Moreover, because the forward angle represents the interface three-line movement speed of the liquid phase during bubble growth, there is not much difference in the initial bubble growth speed among all mixed working fluids. The receding angle of mixtures decreased continuously with the addition of EG. After reaching its minimum value at a 60% volume fraction, the receding angle showed escalation with the growing EG volume fraction. The receding angle represents the contact surface where the liquid continuously recedes during bubble growth, so its reduction also means a decrease in bubble diameter. However, since the advancing angle remained unchangeable, the reduced receding angle also enlarged the difference between them as to the hysteresis of the solution. This hysteresis will lead to a greater pinning effect of bubbles during boiling, thereby reducing the bubble departure rate and resulting in a degradation in boiling performance.

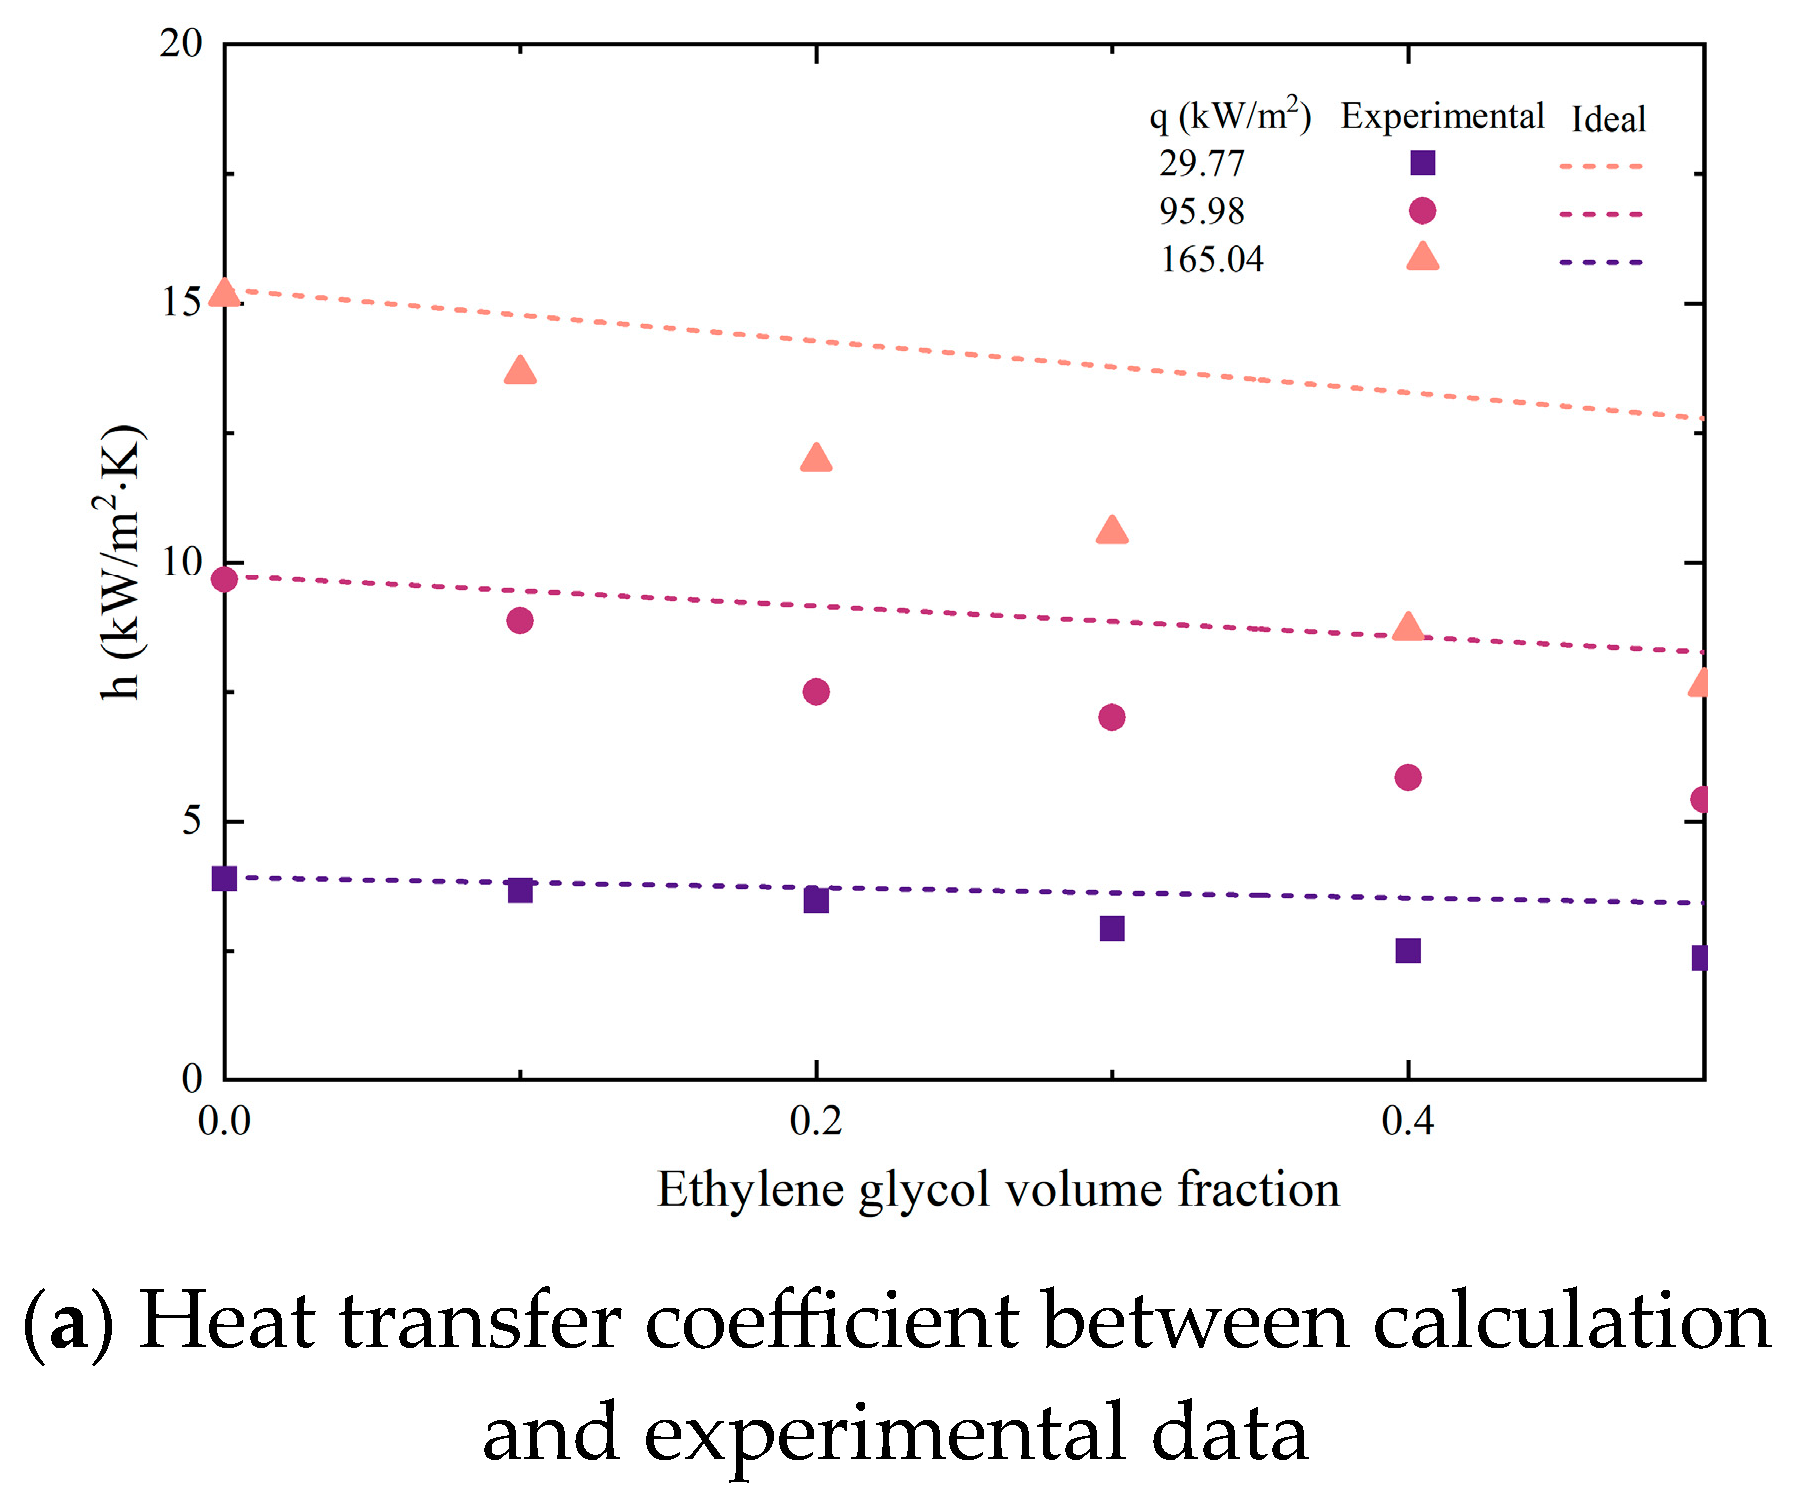
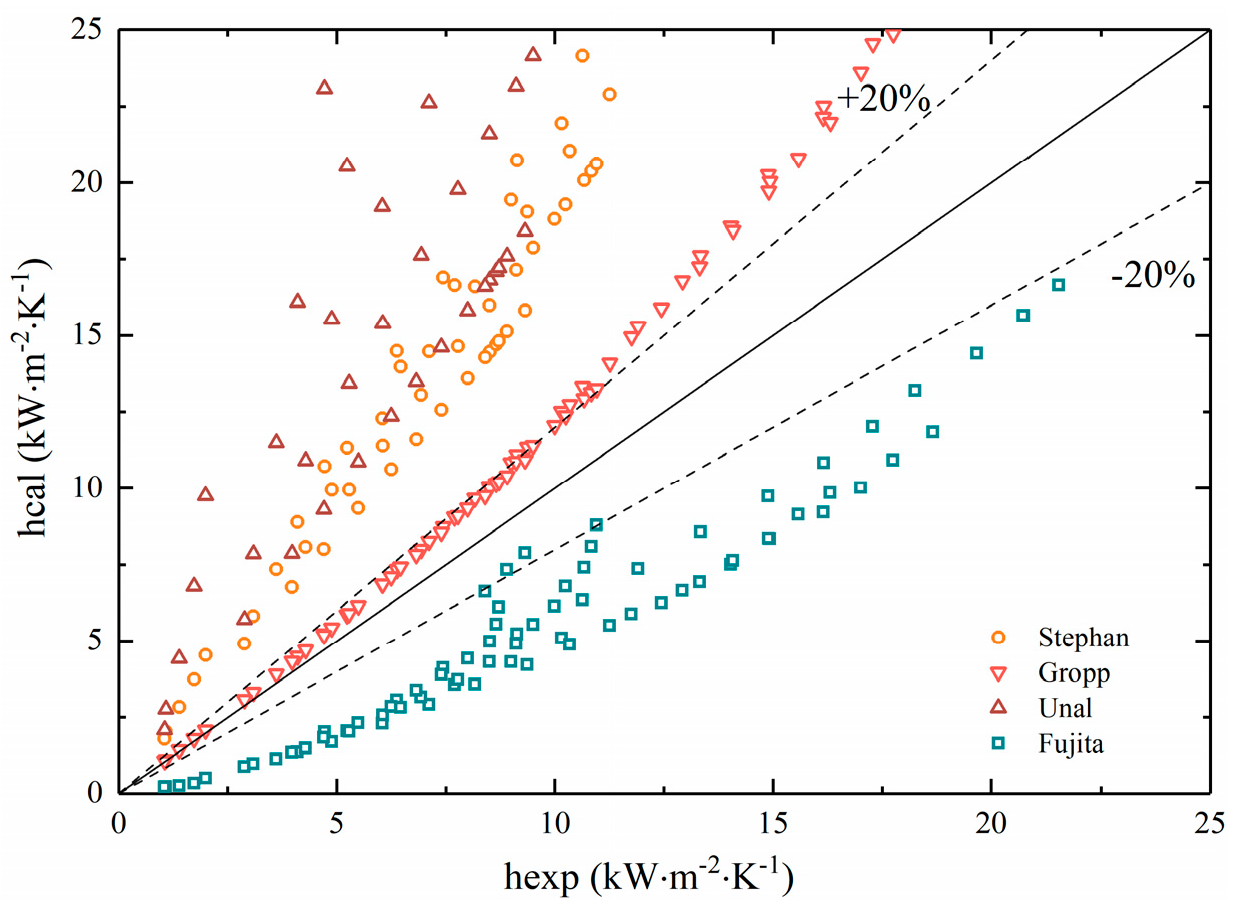
3.3. Correlations of Heat Transfer Coefficient

In terms of the nucleate pool boiling models, the most famous and commonly used is the Rohsenow correlation equation, whose expression is shown in Equation (11). This theory is based on the boiling theory formula of forced convection heat transfer. The author believes that when saturated boiling occurs, the disturbance of bubbles caused by local forced heat transfer makes the interference of liquid flow velocity negligible, and the oscillation of bubbles becomes the key factor affecting boiling heat transfer performance. The most important parameter in this formula is the empirical constant Csf. By calculating the Prandtl number and Reynolds number and substituting different experimental data, the corresponding Csf for different interfaces and fluids can be obtained. The author was the first to set the value of Csf to a fixed value of 0.013, and experiments have shown that this value can meet the prediction of pool boiling heat transfer coefficients for most boiling fluids using water.
Although the Rohsenow correlation is based on bubble agitation theory, this part is simplified as a fixed empirical constant during calculation, and the convective effect generated by bubble agitation is not the main contribution to heat transfer during pool boiling. Therefore, on this basis, Mikic and Rohsenow reconsidered the impact of bubble dynamics on boiling performance and modified the model with the nuclear bubble diameter parameter [24], as shown in Equations (12)–(14).
q = C 1 r s m π 2 m 1 ( k ρ c ) l 1 / 2 ( h f g ρ v T s a t σ ) m f D b 2 T m + 1
D b = C 2 σ g 0 g ρ l ρ v 1 / 2 J a 5 / 4
f D b = C 3 σ g 0 g ρ l ρ v ρ l 2 1 / 4
C1 is a dimensionless number that can be seen as 1/unit. C2 is an empirical parameter that is 1.5 × 10⁻⁴ for water, and 4.65 × 10⁻⁴ for other liquids. C3 is an empirical parameter of 0.6. rs is the active cavity radius in the area corresponding to the number of bubble nucleate points. m is an empirical parameter, ranging from 0.5 to 1. Ja is the Jacob number. g0 is the conversion coefficient as 4.17 × 10⁸ lbm·ft/hr2 lbf.
It can be found that the original M-R correlation not only relies on empirical parameters, but also has a large number of variables and complex forms. Wen and Wang [25] simplified the original M-R formula and modified it with Wang and Dhir’s correlation formula for the number of active nucleation sites [26], which is based on the contact angle between the working fluid and the heating surface. The modified formula was shown in Equations (15)–(17):
q = B T w T s a t m + 1 C 1 c o s θ μ l h f g σ ρ l ρ v 1 / 2
m + 1 = k 1 / 2 ρ l 17 / 8 c p l 19 / 8 h f g m 23 / 8 ρ v m 15 / 8 μ l ρ l ρ v 9 / 8 σ m 11 / 8 T s a t m 15 / 8
B = C 2 2 / 3 C 3 1 / 2 2 π 1 / 2 g 9 / 8
Substituted the physical properties of non-azeotropic mixtures of EG/DW into the Rohsenow correlation and the new M-R correlation for calculation. Figure 9 presents the calculation results compared with the experimental results.
From the graph, it can be seen that the experimental results deviated significantly from the predicted results of the classical correlations, especially when heat flux increased. The factors that contribute to this situation include:
  • The empirical constant calculated by using deionized water as the pure working fluid is not applicable to binary mixtures.
  • The characteristics of a non-azeotropic mixture during boiling are much more complex than those of pure components.
The selection of variables in the classical correlations does not include the main factors affecting the boiling heat transfer coefficient of the non-azeotropic mixture, that is, the influence of changes in the physical properties of the mixtures caused by EG volume fraction growth on its boiling.
Due to the different performances of binary mixtures and pure refrigerants during boiling, the prediction correlation for their heat transfer coefficient should also reflect the impact of each component on the overall heat transfer performance. Li [27] proposed a simple formula for predicting the ideal heat transfer coefficient of binary mixtures, as shown in Equations (18) and (19):
h i d = x h 1 + y h 2
h i d h e x p = 1 + K
Among them, x represents the mole fraction of the volatile phase, while y represents the mole fraction of the non-volatile phase during vapor–liquid phase equilibrium. And the deterioration factor K has been defined, which can more intuitively display the trend of the difference between the ideal heat transfer coefficient and the actual heat transfer coefficient. Substituting experimental values, the calculated heat transfer coefficient is shown in Figure 10.
It could be seen that as the volume fraction of EG increased, the deviation between experimental data and calculated data gradually increased. In addition, this deviation continues to enlarge with the growth of heat flux. The reason for this phenomenon is that although the ideal equation considers the influence of component proportion on the mixture, it ignores the interaction between components caused by concentration differences. Unlike pure working fluids, only the volatile component (DW) in non-azeotropic mixtures evaporates and produces bubbles during boiling. The concentration of the liquid phase at the vapor–liquid interface changes constantly, which not only affects mass transfer resistance but also saturation temperature. In addition, the interaction between components will be amplified when the concentration of non-volatile components (EG) increases or the heat flux density increases.
Stephan and Körner [28] proposed a formula as Equations (20)–(22) for binary mixtures including the concentration of each pure refrigerant component and the pressure P of the mixture. The heat transfer coefficient is calculated by predicting the wall superheat temperature. Subscripts 1 and 2 represent volatile and non-volatile components, respectively.
T m / T i = [ 1 + B 0 x y ( 0.88 + 0.12 × 10 5 P ) ]
T i = T 1 ( 1 y ) + T 2 y
h = q / T m
Although this correlation takes into account the effects of component concentration and temperature, the temperature change only comes from the saturated boiling temperature of the pure component, making the final ideal wall superheat completely dependent on the component concentration and ignoring the changes in superheat caused by the interaction between components. In addition, the correlation parameters are simple, especially the empirical parameter B0. The recommended value for B0 is 1.53 when |x − y| < 0.635 and 0.1 < P < 1.0 MPa, which is not suitable for a wide range of binary mixtures. However, the concept of component concentration difference introduced by the formula reflects the mass transfer driving force between binary mixtures during boiling, which is different from pure working fluid boiling and provides a computational approach for subsequent researchers.
On the basis of the Stephan correlation, Ünal [29] refined the formula parameters:
T m / T i = [ 1 + ( b 1 + b 2 ) ( 1 + b 3 ) ] ( 1 + b 4 )
b 1 = ( 1 x ) l n 1.01 y 1.01 x + y l n y x + | x y | 1.5
b 2 = 0 , y 0.01 ( x / y ) 0.1 1 , y < 0.01
b 3 = 152 ( P / P c ) 3.9
b 4 = 0.92 | x y | 0.001 ( P / P c ) 0.66
In this correlation equation, the empirical parameter K is converted into a series of formulas related to the concentration and pressure of pure working fluid components so that the correlation equation does not include empirical constants for a certain binary mixture or physical properties, expanding the application range of the correlation equation.
Fujita and Tsutsui [30] considered the temperature differences at the vapor–liquid equilibrium interface caused by instantaneous concentration changes. They introduced the temperature differences between dew point and bubble point temperatures during boiling to modify the prediction correlation for binary mixtures. Fujita believed that during the boiling of binary mixtures, the volatile components in the liquid phase tended to form bubbles easily. Therefore, the molar concentration Xe of the volatile components at the vapor–liquid equilibrium is always lower than the known concentration X1, which resulted in a decrease in temperature difference ∆Tw compared to the corresponding temperature difference ∆Th, as shown in Figure 11.
Therefore, in Fujita’s correlation, the temperature glide at the known molar fraction was used to replace the temperature difference at the vapor–liquid equilibrium:
h / h i d = { 1 + T b p T i d [ 1 e ( 60 q ρ v h f g [ σ g ( ρ l ρ v ) / ρ v 2 ] 1 / 4 ) ] } 1
Gropp and Schlünder [31] also noticed the phenomenon of temperature glide. The difference is that Gropp chose to replace the temperature difference, with the difference between the saturation temperatures corresponding to the components:
h / h i d = { 1 + h i d q [ ( T s 2 T s 1 ) ( x y ) ( 1 e ( B 1 q β L ρ l h f g ) ) ] } 1
where Ts2 is the saturation temperature of the non-volatile phase, and Ts1 is the saturation temperature of the volatile phase. B1 is an empirical constant, it is usually assumed that the heat flux at the wall is fully converted into the latent heat during vaporization, so B1 is valued as 1. βL is the mass transfer coefficient and βL is (2~5) × 10−4 m/s for boiling with Reynolds number between 60 and 1000.
We substituted experimental data into the four prediction correlations mentioned above for calculation and the results were plotted as shown in Figure 12.
It can be seen that the experimental results did not fit well with several correlations. The Stephan and Ünal correlations took into account the mass transfer resistance caused by concentration, which was suitable for non-azeotropic mixtures. Most of the data also conformed to the optimal accuracy range of the formula itself (22~38%). However, the calculated heat transfer coefficient was always higher than the experimental value since the value of wall superheat temperature from correlations was smaller than the actual one, resulting in lower accuracy than expected.
The fitness of the Groppe correlation could be maintained within 20% at low heat flux. Nonetheless, as the heat flux grew, the calculated heat transfer coefficient gradually exceeded the experimental results. On the contrary, the Fujita correlation, where the experimental results were consistently higher than the calculated results, cannot meet the accuracy requirements either.
Inoue [32] proposed the local temperature and the bulk temperature caused by differences in component concentration during the boiling of binary mixtures. When the solution reaches its boiling point, the concentration and temperature of the solution are in a stable state. At this time, the concentration of volatile components is X1, and the corresponding temperature is Tbulk. After the heat flux starts to increase, bubbles begin to form on the nucleate point, the liquid phase concentration gradually decreases compared to the initial concentration, and the local temperature gradually increases.
From Figure 13, it can be seen that the difference between the Tbulk and the Tw is the maximum temperature difference during boiling, which is always greater than the temperature difference between the bubble and dew point temperature. Therefore, the heat transfer coefficient obtained from the experiment is always higher than the calculation result of the Fujita correlation. When the concentration of volatile components hits the minimum value of Xmin, it corresponds to the maximum local temperature. Therefore, the concentration of volatile component X2 should be within the range between X1 and Xmin. However, this concentration is unknown. So, it is necessary to use the known concentration and its temperature difference between the bubble and dew point temperature to calculate the bubble point temperature rise rate (without unit factor, S < 1), and modify the ideal wall temperature difference:
T i d = T w S T E
S = 1 0.75 e 0.75 × 10 5 · q
where ∆TE is the temperature difference at the dew point corresponding to the initial concentration of volatile components.
Substituting the new method for determining the wall superheat temperature into the prediction correlations of Groppe and Fujita, the results are plotted in Figure 14.
It could be seen from the figure that the calculated results of the two correlation equations had a significant change in fitness with the experimental results after modification. All of the results remained within a deviation range of 20%, which indicated that the modified correlations had better applicability for non-azeotropic mixtures.

4. Conclusions

The primary aim of this study is to investigate the factors influencing the heat transfer performance of non-azeotropic mixtures, specifically those comprising ethylene glycol and distilled water (EG/DW). Additionally, the study seeks to refine the existing prediction formula for the boiling heat transfer coefficient (HTC), taking into account the unique temperature slip characteristics inherent to non-azeotropic mixtures. This article presents a novel approach to understanding the heat transfer coefficient (HTC) of non-azeotropic mixed refrigerants by introducing the concept of temperature slip and its effects on boiling heat transfer. Through experimental methods, it develops a more accurate and simplified correction formula for calculating HTC, focusing initially on ethylene glycol and water mixtures due to their well-known properties. This study emphasizes the importance of temperature slips in analyzing the dynamic behavior of these mixtures under thermal conditions and proposes a data collection methodology that is both straightforward and reliable. Acknowledging the scope for broader application, the research aims to extend its findings to a wider range of working fluids in the future, thereby contributing significantly to the heat transfer field and setting a foundation for further validating the proposed correction formula across various non-azeotropic mixtures. Key findings include the following:
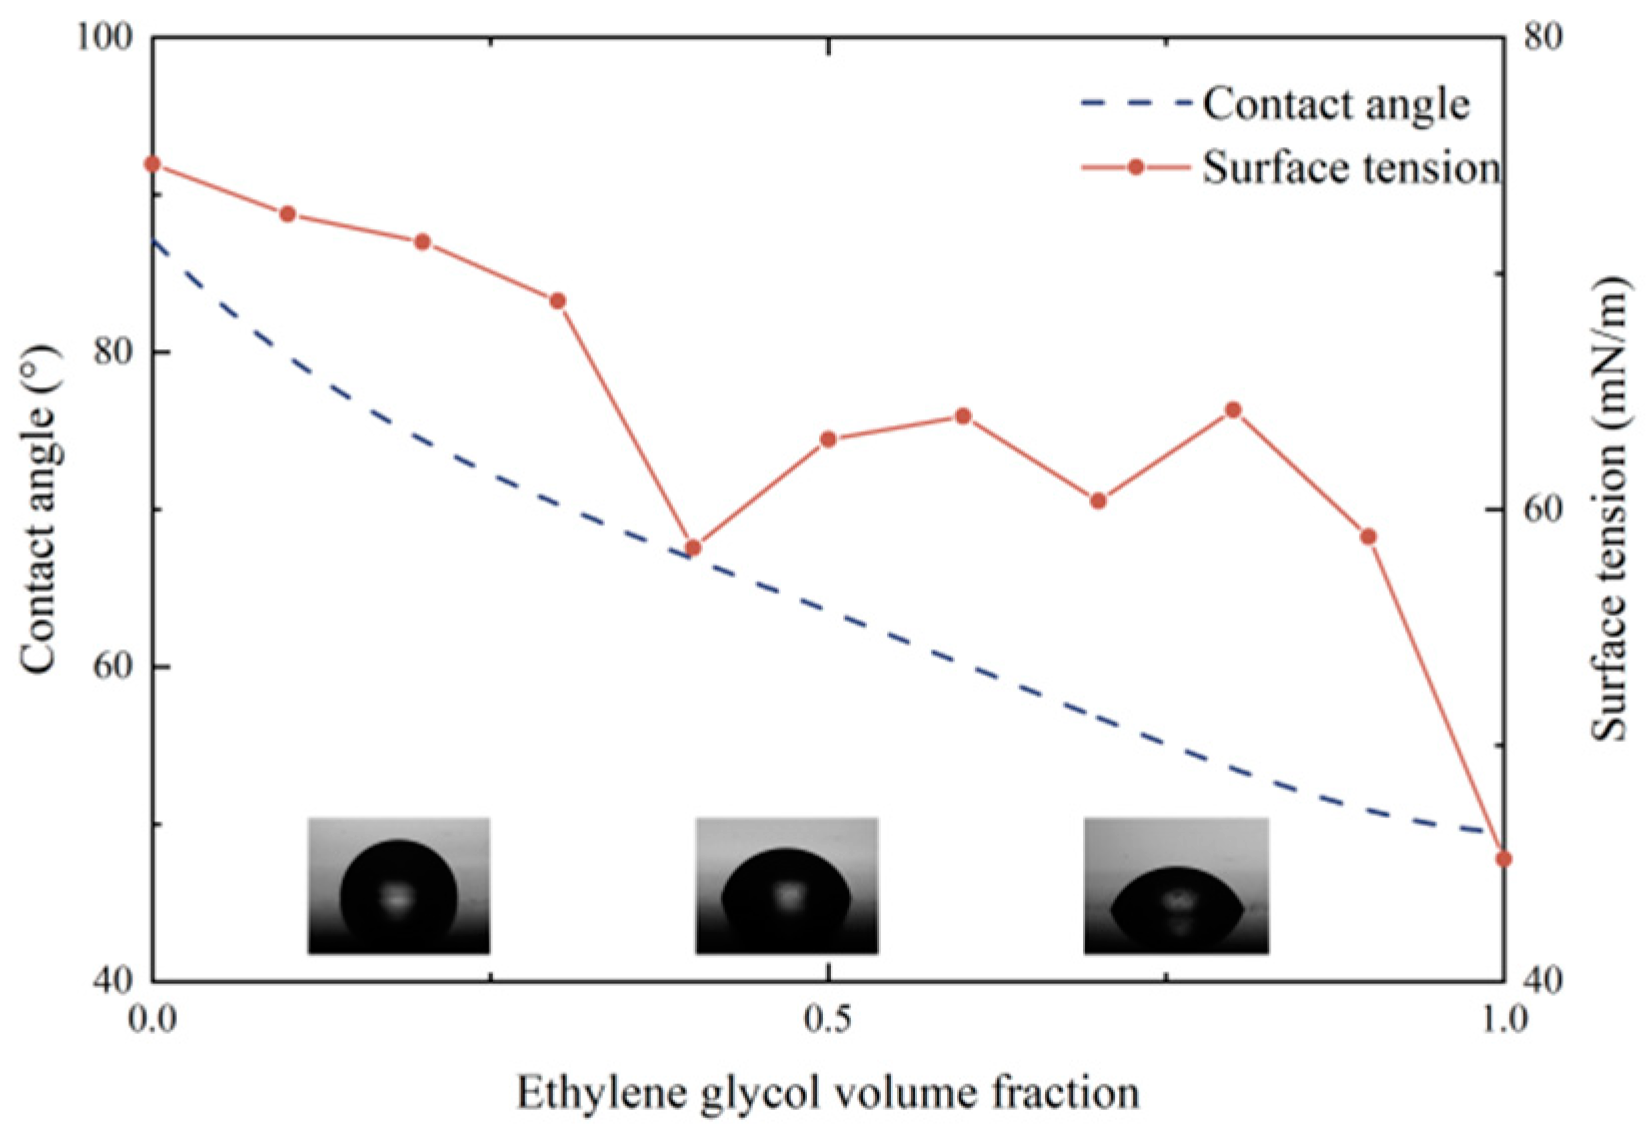
  • An increase in EG concentration was found to reduce the surface tension of the mixtures. This reduction in surface tension enhanced the wettability of the mixture, leading to the formation of smaller bubbles during boiling.
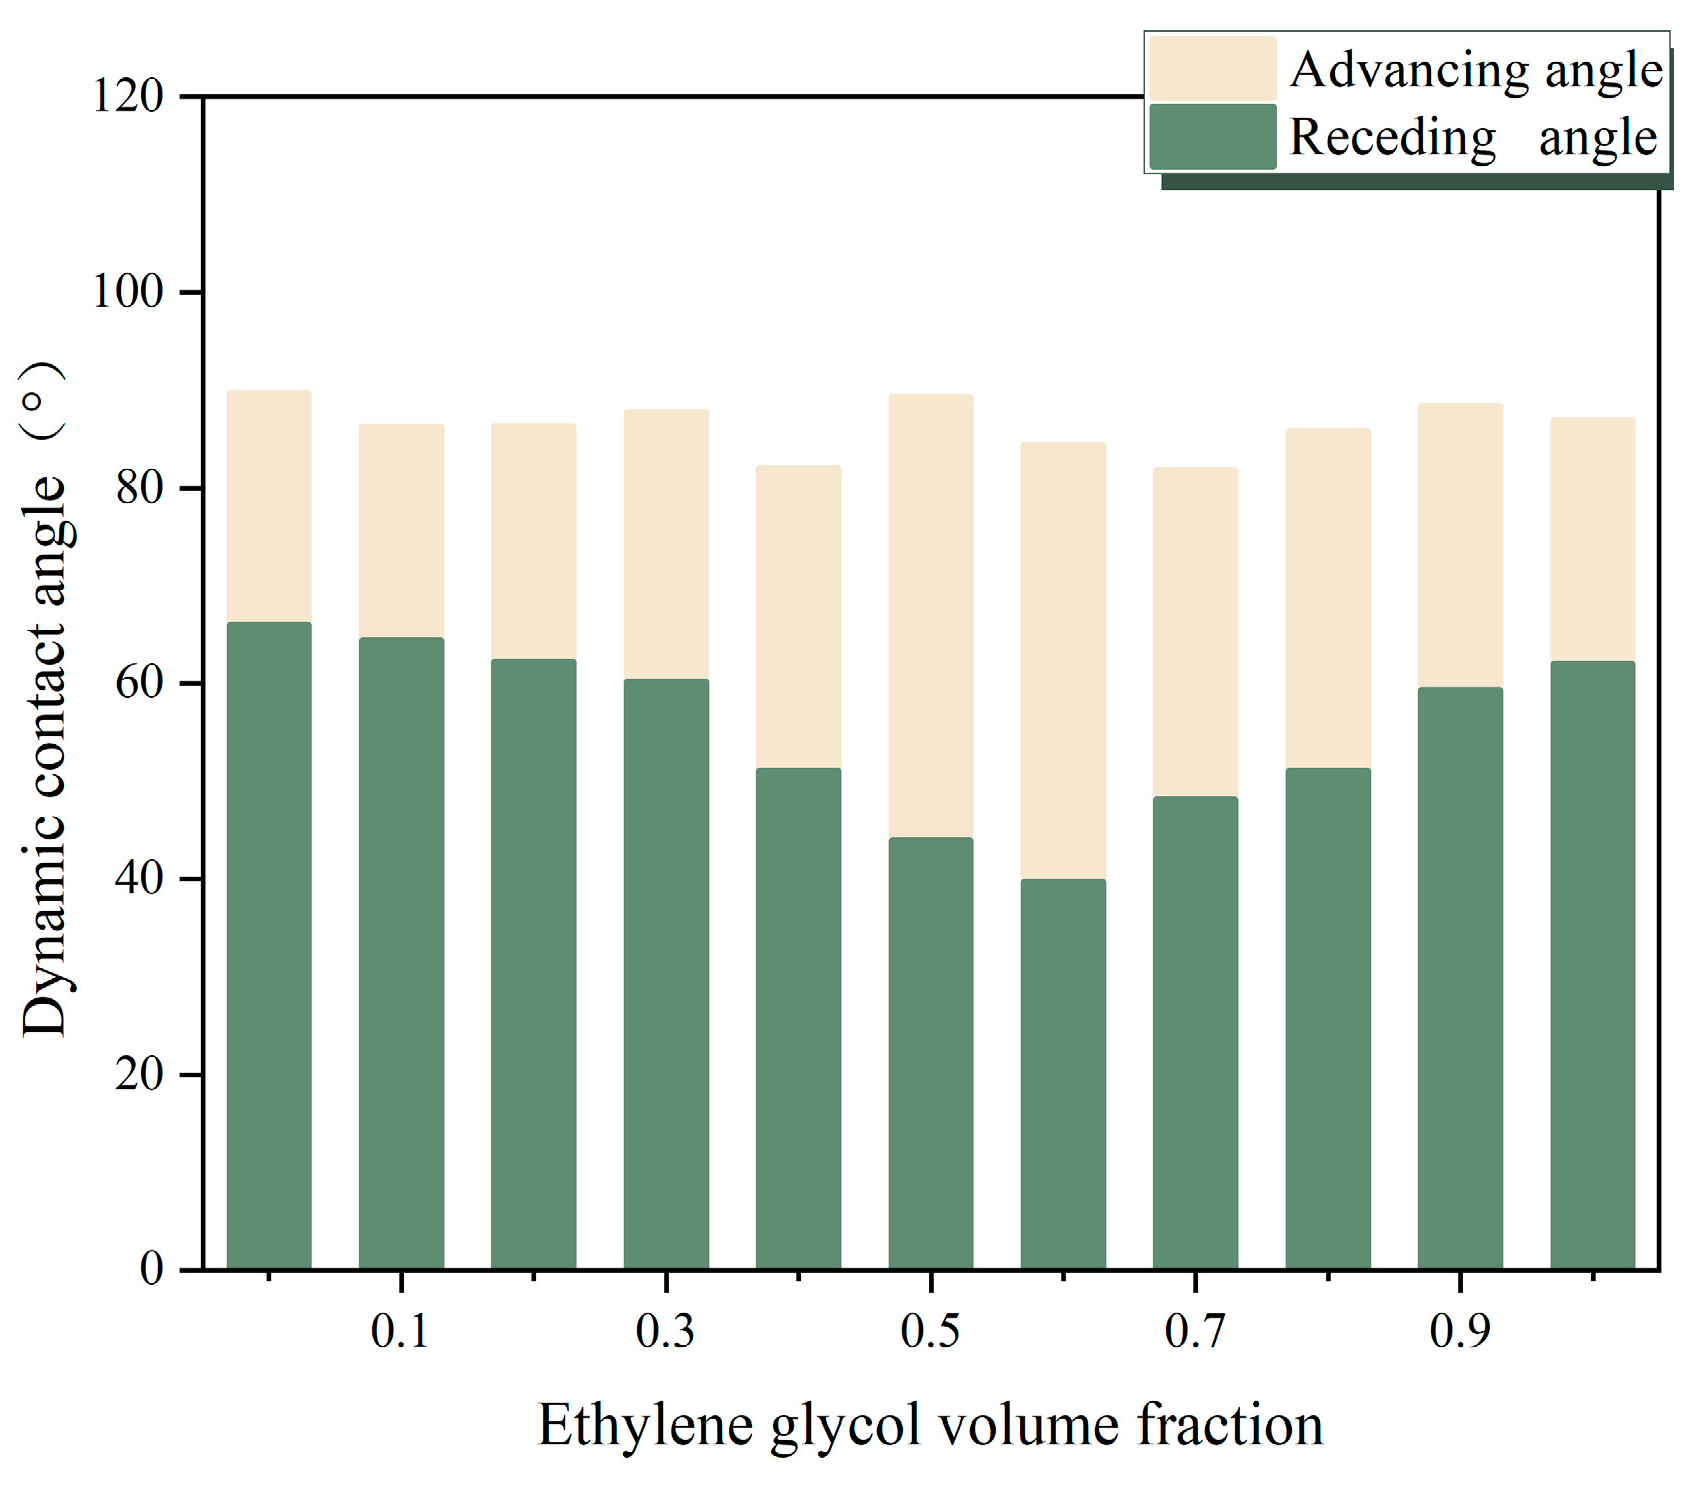
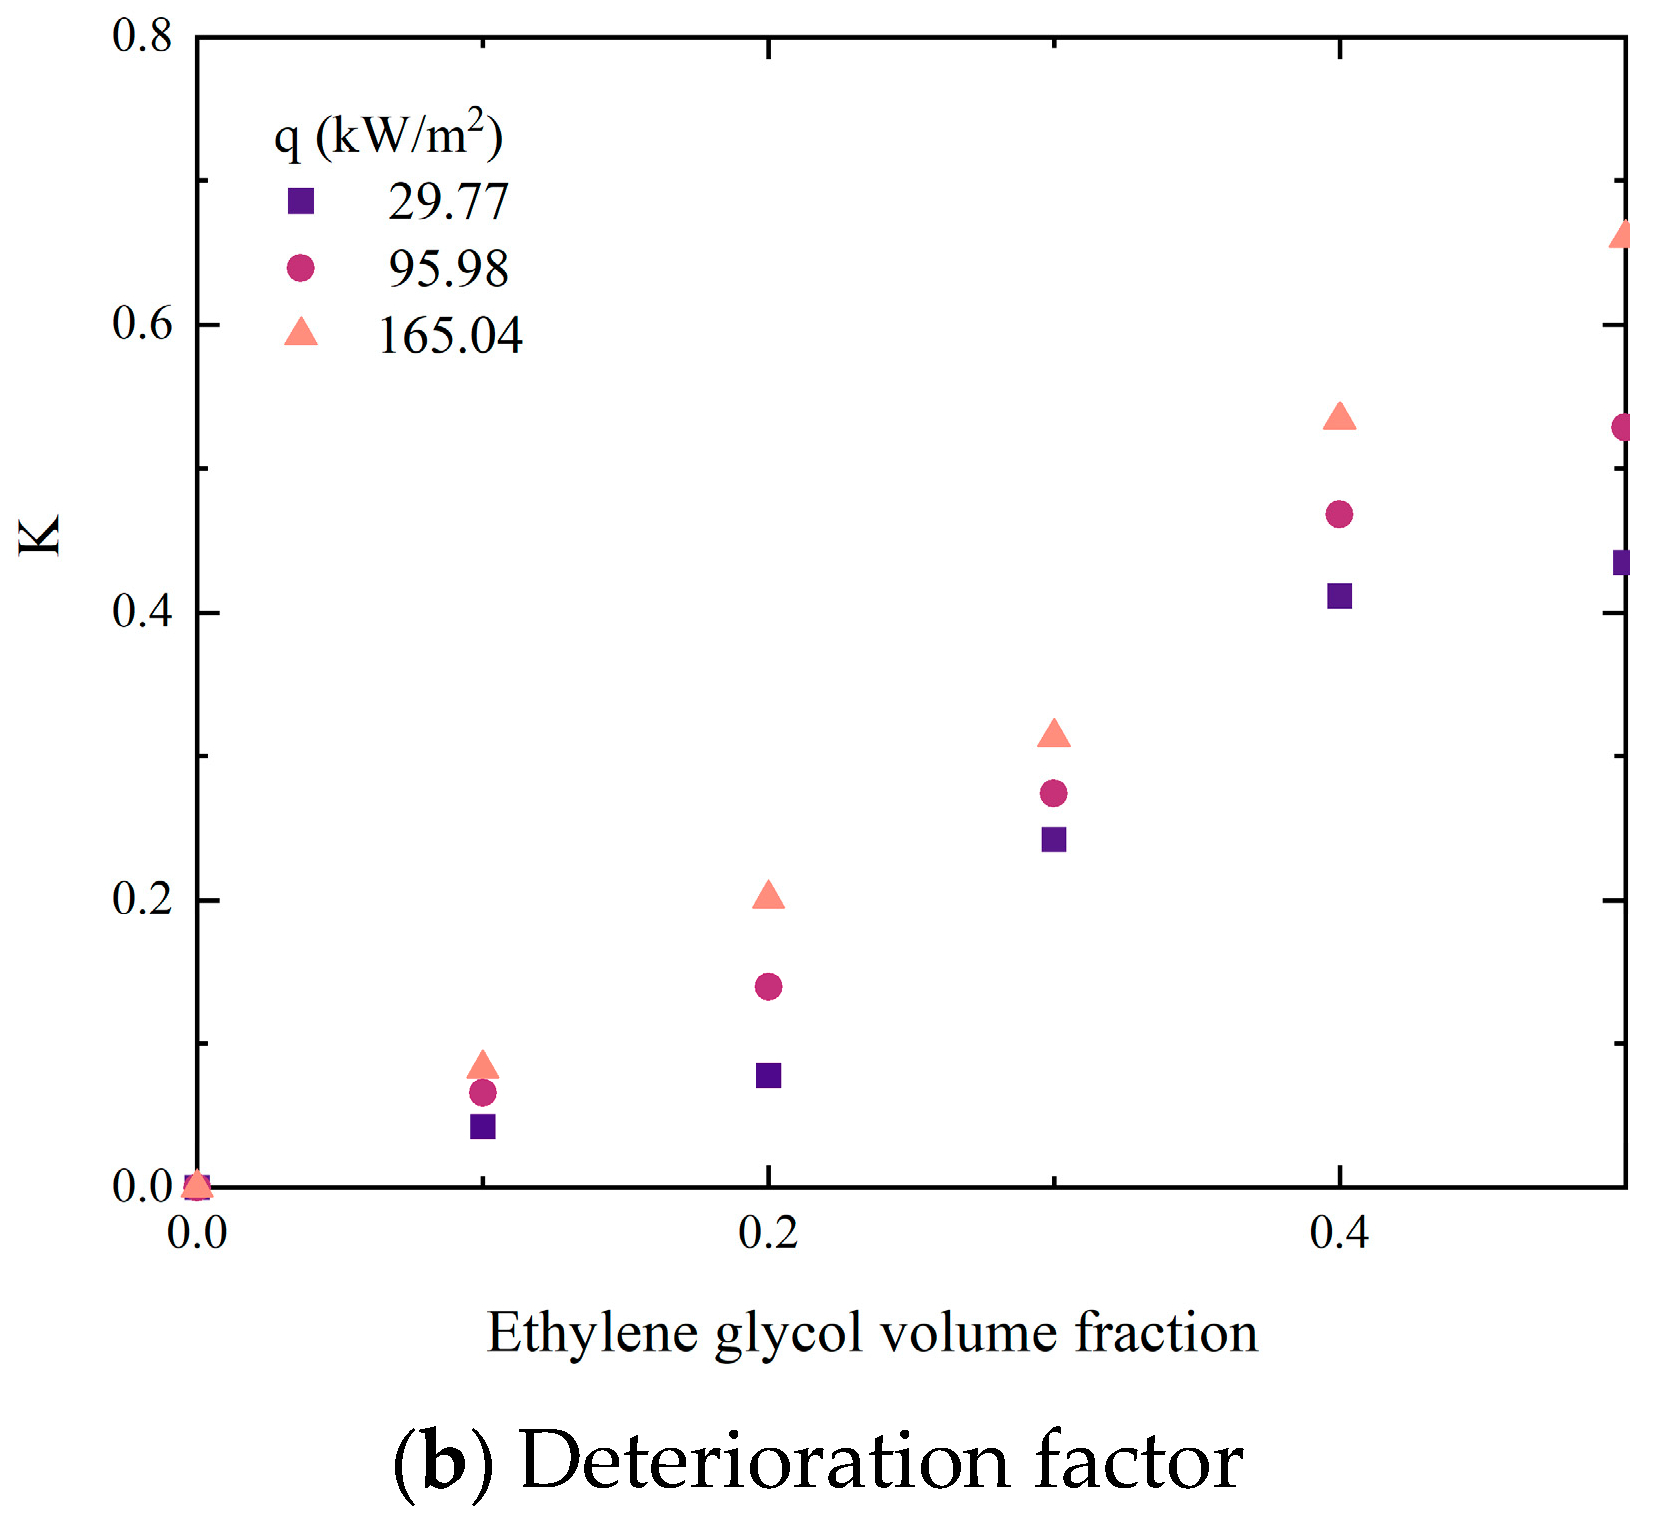
  • With the rise in EG volume fraction, both the viscosity and hysteresis of the mixtures increased. These factors impede the growth and departure of bubbles from the boiling surface, contributing significantly to the deterioration of the heat transfer coefficient (HTC).
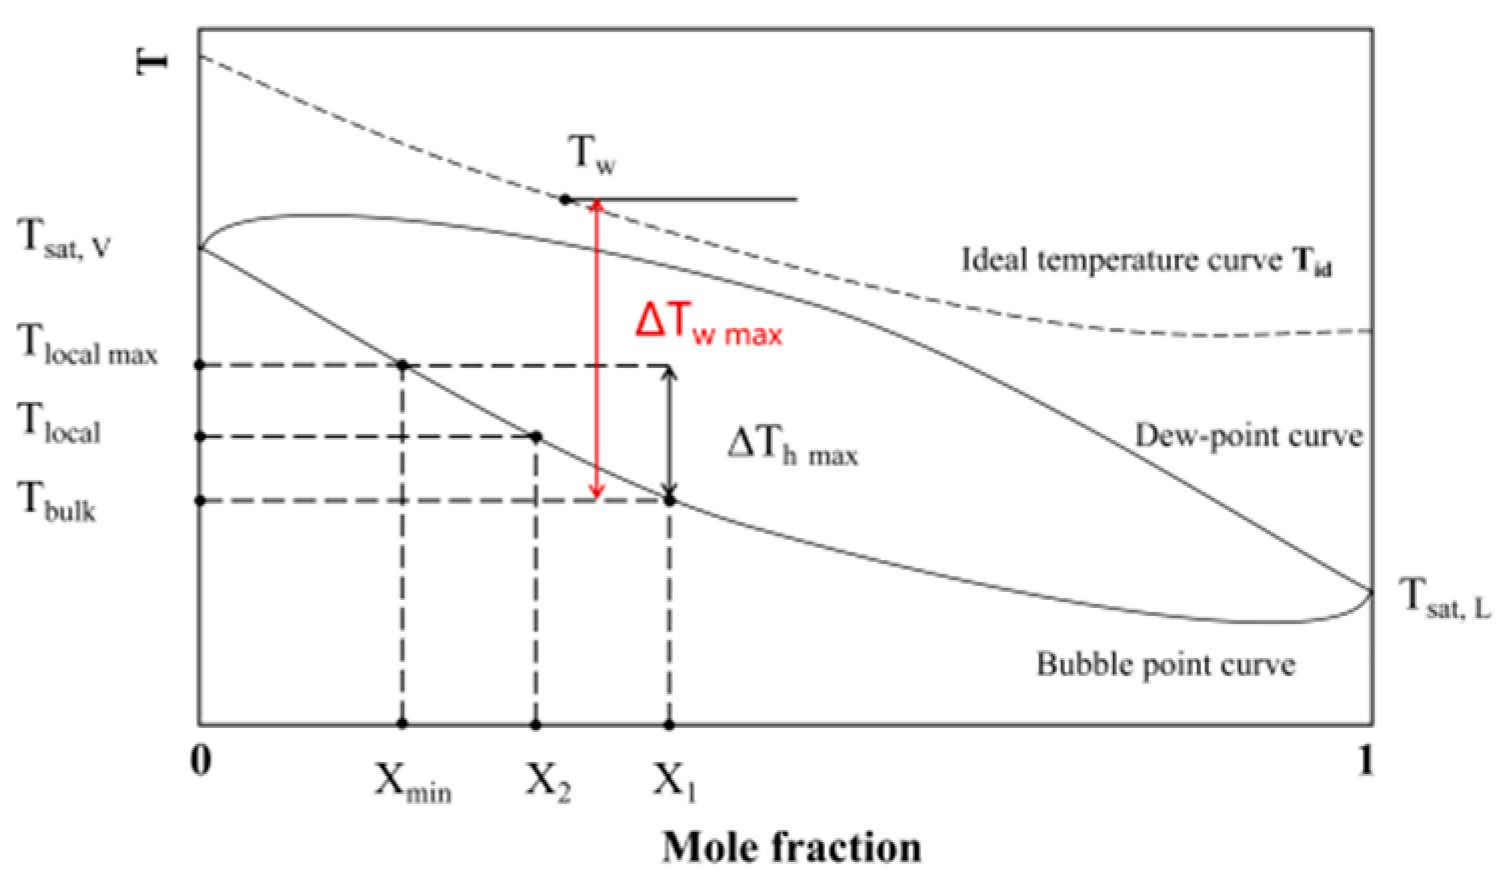
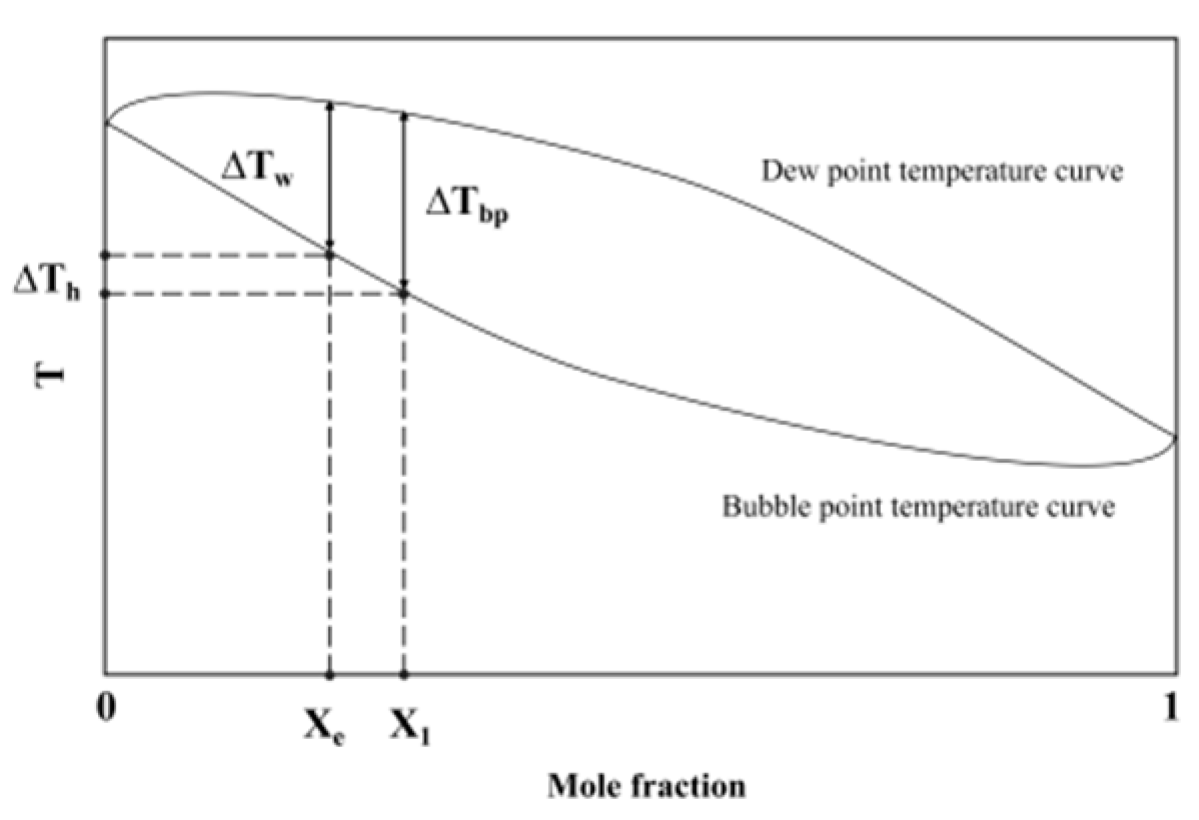
  • Conventional correlations for predicting HTC showed a significant deviation from the experimental values due to the unique properties of the mixture. The non-azeotropic nature of the EG/DW mixture leads to temperature slip during boiling. This results in local concentration changes at nucleation points, affecting bubble growth dynamics.
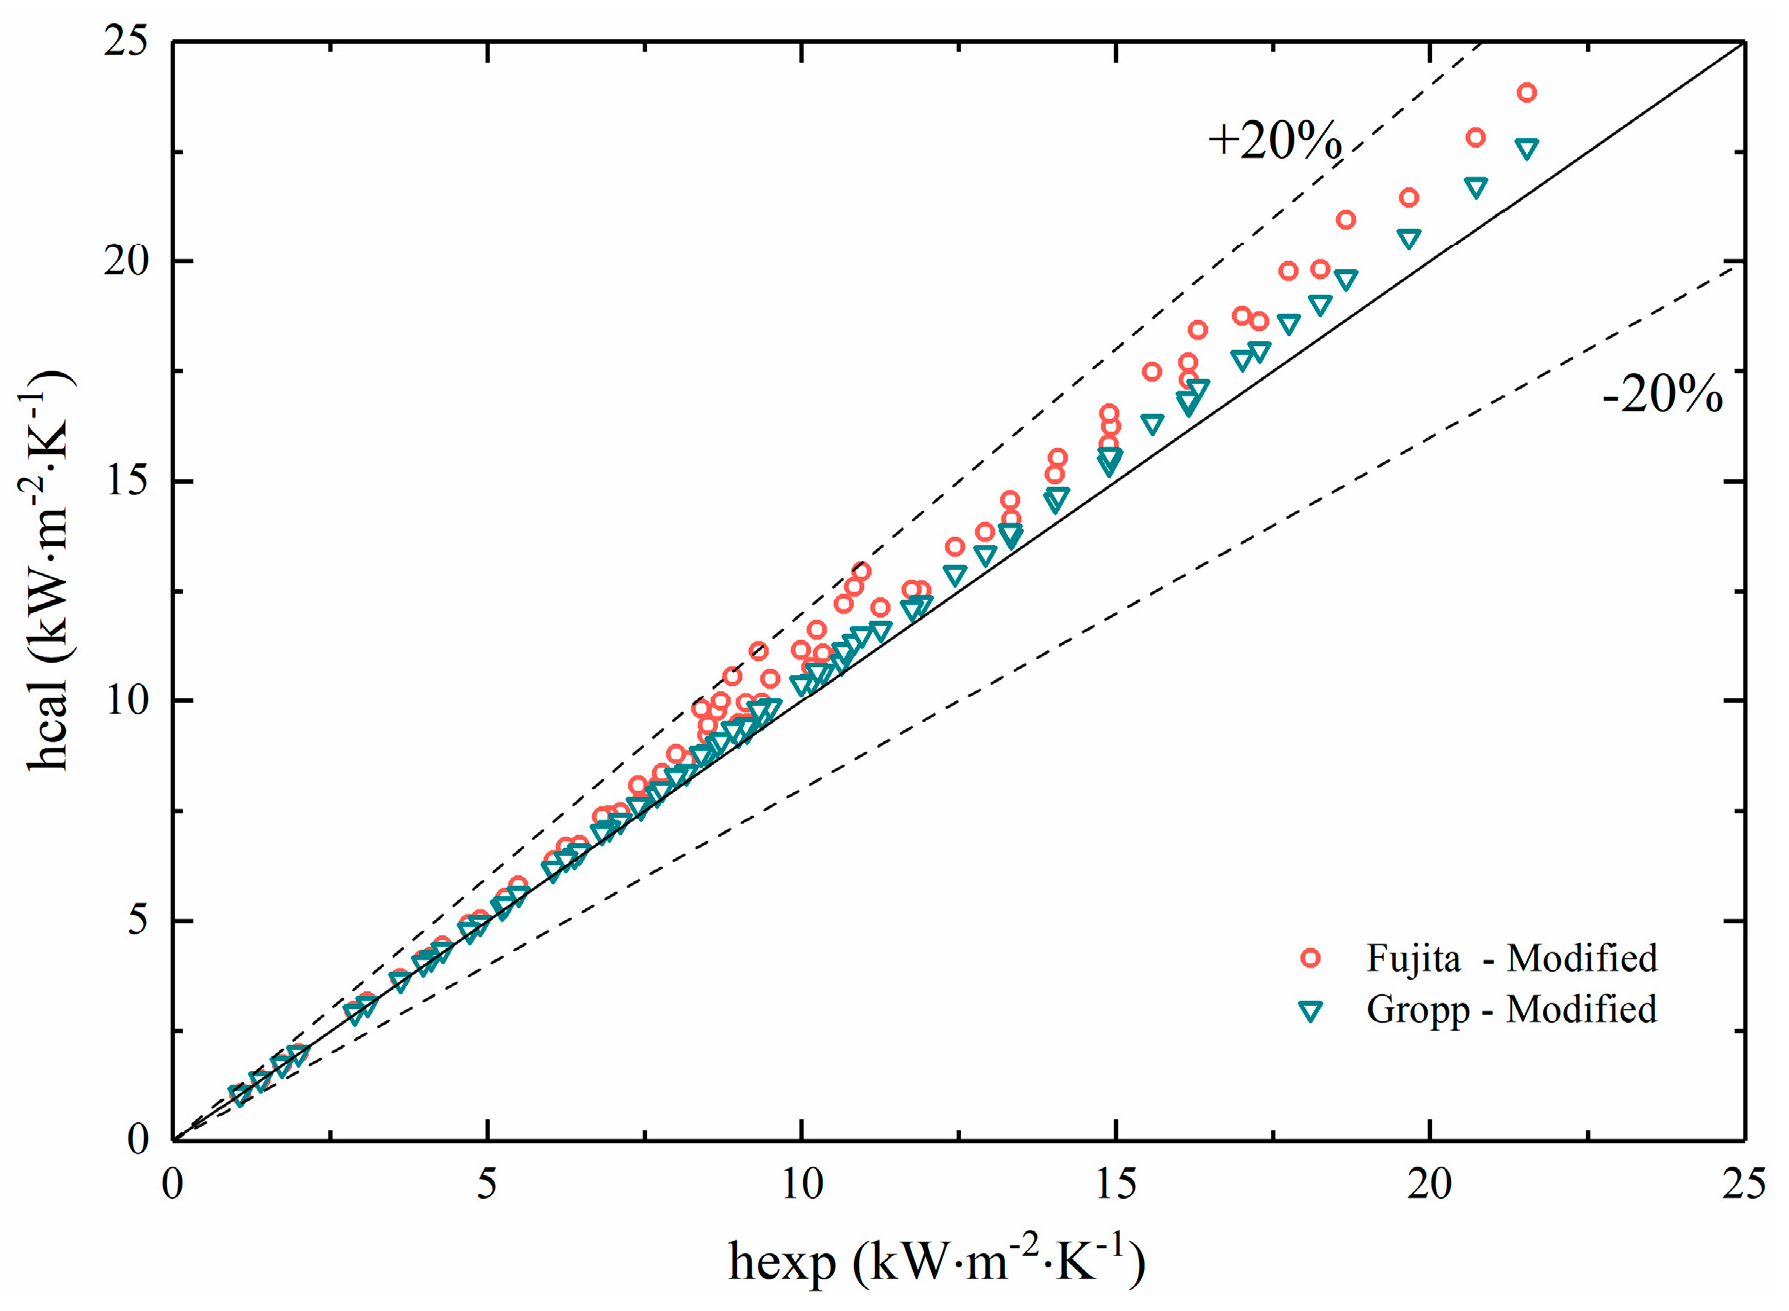
  • To address these discrepancies, a new formula for calculating wall superheat temperature was introduced, modifying two existing correlations for binary mixtures. This new approach takes into account the temperature slip characteristic of the mixture. The comparison of the calculation results indicated that the deviation between the new predictive correlation and the experimental values was within 20%. This demonstrates that the new correlation is more suitable for predicting the HTC of non-azeotropic mixtures, enhancing the accuracy of heat transfer predictions in these systems.

Author Contributions

Conceptualization, C.X. and J.R.; methodology, C.X.; software, C.X.; validation, C.X., J.R. and Z.Q.; formal analysis, C.X.; investigation, C.X.; writing—original draft preparation, C.X.; writing—review and editing, C.X., J.R. and Z.Q.; funding acquisition, L.Z. All authors have read and agreed to the published version of the manuscript.

Funding

This research was funded by the Hainan Provincial Natural Science Foundation of China (521MS053).

Data Availability Statement

Data are contained within the article.

Conflicts of Interest

The authors declare no conflicts of interest.

Nomenclature

b1,b2,b3,b4coefficients in Ünal’s correlation
B0empirical parameter
B1empirical constant
C1,C2,C3empirical parameter
Cpspecific heat at constant pressure (J·kg−1·K−1)
Csfempirical constant
Dbbubble diameter (m)
fbubble departure frequency
g0conversion coefficient (lbmft/hr2 lbf)
ggravitational acceleration (m·s−2)
hheat transfer coefficient (W·m−2·K)
hfglatent heat of vaporization (kJ·kg−1)
Ielectrical current (A)
JaJacob number
Kdeterioration factor
mempirical parameter
Ppressure (Pa)
Pccritical pressure of volatile component (Pa)
qheat flux (kW·m−2)
rsactive cavity radius
Scoefficient affected by a heat flux
∆Twall superheat temperature (K)
∆Tbptemperature glide (K)
∆TEtemperature difference between boiling and dew points (K)
Tbulkboiling temperature before bubble occurs (K)
Titemperature at the corresponding measurement point of thermocouple (K)
Tkaverage temperature of three thermocouples (K)
Tlocalboiling temperature near nucleate cavity (K)
Tsatsaturate temperature of mixture (K)
Twtemperature of heated surface (K)
Velectrical voltage (V)
xmole fraction of the volatile phase
Xmole fraction of the volatile phase during boiling
ymole fraction of the non-volatile phase
Greek symbols
βLmass transfer coefficient (m·s−1)
δthe distance between two measurement points (m)
εdistance between the corresponding measurement point and the top heating surface (m)
θstatic contact angle (°)
λthermal conductivity (W·m−1·K−1)
μdynamic viscosity (mPa·s)
ρdensity (kg·m3)
σsurface tension (mN·m−1)
φphase difference between voltage and electrical current
Subscripts
satsaturation
expexperimental
idideal
1volatile component
2less volatile component
Ccritical
iserial number of temperature measurement points
lliquid phase
vvapor phase

References

  1. Song, M.; Jiang, Z.; Dang, C.; Jiang, Y.; Shen, J.; Luo, X. Mathematical modeling investigation on flow boiling and high efficiency heat dissipation of two rectangular radial microchannel heat exchangers. Int. J. Heat Mass Transf. 2022, 190, 122736. [Google Scholar] [CrossRef]
  2. Chen, H.; Zhang, T.; Gao, Q.; Han, Z.; Xu, Y.; Yang, K.; Xu, X.; Liu, X. Advance and prospect of power battery thermal management based on phase change and boiling heat transfer. J. Energy Storage 2022, 53, 105254. [Google Scholar] [CrossRef]
  3. Ma, X.; Cheng, P. 3D simulations of pool boiling above smooth horizontal heated surfaces by a phase-change lattice Boltzmann method. Int. J. Heat Mass Transf. 2019, 131, 1095–1108. [Google Scholar] [CrossRef]
  4. Peng, H.; Ding, G.; Jiang, W.; Hu, H.; Gao, Y. Heat transfer characteristics of refrigerant-based nanofluid flow boiling inside a horizontal smooth tube. Int. J. Refrig. 2009, 32, 1259–1270. [Google Scholar] [CrossRef]
  5. Xu, J.; Ji, X.; Zhang, W.; Liu, G. Pool boiling heat transfer of ultra-light copper foam with open cells. Int. J. Multiph. Flow 2008, 34, 1008–1022. [Google Scholar] [CrossRef]
  6. Tang, Y.; Zeng, J.; Zhang, S.; Chen, C.; Chen, J. Effect of structural parameters on pool boiling heat transfer for porous interconnected microchannel nets. Int. J. Heat Mass Transf. 2016, 93, 906–917. [Google Scholar] [CrossRef]
  7. Suriyawong, A.; Wongwises, S. Nucleate pool boiling heat transfer characteristics of TiO2–water nanofluids at very low concentrations. Exp. Therm. Fluid Sci. 2010, 34, 992–999. [Google Scholar] [CrossRef]
  8. Mohammed, H.I.; Giddings, D.; Walker, G.S. Experimental investigation of nanoparticles concentration, boiler temperature and flow rate on flow boiling of zinc bromide and acetone solution in a rectangular duct. Int. J. Heat Mass Transf. 2019, 130, 710–721. [Google Scholar] [CrossRef]
  9. Mohammed, H.I.; Sardari, P.T.; Giddings, D. Multiphase flow and boiling heat transfer modelling of nanofluids in horizontal tubes embedded in a metal foam. Int. J. Therm. Sci. 2019, 146, 106099. [Google Scholar] [CrossRef]
  10. Mohammed, H.I.; Giddings, D.; Walker, G.S. CFD simulation of a concentrated salt nanofluid flow boiling in a rectangular tube. Int. J. Heat Mass Transf. 2018, 125, 218–228. [Google Scholar] [CrossRef]
  11. Mohammed, H.I.; Giddings, D.; Walker, G.S.; Talebizadehsardari, P.; Mahdi, J.M. Thermal behaviour of the flow boiling of a complex nanofluid in a rectangular channel: An experimental and numerical study. Int. Commun. Heat Mass Transf. 2020, 117, 104773. [Google Scholar] [CrossRef]
  12. Lv, H.; Ma, H.; Zhao, Y.; Mao, N.; He, T. Numerical simulation of flow boiling heat transfer characteristics of R134a/Ethane binary mixture in horizontal micro-tube. Int. J. Refrig. 2023, 146, 126–134. [Google Scholar] [CrossRef]
  13. Prabakaran, R.; Salman, M.; Kumar, P.G.; Lee, D.; Kim, S.C. Boiling of R290+CF3i mixture inside an offset strip fin plate heat exchanger. Appl. Therm. Eng. 2022, 216, 119070. [Google Scholar] [CrossRef]
  14. Xu, C.; Qian, Z.; Ren, J. A Comprehensive Experimental Investigation of Additives to Enhance Pool Boiling Heat Transfer of a Non-Azeotropic Mixture. Entropy 2022, 24, 1534. [Google Scholar] [CrossRef] [PubMed]
  15. Markmann, B.; Tokan, T.; Loth, M.; Stegmann, J.; Hartmann, K.-H.; Kruse, H.; Kabelac, S. Experimental results of an absorption-compression heat pump using the working fluid ammonia/water for heat recovery in industrial processes. Int. J. Refrig. 2019, 99, 59–68. [Google Scholar] [CrossRef]
  16. Vorster, P.P.J.; Meyer, J.P. Wet compression versus dry compression in heat pumps working with pure refrigerants or non-azeotropic binary mixtures for different heating applications. Int. J. Refrig. 2000, 23, 292–311. [Google Scholar] [CrossRef]
  17. Zhang, S.; Wang, H.; Guo, T. Experimental investigation of moderately high temperature water source heat pump with non-azeotropic refrigerant mixtures. Appl. Energy 2010, 87, 1554–1561. [Google Scholar] [CrossRef]
  18. Fujita, Y.; Tsutsui, M. Heat transfer in nucleate pool boiling of binary mixtures. Int. J. Heat Mass Transf. 1994, 37, 291–302. [Google Scholar] [CrossRef]
  19. Jung, D.; Song, K.; Ahn, K.; Kim, J. Nucleate boiling heat transfer coefficients of mixtures containing HFC32, HFC125, and HFC134a. Int. J. Refrig. 2003, 26, 764–771. [Google Scholar] [CrossRef]
  20. Gong, M.; Wu, Y.; Ding, L.; Cheng, K.; Wu, J. Visualization study on nucleate pool boiling of ethane, isobutane and their binary mixtures. Exp. Therm. Fluid Sci. 2013, 51, 164–173. [Google Scholar] [CrossRef]
  21. Gupta, P.; Hayat, M.; Srivastava, R. A Review on Nucleate Pool Boiling Heat Transfer of Binary Mixtures. Asian J. Water Environ. Pollut. 2019, 16, 27–34. [Google Scholar] [CrossRef]
  22. Fazel, S.A.A. A genetic algorithm-based optimization model for pool boiling heat transfer on horizontal rod heaters at isolated bubble regime. Heat Mass Transf. 2017, 53, 2731–2744. [Google Scholar] [CrossRef]
  23. Rohsenow, W.M. A Method of Correlating Heat-Transfer Data for Surface Boiling of Liquids. J. Fluids Eng. 1952, 74, 969–975. [Google Scholar] [CrossRef]
  24. Mikic, B.B.; Rohsenow, W.M. A New Correlation of Pool-Boiling Data Including the Effect of Heating Surface Characteristics. J. Heat Transf. 1969, 91, 245–250. [Google Scholar] [CrossRef]
  25. Wen, D.; Wang, B. Effects of surface wettability on nucleate pool boiling heat transfer for surfactant solutions. Int. J. Heat Mass Transf. 2002, 45, 1739–1747. [Google Scholar] [CrossRef]
  26. Wang, C.H.; Dhir, V.K. Effect of Surface Wettability on Active Nucleation Site Density During Pool Boiling of Water on a Vertical Surface. J. Heat Transf. 1993, 115, 659–669. [Google Scholar] [CrossRef]
  27. Li, J.; Lin, L.; Li, S.; Yang, Z.; Duan, Y. Experimental study on nucleate pool boiling heat transfer characteristics of R32 + R1234yf binary mixtures. Appl. Therm. Eng. 2022, 205, 118047. [Google Scholar] [CrossRef]
  28. Stephan, K.; Körner, M. Berechnung des Wärmeübergangs verdampfender binärer Flüssigkeitsgemische: Berechnung des Wärmeübergangs verdampfender binärer Flüssigkeitsgemische. Chem. Ing. Tech. 1969, 41, 409–417. [Google Scholar] [CrossRef]
  29. Ünal, H. Prediction of nucleate pool boiling heat transfer coefficients for binary mixtures. Int. J. Heat Mass Transf. 1986, 29, 637–640. [Google Scholar] [CrossRef]
  30. Fujita, Y.; Tsutsui, M. Heat Transfer in Nucleate Boiling of Binary Mixtures. (Development of a Heat Transfer Correlation). JSME Int. J. Ser. B 1997, 40, 134–141. [Google Scholar] [CrossRef]
  31. Gropp, U.; Schlünder, E. The influence of liquid-side mass transfer on heat transfer and selectivity during surface and nucleate boiling of liquid mixtures in a falling film. Chem. Eng. Process. Process Intensif. 1986, 20, 103–114. [Google Scholar] [CrossRef]
  32. Inoue, T.; Kawae, N.; Monde, M. Characteristics of heat transfer coefficient during nucleate pool boiling of binary mixtures. Heat Mass Transf. 1998, 33, 337–344. [Google Scholar] [CrossRef]
Figure 1. A scheme of experimental procedure.
Processes 12 00368 g001
Figure 2. Reliability verification of experimental results.
Processes 12 00368 g002
Figure 3. Heat transfer coefficient of mixture.
Processes 12 00368 g003
Figure 4. The influences of EG concentration on wall superheat temperature.
Processes 12 00368 g004
Figure 5. Temperature glide of mixtures.
Processes 12 00368 g005
Figure 6. Surface tension and contact angle of mixtures.
Processes 12 00368 g006
Figure 7. Thermophysical properties of mixtures. (a) Density and viscosity, (b) thermal conductivity and specific heat capacity.
Processes 12 00368 g007
Figure 8. Dynamic contact angle of binary mixtures.
Processes 12 00368 g008
Figure 9. Comparisons of experimental data with predictions by classic correlations.
Processes 12 00368 g009
Figure 10. Comparisons of experimental data with predictions by ideal equation.
Processes 12 00368 g010aProcesses 12 00368 g010b
Figure 11. Bubble and dew point temperature curve.
Processes 12 00368 g011
Figure 12. Comparisons of experimental data with predictions by correlations for binary mixtures.
Processes 12 00368 g012
Figure 13. Schematic diagram of vapor–liquid equilibrium for binary mixtures.
Processes 12 00368 g013
Figure 14. Comparisons of experimental data with modified predictions.
Processes 12 00368 g014
Table 1. Parameter range and calculation uncertainty.
ParameterRangeUncertainty
q (kW/m2)8~3251.8~8.21%
Tw (K)373~4080.1%
Tsat (K)373~3820.1%
h (kW/m2·K)0~302.01~8.6%
Disclaimer/Publisher’s Note: The statements, opinions and data contained in all publications are solely those of the individual author(s) and contributor(s) and not of MDPI and/or the editor(s). MDPI and/or the editor(s) disclaim responsibility for any injury to people or property resulting from any ideas, methods, instructions or products referred to in the content.

