Abstract
The effects of reaction temperature, reaction time, heating rate, nitrogen flow rate, and catalyst quality on the oil yield and oxygen content in oil were investigated by using the single-factor principle. Too high and too low reaction temperature, nitrogen flow rate, heating rate, and reaction time improved the yield of bio-oil, but the oxygen content in bio-oil was higher. The reduction in catalytic dose is beneficial to the increase in oil yield but not conducive to the increase in aromatic compound content. The optimal reaction conditions were observed as a reaction temperature of 500 °C, a nitrogen flow rate of 110 mL/min, a heating rate of 20 °C/min, a reaction time of 15 min, a mass ratio of catalyst to coconut coat powder of 1, an oil yield of 4.97%, a water yield of 35.80%, and a solid yield of 30.78%. The gas yield was 28.45%, the oxygen content was 10.3%, and the aromatic compound content was 89.7%. The analysis of the catalytic cracking mechanism shows that most of the oxygen-containing compounds in bio-oil are generated into water and aromatic compounds by a catalytic cracking reaction at high temperature, thus removing oxygen.
1. Introduction
The depletion of fossil fuels and the negative environmental impact of their extraction and combustion [1] have prompted scientists to explore the development of alternative renewable energy sources, such as biomass energy [2,3,4]. Bio-oil obtained by biomass through rapid pyrolysis is an alternative to fossil fuels [5]. Bio-oil is a complex mixture that may contain water and fine solid particles. The molecular weight of bio-oil can range from 370 to 1000 g/mol and is highly dependent on the biomass source [6]. In general, it contains various chemicals such as organic acids, alcohols, aldehydes, ketones, phenols, esters, ethers, furans, etc. The biggest disadvantage of bio-oil obtained by rapid pyrolysis is that the high content of water and oxygen compounds results in poor quality, high viscosity, unstable storage, low calorific value, and high acidity.
Different materials have been proposed as catalysts for the pyrolysis process. Acid catalysts such as microporous zeolite, mesoporous aluminosilicate, and metal-modified zeolite have been extensively studied. Acid catalysts can promote dehydration, decarbonization, cracking, and aromatization reactions. Moreover, aromatization at the zeolite acid site leads to the formation of valuable monocyclic aromatic hydrocarbons and Benzene Toluene Xylene (BTX). ZSM-5 catalyst can obtain higher polycyclic aromatic hydrocarbons (PAHs) and lower monocyclic aromatic hydrocarbons (MAHs). Adding transition metal to the ZSM-5 catalyst can decrease the yield of PAHs and increase the yield of MAHs [7,8].
2. Experimental Section
2.1. Raw Materials
The coconut coat is dried and set aside. The dried coconut coat is cut into pieces and crushed with a grinder until the particle size is less than 250 μm. Then, the coconut coat powder is screened with a 60-mesh sieve. The zeolite of USY was used as a catalyst (Zhuo Ran Environmental Protection Technology (Dalian) Co., Ltd., Dalian, China).
Microwave Pyrolysis of Coconut Coat
The coconut-coated powder and zeolite of the USY catalyst are mixed evenly in a certain proportion and put into the material boat. Then, the material boat is placed in the middle of a CY-PY1100C-M microwave pyrolysis furnace (Hunan Changyi Microwave Technology Co., Ltd., Changsha, China) for catalytic pyrolysis. The pyrolysis furnace is purged with nitrogen (200 mL/min) for 30 min, and then the nitrogen flow is reduced to the set speed. The outlet of the pyrolysis furnace is successively connected with the condensing tube and the washing cylinder is equipped with water. After the parameter of temperature is set, the experiment can be started. The programmed heating is carried out, and after the temperature rises to the reaction temperature, the constant temperature reaction is performed for a period of time, and the microwave heating is turned off. During the experiment, the nitrogen gas will drive out the pyrolysis steam and diffuse into the round bottom flask with the condensate tube and the washing cylinder with water.
2.2. Single-Factor Experiment Design
The following five single factors were set: reaction temperature, reaction time, heating rate, nitrogen flow rate, and catalyst-to-coconut mass ratio. The influence of different factors on the yield of oil, water, gas, and solid reaction products and the influence of different factors on the composition of produced oil were investigated. After pyrolysis, collect the condensed liquid, separate the oil and water with dichloromethane, and weigh it separately. The solid yield is determined by the solid residue in the Material Boat. The gas yield is obtained by the difference method. The calculation formula is as follows:
YS = m1/m0
YL = m2/m0
YG = 100% - YS - YL
YW = m3/m0
YO = YL - YW
YS, YL, YG, YW, and YO, respectively, represent the solid yield, liquid yield, gas yield, water yield, and bio-oil yield; m0 indicates the biomass mass; m1 represents the mass of solid; m2 indicates the liquid mass after the reaction; and m3 represents the mass of water obtained by dichloromethane extraction after the reaction.
2.3. Characterization of Zeolite of USY Catalyst and Analysis of Catalytic Pyrolysis Products
The zeolite of the USY catalyst was characterized for XRD (5-90, step length 0.01, scan rate 10/min), SEM, and BET. Then, the biochar produced by microwave cracking was tested by BET and SEM. For the bio-oil of microwave cracking product, using gas chromatography–Mass Spectrometry(GC-MS)-analyzer, the chromatographic conditions of GC-MS analysis are up to 50 °C for 5 min, 10 °C/min to 300 °C, for 20 min; HP-5 column; inlet temperature of 250 °C; shunt ratio of 20:1; the carrier gas is helium and the flow rate is 1 mL/min.
3. Results and Discussion
3.1. The Results Characterization of the Catalyst
3.1.1. The XRD Representation Results of the Zeolite of USY
The characterization results in Figure 1 showed that the XRD characteristic peaks of catalyst zeolite of USY clearly combined with the standard spectrum PDF # 45-0112 formed the characteristic peaks at 6.31°, 10.31°, 12.97°, 15.93°, 19.03°, 20.74°, 24.07°, 27.53°, 31.04°, and 32.76°.
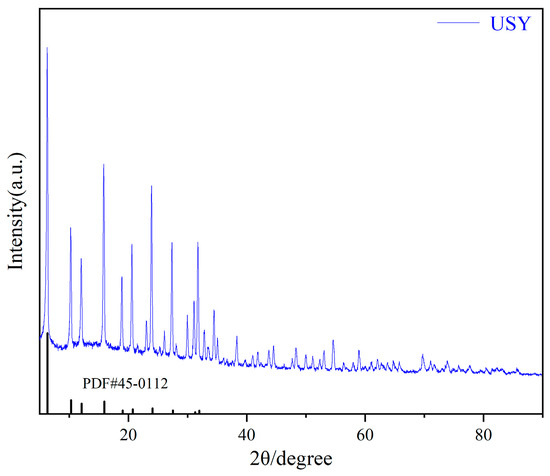
Figure 1.
The XRD characterization results of the zeolite of USY and standard spectrum.
3.1.2. BET Characterization Test Results for the Zeolite of USY
From Table 1, it can be seen that the specific surface area of the zeolite of USY is 792.29 m2/g. The pore volume is 0.41 cm3/g, and the average pore diameter is 6.08 nm. From Figure 2, it can be seen that the nitrogen absorption–desorption diagram of the zeolite of USY is the IV curve.

Table 1.
The zeolite of USY specific surface area, pore diameter, and hole volume.
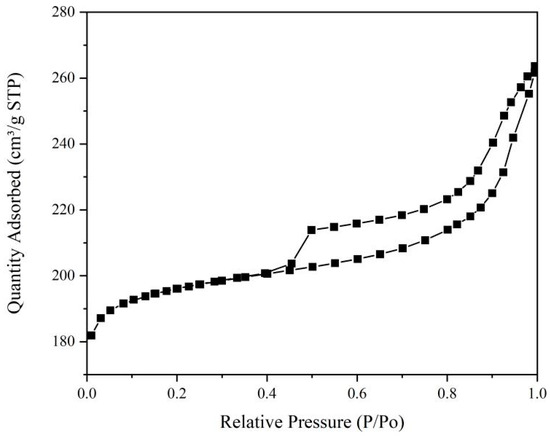
Figure 2.
Nitrogen absorption–desorption diagram of the zeolite of USY.
3.1.3. The SEM Characterization Results of the Zeolite of USY
The catalyst zeolite of USY was observed with 1 μm–200 nm resolution electron microscopy. As shown in Figure 3, the zeolite of USY has a compact hexagonal structure similar to diamond, the surface of the particles is relatively smooth, and many pores are formed.
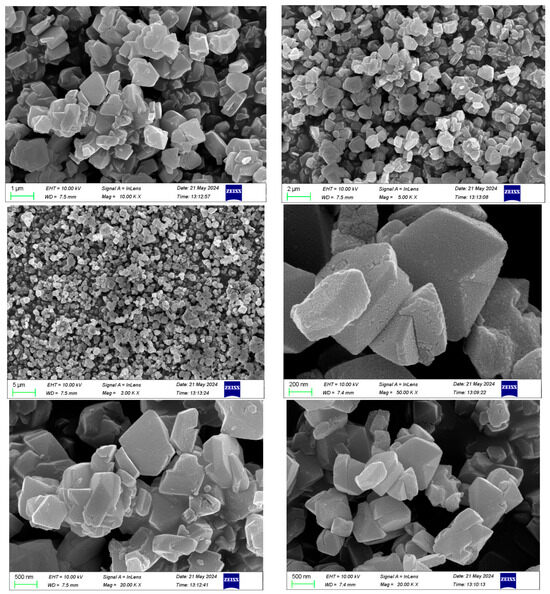
Figure 3.
SEM characterization of zeolite of USY.
3.2. Characterization Test Results of the Biochar
3.2.1. BET Characterization of Biochar
As can be seen in Figure 4 and Figure 5, the nitrogen absorption–desorption curve of catalytic pyrolysis biochar and pyrolysis biochar are similar to the type IV adsorption curve, but the hysteresis loop is not closed. As can be seen from Table 2, The specific surface area, pore volume, and average pore size of the two biochars differ greatly. The parameters of the catalytic biochar are larger. The specific surface area of the catalytic biochar is 290.23 m2/g and has a large specific surface area, with a pore volume of 0.17 cm3/g and an average pore diameter of 7.87 nm. The results show that the catalytic biochar is mainly mesoporous with a small pore size, while the non-catalytic biochar is mainly mesoporous with a large pore size, and the content of the small pore mesoporous is higher.
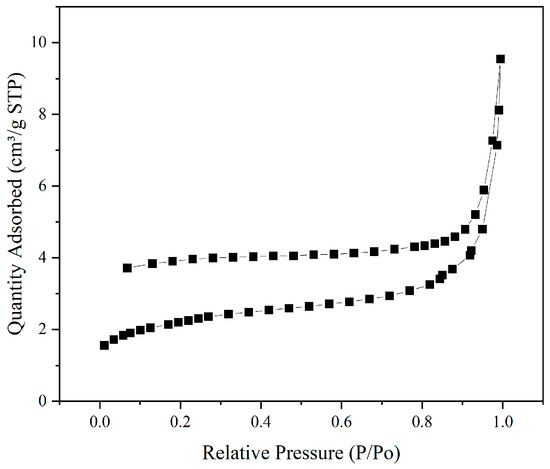
Figure 4.
Nitrogen absorption–desorption curve of biochar (without USY catalyst).
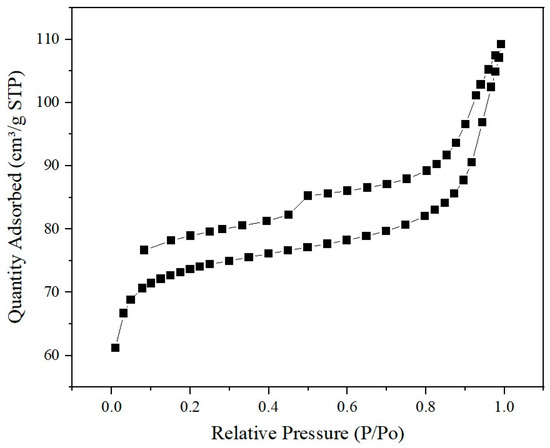
Figure 5.
Nitrogen absorption–desorption diagram of catalytic pyrolysis biochar.
Table 2.
Specific surface area, pore diameter, and pore volume of biochars.
3.2.2. The SEM Test Results of Biochar
According to Figure 6, the SEM of both biochar powders showed a certain flake structure, and there are no other distinguishing features.
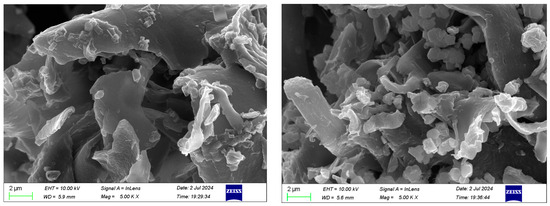
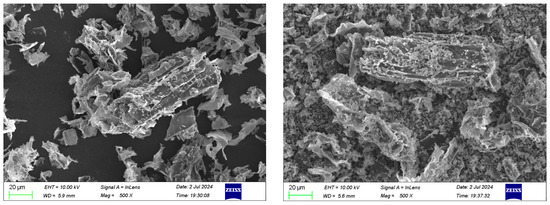
Figure 6.
The results of the biochemical carbon SEM (including the catalyst zeolite of USY).
4. Analysis of the Catalytic Pyrolysis Process of Coconut Coat
4.1. The Effect of Reaction Temperature
The test process parameters were as follows: nitrogen flow rate, 110 mL/min; heating rate, 20 °C/min; and reaction time, 15 min. The catalyst was as follows: coconut-coated powder = 1:1 and a change in the reaction temperature. The results are shown in Table 3. The oxygenated compounds in the table are mainly 4-hydroxy-4-methyl-2-pentanone and diacetone alcohol.
Table 3.
Yield and composition of the products at different temperatures.
According to Table 3, when only the reaction temperature is changed, with the increase in the reaction temperature, the yield of the bio-oil decreases first and then increases, while the yield of water increases first and then decreases. The solid yield reached a lowest of 26.9% at 550 °C and a highest of 31.48% at 600 °C. The gas yield was lowest at 28.45% at 500 °C and highest at 42.34% at 550 °C. The reaction temperature showed the lowest solid yield at 550 °C but the highest gas yield, indicating deep catalytic pyrolysis of the coconut coating at 550 °C. At the reaction temperature of 500 °C, although the lowest yield of the oil was 4.97%, the lowest amount of oxygen compounds was 10.3%, and the highest content of aromatic compounds was 89.7%. The highest number of oxygenated compounds at 600 °C was 17.8%, and the lowest aromatic compound content was 82.2%. Therefore, the appropriate temperature range for the catalytic pyrolysis was between 500 and 550 °C.
4.2. Heating Rate
The test process parameters were as follows: nitrogen flow rate, 110 mL/min; reaction temperature, 500 °C; and reaction time, 15 min. The catalyst was as follows: coconut-coated powder = 1:1 and a change in the heating rate. The results are shown in Table 4. The oxygenated compounds in the table are mainly 4-hydroxy-4-methyl-2-pentanone, diacetone alcohol, and a phenolic compound.
Table 4.
Yield and composition of products at different heating rates.
According to Table 4, the catalytic cracking oil yield with an increasing heating rate reached 11.87% at 25 °C/min, and the water rate was 24.68%, while the number of oxygenated compounds was 19.6%, which was also higher. At 30 °C/min, the oil yield was the lowest at 0.09%, the solid yield reached 33.47%, and the gas yield was largest at 41.81%, but the number of oxygenated compounds in the bio-oil was highest at 69.6%, and the aromatic compound was lowest at 30.4%. Too high a heating rate will reduce the oil yield and also increase the number of oxygenated compounds in the bio-oil. The high heating rate reduces the proportion of the pyrolysis oil for further catalytic cracking reaction, that is, the pyrolysis product fails to react adequately with the catalyst during the high-temperature pyrolysis process, leading to the high level of the oxygen-containing compound.
4.3. Nitrogen Flow
The test process parameters are as follows: heating rate, 20 °C/min; reaction temperature, 500 °C; and reaction time, 15 min. The catalyst was as follows: coconut-coated powder = 1:1 and a change in the nitrogen flow. The results are shown in Table 5. The oxygenated compounds in the table are mainly 4-hydroxy-4-methyl-2-pentanone and a phenolic compound.
Table 5.
Yield and composition of products under different nitrogen flow rates.
With the increase in nitrogen flow, oil production is the first to fall and then rise, the water product rate is the first to rise and then fall, the amount of oxygen compounds is the first to fall and then rise, and the content of aromatic compounds rises first and then fall. At 110 mL/min, the oil yield was the lowest and the highest aromatic compounds. Therefore, although too high and too low nitrogen flow is conducive to the increase in oil yield, it is not conducive to the catalytic cracking of thermal cracking oil to reduce the number of oxygen compounds and improve the content of aromatic compounds.
4.4. Reaction Time
The test process parameters are as follows: heating rate, 20 °C/min; reaction temperature, 500 °C; and nitrogen flow, 110 mL/min. The catalyst was as follows: coconut-coated powder = 1:1 and a change in the reaction time. The results are shown in Table 6 and Figure 7. The oxygenated compounds in the figure are mainly 4-hydroxy-4-methyl-2-pentanone and a phenolic compound.
Table 6.
The yield and composition of products at different reaction times.
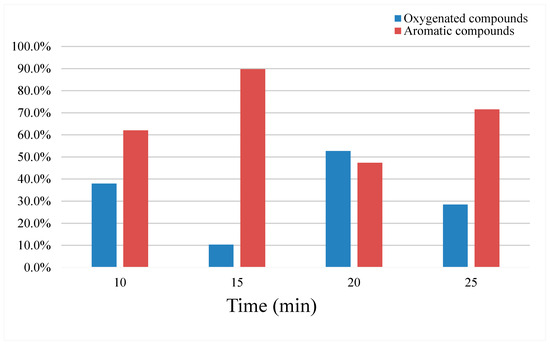
Figure 7.
The composition of bio-oil in different reactions time.
When the reaction time reached 20 min, the oil yield and solid were highest at 14.61% and 34.21%, respectively, and the lowest gas yield was 20.97%. At the reaction time of 25 min, the water product rate was lowest at 26.79%, and the gas yield was highest at 32.83%. However, the number of oxygenated compounds at 10 min, 20 min, and 25 min were 37.9%, 52.7%, and 28.4%, respectively, and the number of oxygenated compounds was much higher than 10.3% for 15 min. It shows that the degree of thermal cracking of coconut clothes also increases with the increase in reaction time. The catalytic cracking of coconut pyrolysis oil has the best effect if the reaction is 15 min. The catalytic cracking of the pyrolysis oil produces aromatic compounds, and the oxygen in oxygenated compounds is mainly removed in the form of water.
4.5. Mass Ratio of the Catalyst to the Coconut-Coated Powder
The reaction temperature is 500 °C, the reaction time is 15 min, the heating rate is 20 °C/min, and the nitrogen flow rate is 110 mL/min. The mass ratio of the catalyst and coconut powder is shown in Table 7 and Figure 8. The oxygenated compounds in the figure are mainly 4-hydroxy-4-methyl-2-pentanone and a phenolic compound.
Table 7.
Yield and composition of products under different quality ratios.
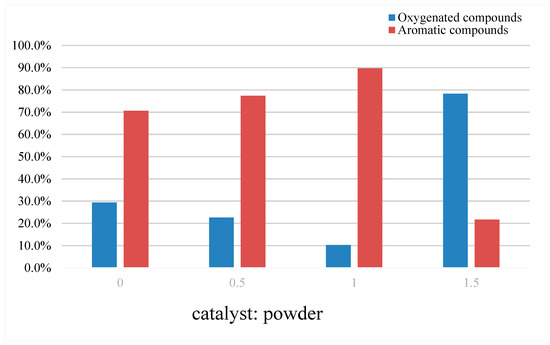
Figure 8.
Composition of the bio-oil under the different quality ratios.
With the increase in the catalyst quality ratio, the oil yield showed a trend of increasing after decreasing, and the maximum oil yield reached 10.58% at 0 g of the catalyst. The water rate showed a trend of gradual increase. Also, with a catalyst of 0 g, the water rate was lowest at 16.97%. The solid yield reached a maximum of 37.27% at a mass ratio of 0.5 and a gas yield of 36.69% at a mass ratio 0. The appropriate number of catalysts can cause the catalytic cracking of the coconut pyrolysis oil, which reduces the oxygenated compounds in the pyrolysis oil and increases the aromatic compounds and the yield of water, indicating that the oxygenated compounds in the cracking oil produce most water through catalytic cracking, so as to remove oxygen. Although the largest oil yield is obtained without the catalyst, the oxygen content reaches 29.4%. With the addition of the catalyst, the number of oxygenated compounds gradually decreases, but too much catalyst will increase the number of oxygenated compounds to a maximum of 78.3%. Therefore, the high number of catalysts is not conducive to the catalytic cracking reaction.
4.6. Analysis of the Catalytic Pyrolysis Mechanism
For the pyrolysis and catalytic pyrolysis of the coconut coating, the reaction temperature was 500 °C, and the other process conditions were also the same. The GC-MS analysis results of the pyrolysis oil components obtained from the pyrolysis comparative experiment of the coconut coating are shown in Table 8.
Table 8.
Analysis of the comparative experimental pyrolysis oil components.
As can be seen from Table 8, the distribution of coconut oil components is more than catalytic pyrolysis. The pyrolysis components of coconut are mainly phenol, phenanthrene, and other polycyclic aromatic hydrocarbons, containing 26.36%, 23.24%, and 47.29%, respectively. The catalytic pyrolysis oil components include phenanthrene, metaxylene, 4-hydroxy-4-methyl-2-pentenone, other polycyclic aromatic hydrocarbons, and ethylbenzene, containing 41.87%, 14.02%, 10.32%, 31.45%, and 2.34%, respectively. The bio-oil components of the pyrolysis comparative experiment showed that the high-temperature catalytic reaction of phenol, 2-methyl phenol, 2-methyl naphthalene, and naphthalene through the zeolite of the USY catalyst mainly produced phenanthrene and pyrene, followed by m-xylene and 4-Hydroxy-4-methyl-2-pentanone. Therefore, the zeolite of the USY catalyst performs the catalytic pyrolysis and condensation reaction of phenolics and naphthalene compounds at high temperatures, and the catalytic pyrolysis product is mainly m-xylene and 4-Hydroxy-4-methyl-2-pentanone. The phenolic oxygen-containing compounds are mainly decomposed into m-xylene and 4-hydroxy-4-methyl-2-pentanone by catalytic cracking so as to achieve the purpose of deoxidation. The calorific value of bio-oil is increased by catalytic pyrolysis deoxidation, which can be used as a biofuel or for chemical production.
The nitrogen flow rate was 110 mL/min, the heating rate was 20 °C/min, the reaction time was 15 min, the catalyst: coconut-coated powder = 1:1, and the analysis results of the catalytic cracking oil components with changing reaction temperatures were shown in Table 9.
Table 9.
Analysis of the catalytic cracking oil components at different temperatures.
As can be seen from Table 9, the temperature had an obvious effect on the components of catalytic pyrolysis oil. With the increase in pyrolysis temperature, the content of naphthalene in catalytic pyrolysis oil increased significantly from 0% to 42.27%, while the content of pyrene gradually decreased. When the temperature reached 600 °C, the amount of acenaphthylene, phenanthrene, and pyrene in the oil decreased to zero, indicating that acenaphthylene, phenanthrene, and pyrene undergo aromatic condensation reaction to produce biochar at high temperatures.
5. Conclusions
By analyzing the catalyst characterization, the zeolite of USY contains both SiO2 and Al2O3 components. The specific surface area was up to 792.2876 m2/g, the pore capacity was 0.407810 cm3/g, and the mean pore diameter was 6.0828 nm. The specific surface area of biochar after pyrolysis of coconut-coated powder with catalyst zeolite of USY was up to 290.2271 m2/g. The exploration of the influence of different experimental parameters on the catalytic pyrolysis reaction was conducted through single-factor experiments. Although the high and low reaction temperature, nitrogen flow, heating rate, and reaction time improved the yield of the bio-oil, the amount of oxygen compounds in the bio-oil was relatively high. The reduction in catalyst quantity is beneficial to improve the oil yield but not conducive to increasing the content of aromatic compounds. The optimal reaction temperature was 500 °C, the nitrogen flow rate was 110 mL/min, the heating rate was 20 °C/min, the reaction time was 15 min, the mass ratio of catalyst to coconut-coated powder was 1, the oil yield was 4.97%, the water product was 35.80%, the solid yield was 30.78%, the gas yield is 28.45%, the amount of oxygen compound was 10.3%, and the aromatic content was 89.7%. The analysis of the catalytic pyrolysis mechanism of the coconut coat shows that the phenolic oxygen-containing compounds are mainly decomposed into m-xylene and 4-hydroxy-4-methyl-2-pentanone, so as to achieve the purpose of deoxidation.
Author Contributions
Investigation, T.P.; Resources, S.Z.; Writing—original draft, M.G.; Project administration and Revised, J.L. All authors have read and agreed to the published version of the manuscript.
Funding
This work was supported by the Projects of Technical Innovation of Hainan Scientific Research Institutes (KYYSGY2023-002, SQKY2022-0039).
Data Availability Statement
Data are contained within the article.
Conflicts of Interest
The authors declare no conflict of interest.
References
- Isahakwn, R.W.; Hishamm, W.M.; Yarmo, M.A.; Hin, T.Y. A review on bio-oil production from biomass by using pyrolysis method. Renew. Sustain. Energy Rev. 2012, 16, 5910–5923. [Google Scholar] [CrossRef]
- Xiao, R.; Yang, W. Influence of temperature on organic structure of biomass pyrolysis products. Renew. Energy 2013, 50, 136–141. [Google Scholar] [CrossRef]
- Guedes, R.E.; Lunaas, A.S.; Torres, A.R. Operating parameters for bio-oil production in biomass pyrolysis: A review. J. Anal. Appl. Pyrolysis 2018, 129, 134–149. [Google Scholar] [CrossRef]
- Gupta, G.K.; Mondal, M.K. Bio-energy generation from sagwan sawdust via pyrolysis: Product distributions, characterizations and optimization using response surface methodology. Energy 2019, 170, 423–437. [Google Scholar] [CrossRef]
- Li, Y.; Li, B.; Zhang, X.; Chen, L.; Zhang, Q.; Wang, T.; Ma, L. Continuous pyrolysis and catalytic upgrading of corncob hydrolysis residue in the combined system of auger reactor and downstream fixed-bed reactor. Energy Convers Manag 2016, 122, 1–9. [Google Scholar] [CrossRef]
- Wang, S.; Chen, J.; Zhang, F.; Wang, Y. Chapter 6 Characterization and Separation of Bio-Oil, in Fast Pyrolysis of Biomass: Advances in Science and Technology; The Royal Society of Chemistry: London, UK, 2017; pp. 96–116. [Google Scholar]
- Sun, L.; Zhang, X.; Chen, L.; Zhao, B.; Yang, S.; Xie, X. Comparision of catalytic fast pyrolysis of biomass to aromatic hydrocarbons over ZSM-5 and Fe/ZSM-5 catalysts. J. Anal. Appl. Pyrolysis 2016, 121, 342–346. [Google Scholar] [CrossRef]
- Stefanidis, S.D.; Karakoulia, S.A.; Kalogiannis, K.G.; Iliopoulou, E.F.; Delimitis, A.; Yiannoulakis, H.; Zampetakis, T.; Lappas, A.A.; Triantafyllidis, K.S. Natural Magnesium Oxide (MgO) catalysts: A cost-effective sustainable alternative to acid zeolites for the in situ upgrading of biomass fast pyrolysis oil. Appl. Catal. B Environ. 2016, 196, 155–173. [Google Scholar] [CrossRef]
Disclaimer/Publisher’s Note: The statements, opinions and data contained in all publications are solely those of the individual author(s) and contributor(s) and not of MDPI and/or the editor(s). MDPI and/or the editor(s) disclaim responsibility for any injury to people or property resulting from any ideas, methods, instructions or products referred to in the content. |
© 2024 by the authors. Licensee MDPI, Basel, Switzerland. This article is an open access article distributed under the terms and conditions of the Creative Commons Attribution (CC BY) license (https://creativecommons.org/licenses/by/4.0/).