Abstract
The increasing global focus on carbon capture and storage (CCS) has highlighted the potential for offshore CO2 sequestration, particularly following recent successes in onshore projects. This research investigates the qualitative analysis of carbon trapping efficiency in offshore basins, employing a GEM simulator to incorporate factors such as aqueous solubility and geochemistry. The findings reveal that anticlines represent ideal geological structures for carbon storage, effectively trapping a significant portion of injected CO2. For effective mineralization, it is crucial to dissolve CO2 into saline aquifers to generate H+, which facilitates the release of Ca2+ and Al3+ from anorthite. This process leads to the dissolution of anorthite and the precipitation of kaolinite, while calcite transitions from a dissolved state to a precipitated state over time. The analysis indicates that structural trapping provides the highest storage contribution during the injection phase, whereas residual gas trapping becomes dominant by the end of the simulation. Notably, it is observed that the storage contribution of structural trapping decreases from 28.39% to 19.05%, and the percentage increase in storage contributions of residual gas, solubility, ionic, and mineral trapping are 4.12%, 3.25%, 1.69%, and 0.28% for CO2 plus water injection, thereby improving the long-term security of CO2 storage in offshore basins. It is most beneficial to optimize the layout and design of the injection well to ensure a uniform distribution of carbon dioxide and to increase the injection rate.
1. Introduction
Using comprehensive data collections of global area coverage over both land and ocean surfaces, parts of Central and South America, Africa, Europe, northeastern North America, and central Asia experienced record warm temperatures in October 2023 (Figure 1). The global surface temperature in October 2023 was 1.34 °C (2.41 °F) above the 20th-century average of 14.0 °C (57.1 °F), making it the warmest October on record [1]. The past 10 years (2014–2023) have been the warmest years on record (Figure 2). Global warming is one of the main challenges for future decades, threatening the security of human life and the sustainable development of society, according to the Intergovernmental Panel on Climate Change (IPCC) Report [2,3]. The National Climate Assessment (NCA) offers a comprehensive overview of climate hazards and offers a valuable resource for researchers and policymakers in the United States [4]. The European Climate Risk Assessment report straightforwardly outlines information on managing climate risks and highlights priority measures within each area [5]. The storage of carbon dioxide in deep formations is being actively considered as an effective measure against global climate change, supporting the reduction in greenhouse gas emissions [6]. According to previous investigations, saline aquifers, coal seam, oil and gas reservoirs, igneous rocks, and organic-rich shales are predominantly candidates for geological CO2 sequestration [7,8,9]. The global estimated carbon storage capacity for offshore basins is between 2000 Gt and 13,000 Gt [10,11,12,13].
Figure 1.
Selected significant climate anomalies and events (left) and land and ocean temperature percentiles (right).
Figure 2.
Temperature variation in the past 173 years (1850–2023) (Red bar indicates an increase in temperature, while blue bar indicates a decrease in temperature).
CO2 trapping mechanisms are mainly structural or stratigraphic and involve residual gas, solubility, and mineral trapping [14,15,16,17,18]. Several researchers have investigated the trapping mechanisms to carry out multiphase flows, reactive transport, and chemical reactions during carbon storage. The influence of capillary pressure and caprock factors on the leaked CO2 migration, distribution, and trapping has been quantitatively analyzed [19]. The efficiency of carbon mineralization and geochemical-induced changes resulting from mineralization trapping were analyzed for the siliciclastic aquifer [20]. Accounting for thermal effects, the phase conductivity and enthalpy have been derived, considering CO2 dissolution in brines, and the field simulation results illustrate that the dissolution increases immediately when the convection dominates CO2 migration [21]. Considering non-CO2 species in density-driven convective mixing, such as N2 and H2S, it is concluded that CO2 impurity would result in delayed onset and weakened convection [22]. Several studies have investigated the traditional four trapping mechanisms, providing valuable guidance for research in offshore basins.
There are many factors influencing CO2 mobility and carbon storage capacity, such as rock and fluid properties, pressure, temperature, permeability, reservoir heterogeneity, and so on. The compressibility of the rock and of the fluid could influence the carbon storage capacity [23,24]. A quick assessment of the CO2 storage capacity can be used to calculate the brine contributions in response to the estimated average pressure buildup in the field [25]. The effect of multi-scale heterogeneity on storage capacity, the design of injection wells, injection rate, CO2 plume migration, and CO2 potential leakage are investigated at the Rock Springs Uplift, Wyoming [26]. The relevance of representing relative permeability variations in the sealing formation is investigated, and the corresponding results illustrate that gradational changes at the base of the caprock could influence the pressure changes propagating vertically into the caprock from the saline aquifer [27].
Furthermore, many previous scholars have extensively investigated the measures required to maximize the carbon storage efficiency in a given reservoir. The selection of the optimal well location and extraction of native fluids from the storage reservoir can reduce the pressure build up, maximizing CO2 storage [28]. The varying amplitude and frequency of injection were found to have no significant influence on pressure build up, but may influence the injectivity and storage capacity. Water displacing CO2 in the post-injection period is considered an important procedure to improve injectivity and trapping efficiency [29,30]. However, there is very limited research regarding the qualitative analysis of carbon trapping efficiency in offshore basins.
Offshore basins generally hold vast reserves of oil and gas, and offshore exploration and production advances technology due to the demanding conditions of deep water and hash environments. Investing in offshore research and innovation facilitates the sustainable development of sustainable energy resources and contributes to mitigating climate change. There are some specific aspects of carbon trapping efficiency in offshore basins that have not been adequately studied. The impact of various geochemical reactions on CO2 behavior and trapping mechanisms in offshore environments remains underexplored. Variations in sediment types and their influence on CO2 solubility and trapping efficiency need more investigation, especially in heterogeneous formations. Therefore, it is necessary to advance the recognition of CO2 injection in offshore basins by incorporating the following potential factors in the calculation: (1) reservoir heterogeneity, (2) aqueous solubility and geochemical reactions occurred in the gas/brine system, and (3) the storage contribution calculation of the structural, residual gas, solubility, ionic, and mineral trapping in carbon sequestration. CO2 migration, the spatial distribution of dissolved species and minerals, and the storage contribution of each trapping mechanism are examined in the Wushi basin. Furthermore, the influence of water injection on the storage contribution of each mechanism is discussed.
2. Mathematical Formulations
The General Equation-of-State (EOS) Compositional Reservoir Simulator, GEM, is adopted for modeling aqueous solubility and geochemistry on CO2 storage in offshore basins. The flowchart of the methodology implemented in CMG is displayed in Figure 3.
Figure 3.
Flowchart of the methodology implemented in CMG.
2.1. Mass Transport Equations
Based on the mass balances of the gaseous phase in the geological system, the gaseous component transport equations are given as follows [31]:
For the aqueous component, the mass transport equation is expressed by
For the mineral, the mass transport equation follows
where represents the number of moles of gas component per volume unit of the grid, and the mole fractions of gas component in the gas phase and aqueous phase, respectively, the dispersion/diffusion of the gas component, the dispersion/diffusion of the aqueous component, the capillary pressure between the gas and water, the reaction rate between the gaseous and aqueous components, the reaction rate between the aqueous and aqueous component, the reaction rate between the aqueous and mineral component, the mineral reaction rate, the density of gas, the density of water, the gas relative permeability, the water relative permeability, the water pressure, and the depth.
2.2. CO2 Solubility
The Peng–Robinson equation of state (PR-EOS) was adopted to calculate the gas fugacity of a component [32]. Henry’s law is adopted to model the solubility in the aqueous phase, and the fugacity formula is as follows:
where is the fugacity of the component, is the composition of the component in the aqueous phase, and is Henry’s law constant (atmL/mol).
Henry’s law constant, at any pressure, , is calculated as follows:
where is a set of real numbers for the partial molar volume of the components in water at an infinite dilution, the reference pressures for the Henry’s law constants of the components (kPa), a set of real numbers for the reference of the Henry’s law constants of the components at the reference pressure (atmL/mol), the universal gas constant (8.314 JK−1mol−1), and the temperature (°C).
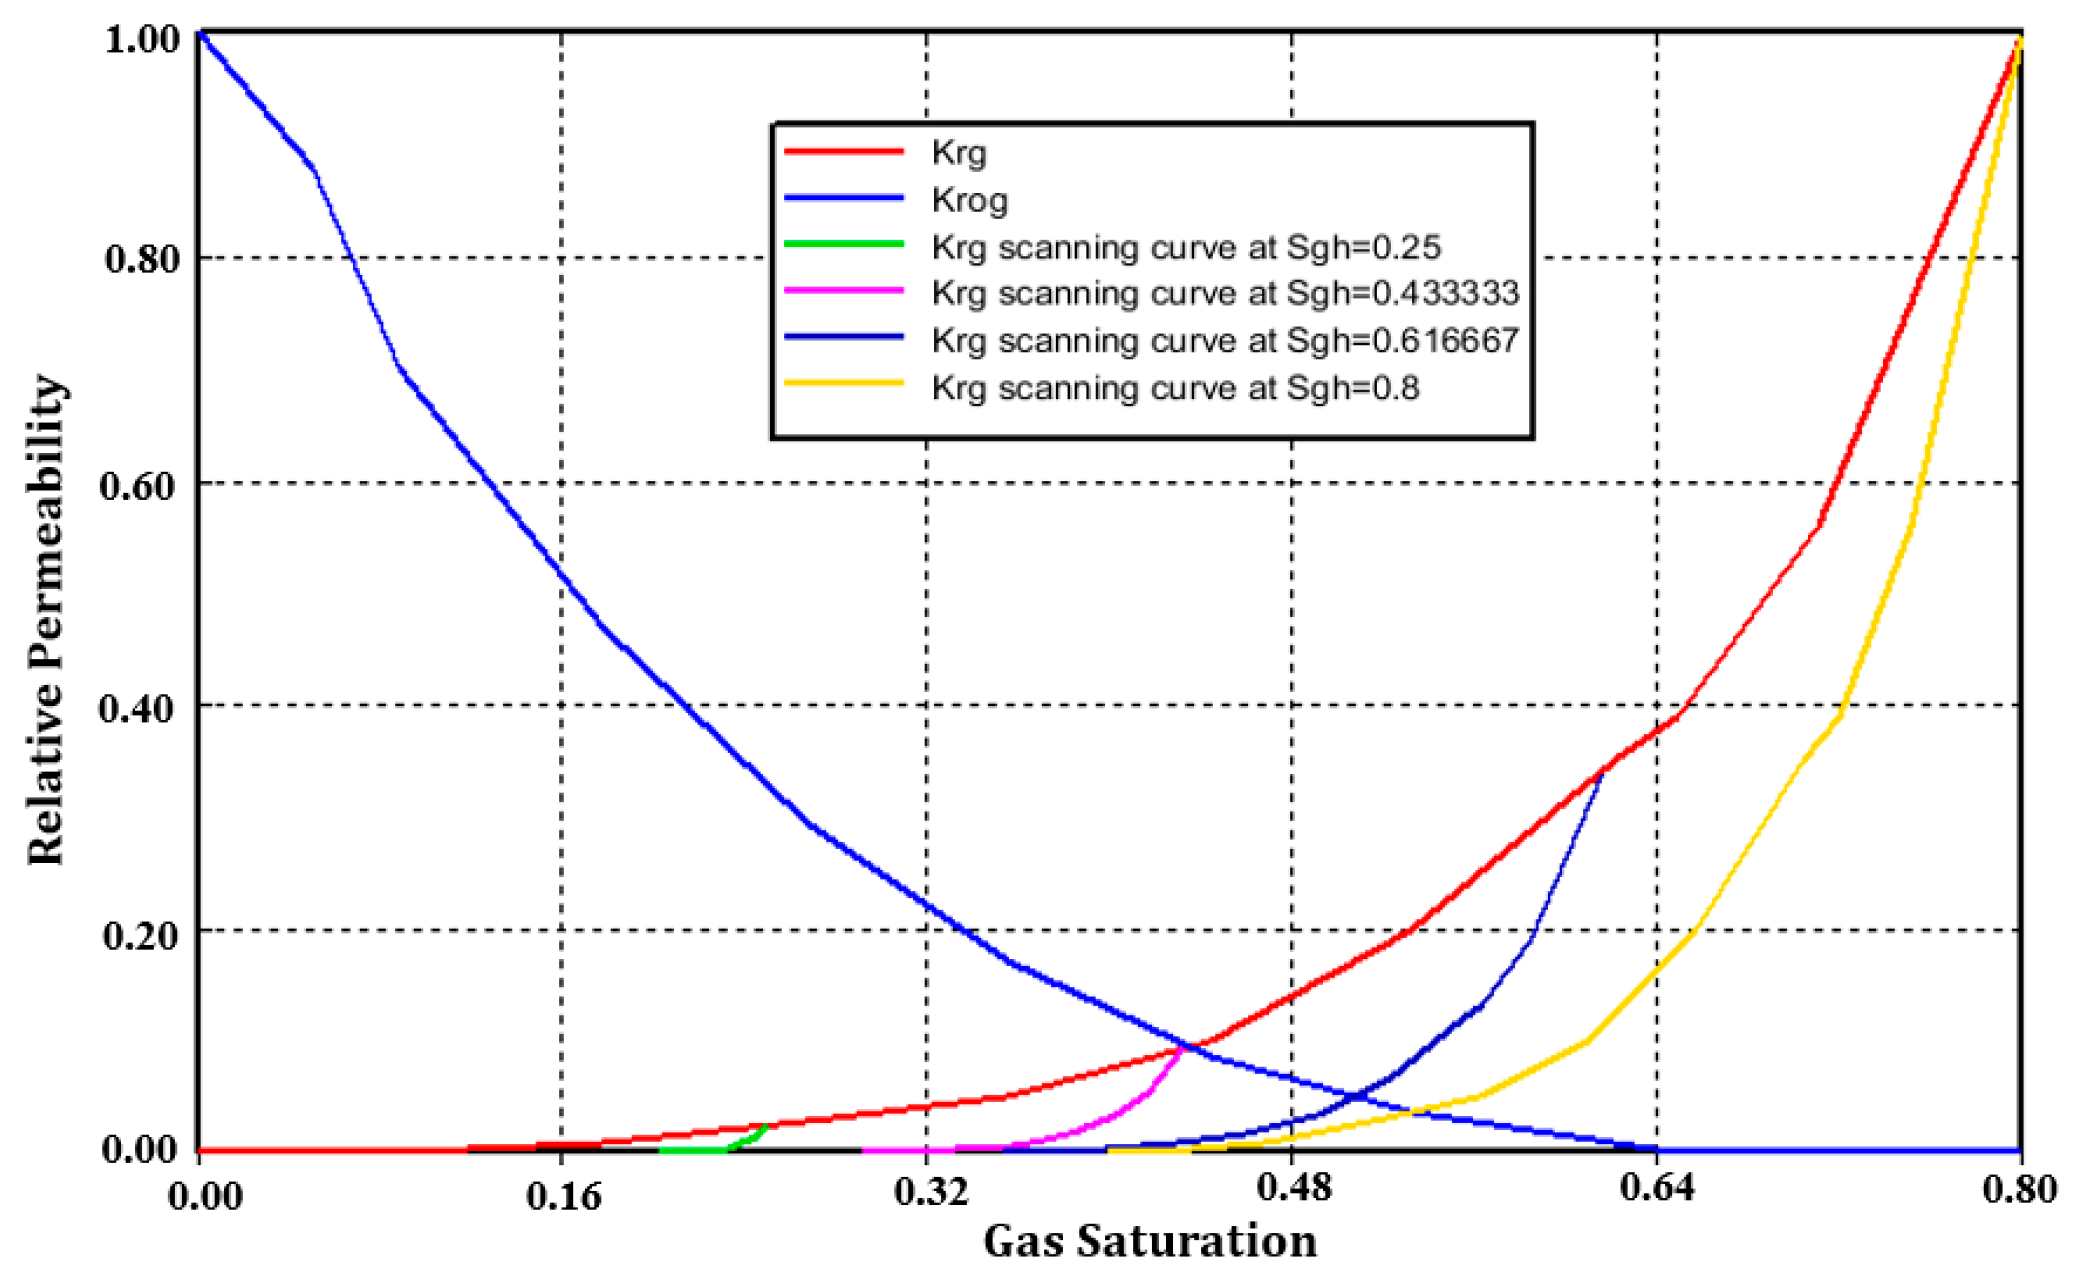
2.3. Model for Relative Permeability
Gas relative permeability hysteresis is considered by adjusting the maximum residual gas saturation, and the maximum CO2 residual saturation is 0.4. The relative permeability of CO2 () versus gas saturation () is shown in Figure 4.
Figure 4.
Gas relative permeability hysteresis ( is initially assumed to lie on the drainage curve; is the value of when the shift to imbibition occurs).
2.4. Reaction Stoichiometry
The reactions between aqueous components in the aqueous phase have the following stoichiometry [31]:
where is the number of reactions between the aqueous components, is the number of components in the aqueous phase, is the stoichiometric coefficient of component in the aqueous phase, and is the chemical symbol for the i-th aqueous species.
The dissolution or precipitation of a mineral chemical reaction can be expressed as follows [31]:
where is the number of reactions between the minerals and aqueous components and is the total number of components.
2.5. Chemical Equilibrium Reactions
The reactions between the aqueous components in the aqueous phase are considered to be chemical equilibrium reactions.
Chemical equilibrium constants are adopted to compute the following chemical equilibrium reactions [33]:
where is the activity product of the aqueous reaction , is the activity of component , is the stoichiometry coefficients, and is the chemical equilibrium constant for the -th aqueous reaction.
The activity is related to the molality as follows:
where is the activity coefficient.
The B-dot model is the preferred model to calculate the ionic activity coefficient:
where , , and are temperature dependent parameters and is the ion size parameter.
is the ionic strength parameter, expressed by the following:
where is the stoichiometric molality of the j-th ion, is the electric charge of the j-th ion.
2.6. Mineral Dissolution and Precipitation Reactions
The mineral dissolutions/precipitations of the solution are represented as rate-dependent reactions [33,34,35]:
where is the rate of the mineral reaction, is the reactive surface area for j-th mineral, is the rate constant of the j-th mineral reaction, is the chemical equilibrium constant for the j-th mineral reaction, and is the activity product of the aqueous reaction .
The rate of formation/consumption of the different aqueous species is calculated by the following:
The rate constant of the mineral reaction is reported at a reference temperature, :
where is the rate constant for reaction at , is the activation energy of the mineral reaction .
The reactivate surface area of the j-th mineral reaction is obtained:
where is the reactive surface area at the initial time, is the mineral mole number per unit grid block volume at the current time, and is the mineral mole number per unit grid block volume at the initial time.
With mineral dissolution and precipitation, the Kozeny–Carman equation is used to calculate the absolute permeability:
where and are the initial permeability and porosity, respectively.
2.7. CO2 Trapping Mechanisms
In order to establish a comparative analysis of storage contribution in CMG, the formulas below were adopted to calculate the storage contribution of each trapping:
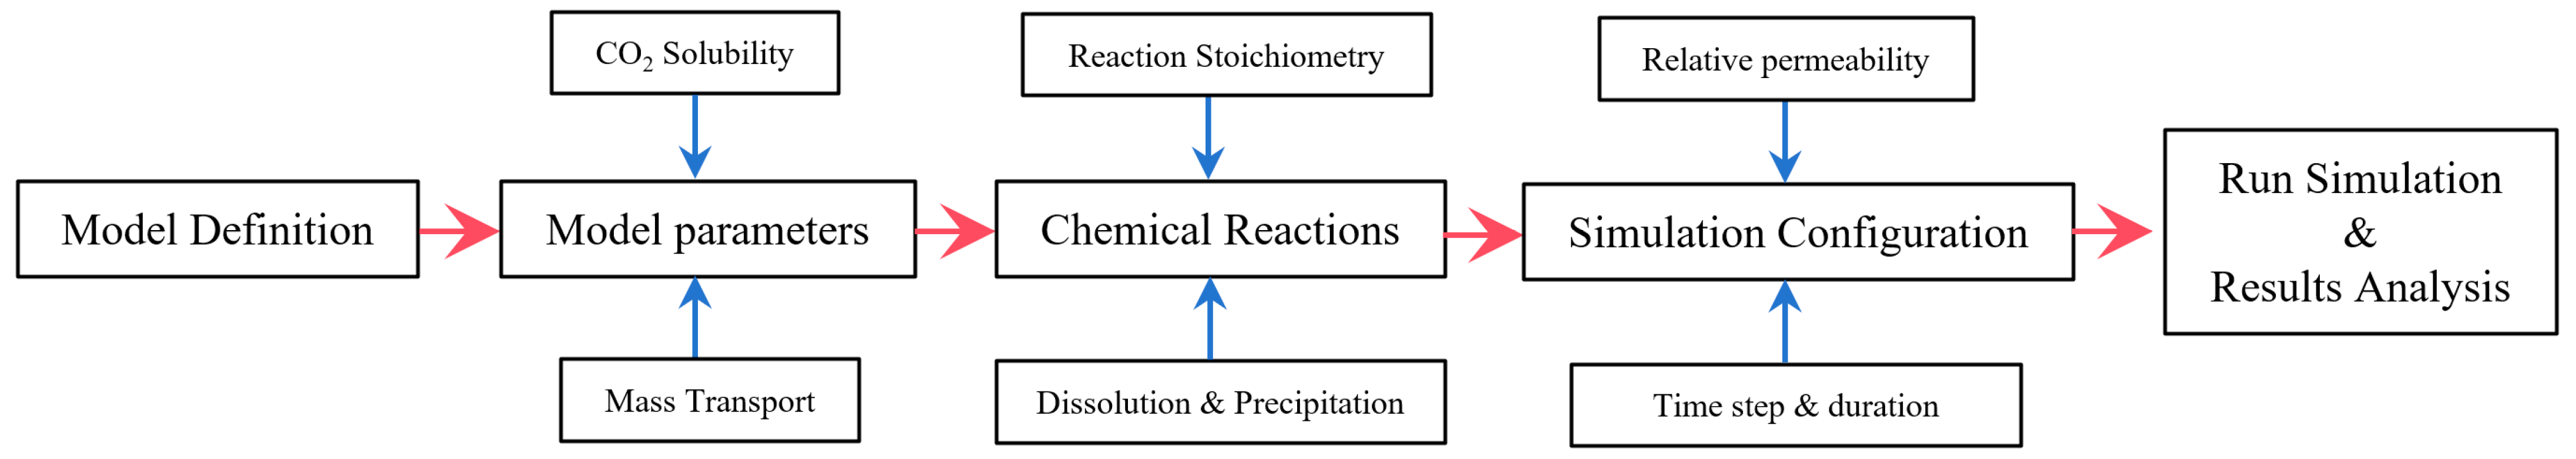
3. Model Description
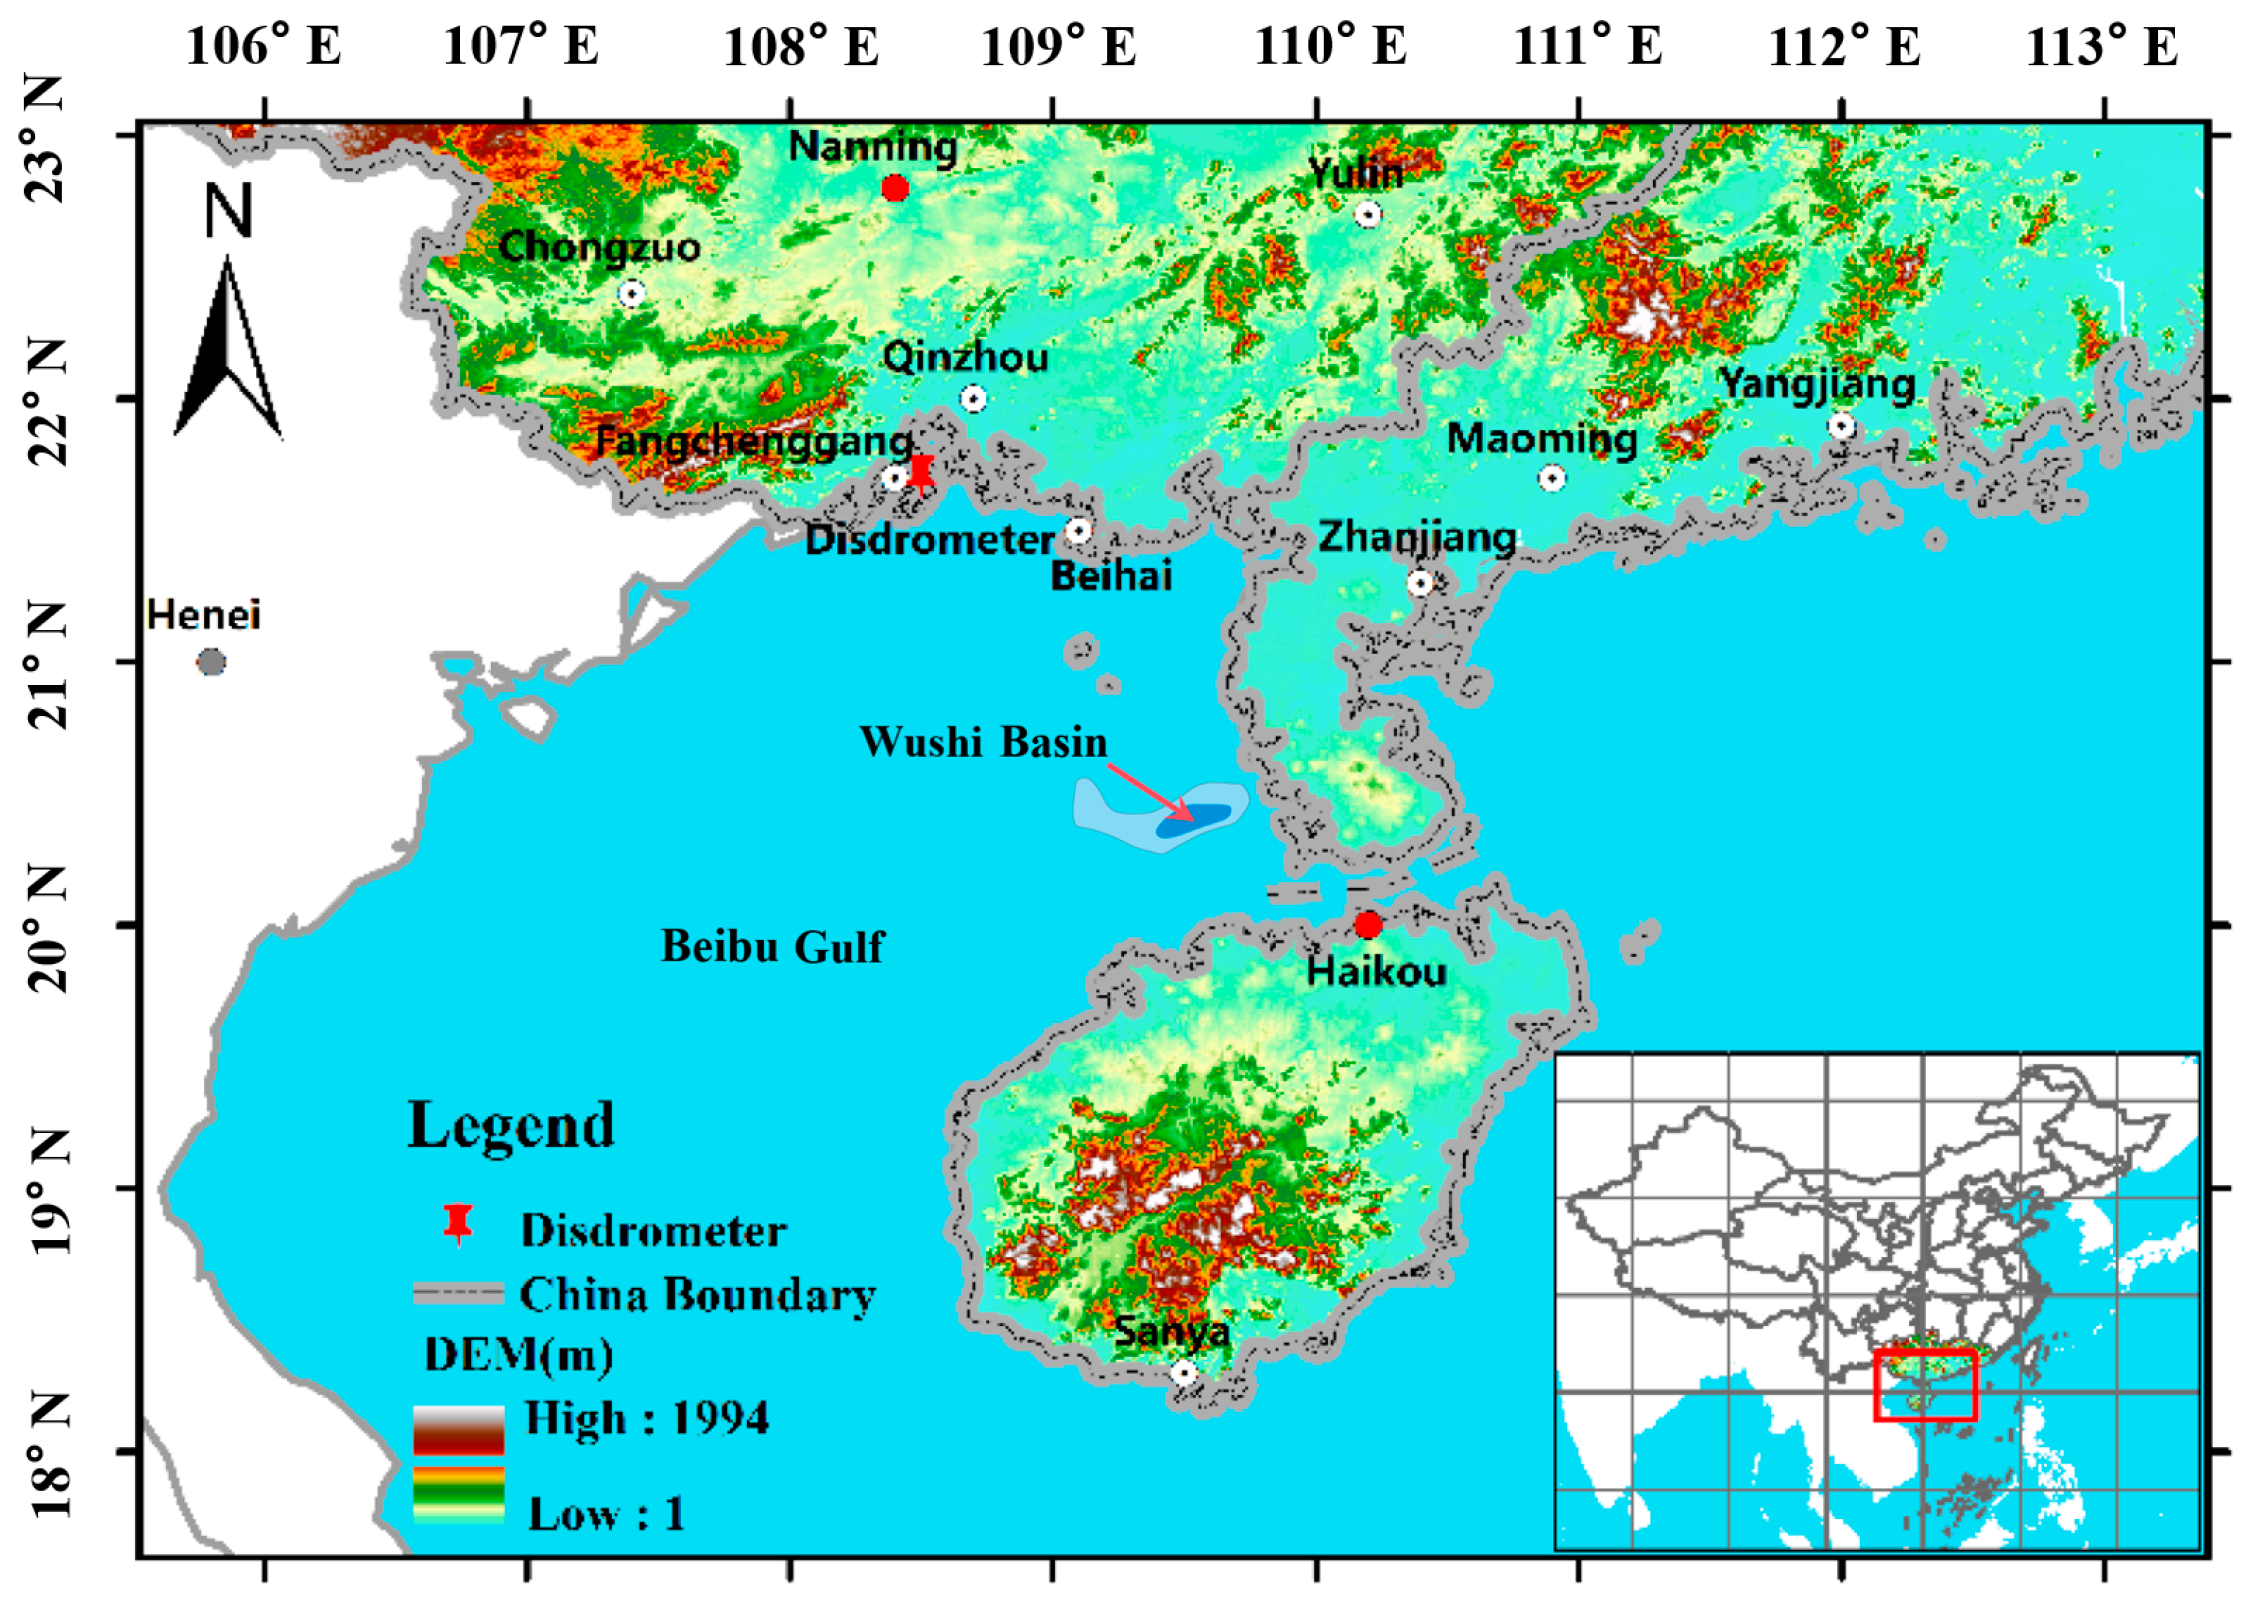
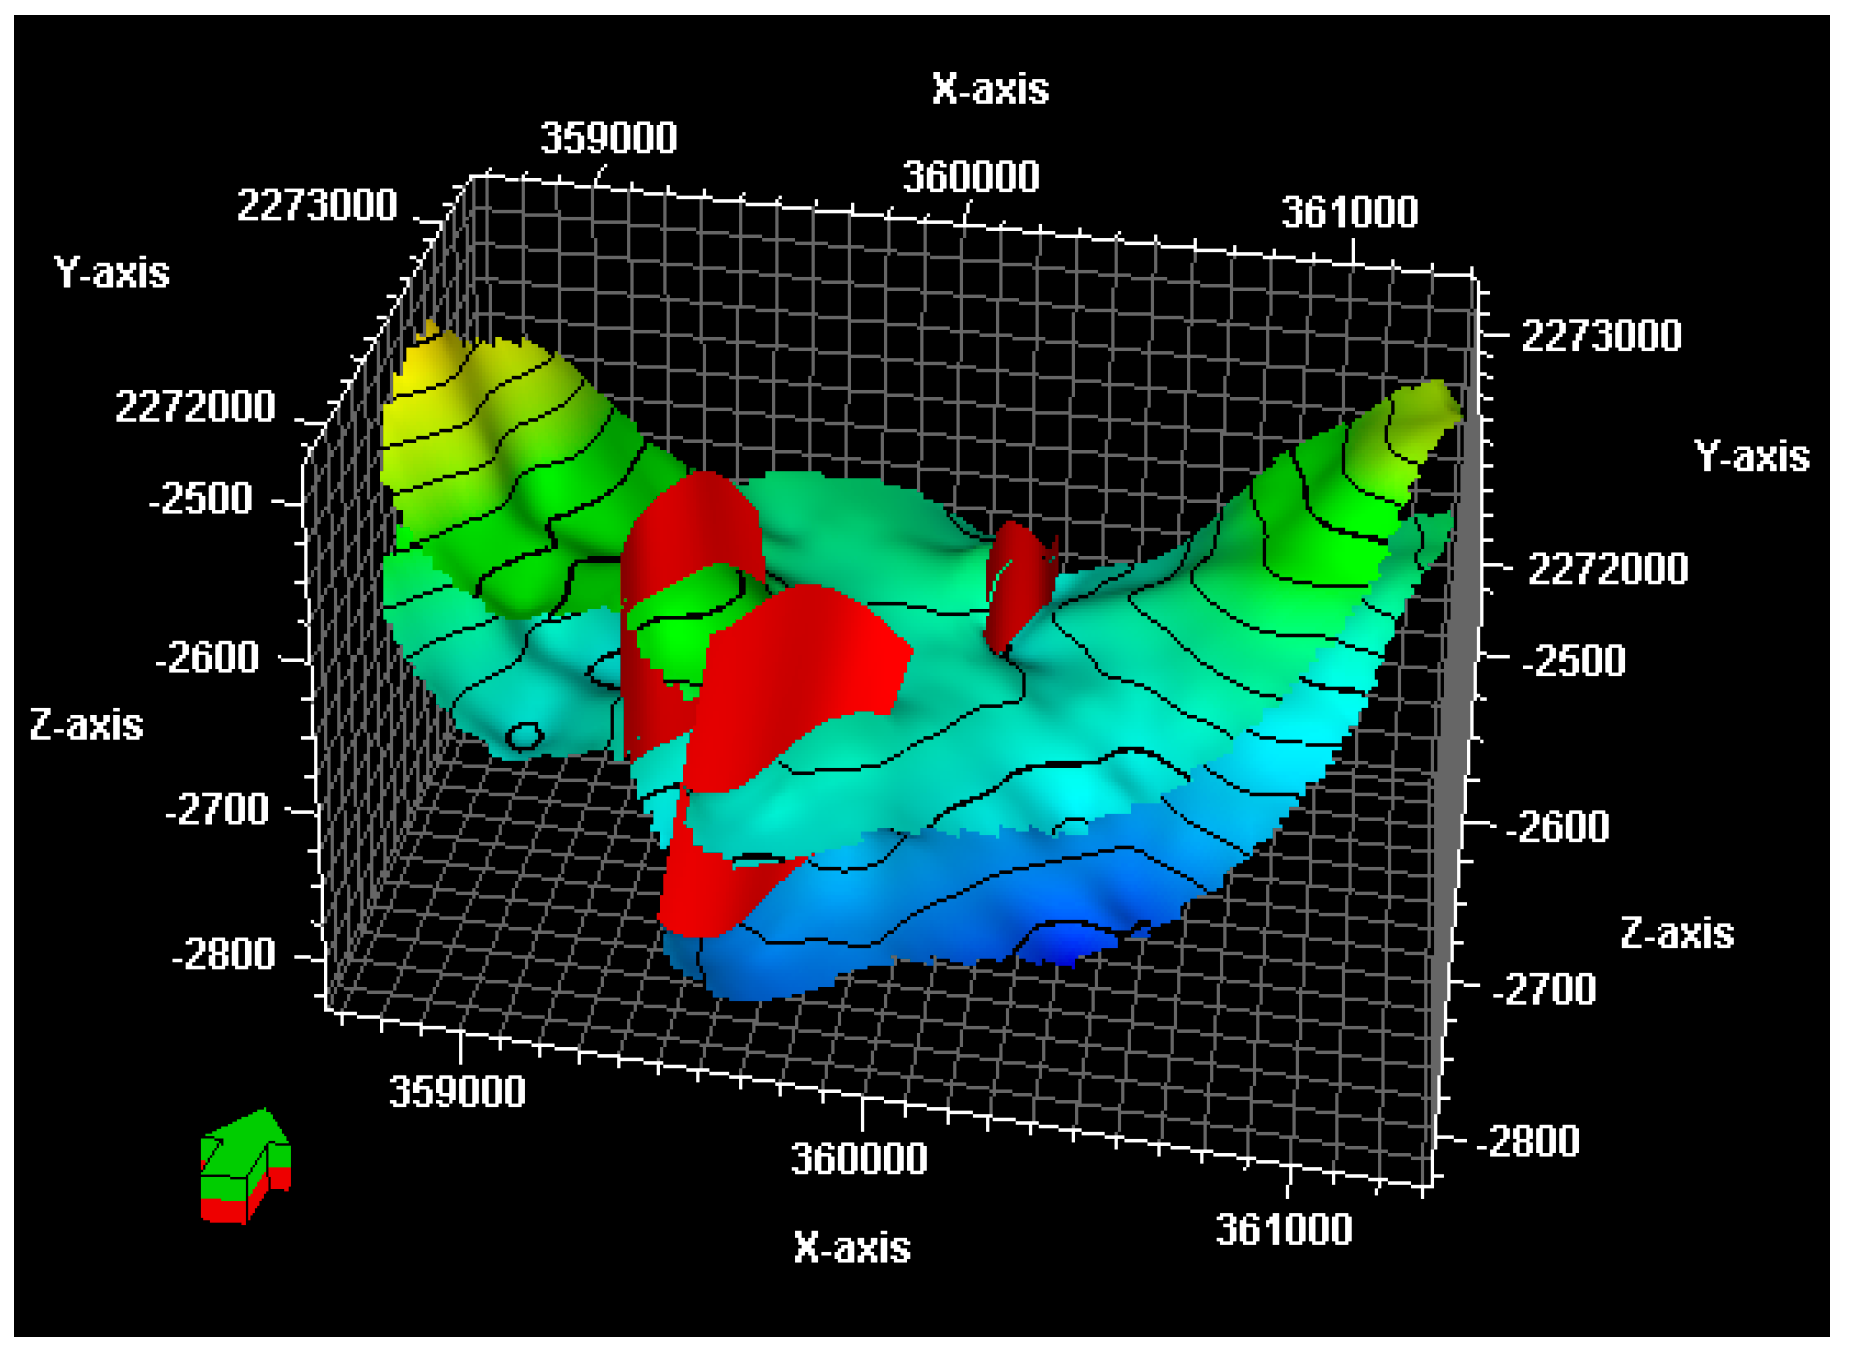
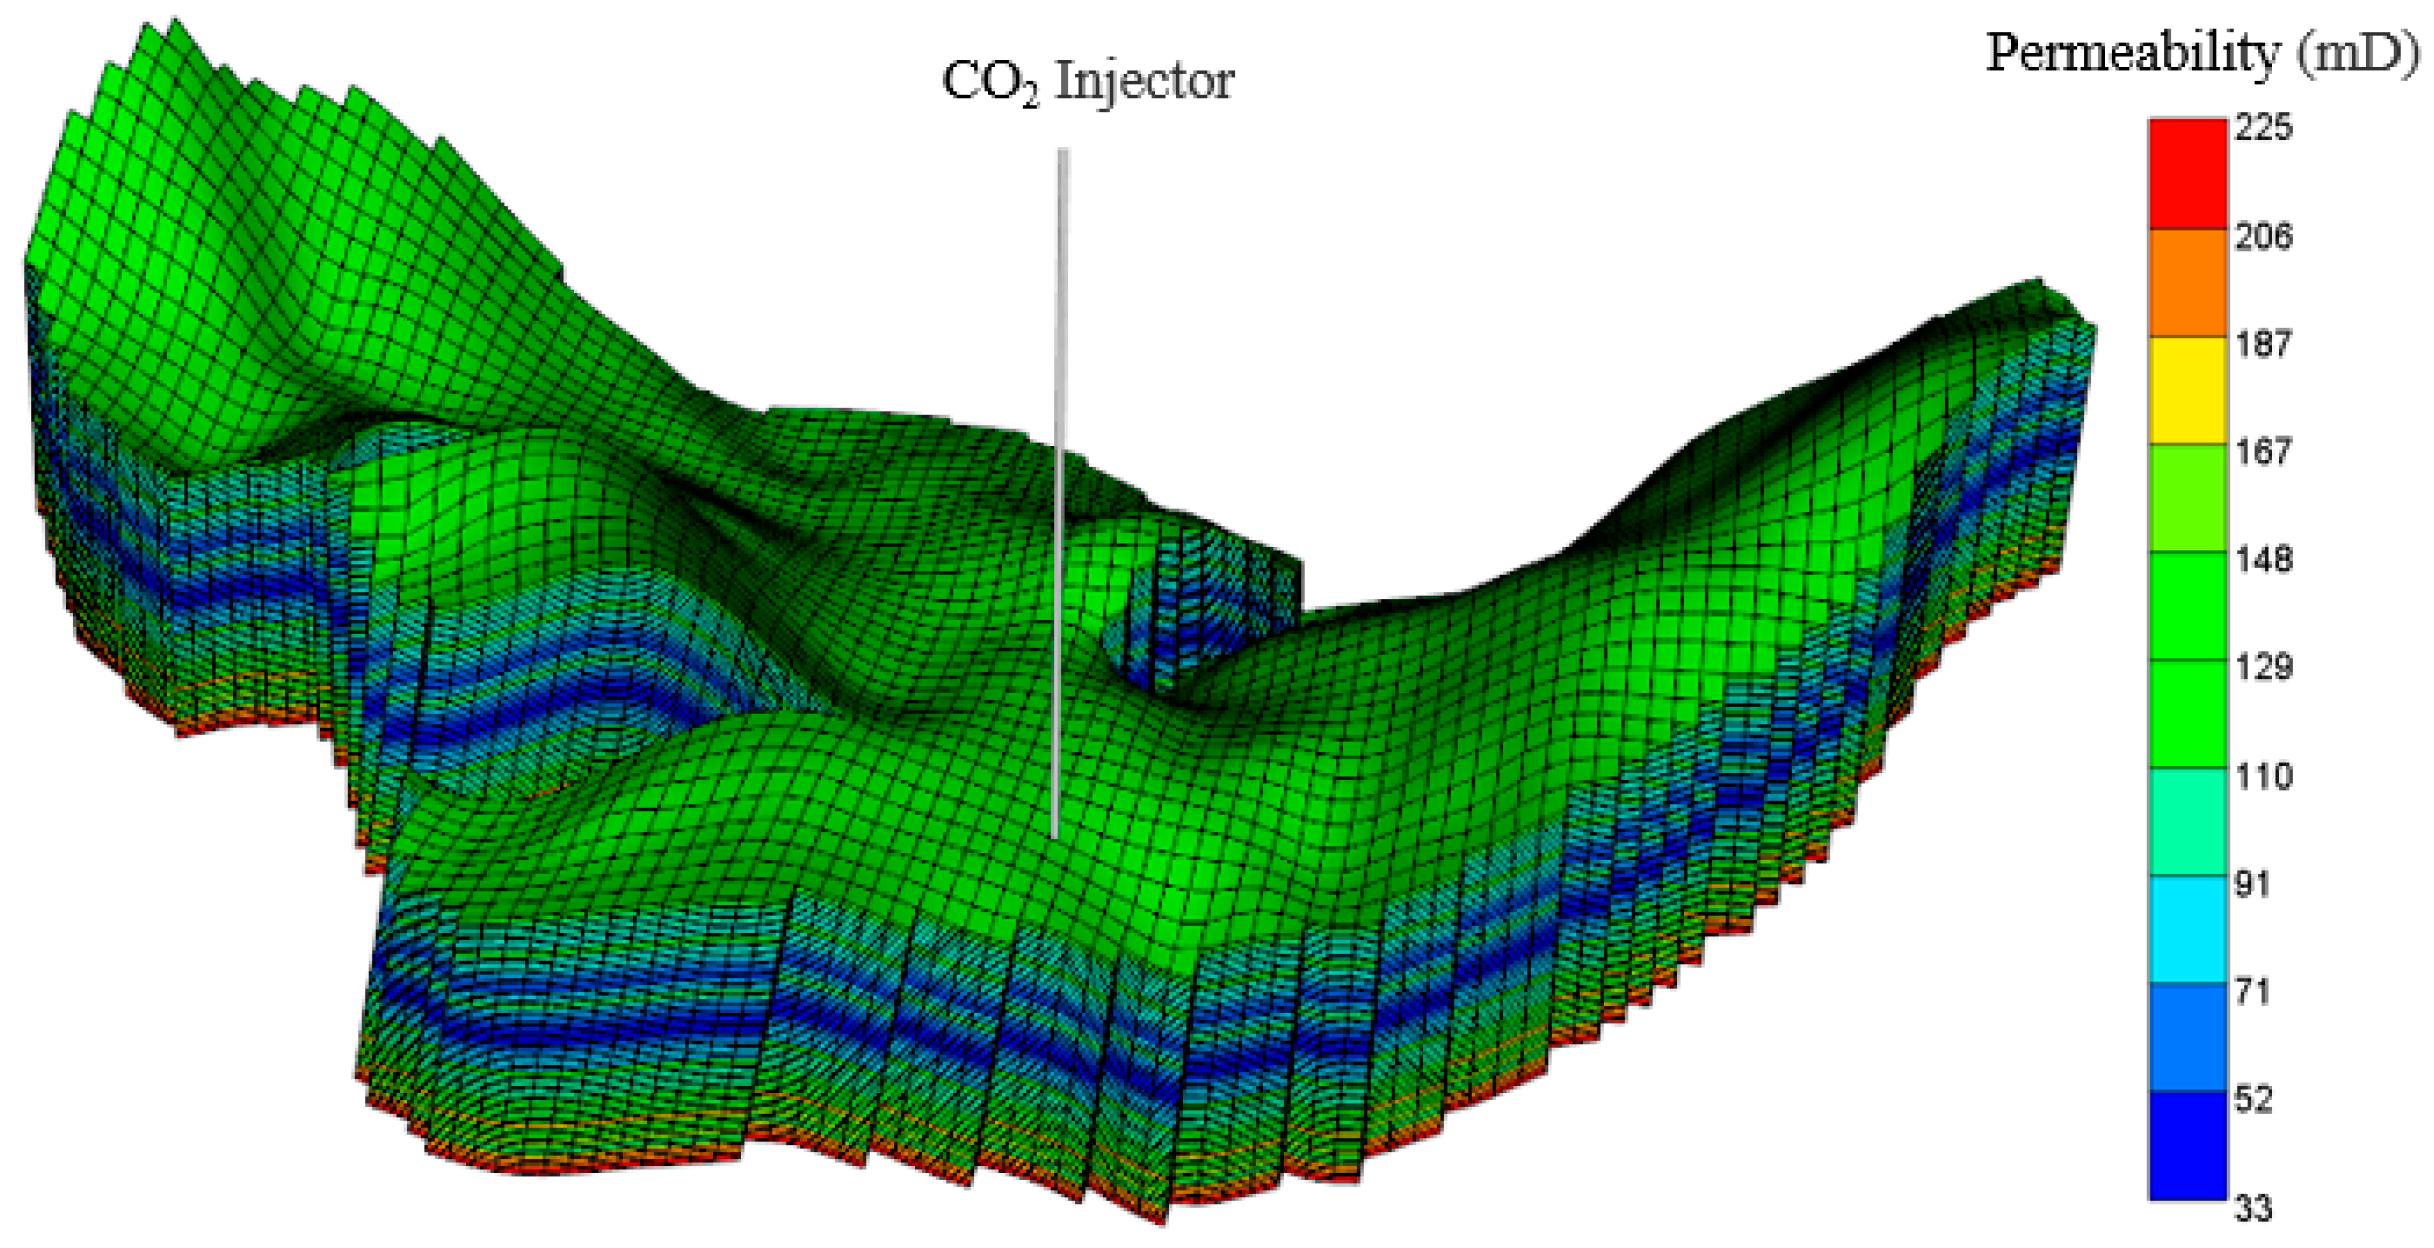
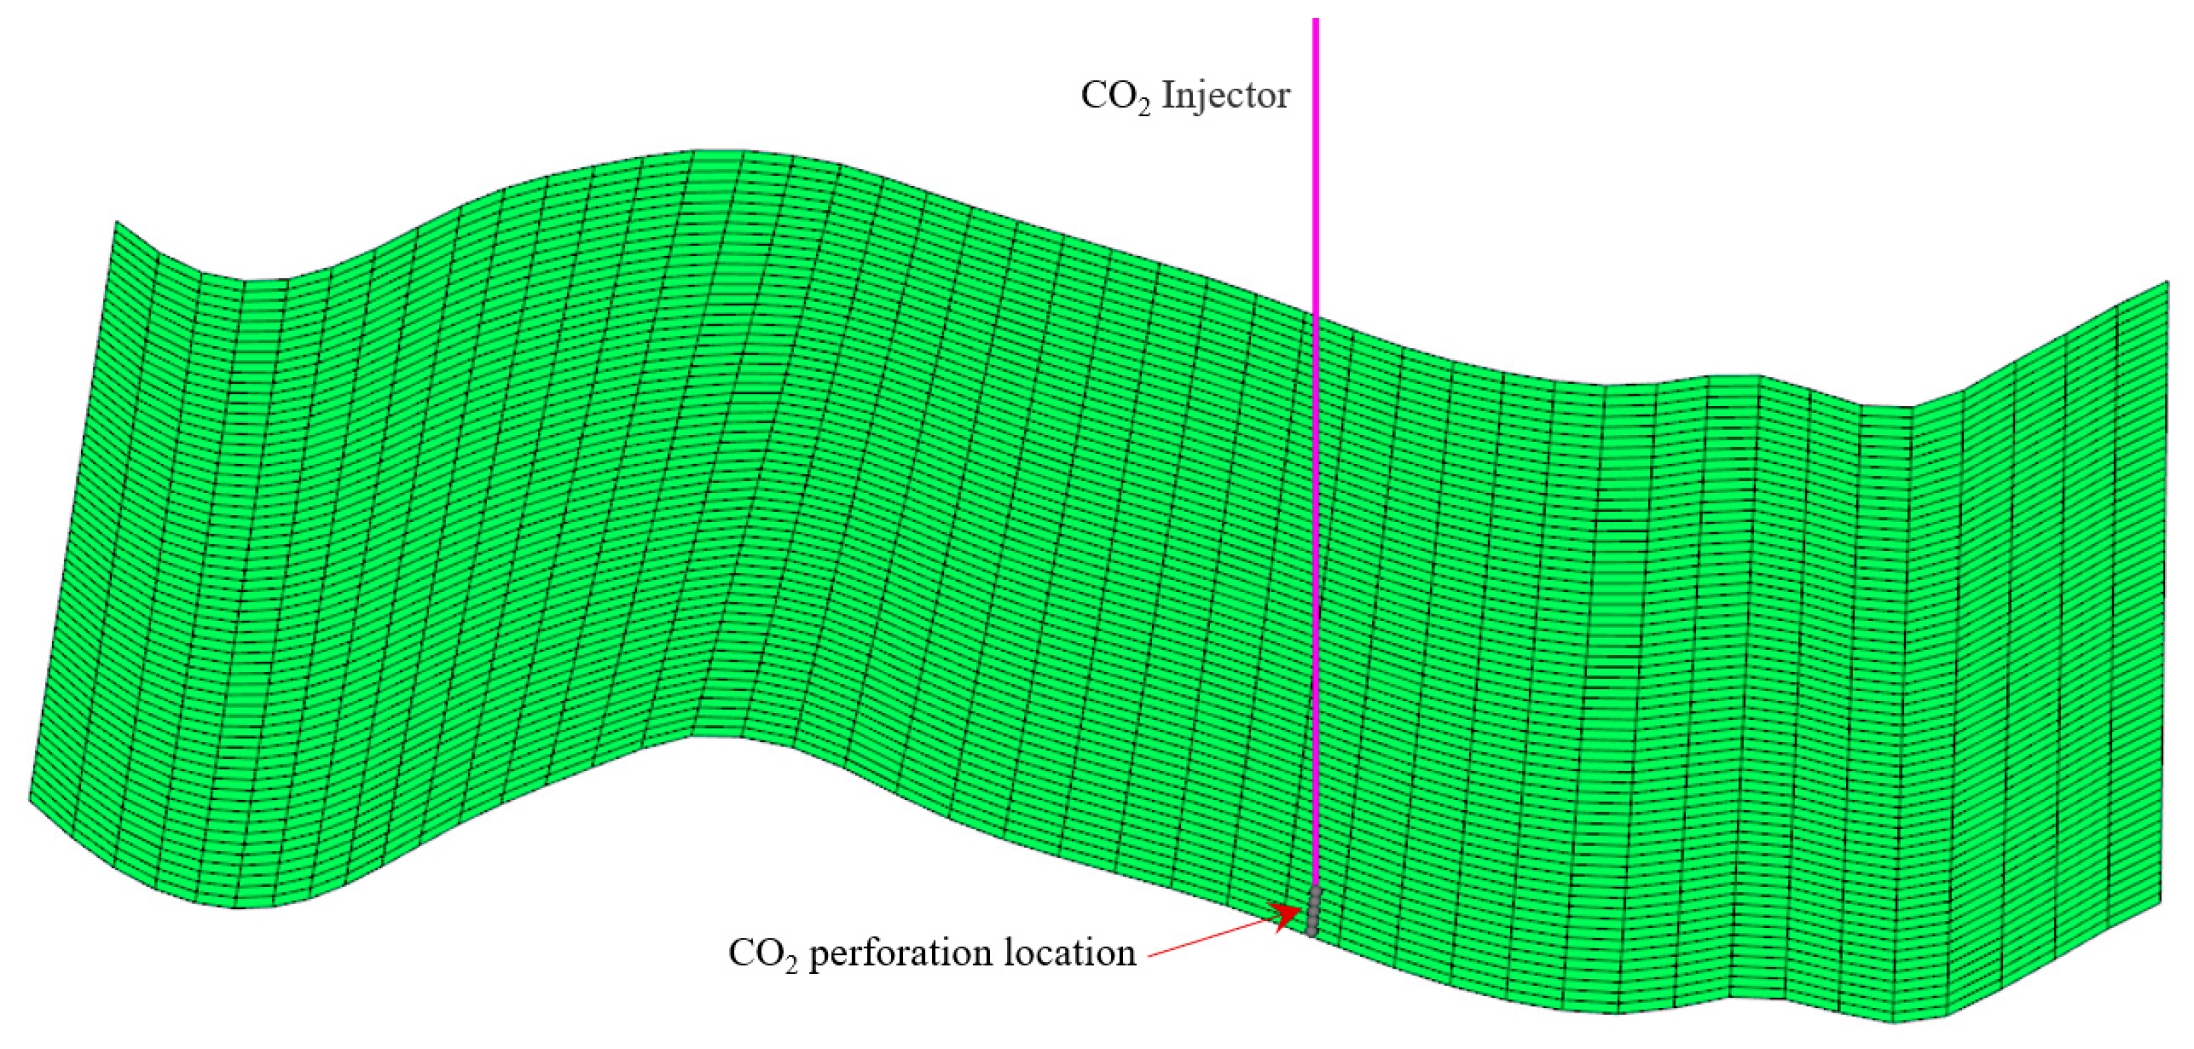
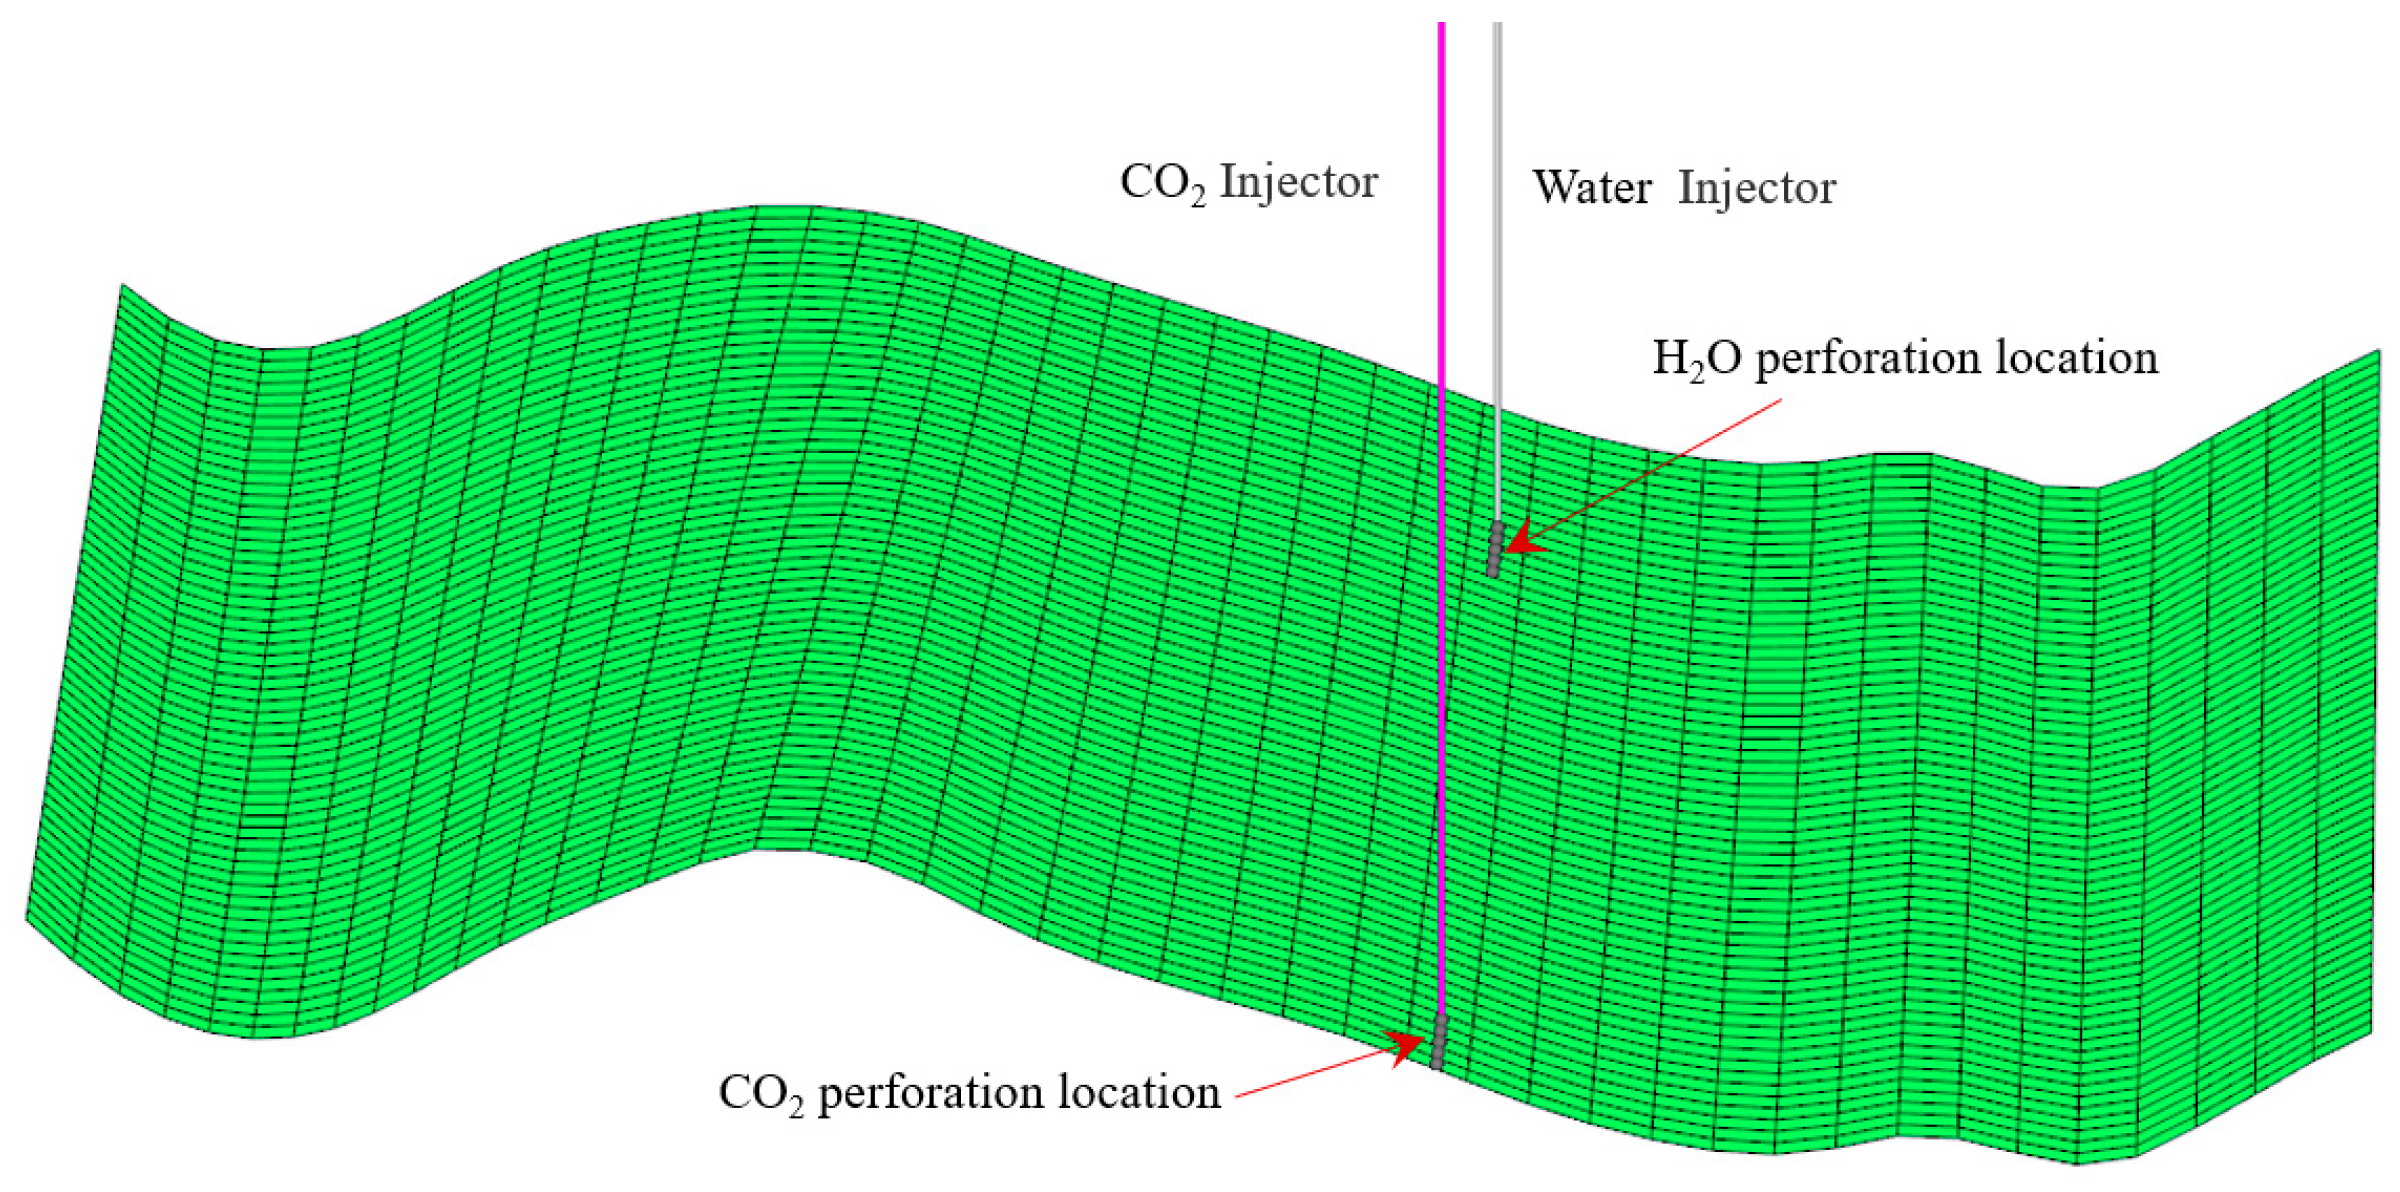
3.1. Geometric Model
The Wushi basin, located in the southern part of China, is one of the most favorable locations for oil and gas accumulation (Figure 5). The target CO2 injection formation for this investigation is the Wei-2 formation. Based on the geological and petrophysical characteristics revealed by the borehole analyses, a Wei-2 sandstone formation, with a thickness of about 150 m, displays a strong lithological heterogeneity. The upper part of the Wei-2 sandstone formation comprises thick gray mudstone, maintaining caprock integrity. The Wei-2 formation is truncated by three faults, and the strike of the faults runs NE to SW (Figure 6). The permeability of the multilayered reservoir was calculated by the Sequential Gaussian Simulation method, using the SGSIM code (Figure 7).
Figure 5.
Location of the Wushi basin.
Figure 6.
Three-dimensional model of the formation (light green layer) and fault (red planes) setting in the Wushi basin.
Figure 7.
Three-dimensional model of CO2 injection in the Wushi basin.
The static grid model parameters and reservoir parameters are given in Table 1.
Table 1.
Summary of the parameters adopted for CO2 injection.
3.2. Geochemical System
There are three solubility reactions and three liquid–mineral reactions in the geochemistry system:
H2O ⇔ H+ + OH−
Anorthite + 8H+ ⇔ Ca2+ +2Al3+ + 2SiO2 (aq) + 4H2O
Kaolinite + 6H+ ⇔ 2Al3+ +2SiO2 (aq) + 5H2O
The composition of the formation’s initial water condition is described in Table 2. The chemical equilibrium constants for the three aqueous reactions are given in Table 3. The simulated cases with two different injection schemes for carbon storage are listed in Table 4. Parameters for mineral dissolution/precipitation calculation are given in Table 5.
Table 2.
Initial concentrations of the aqueous species in the geochemical system.
Table 3.
Chemical equilibrium constants for aqueous reactions [36,37,38].
Table 4.
Two different injection schemes for carbon storage.
Table 5.
Summary of the parameters adopted for GCS [36,37,38].
4. Simulation Results and Discussion
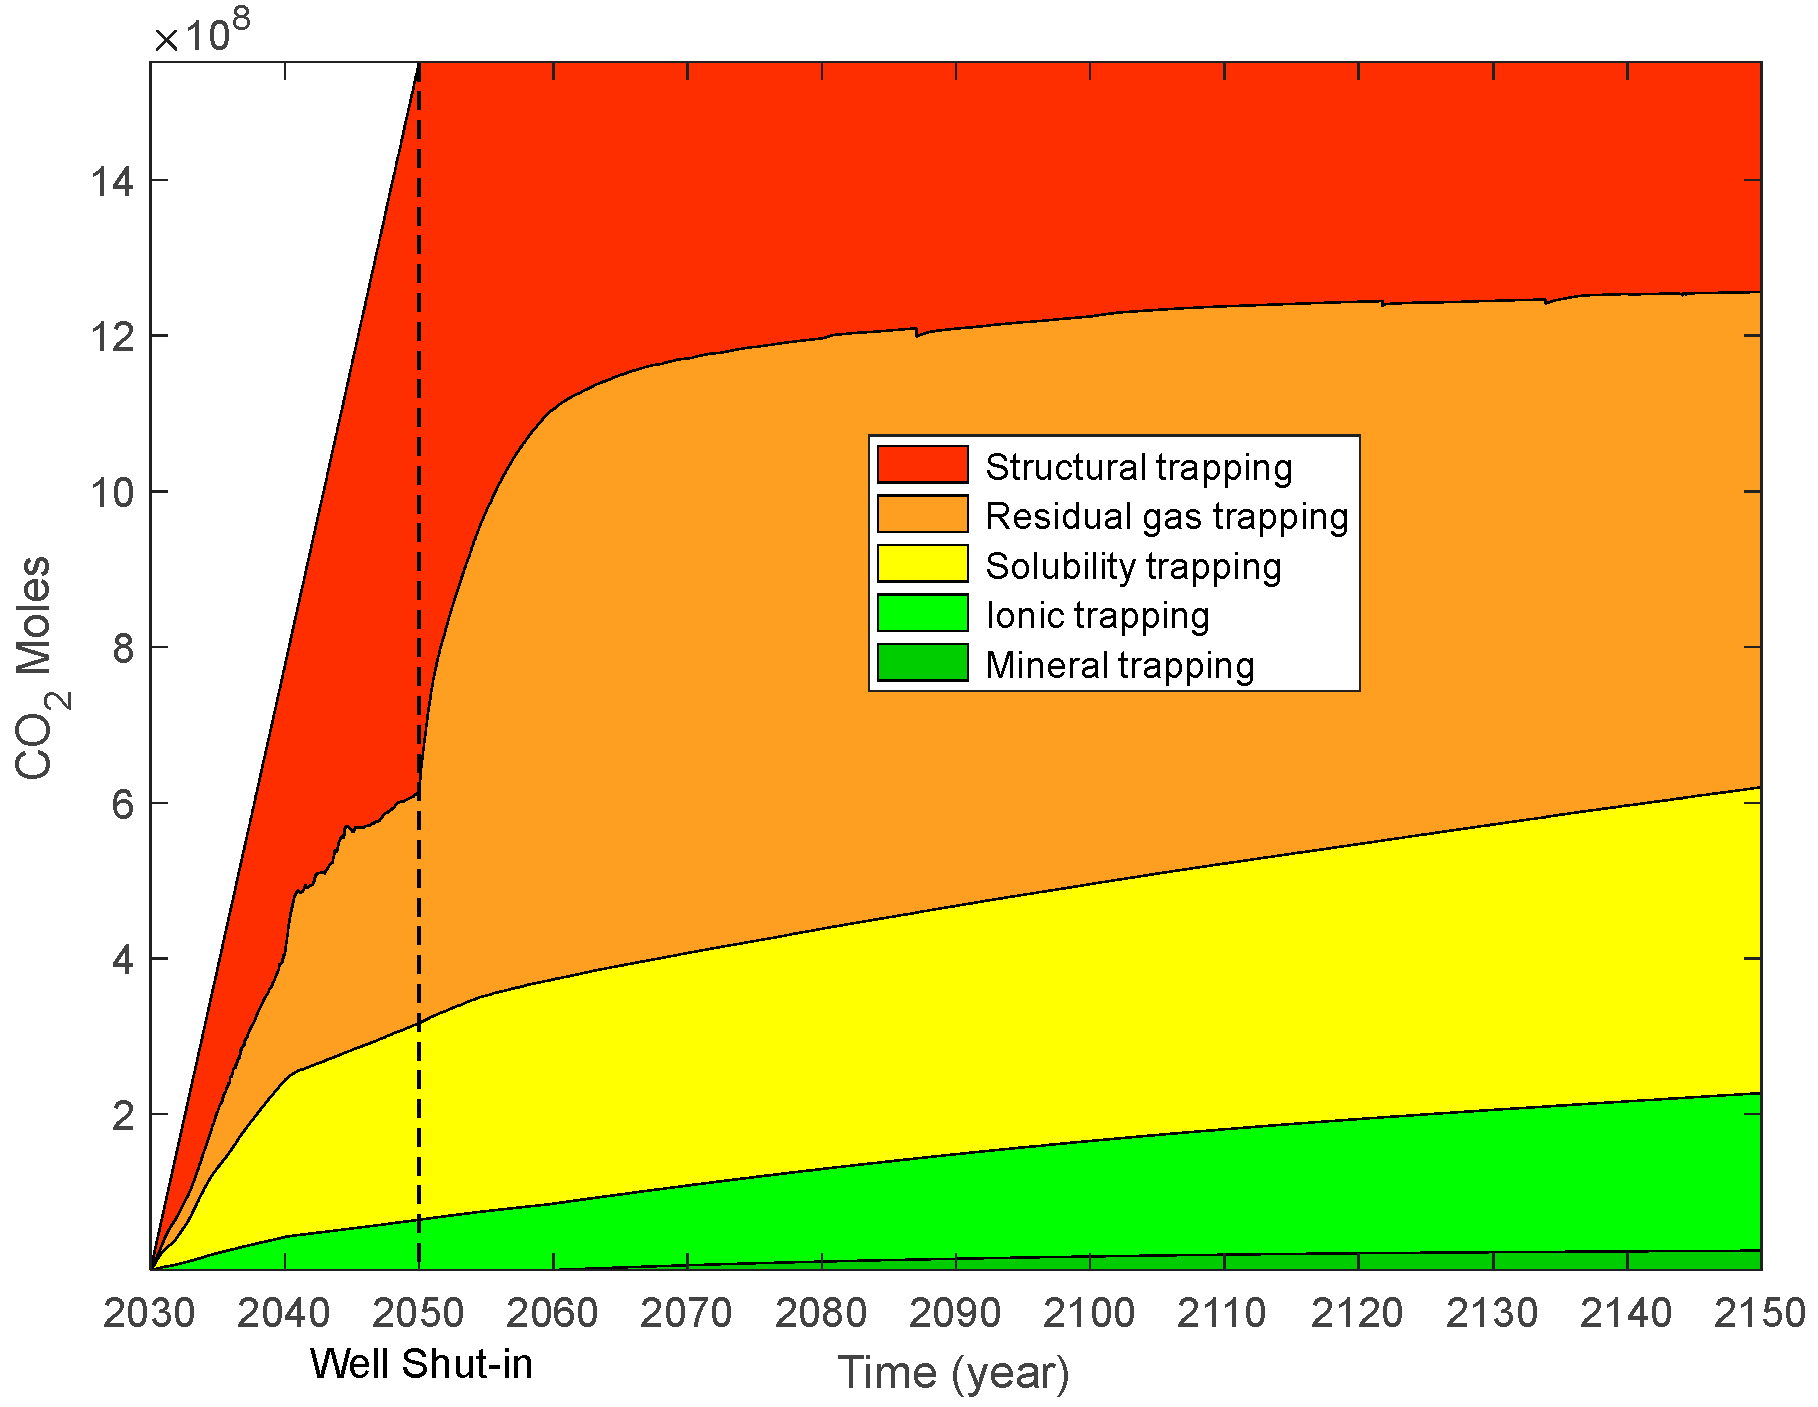
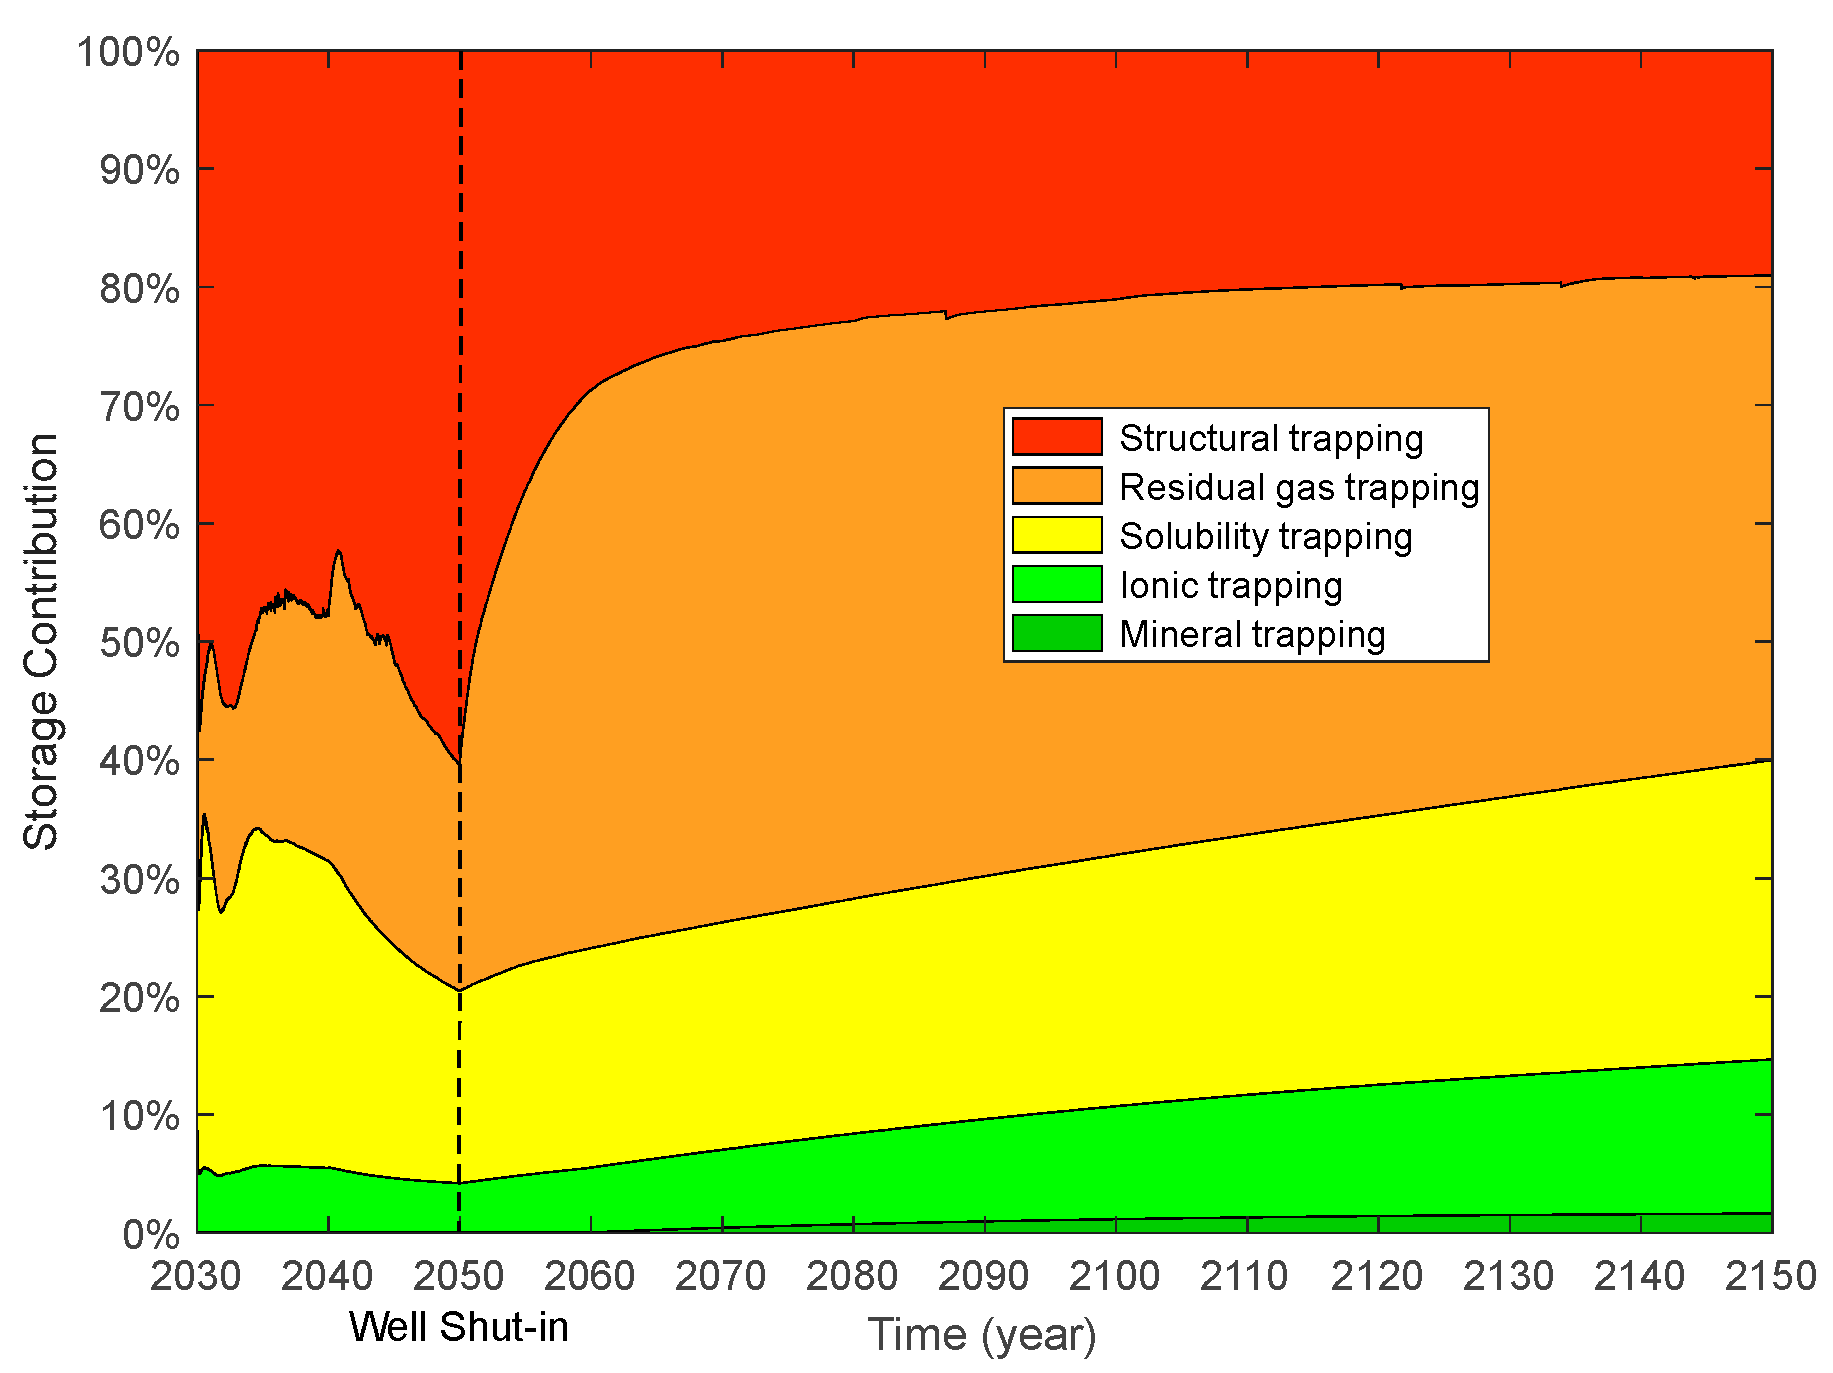
4.1. Base Case of Supercritical CO2 Injection
The basic problem of interest is that CO2 is injected at the bottom of the formation (Figure 8). CO2 is injected at a fixed injection rate of 4500 m3/day under a standard surface gas rate with a maximum bottom-hole pressure of 44,500 kPa for the first 20 years. The initial well bottom-hole pressure was about 27.4 MPa, and the bottom-hole pressure rose to about 29.6 MPa after 20 years of continuous injection. The migration of supercritical CO2 was carried out until 2150 (100 years). After the well shut-in, the well bottom-hole pressure decreased slowly. The bottom-hole pressure was about 29.4 kPa at the end of the simulation, higher than the initial value (Figure 9). The cumulative mass of the CO2 injection was 6.83 × 10⁴ t.
Figure 8.
Sketch of the CO2 perforation location.
Figure 9.
Injection profile of the supercritical CO2 during the simulation (blue line is well bottom-hole pressure; orange line is cumulative CO2 mass).
Figure 10 shows the spatial mobility and distribution of CO2 saturation over time. Due to the density difference between the supercritical CO2 and the aqueous phase, the low-viscosity CO2 tends to migrate to the top of the geological formation. The highest concentration areas of CO2 saturation are observed in the convex topography near the injection well. After the well shut-in, CO2 continues to migrate to the anticline due to structural trapping (1 January 2060). After that, the CO2 plume continues to move forward due to the accumulation of excess CO2 in the anticline. At the end of the simulation period (1 January 2150), most of the CO2 plume was still trapped at the top of the anticline in the Wei-2 formation.
Figure 10.
Spatial mobility and distribution of CO2 saturation at various simulation times for CO2 injection.
The CO2 mole changes at various simulation times are plotted in Figure 11. At the beginning of the CO2 injection, the supercritical CO2 is injected and mixed with the initial water in the formation, forming a dissolved aqueous phase. The supercritical CO2 continues to increase to a maximum value of 1.32 × 10⁹ moles in 2050. Due to the existence of initial water in the formation, the CO2 aqueous ions and dissolved CO2 measure 5.04 × 10⁸ and 0.575 × 10⁸ moles in 2030, respectively. At the end of the simulation, the CO2 aqueous ions and dissolved CO2 measure 6.8 × 10⁸ and 4.0 × 10⁸ moles in 2050. The dissolved-CO2 curve shows an increasing trend during geological carbon storage. During the CO2 injection period, the amount of CO2 dissolved in the aqueous phase is more than that of trapped CO2. There is a sharp increase in trapped CO2 after the well shut-in, mainly due to CO2 being trapped by the anticline.
Figure 11.
Evolution of CO2 mole changes at various times for base case.
Figure 12 and Figure 13 show the mineral moles changes in anorthite, calcite, and kaolinite. Figure 14 shows the ion mole changes at the end of the simulation. It can be observed that the kaolinite is precipitated in the aqueous phase, while the anorthite is dissolved. Calcite is initially in the dissolved state, gradually converting to a precipitated state due to the continued geochemical reactions in the late storage period. The mole changes for anorthite, calcite, and kaolinite are −2.79 × 10⁷, 2.07 × 10⁷, and 7.85 × 10⁵ at the end of the simulation, respectively. As CO2 is dissolved in the aqueous phase, there is a decrease in PH in the CO2 migration areas (Figure 15). The porosity variation was insignificant at the end of the simulation (Figure 16). Anorthite, a calcium-rich mineral, is dissolved to provide Ca2+ and Al3+ in the aqueous phase due to the formation of carbonic acid. Ca2+ and Al3+ contribute to the precipitation of calcite and kaolinite with time. The mineral change in calcite is more than that of kaolinite precipitation. The precipitation of calcite consumed more Ca2+ compared with Al3+ consumed by kaolinite precipitation. The mole changes in Al3+ is more obvious than that in Ca2+ 100 years after the injection period.
Figure 12.
Evolution of mineral mole changes at various times for base case.
Figure 13.
Spatial distribution of mineral changes 100 years after injection period.
Figure 14.
Spatial distribution of ion changes after simulation time of 100 years.
Figure 15.
PH variation at the end of the simulation for CO2 injection.
Figure 16.
Porosity variation at the end of the simulation for the base case.
For the CO2 injection, the CO2 moles of different trapping mechanisms are illustrated in Figure 17. The trapping mechanisms of the structural, residual gas, solubility, ions, and minerals are considered in CO2 storage amounts in the reservoir (Figure 18). During the CO2 injection period, the storage contributions of structural and solubility trapping decrease with time, and the trapping contribution of residual gas is nearly fixed as a constant. When the injection well was shut down (1 January 2050), 72% of the primary 1.5512 × 10⁹ moles of injected CO2 was trapped by structural trapping. The storage contributions of residual gas, solubility, ionic, and mineral trapping are 13.38%, 11.55%, 3.07%, and 0%, respectively. After the injection well was shut down, the contribution of structural trapping decreased from 72% to 28.39% with time. At the end of the simulation, 28.39%, 36.83%, 22.08%, 11.36%, and 1.34% of the injected CO2 was stored by structural, residual gas, solubility, ionic, and mineral trapping, respectively.
Figure 17.
CO2 moles of different trapping mechanisms.
Figure 18.
Storage contributions of different trapping mechanisms for base case.
4.2. Modified Case of Supercritical CO2 + Water Injection
Improving carbon storage efficiency, the case is modified by adding a water injection to the CO2 storage model. The water perforation location is above the CO2 perforation location (Figure 19). Water is injected at a fixed injection rate of 25 m3/day under a standard surface water rate for the first 10 years, and supercritical CO2 is injected for 20 years continuously.
Figure 19.
Sketch of the CO2 and H2O perforation locations.
Figure 20 shows the spatial distribution of CO2 saturation after a simulation time of 100 years. It is observed that most of CO2 plume was trapped on the top of the anticline in the Wei-2 formation, without migrating out of the anticline (2150-01-01).
Figure 20.
Spatial distribution of CO2 saturation at various times (modified case).
Figure 21 illustrates the CO2 mole changes at various simulation times for CO2 and water injection. The CO2 aqueous ions and dissolved CO2 measure 7.06 × 10⁸ and 4.5 × 10⁸ moles in 2150, respectively.
Figure 21.
Evolution of CO2 mole changes at various times for modified case.
Figure 22 displays the evolution of anorthite, calcite, and kaolinite mole changes at various simulation times for the CO2 and water injections. The mole changes for anorthite, calcite, and kaolinite are −3.23 × 10⁷, 2.51 × 10⁷, and 9.3 × 10⁵ after well shut down after 100 years, respectively.
Figure 22.
Evolution of mineral mole changes at various times for modified case.
For supercritical CO2 plus water injection, the moles of different trapping mechanisms are illustrated in Figure 23, and the trapping contributions of different mechanisms are illustrated in Figure 24. During the CO2 and water injection period, the storage contribution of structural trapping displays an initial decrease (10 years) and then shows an increasing trend (10 years) with time. When the injection well was shut down, 60.38% of the moles of injected CO2 was trapped by structural trapping. The trapping contributions of residual gas, solubility, ionic, and mineral trapping are 19.16%, 16.28%, 4.18%, and 0%, respectively. One-hundred years after the injection well was shut down, the contribution of structural trapping decreased from 72% to 19.05% with time. At the end of the simulation (120 years), 19.05%, 40.95%, 25.33%, 13.05%, and 1.62% of the injected CO2 was stored by structural, residual gas, solubility, ionic, and mineral trapping, respectively.
Figure 23.
CO2 moles of different trapping mechanisms for modified case.
Figure 24.
Storage contributions of different trapping mechanisms for modified case.
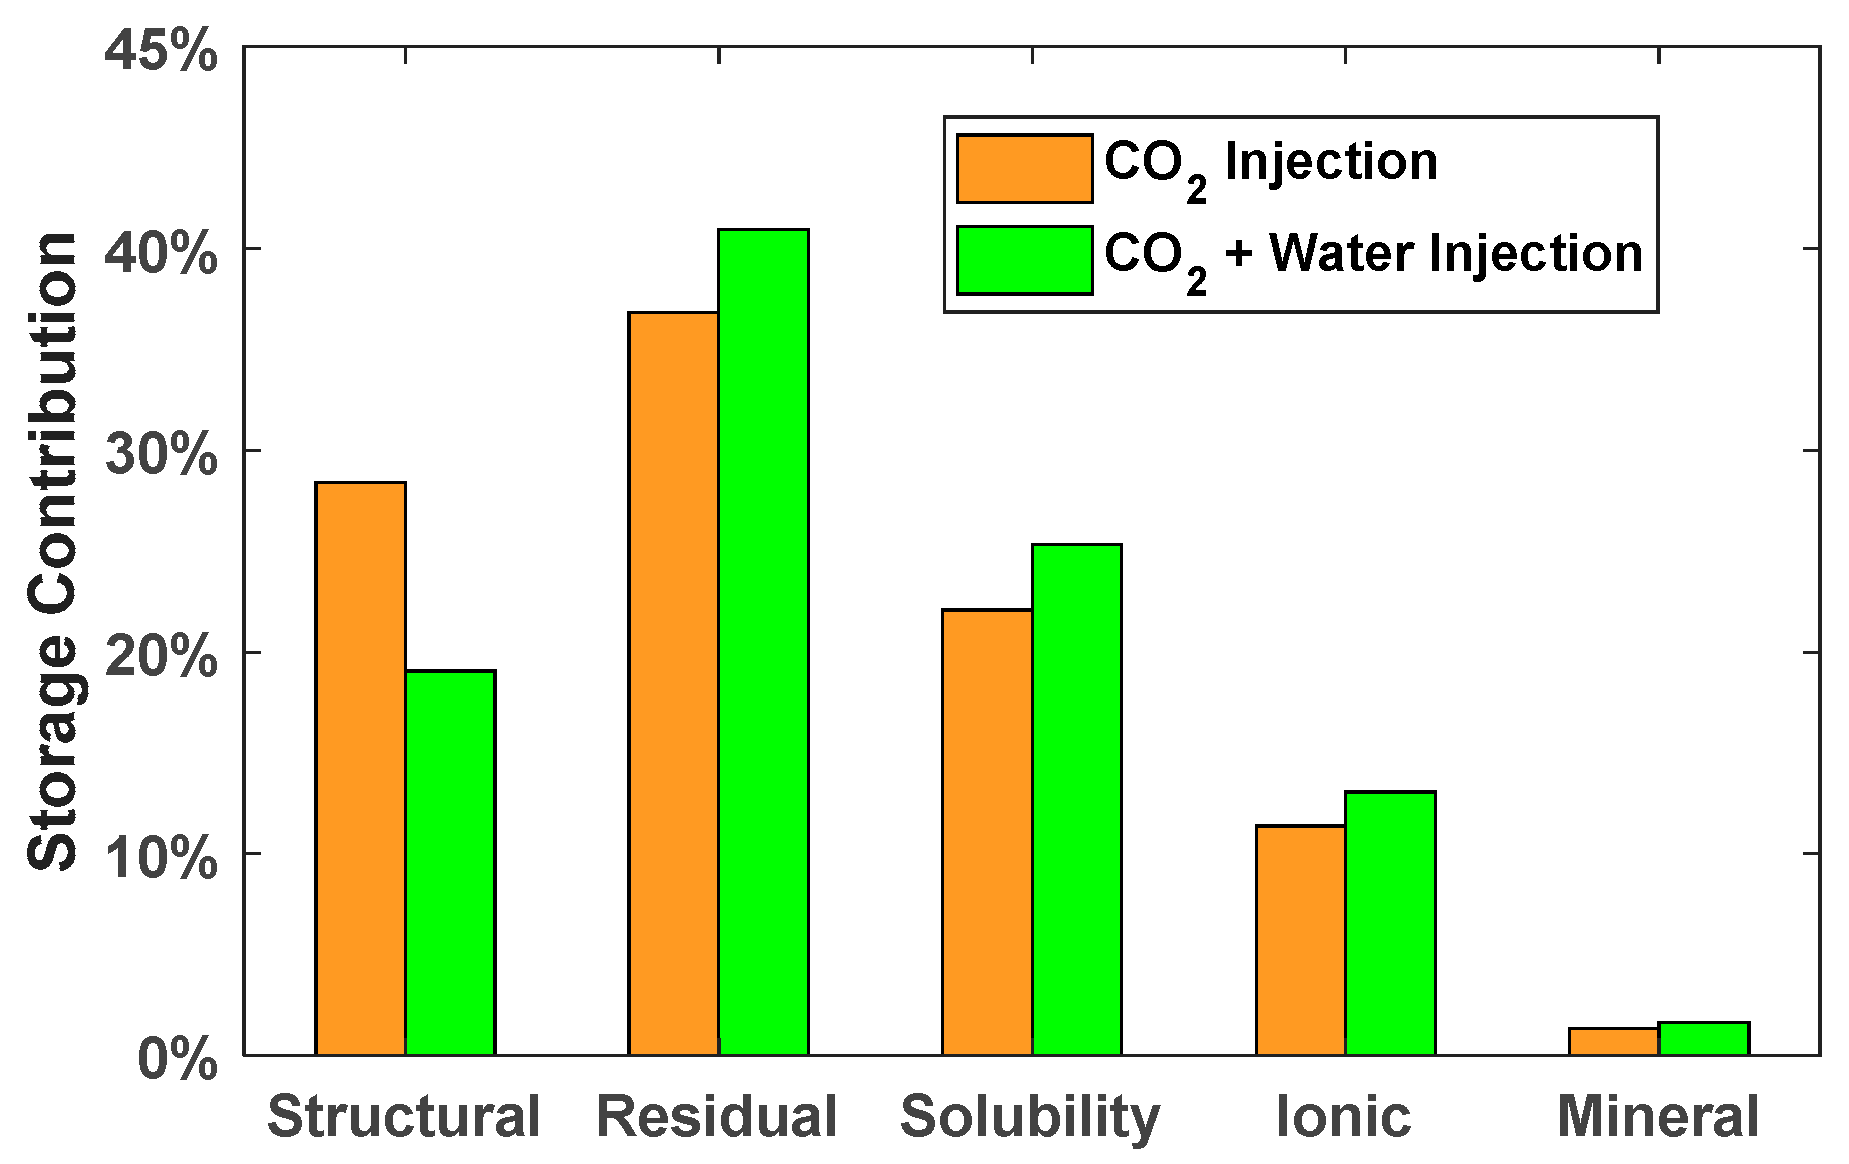
4.3. Comparisons of CO2 Injection and CO2 + Water Injection
Compared with CO2 injection, the storage contribution of structural trapping decreases from 28.39% to 19.05% for CO2 and water injection. It can be seen from Figure 25 that the storage contributions of residual gas, solubility, ionic, and mineral trapping increases at the end of the simulation for the modified case. The percentage increase in the storage contributions of residual gas, solubility, ionic, and mineral trapping due to water injection are 4.12%, 3.25%, 1.69%, and 0.28%. It is concluded that injecting water above the location of CO2 injection is an effective method to improve the storage efficiency of residual gas, solubility, ionic, and mineral trapping, and provides an effective reference for CO2 storage. Structural trapping was the maximum storage contribution when the well was shut down. At the end of the simulation, the residual gas trapping is the maximum storage contribution for CO2 storage.
Figure 25.
Storage contributions of CO2 injection and CO2 + water injection.
Water injection enhances storage efficiency mainly for the following reasons:
- (1)
- The injection of water can improve the mobility of carbon dioxide within the reservoir, promoting its uniform distribution and further enhancing storage effectiveness.
- (2)
- By creating a water layer through injection, a barrier can be formed to some extent, reducing the risk of carbon dioxide leaking to the surface or into other strata.
- (3)
- Additionally, water injection can increase the pressure in the underground reservoir, helping to drive carbon dioxide into deeper pore spaces, thereby improving the efficiency of CO2 storage.
5. Conclusions
In this paper, the Sequential Gaussian Simulation is adopted to construct a multilayered offshore basin, and aqueous solubility and geochemistry are considered in CO2 migration and the trapping process. The main conclusions are as follows:
- (1)
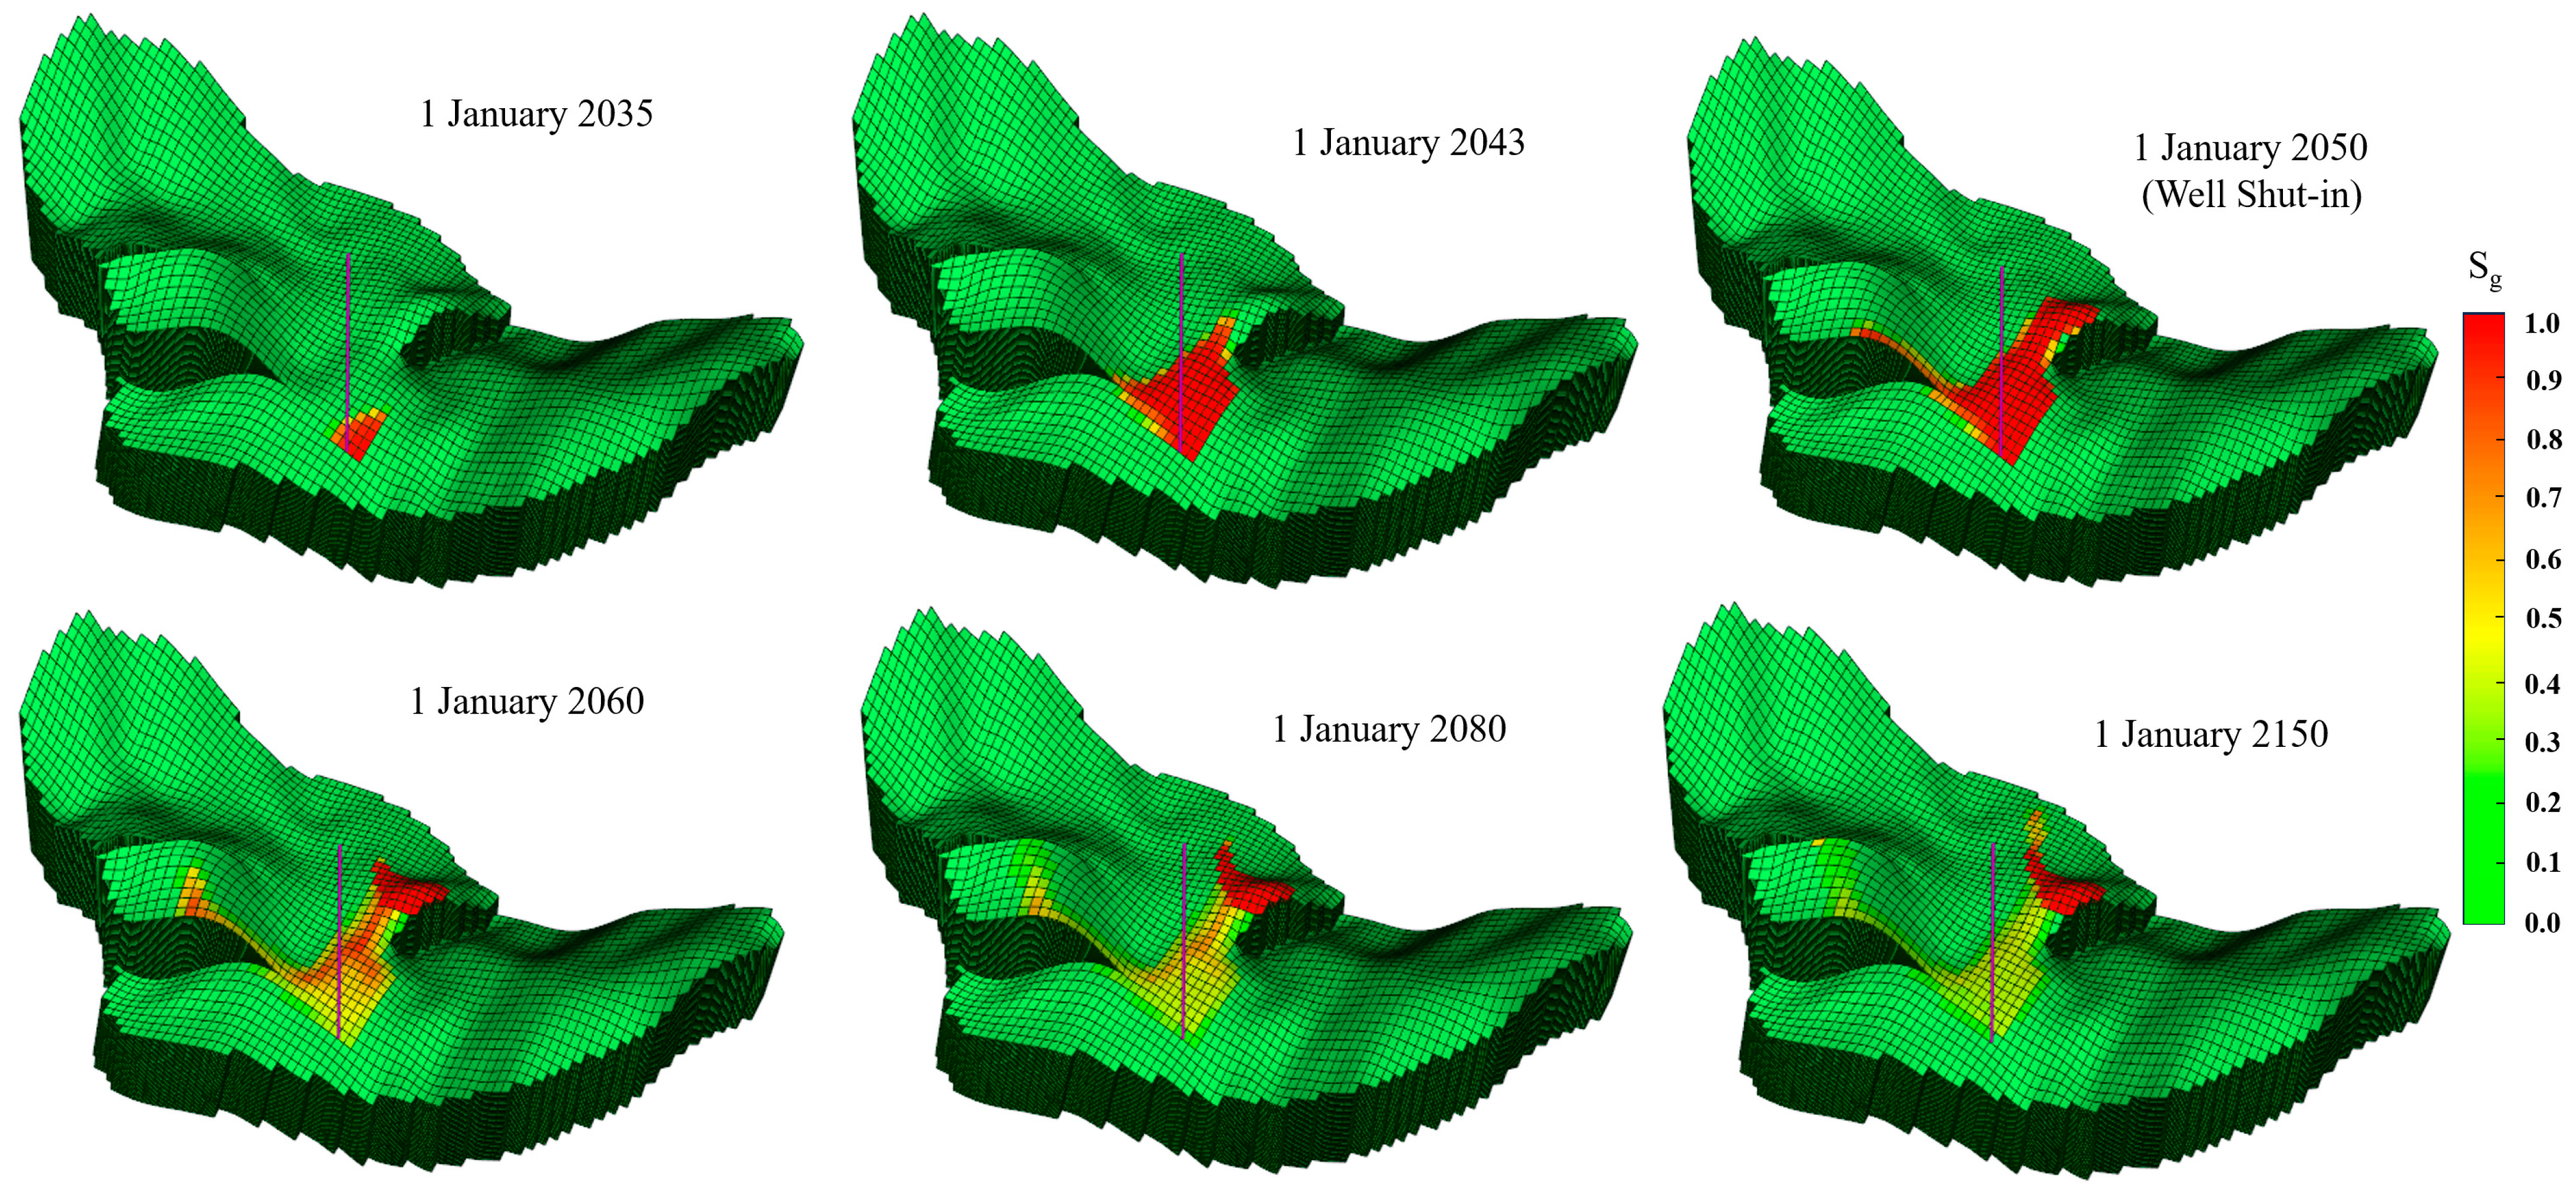
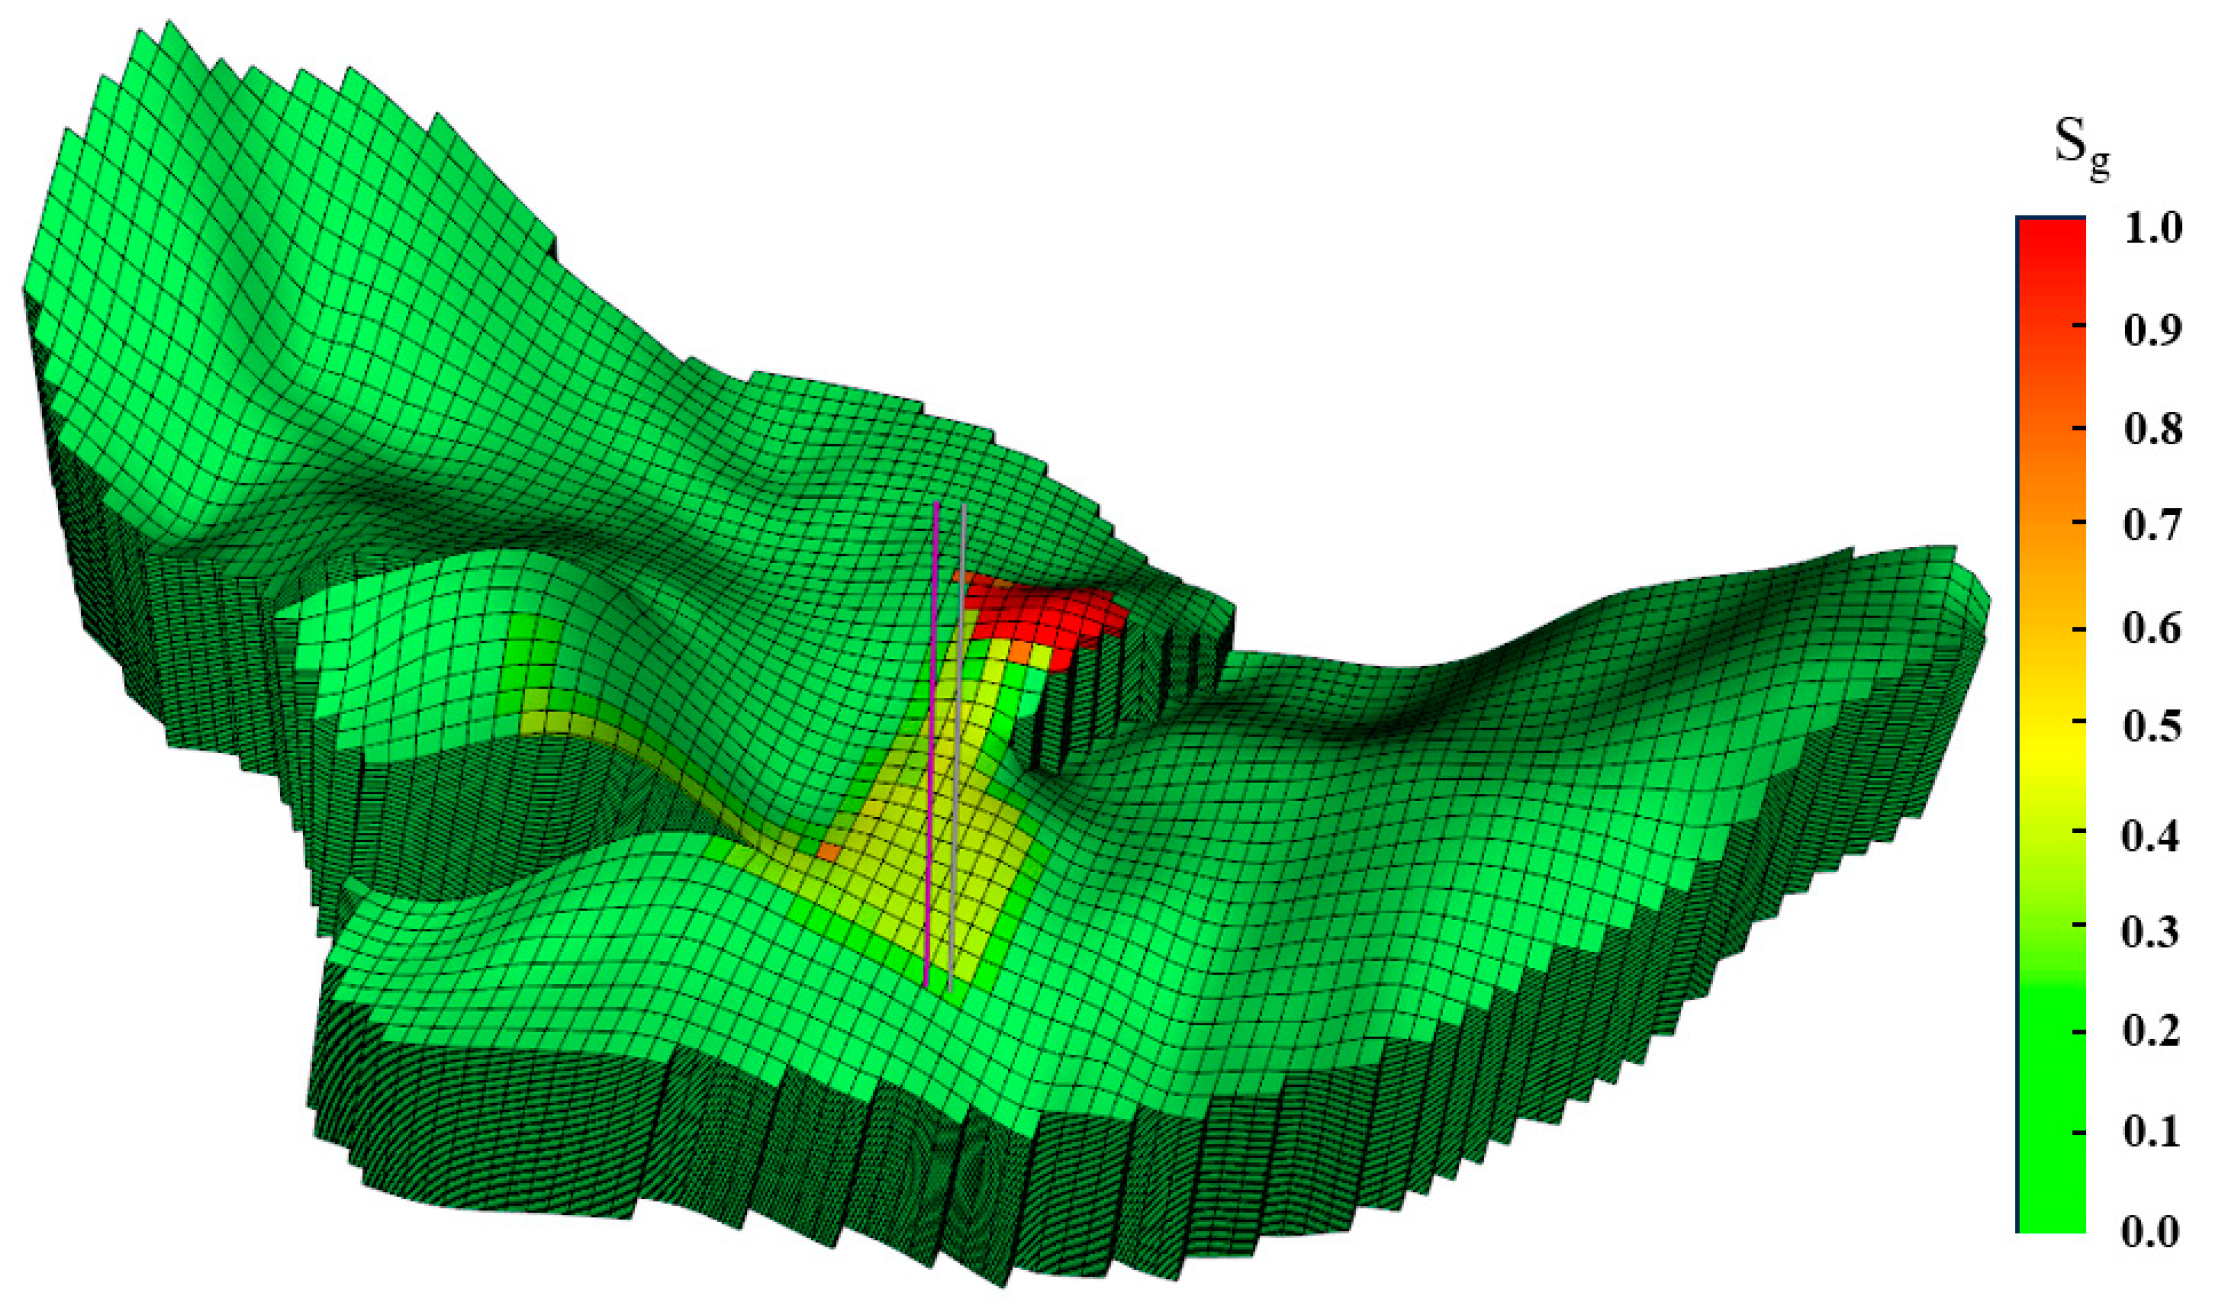
- An anticline is an ideal structural for geological carbon storage. The highest concentration areas of CO2 saturation are observed in the convex topography near the injection well.
- (2)
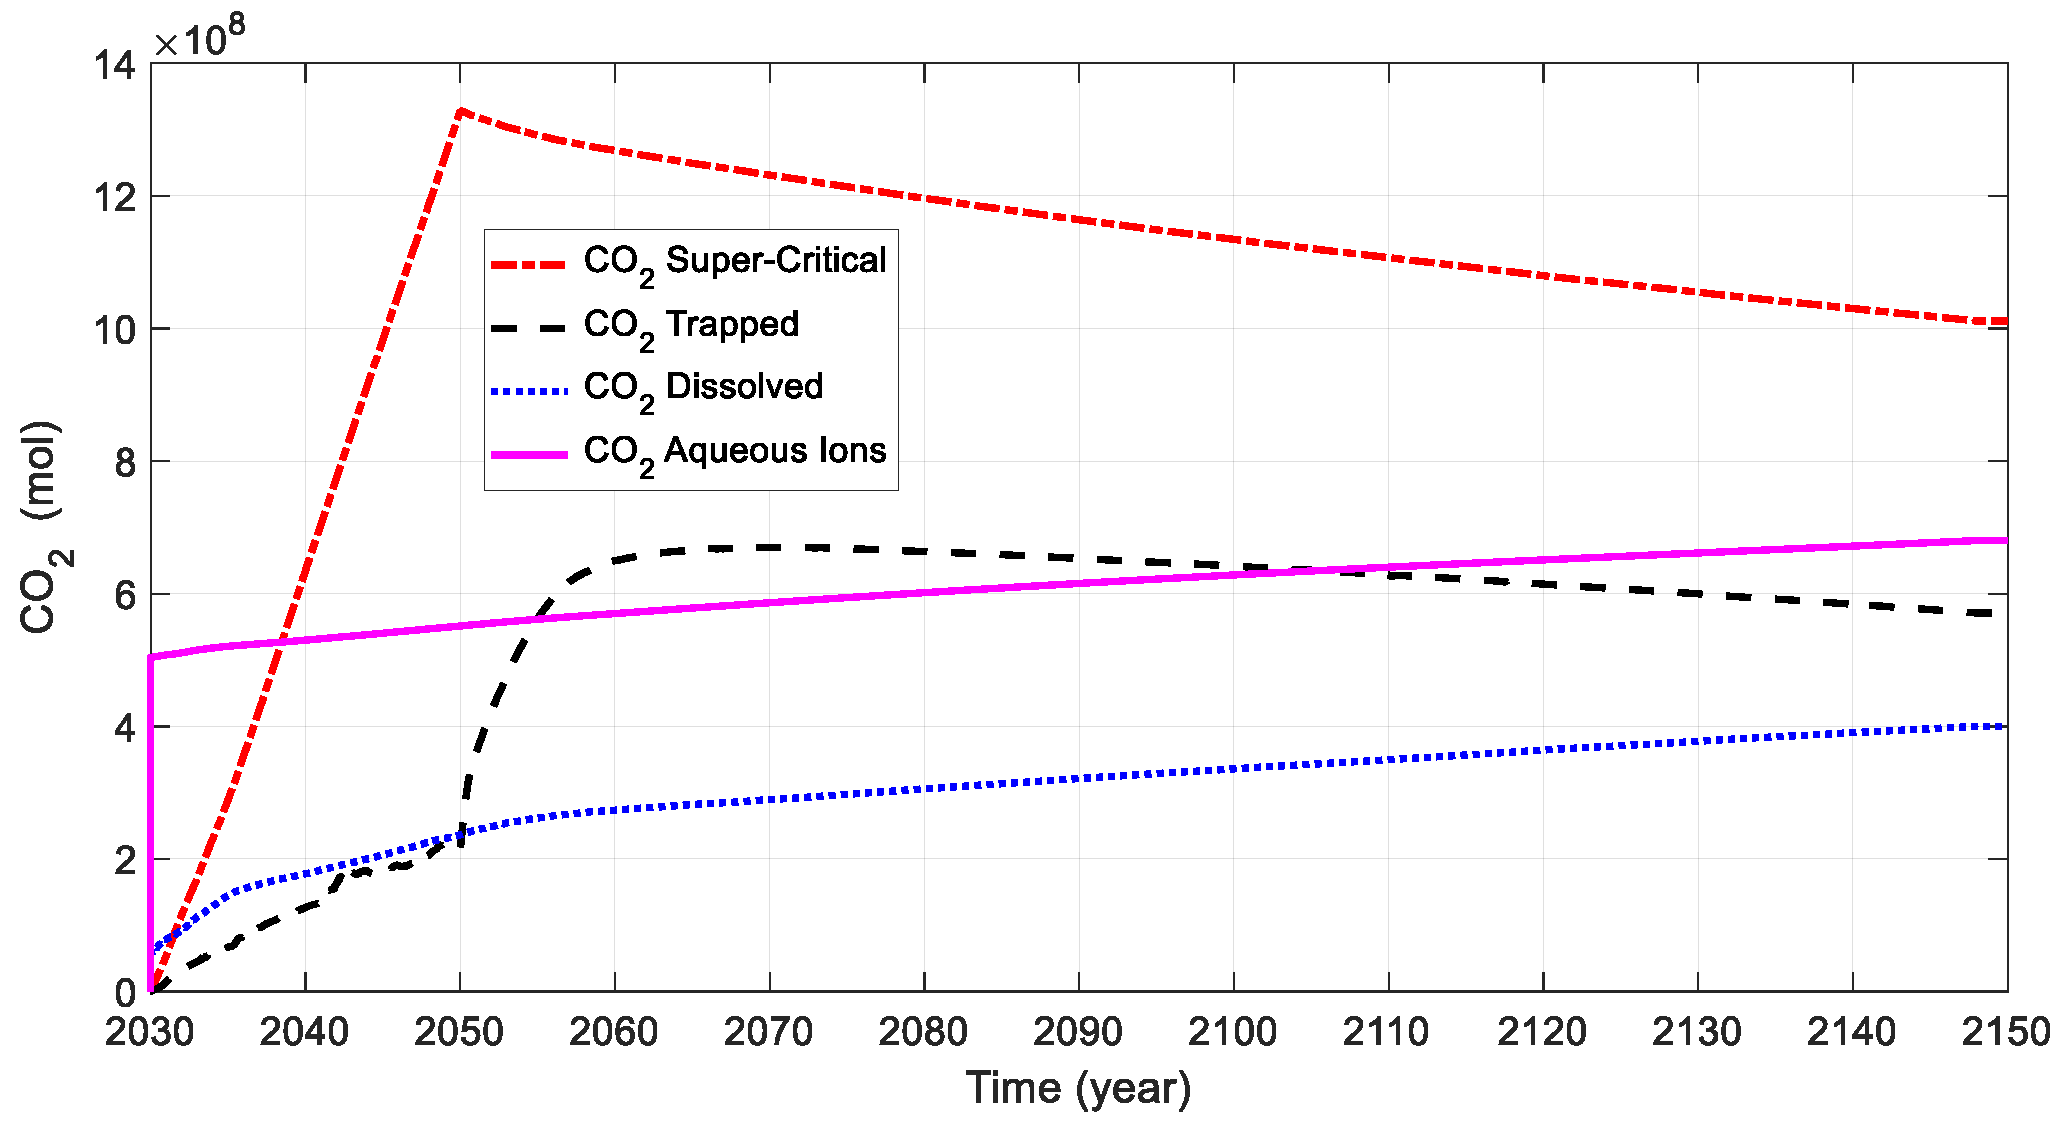
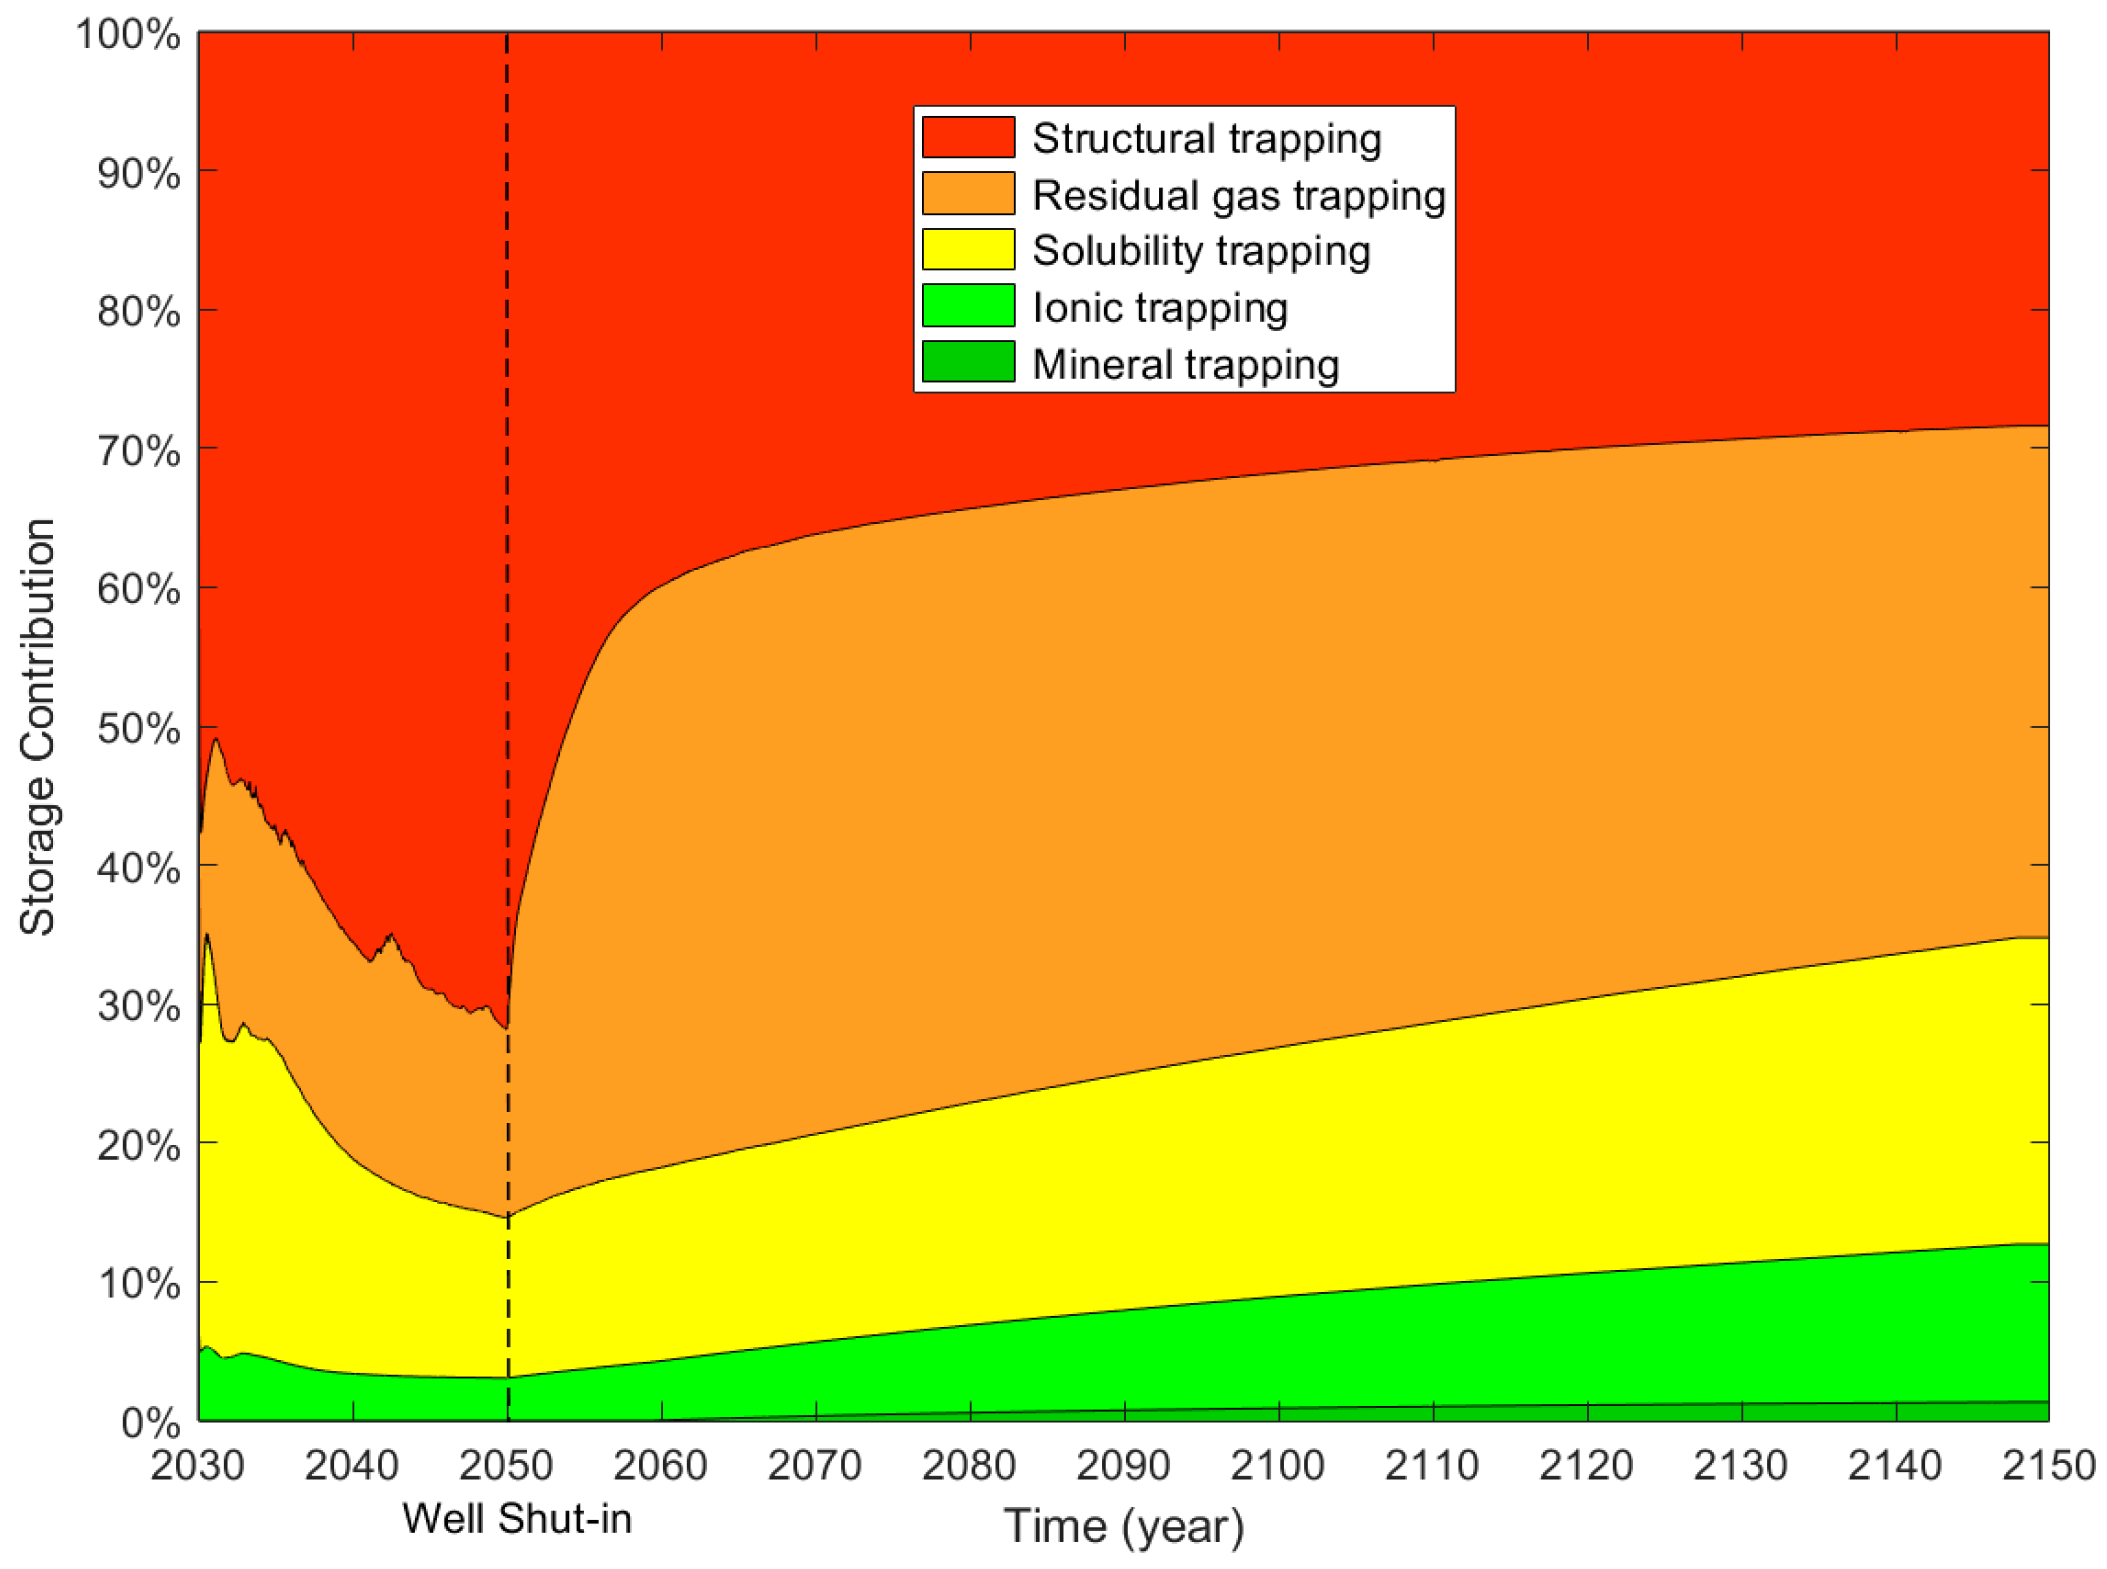
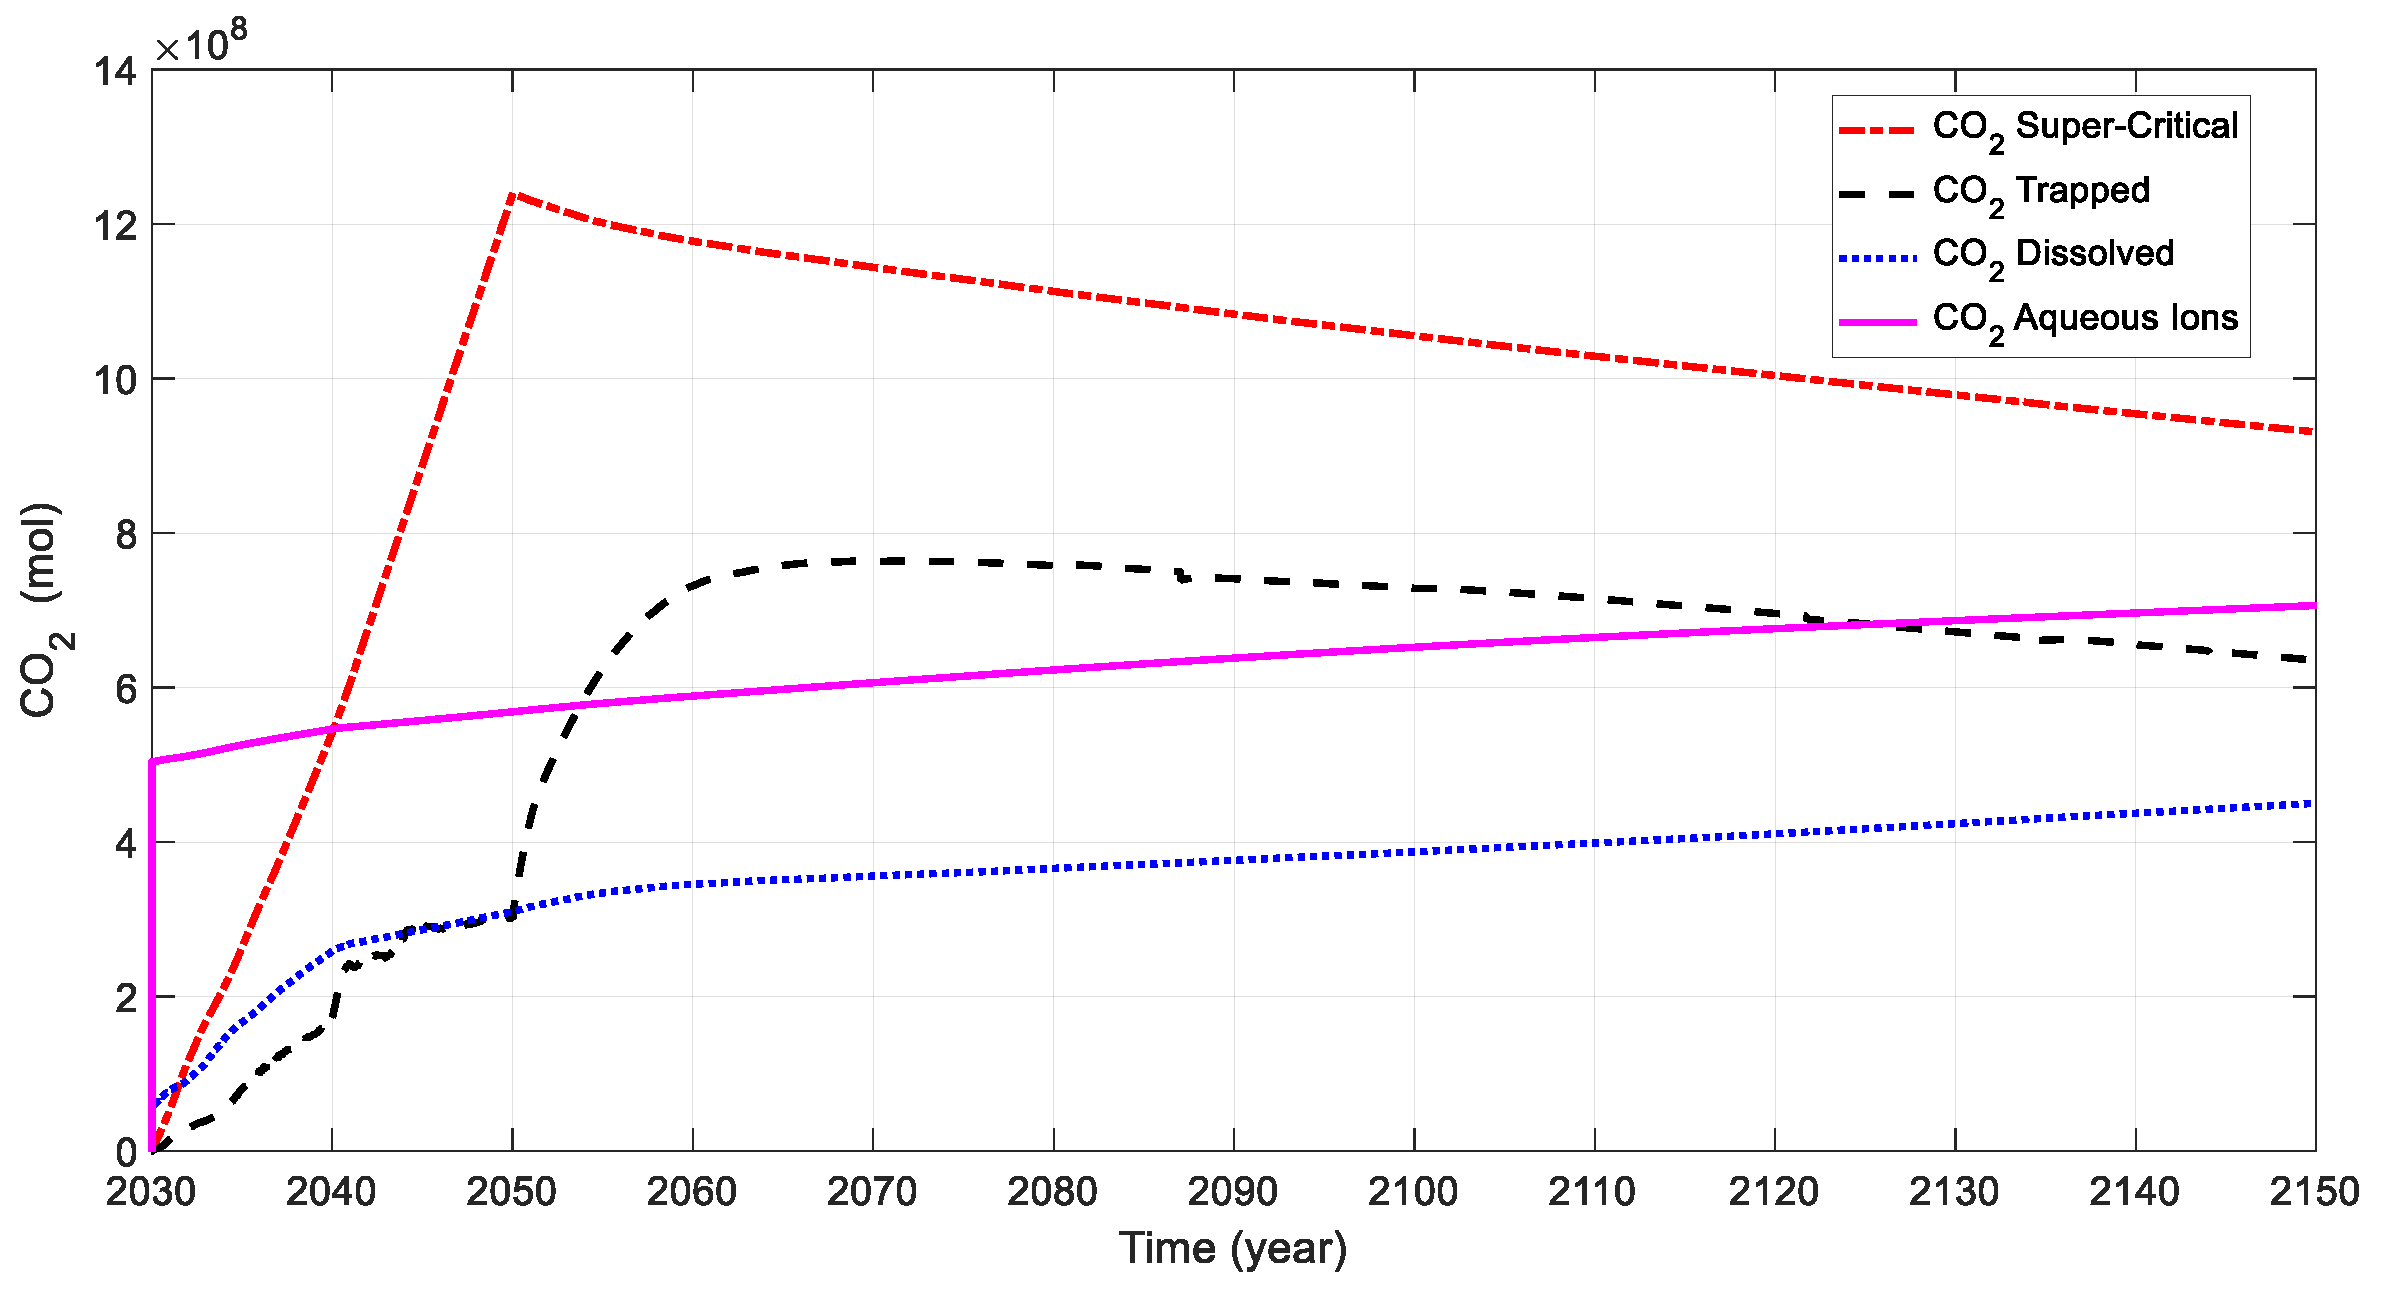
- Mineral trapping does not contribute in any significant way to CO2 storage capacity in a very short time scale, and the contribution of residual gas trapping is the greatest at the end of the simulation.
- (3)
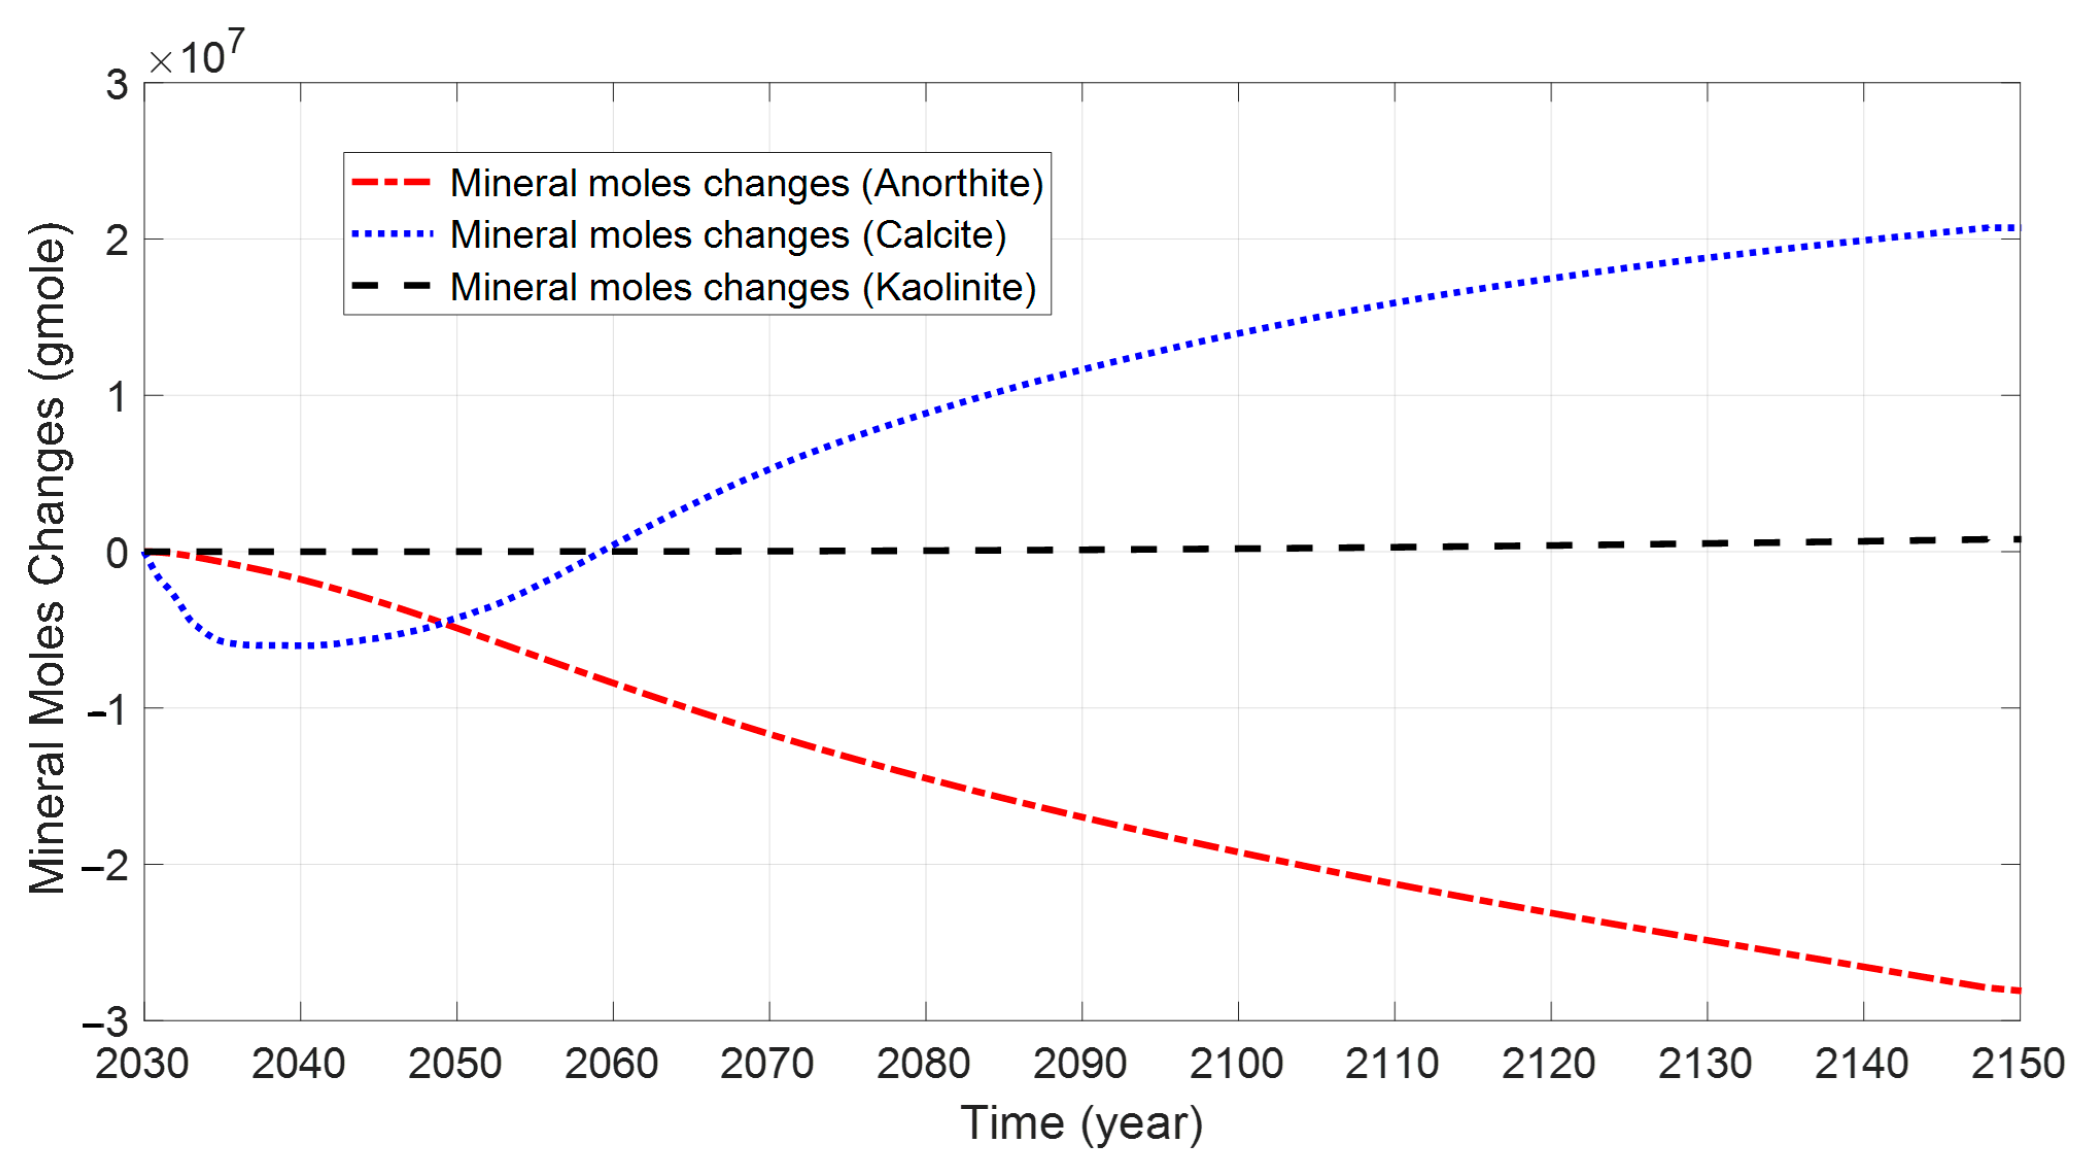
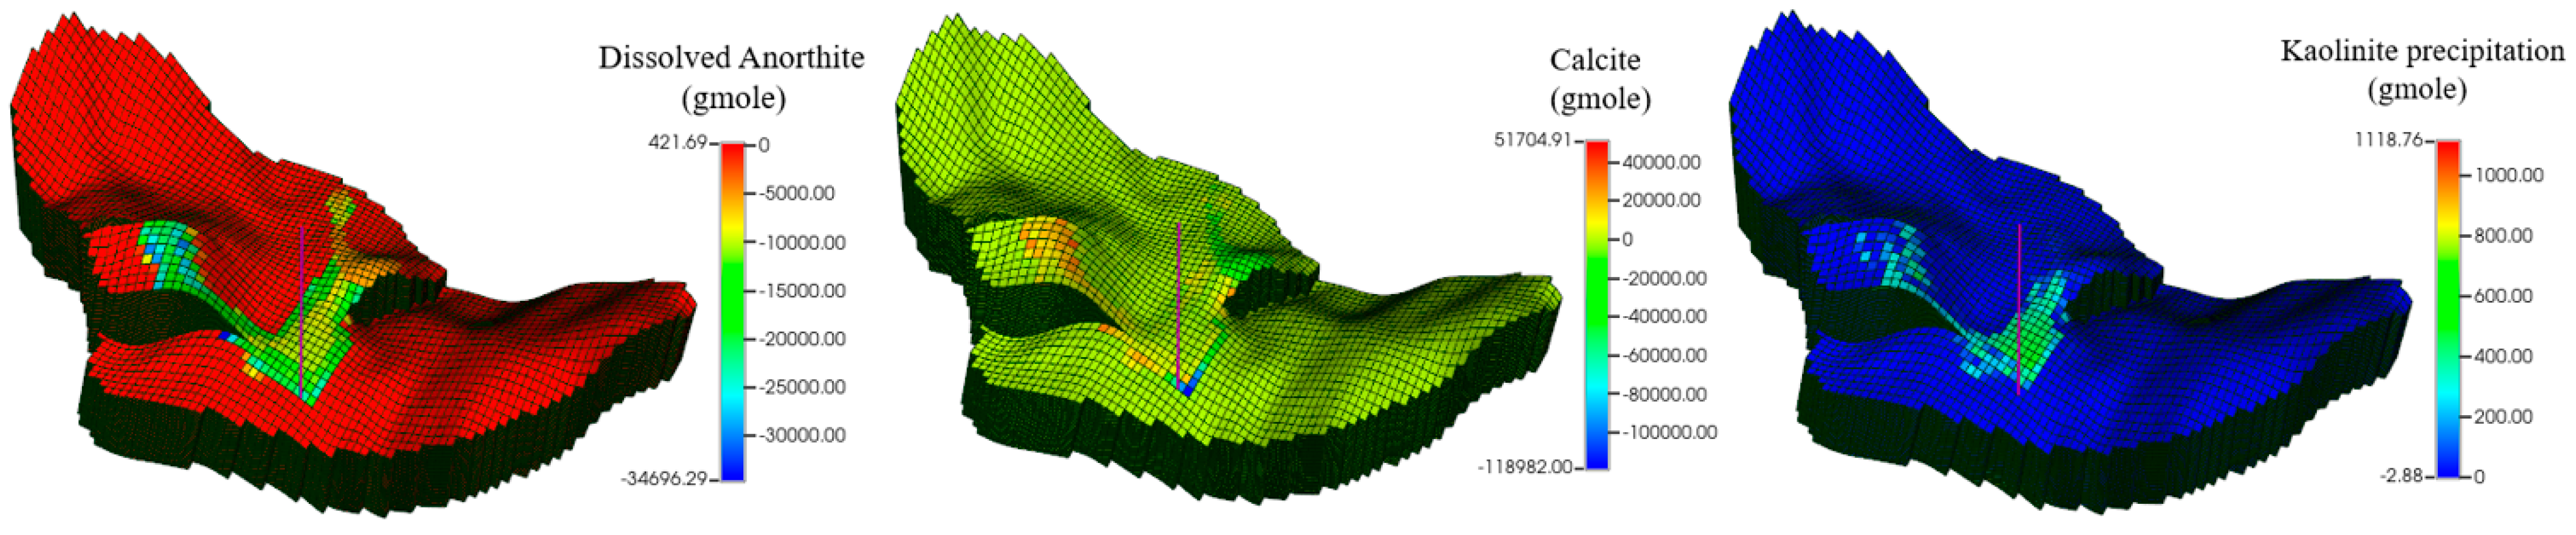
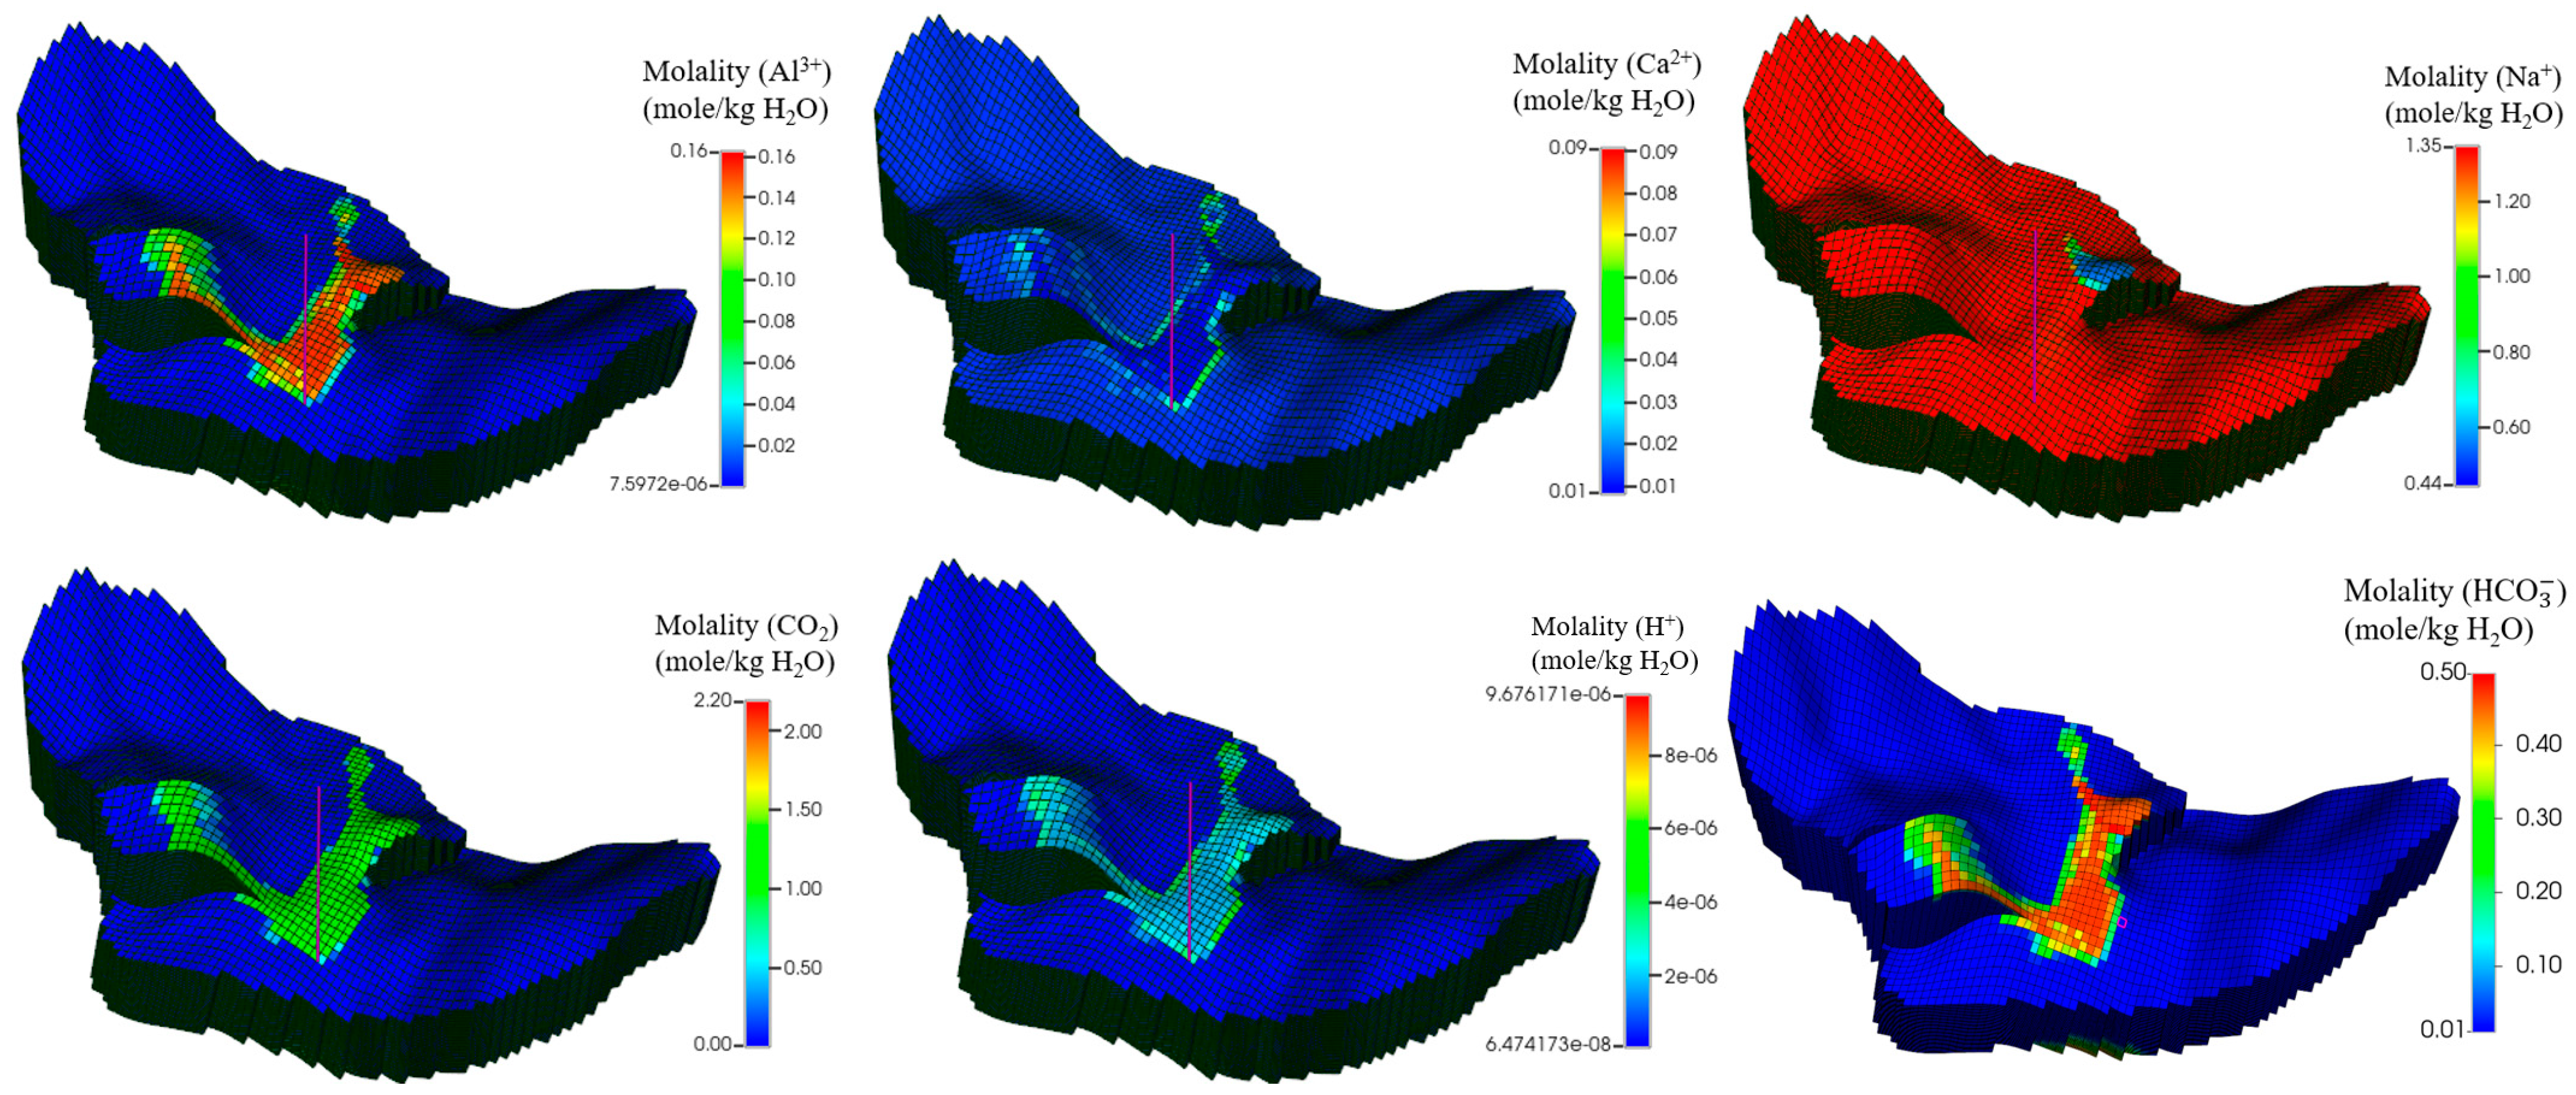
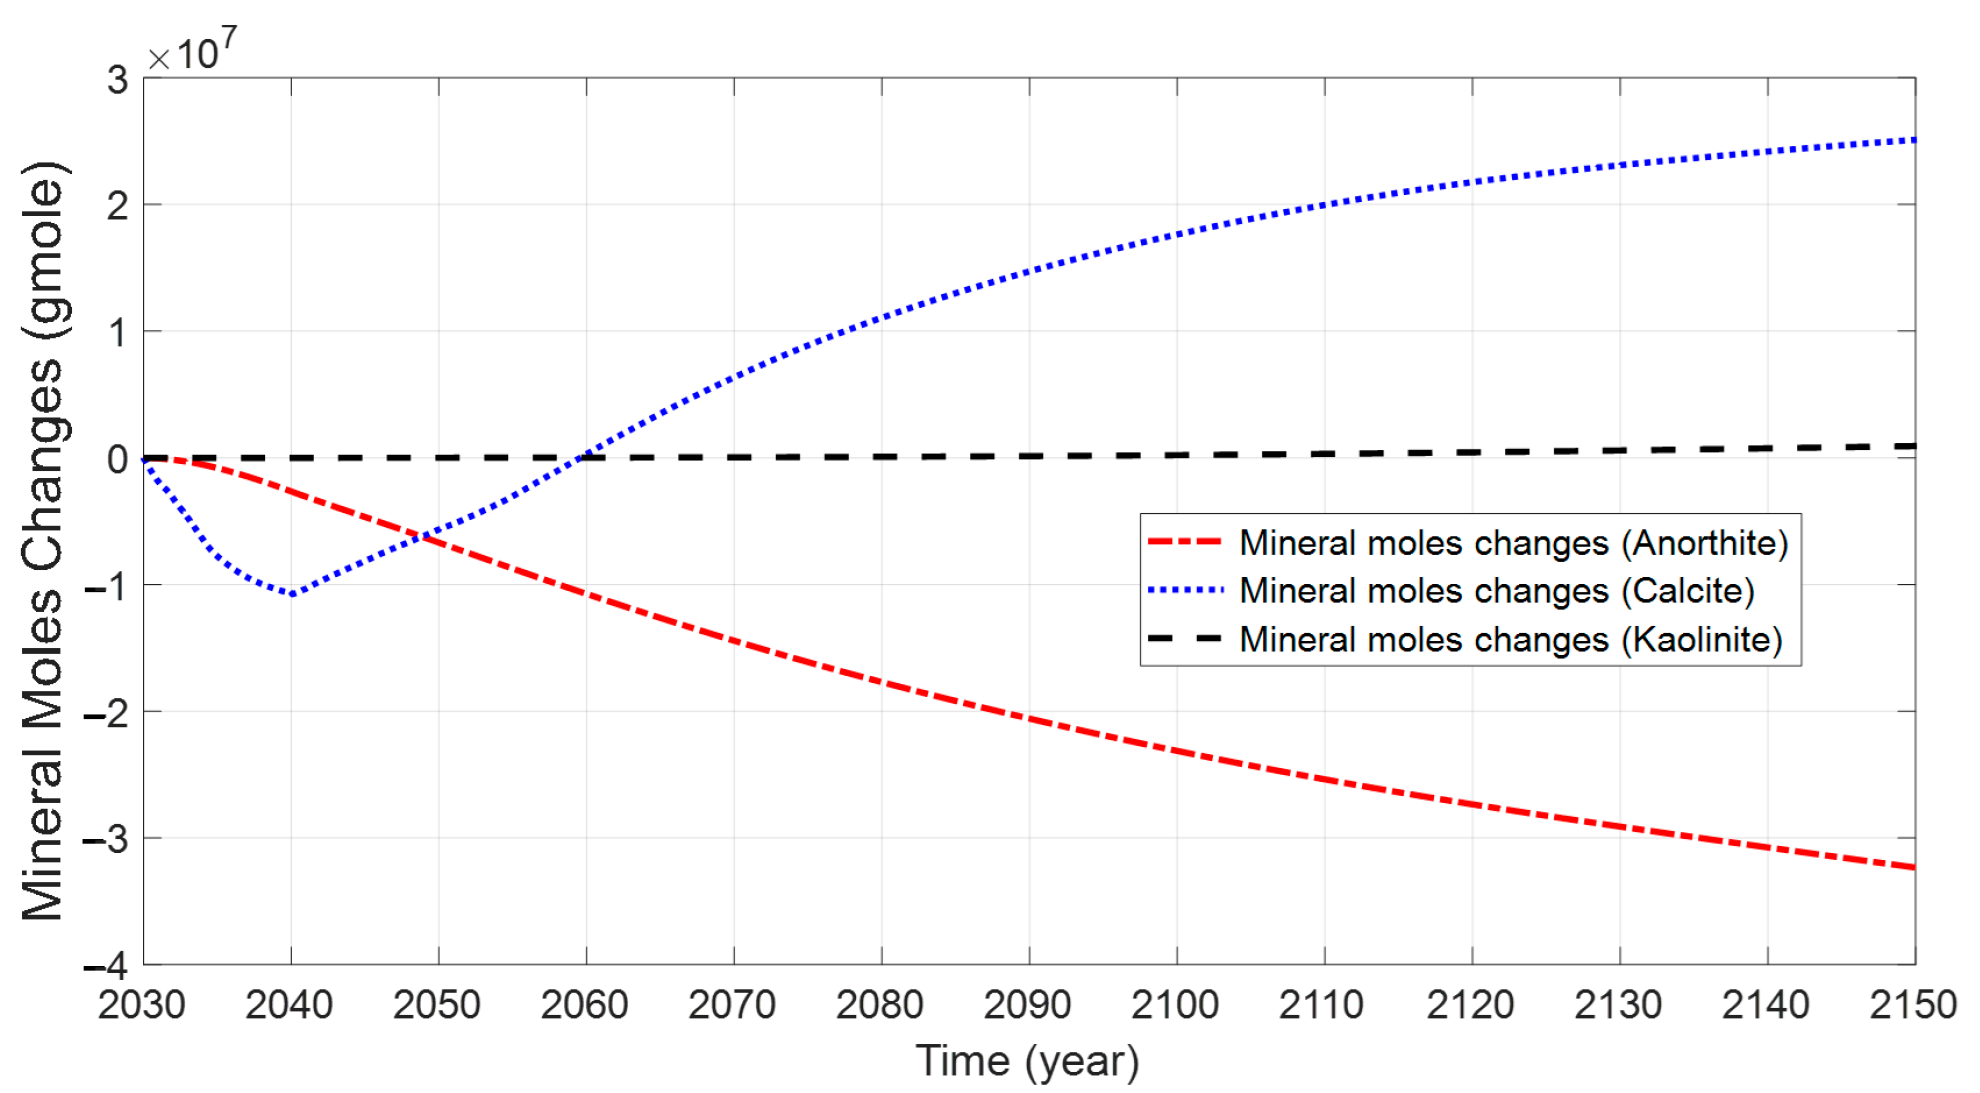
- In order to sequestrate carbon by mineralization, it is necessary to dissolve CO2 into a saline aquifer to form H+ for the generation of Ca2+ and Al3+ released by anorthite. Calcite and kaolinite are precipitated in the aqueous phase due to the continued geochemistry reactions after well shut-in.
- (4)
- The contribution of structural storage decreases from 28.39% to 19.05%, while the storage contributions from residual gas, solubility, ionic, and mineral trapping increase by 4.12%, 3.25%, 1.69%, and 0.28%, respectively, with CO2 and water injection, thereby enhancing the long-term security of CO2 storage in offshore basins.
- (5)
- Carbon dioxide migrates upward from the bottom, and choosing the appropriate CO2 injection well design can effectively prevent carbon dioxide leakage. One can optimize the layout and design of the injection well to ensure a uniform distribution of carbon dioxide and to increase the injection rate.
- (6)
- A sensitivity analysis to assess the impact of variations in key parameters (e.g., injection rate, reservoir properties) on the simulation results will be carried out in future investigations.
Author Contributions
Y.L. and G.W.: Writing—original draft, Software, Methodology, Investigation. X.F. and S.W.: Writing—review and editing, Supervision, Resources, Investigation, Funding acquisition. Y.X., H.L. and W.L.: Validation, Software, Methodology, Data curation. All authors have read and agreed to the published version of the manuscript.
Funding
This work was financially supported by the National Natural Science Foundation of China (No. 52274231 and No. 52034006), the Hainan Province Science and Technology Special Fund (No. ZDYF2023GXJS008), the Southern Marine Science and Engineering Guangdong Laboratory (Zhanjiang) under Grant ZJW-2023-11-02, and the Legal Governance about Carbon Sink Trading Rules in the South China Sea from the Perspective of Collaborative Governance (GD21YDXZFX01), supported by Guangdong Province Philosophy and Social Sciences plan for the year 2021 Guangdong special projects in the east, west and north of the province.
Data Availability Statement
The data will be made available on request.
Conflicts of Interest
The authors declare that they have no known competing financial interests or personal relationships that could have appeared to influence the work reported in this paper.
Nomenclature
| Acronyms | |
| GCS | Geological carbon sequestration |
| PR-EOS | Peng–Robinson equation of state |
| DOE | Department of Energy |
| Symbols | |
| Fugacity of the component | |
| Composition of the component | |
| L/mol] | |
| Gas saturation | |
| Reference pressure [kPa] | |
| Universal gas constant [8.314 JK−1mol−1] | |
| Temperature [°C] | |
| Number of components in the aqueous phase | |
| Number of reactions between aqueous components | |
| stoichiometry coefficients | |
| Chemical equilibrium constant | |
| Activity coefficient | |
| Activity of component | |
| Ion size parameter | |
| Stoichiometric molality | |
| Ionic strength parameter | |
| Electric charge of the ion | |
| Rate of mineral reaction | |
| Ionic strength parameter | |
| Electric charge of the ion | |
| Rate of mineral reaction | |
| Rate constant of the mineral reaction | |
| activity product of the aqueous reaction | |
| Rate constant for reaction at | |
| D | Diffusion coefficient [m2⋅s−1] |
| Nacl concentration [mol/kg] | |
| Initial permeability [m] | |
| Initial porosity | |
| Minj | Total injection mass [t] |
| Subscripts | |
| 0 | Initial time |
| Positive charge | |
| Negative charge | |
References
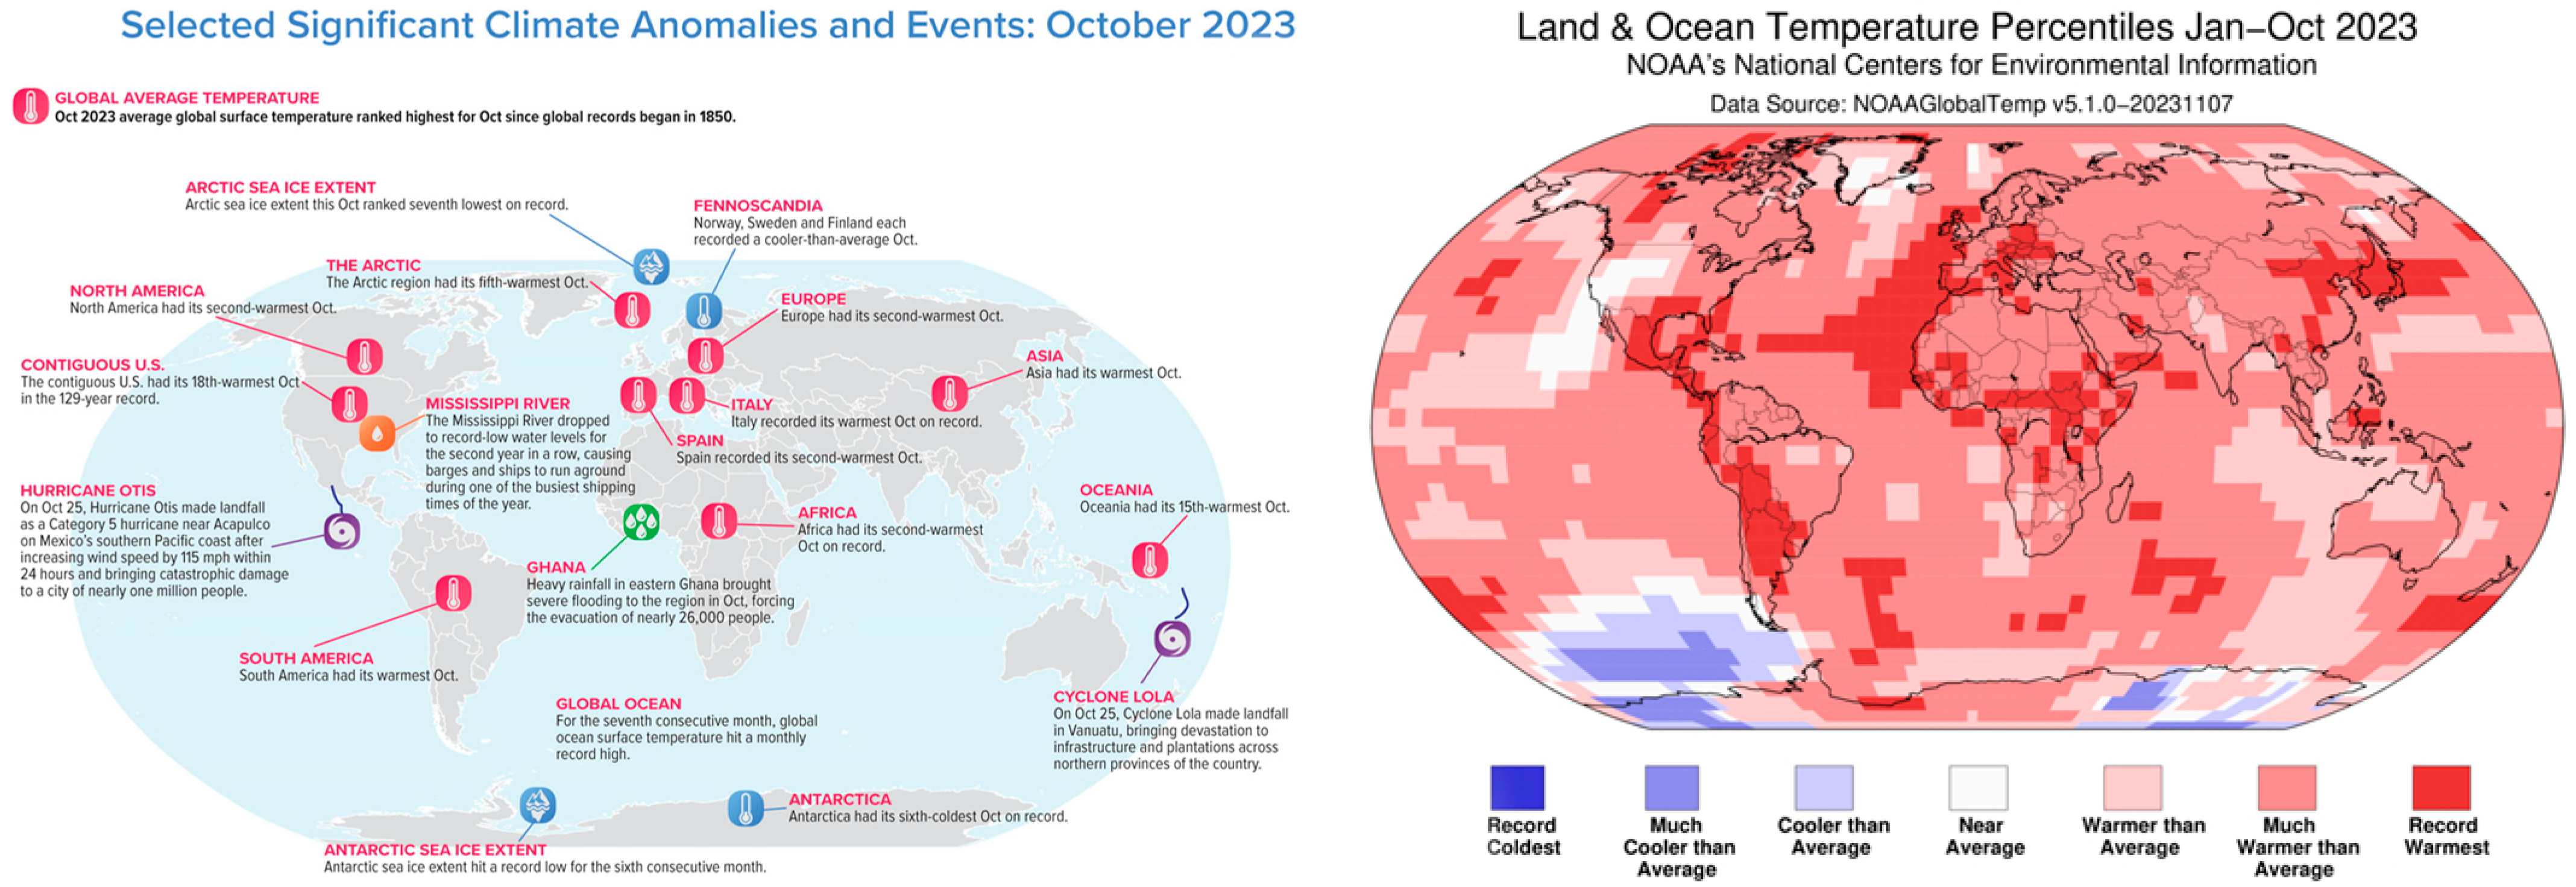
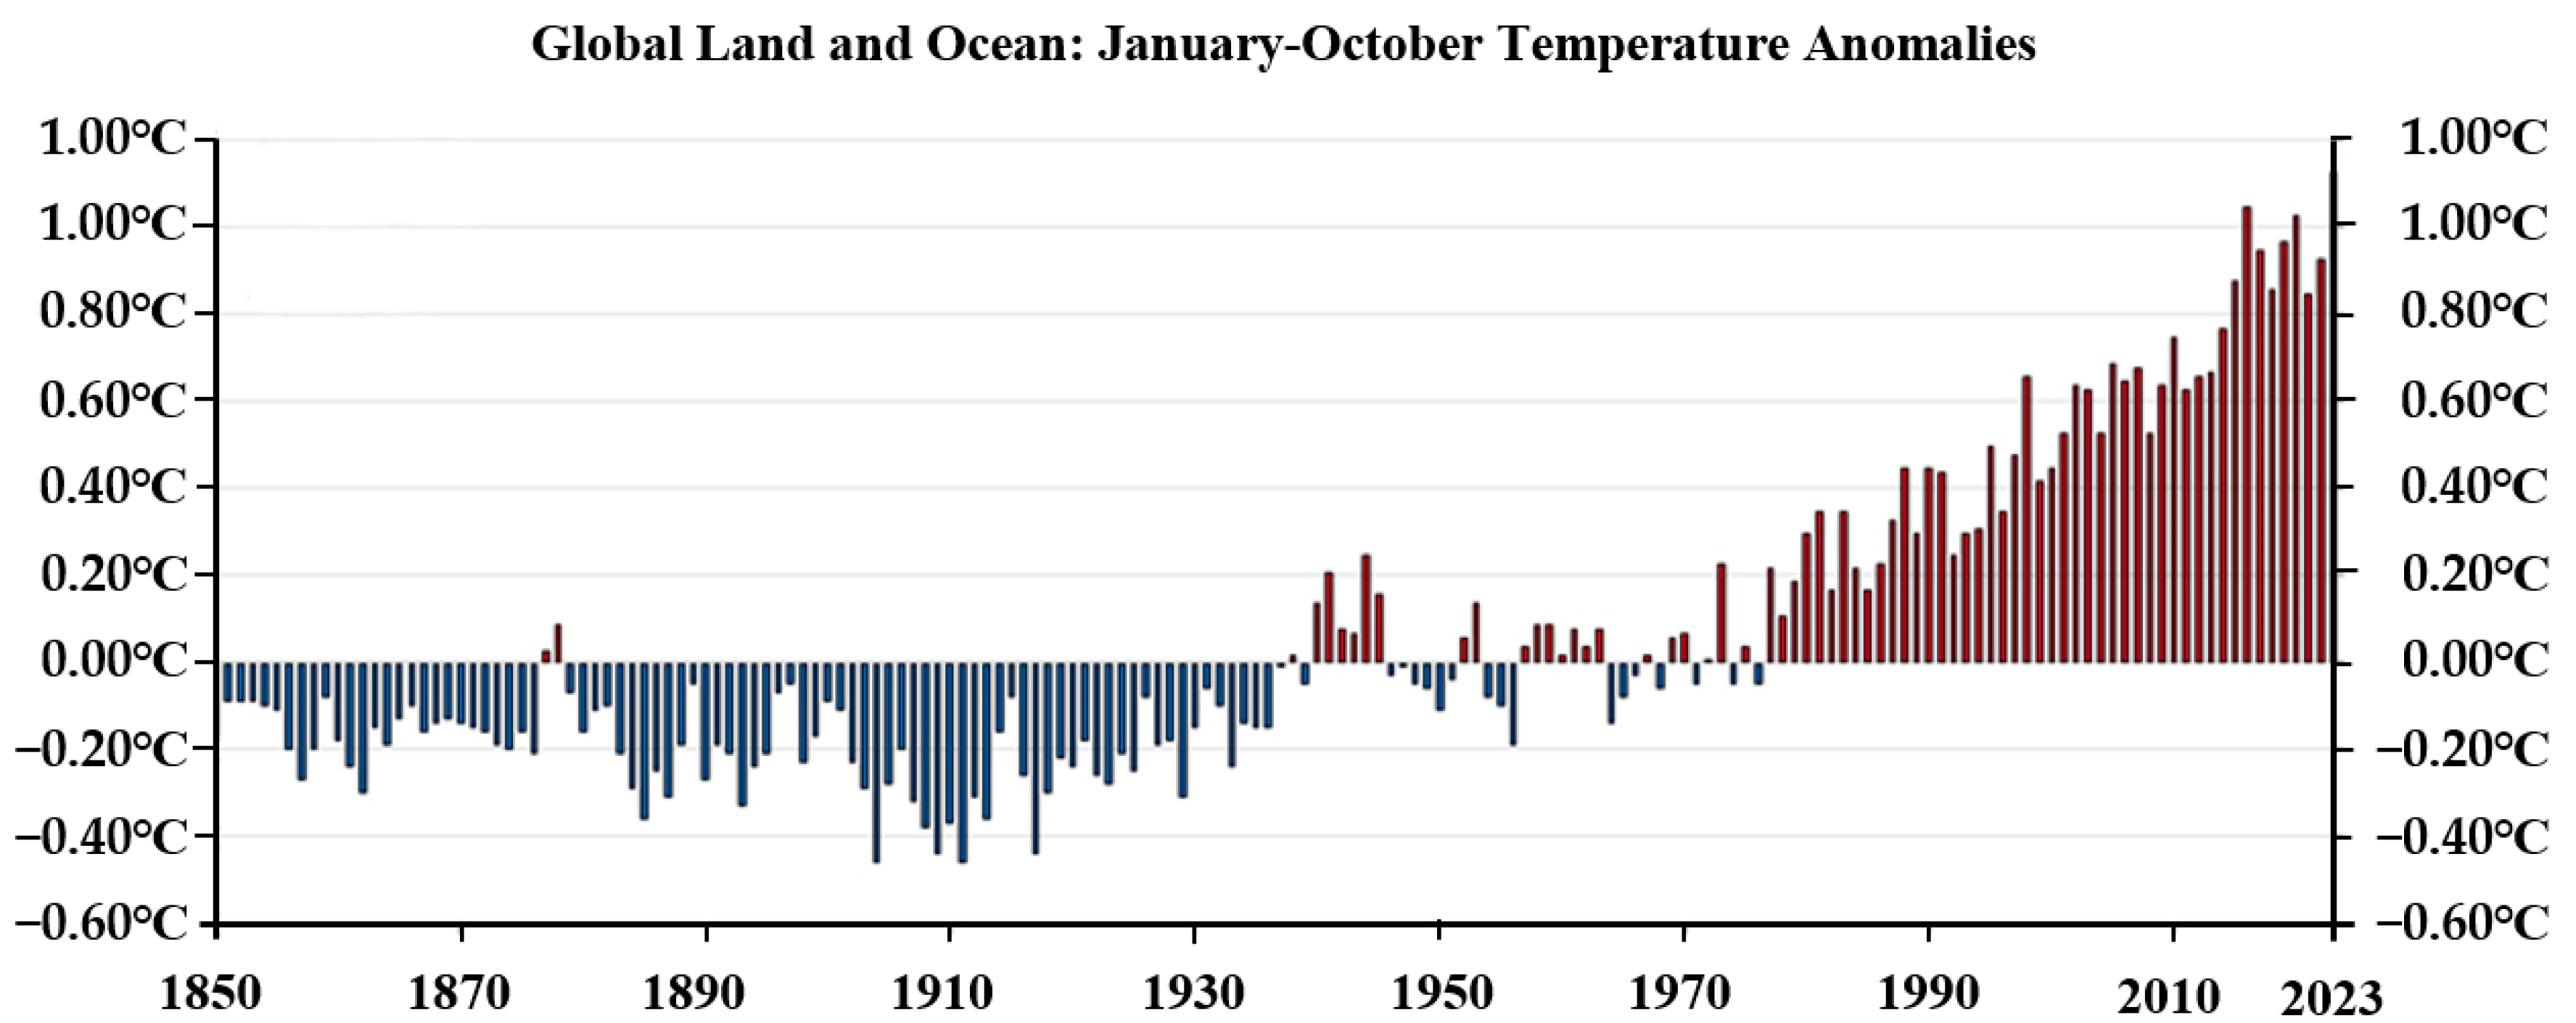
- NOAA National Centers for Environmental Information, Monthly Global Climate Report for October 2023. November 2023. Available online: https://www.ncei.noaa.gov/access/monitoring/monthly-report/global/202310 (accessed on 28 November 2023).
- Lee, H.; Calvin, K.; Dasgupta, D.; Krinmer, G.; Mukherji, A.; Thorne, P.; Trisos, C.; Romero, J.; Aldunce, P.; Barret, K.; et al. Synthesis Report of the IPCC Sixth Assessment Report (AR6); Longer Report; IPCC: Geneva, Switzerland, 2023. [Google Scholar]
- Haszeldine, R.S.; Flude, S.; Johnson, G.; Scott, V. Negative emissions technologies and carbon capture and storage to achieve the Paris agreement commitments. Phil. Trans. R. Soc. A 2018, 376, 20160447. [Google Scholar] [CrossRef] [PubMed]
- Fourth National Climate Assessment: Volume II: Impacts, Risks, and Adaptation in the United States; U.S. Global Change Research Program: Washington, DC, USA, 2018.
- European Climate Risk Assessment: Exclusive Summary; European Environment Agency: Copenhagen Denmark, 2024.
- Amir, T.; Erik, L.; Ole, T.; Dag, W.-B. Qualitative and quantitative experimental study of convective mixing process during storage of CO2 in homogeneous saline aquifers. Int. J. Greenh. Gas Control 2017, 66, 159–176. [Google Scholar] [CrossRef]
- Holloway, S. Carbon dioxide capture and geological storage. Philosophical Transactions of the Royal Society. Math. Phys. Eng. Sci. 2007, 365, 1095–1107. [Google Scholar]
- Adil, A.; Venkat, L.; Duke, B.; Knapp, C.C.; Knapp, J.H. Simulation of carbon dioxide mineralization and its effect on fault leakage rates in the South Georgia rift basin, southeastern U.S. Heliyon 2022, 8, e09635. [Google Scholar] [CrossRef]
- Bashir, A.; Ali, M.; Patil, S.; Aljawad, M.S.; Mahmoud, M.; Al-Shehri, D.; Hoteit, H.; Kamal, M.S. Comprehensive review of CO2 geological storage: Exploring principles, mechanisms, and prospects. Earth-Sci. Rev. 2024, 249, 104672. [Google Scholar] [CrossRef]
- Ranaee, E.; Khattar, R.; Inzoli, F.; Blunt, M.J.; Guadagnini, A. Assessment and uncertainty quantification of onshore geological CO2 storage capacity in China. Int. J. Greenh. Gas Contr. 2022, 121, 103804. [Google Scholar] [CrossRef]
- Ismail, I.; Gaganis, V. Carbon Capture, Utilization, and Storage in Saline Aquifers: Subsurface Policies, Development Plans, Well Control Strategies and Optimization Approaches—A Review. Clean Technol. 2023, 5, 609–637. [Google Scholar] [CrossRef]
- Kearns, J.; Teletzke, G.; Palmer, J.; Thomann, H.; Kheshgi, H.; Chen, Y.H.H.; Herzog, H. Developing a consistent database for regional geologic CO2 storage capacity worldwide. Energy Procedia 2017, 114, 4697–4709. [Google Scholar] [CrossRef]
- Zapata, Y.; Kristensen, M.R.; Huerta, N.; Brown, C.; Kabir, C.S.; Reza, Z. CO2 geological storage: Critical insights on plume dynamics and storage efficiency during long-term injection and post-injection periods. J. Nat. Gas Sci. Eng. 2020, 83, 103. [Google Scholar] [CrossRef]
- Addassi, M.; Omar, A.; Hoteit, H.; Afifi, A.M.; Arkadakskiy, S.; Ahmed, Z.T.; Kunnummal, N.; Gislason, S.R.; Oelkers, E.H. Assessing the potential of solubility trapping in unconfined aquifers for subsurface carbon storage. Sci. Rep. 2022, 12, 20452. [Google Scholar] [CrossRef]
- Benson, S.M.; Cole, D.R. CO2 sequestration in deep sedimentary formations. Elements 2008, 4, 325–331. [Google Scholar] [CrossRef]
- Elif Agartan; Trevisan, L.; Cihan, A.; Birkholzer, J.; Zhou, Q.; Illangasekare, T.H. Experimental study on effects of geologic heterogeneity in enhancing dissolution trapping of supercritical CO2. Water Resour. Res. 2015, 51, 1635–1648. [Google Scholar] [CrossRef]
- Kumar, S.; Foroozesh, J.; Edlmann, K.; Rezk, M.G.; Lim, C.Y. A comprehensive review of value-added CO2 sequestration in subsurface saline aquifers (Review). J. Nat. Gas Sci. Eng. 2020, 81, 103437. [Google Scholar] [CrossRef]
- Bachu, S. Review of CO2 storage efficiency in deep saline aquifers. Int. J. Greenhouse Gas Control 2015, 40, 188–202. [Google Scholar] [CrossRef]
- Guodong, C.; Zhe, H.; Yanyong, W.; Shu, J.; Rui, W. Migration characteristics and local capillary trapping mechanism after the CO2 leakage out of saline aquifers. Fuel 2024, 356, 129347. [Google Scholar] [CrossRef]
- Bello, A.; Dorhjie, D.B.; Ivanova, A.; Cheremisin, A. Numerical sensitivity analysis of CO2 mineralization trapping mechanisms in a deep saline aquifer. Chem. Eng. Sci. 2024, 283, 119335. [Google Scholar] [CrossRef]
- Xiaocong, L.; Denis, V. Advanced modeling of enhanced CO2 dissolution trapping in saline aquifers Int. J. Greenh. Gas Contr. 2023, 127, 103907. [Google Scholar] [CrossRef]
- Li, D.; Jiang, X. Numerical investigation of convective mixing in impure CO2 geological storage into deep saline aquifers. Int. J. Greenhouse Gas Control 2020, 96, 103015. [Google Scholar] [CrossRef]
- Singh, H. Impact of four different CO2 injection schemes on extent of reservoir pressure and saturation. Adv. Geo-Energy Res. 2018, 2, 305–318. [Google Scholar] [CrossRef]
- Xu, T.; Apps, J.A.; Pruess, K. Numerical simulation of CO2 disposal by mineral trapping in deep aquifers. Appl. Geochem. 2004, 19, 917–936. [Google Scholar] [CrossRef]
- Zhou, Q.; Birkholzer, J.T.; Tsang, C.-F.; Rutqvist, J. A method for quick-assessment of CO2 storage capacity in closed and semi-Closed porous formations. Int. J. Greenhouse Gas Control 2008, 2, 626–639. [Google Scholar] [CrossRef]
- Deng, H.L.; Stauffer, P.H.; Dai, Z.X.; Jiao, Z.S.; Surdam, R.C. Simulation of industrial-scale CO2 storage: Multi-scale heterogeneity and its impacts on storage capacity, injectivity and leakage. Int. J. Greenh. Gas Contr. 2012, 10, 397–418. [Google Scholar] [CrossRef]
- Onoja, M.U.; Williams, J.D.; Vosper, H.; Shariatipour, S.M. Effect of sedimentary heterogeneities in the sealing formation on predictive analysis of geological CO2 storage. Int. J. Greenh. Gas Control. 2019, 82, 229–243. [Google Scholar] [CrossRef]
- Cihan, A.; Birkholzer, J.T.; Bianchi, M. Optimal well placement and brine extraction for pressure management during CO2 sequestration. Int. J. Greenh. Gas Contr. 2015, 42, 175–187. [Google Scholar] [CrossRef]
- Farhat, K.; Benson, S.M. A technical assessment of CO2 Interim Storage in deep saline aquifers. Int. J. Greenh. Gas Contr. 2013, 15, 200–212. [Google Scholar] [CrossRef]
- Kolster, C.; Agada, S.; Mac Dowell, N.; Krevor, S. The impact of time-varying CO2 injection rate on large scale storage in the UK Bunter Sandstone. Int. J. Greenh. Gas Contr. 2018, 68, 77–85. [Google Scholar] [CrossRef]
- Long, N.; Peter, S.; Jim, G.; Ohkuma, H. Modeling CO2 Storage in Aquifers with a Fully-Coupled Geochemical EOS Compositional Simulator. In Proceedings of the SPE/DOE Symposium on Improved Oil Recovery, Tulsa, Oklahoma, 22–25 April 2004. [Google Scholar] [CrossRef]
- Peng, D.Y.; Robinson, D.B. A new two-constant equation of state. Ind. Eng. Chem. Fundam. 1976, 15, 59–64. [Google Scholar] [CrossRef]
- Bethke, C. Geochemical Reaction Modelling; Oxford University Press: New York, NY, USA, 1996. [Google Scholar]
- Kharaka, Y.K.; Gunter, W.D.; Aggarwal, P.K.; Perkins, E.; DeBraal, J.D. SOLMINEQ.88: A Computer Program for Geochemical Modelling of Water-Rock Reactions; Water-Resources Investigations Report 88–4227; U.S. Geological Survey: Menlo Park, CA, USA, 1989. [CrossRef]
- Delany, J.M.; Lundeen, S.R. The LLNL Thermochemical Database, Lawrence Livermore National Laboratory Report UCRL-21658. Fuel 1990, 356, 129347. [Google Scholar]
- Li, C.; Maggi, F.; Zhang, K.; Guo, C.; Gan, Y.; El-Zein, A.; Pan, Z.; Shen, L. Effects of variable injection rate on reservoir responses and implications for CO2 storage in saline aquifers. Greenh. Gases Sci. Technol. 2019, 9, 652–671. [Google Scholar] [CrossRef]
- Li, C.; Zhang, K.; Guo, C.; Xie, J.; Zhao, J.; Li, X.; Maggi, F. Impacts of relative permeability hysteresis on the reservoir performance in CO2 storage in the Ordos Basin. Greenh. Gases Ence Technol. 2017, 7, 259–272. [Google Scholar] [CrossRef]
- Thibeau, S.; Nghiem, L.X.; Ohkuma, H. A modelling study of the role of selected minerals in enhancing CO2 mineralization during CO2 aquifer storage. In SPE Annual Technical Conference and Exhibition; Society of Petroleum Engineers: Anaheim, CA, USA, 2007. [Google Scholar]
Disclaimer/Publisher’s Note: The statements, opinions and data contained in all publications are solely those of the individual author(s) and contributor(s) and not of MDPI and/or the editor(s). MDPI and/or the editor(s) disclaim responsibility for any injury to people or property resulting from any ideas, methods, instructions or products referred to in the content. |
© 2024 by the authors. Licensee MDPI, Basel, Switzerland. This article is an open access article distributed under the terms and conditions of the Creative Commons Attribution (CC BY) license (https://creativecommons.org/licenses/by/4.0/).