Article

Properties of Cement Thermal Insulation Materials Containing Tailing Waste for Connecting Mines Assessed Using the Orthogonal Method with the Response Surface Method

School of Resources and Safety Engineering, Central South University, Changsha 410083, China
*
Author to whom correspondence should be addressed.
Processes 2023, 11(9), 2652; https://doi.org/10.3390/pr11092652
Submission received: 1 August 2023 / Revised: 24 August 2023 / Accepted: 27 August 2023 / Published: 5 September 2023

Abstract

:
High temperature in deep mines has become the main concern to limit the production capacity of mines. To mitigate the adverse impact of the underground high-temperature environment on mine production, an orthogonal test was used to design an experimental scheme, i.e., the contents of tailings, glass beads, and ordinary Portland cement PC32.5 (PC) were set as the main horizontal factors to prepare thermal insulation material samples with different combination ratios. Compressive strength and thermal conductivity were investigated, as well as the microstructure. Based on the response surface method (RSM), the interaction between the horizontal factors was explored and analyzed using Design Expert 12 software, and thus non-linear fitting equations were established with the volume fractions of the main horizontal factors as independent variables and compressive strength and thermal conductivity as dependent variables in the analysis parameters of thermal insulation materials. The results showed that errors between the fitted calculated values of compressive strength and thermal conductivity and the experimental results were only 0.42% and 1.2%, respectively, indicating that the process parameters obtained with the optimum fitting ratio under the established fitting equation are highly reliable and have excellent compressive strength and thermal insulation properties. The optimized results obtained by combining the orthogonal method and the RSM show accurate prediction and applicability in the field of thermal insulation materials in mines.

1. Introduction

With the development of society and economy, shallow surface deposit mining can no longer meet industrial growth demands. Consequently, deeper and more complex mines have become the primary concern for resource extraction [1,2]. However, the problem of thermal damage in mines affected by high temperatures in deep shaft mining is becoming increasingly prominent [3]. Several studies have shown that the ambient temperature in mines, once exceeding the regulation temperature, has a destructive effect on the psychology and physiology of miners, which can even cause accidents, including fatalities [4]. Therefore, with the goal of prevention and control of high-temperature heat damage in deep shafts and safe deep mining, it is necessary to carry out the scientific analysis of various means of heat damage protection in the surrounding rock environment and the adoption of effective management methods.
Previous research focusing on underground heat damage management can be divided into three main categories: ventilation cooling [5,6,7], cooling assisted by cooling equipment [8,9], and cooling with underground rock insulation materials. Xin et al. [10] optimized air supply conditions and energy-saving control by designing a reliable auxiliary ventilation system and performing numerical simulations. Agus et al. [11] added an air-conditioning system to the original ventilation system to optimize the ventilation structure and evaluated the thermal management of mechanical heat dissipation and worker thermal comfort.
Even though cooling methods, such as ventilation and refrigeration equipment, have been applied to manage mine heat damage with a certain effect, the optimization of the design of the underground wind network usually requires the excavation of new tunnels. This operation increases the cost consumed, accompanied by poor effects. In addition, the use of mine ventilation and refrigeration equipment in mines is not conducive to large-scale underground engineering, in which mechanical equipment causes heat transfer and wind pollution. Therefore, to reduce the impact of heat damage on the working environment, researchers have conducted in-depth studies on coated thermal insulation materials and actively explored composite materials with better thermal insulation properties [12,13]. Common tools used to study and test composite insulation materials consist of testing of mechanical properties, testing of thermal conductivity, and microscopic analysis (pore changes in the internal structure using scanning electron microscopy (SEM)). For instance, Liu [14] produced an aerogel fiber with high thermal insulation properties in a harsh environment and analyzed the thermal conductivity of individual aerogel fibers through uniaxial compressive strength experiments and SEM tests and applied COMSOL simulation to find an effective way to improve the thermal insulation properties of aerogel fibers. Abderraouf and Zied [15] included cactus fibers in concrete formulations and evaluated the compressive strength and thermal conductivity of the material to develop an eco-light concrete with high resistance. Feng et al. [16] prepared thermal insulation composites by doping carbon aerogel with carbon fibers. The thermal performance of the formed insulation material was investigated using SEM and flexural testing. Zhang et al. [17] developed a composite thermal barrier coating consisting of heat-resistant coating and a polyurethane foam plastic layer. In addition, thermal insulation is used in high-temperature deep shaft tunnels to reduce the impact of heat damage [18,19]. To improve the efficiency of thermal insulation, the principle of heat transfer is used to spray high-performance thermal insulation materials to reduce the transfer of heat from the original rock to the surrounding rock, which can to some extent avoid the economic consumption caused by the secondary excavation of new tunnels and large cooling equipment. Hou et al. [20] used basalt fiber, glass fiber, and glass beads as raw materials to prepare three kinds of mineral thermal insulation materials. Furthermore, COMSOL simulation was performed to symbolize that specimens with basalt fibers improved the thermal insulation effect than ordinary ones. Previous research mainly focused on thermal insulation materials developed by mixing different chemical materials with good thermal conductivity based on concrete material. There is still a lack of exploration on insulation materials used to prevent thermal damage to raw rocks in high-temperature environments.
An orthogonal experiment is a commonly used method to analyze the weight of multiple factors at multiple levels and to study the optimal proportioning of materials for multi-factor-level combination ratios [21,22]. This approach can obtain a representative test solution among all factor combinations according to the average factor assignment and comparison. For this method, Lan et al. [23] used the orthogonal design method to determine the best formulation of phosphorylase dihydrate filler, showing that the prepared filler in their study had good applicability and economic advantages. Pang et al. [24] used orthogonal tests to analyze the effect of three factors on the thermal insulating capacity of insulating concrete materials and derived the optimum ratio using an efficacy factor model. Moreover, the response surface method (RSM) is a statistical analysis method based on mathematical and experimental data for the solution of multi-variable optimization problems [25]. By constructing a response surface model between each experimental factor and the response value, a functional relationship is established between the response target and the design variables to achieve an optimal solution for the response value. As mentioned in a previous study [26], if only the single-factor effects of orthogonal experiments are analyzed, it may cause the coverage of inter-factor effects, i.e., the magnitude of the interaction between factors cannot be clarified. By combining the RSM with orthogonal tests, it is possible to achieve fewer tests, higher accuracy, and better prediction. Meanwhile, the interaction between the factors can be considered. To this end, subsequent regression fitting analysis was performed based in Design Expert 12 software for non-linear data, and thus fitting equations were established [27,28,29]. A three-dimensional surface was acquired in which level factors were used as independent variables and the corresponding experimental results as dependent variables. This surface contributed to demonstrating the extent of the interactions between the variables.
In summary, several heat damage management methods commonly used in mines have been tested and studied by scholars. In addition, the preparation of heat-insulating materials can effectively reduce heat diffusion and achieve a wide range of applications. However, from existing research results, it can be seen that studies on the preparation of heat-insulating materials with secondary resource tailings as the main raw material seldom make accurate optimization of the dosage. For this reason, practicing the concept of solid waste resourcefulness, macroscopic and microscopic testing experiments were carried out on the prepared large-doped tailing thermal insulation materials, and the relationship between compressive strength, thermal conductivity, and different doping amounts was analyzed. The prediction models of compressive strength and thermal conductivity were established based on thermodynamic parameters. This paper provides a new idea for the research of high-temperature control technology in deep mining.

2. Materials and Methods

2.1. Materials

The performance of produced insulation material is closely related to the raw materials used to prepare it. The selected tailings as aggregate particles were sourced from the Guangxi Huaxi Gaofeng Mine in China, which reduce production costs. Due to the gel effect and cost, ordinary Portland cement PC32.5 (PC) was chosen as the main cementitious material. Closed-cell glass beads have stable physical and chemical properties along with aging resistance and were used in this study. To create an alkaline environment, the pH was adjusted by adding appropriate amounts of quicklime and slaked lime. First, active CaO reacts with water to form Ca (OH)2, which increases the alkalinity of the slurry, accelerates the diffusion and dissolution of the slag, and contributes to the generation of caliche to avoid mound collapse. If the alkalinity is too high or too low during slurry formation, it will lead to a reduction in composite strength. After pre-testing and research [30], it was found that excellent alkaline stimulation could be achieved when the ratio of tailing sand:quicklime:gypsum was 5:2.5:0.5. The chemical compositions of tailings and closed-cell glass beads are given in Table 1, Table 2 and Table 3.

2.2. Pilot Program Design

Thermal insulating materials for the production of high-temperature roadways were obtained by mixing and blending different raw materials. However, the performances of the materials prepared differed from the blending proportion of raw materials. By keeping the other doping amounts constant, the impact of raw materials, including tailings, glass beads, and PC, on mechanical and thermal insulation properties was investigated. The test approaches are described in Section 2.4. The orthogonal experimental design [31,32] is well suited to the optimization model study. It can better analyze the relationship between factors and arrive at a formulation group with the test objectives. Therefore, a 3-factor, 3-level orthogonal table L9 (33) was designed according to pre-experimental screening results and the design of orthogonal tests to carry out the tests with 9 groups, as shown in Table 4 and Table 5. Among them, three factors (i.e., A tailings, B glass beads, C PC) and three levels (i.e., levels 1, 2, and 3) representing the three corresponding raw material dosages were designed. Factor A involved replacing 50%, 60%, and 70%, respectively, of the tailings to improve material durability. Factor B corresponded to replacing sand with 10%, 15%, and 20% volume, respectively, of glass beads. Factor C involved using 5%, 10%, and 15% cement, respectively. The compressive strength and thermal conductivity of the insulation materials were measured at different mixing ratios and analyzed to ascertain the influence of the quantity of the three factors on the thermal effectiveness of the insulation materials.

2.3. Composite Heat Insulation Material Preparation

According to the orthogonal experimental design, the required ratio of raw materials was weighed and water was added according to the ratio of water and pre-mix in the mixer for two minutes; they were mixed well enough to pour the concrete slurry into the mold. It should be noted that the process should involve continuous vibration of the concrete in the mold to make it rigid enough. To prevent moisture loss, a thin film was applied on the mold surface, which was removed after 24 h of curing. Next, the specimens were de-molded and placed in a curing box (25 °C, 90% humidity). After 28 days of curing, all specimens were taken out for experiments. According to the standard of the thermal parameter test, the mechanical property test specimen of size 70.7 × 70.7 × 70.7 mm and the thermal conductivity test specimen of size 300 × 300 × 30 mm were prepared respectively.

2.4. Test Method

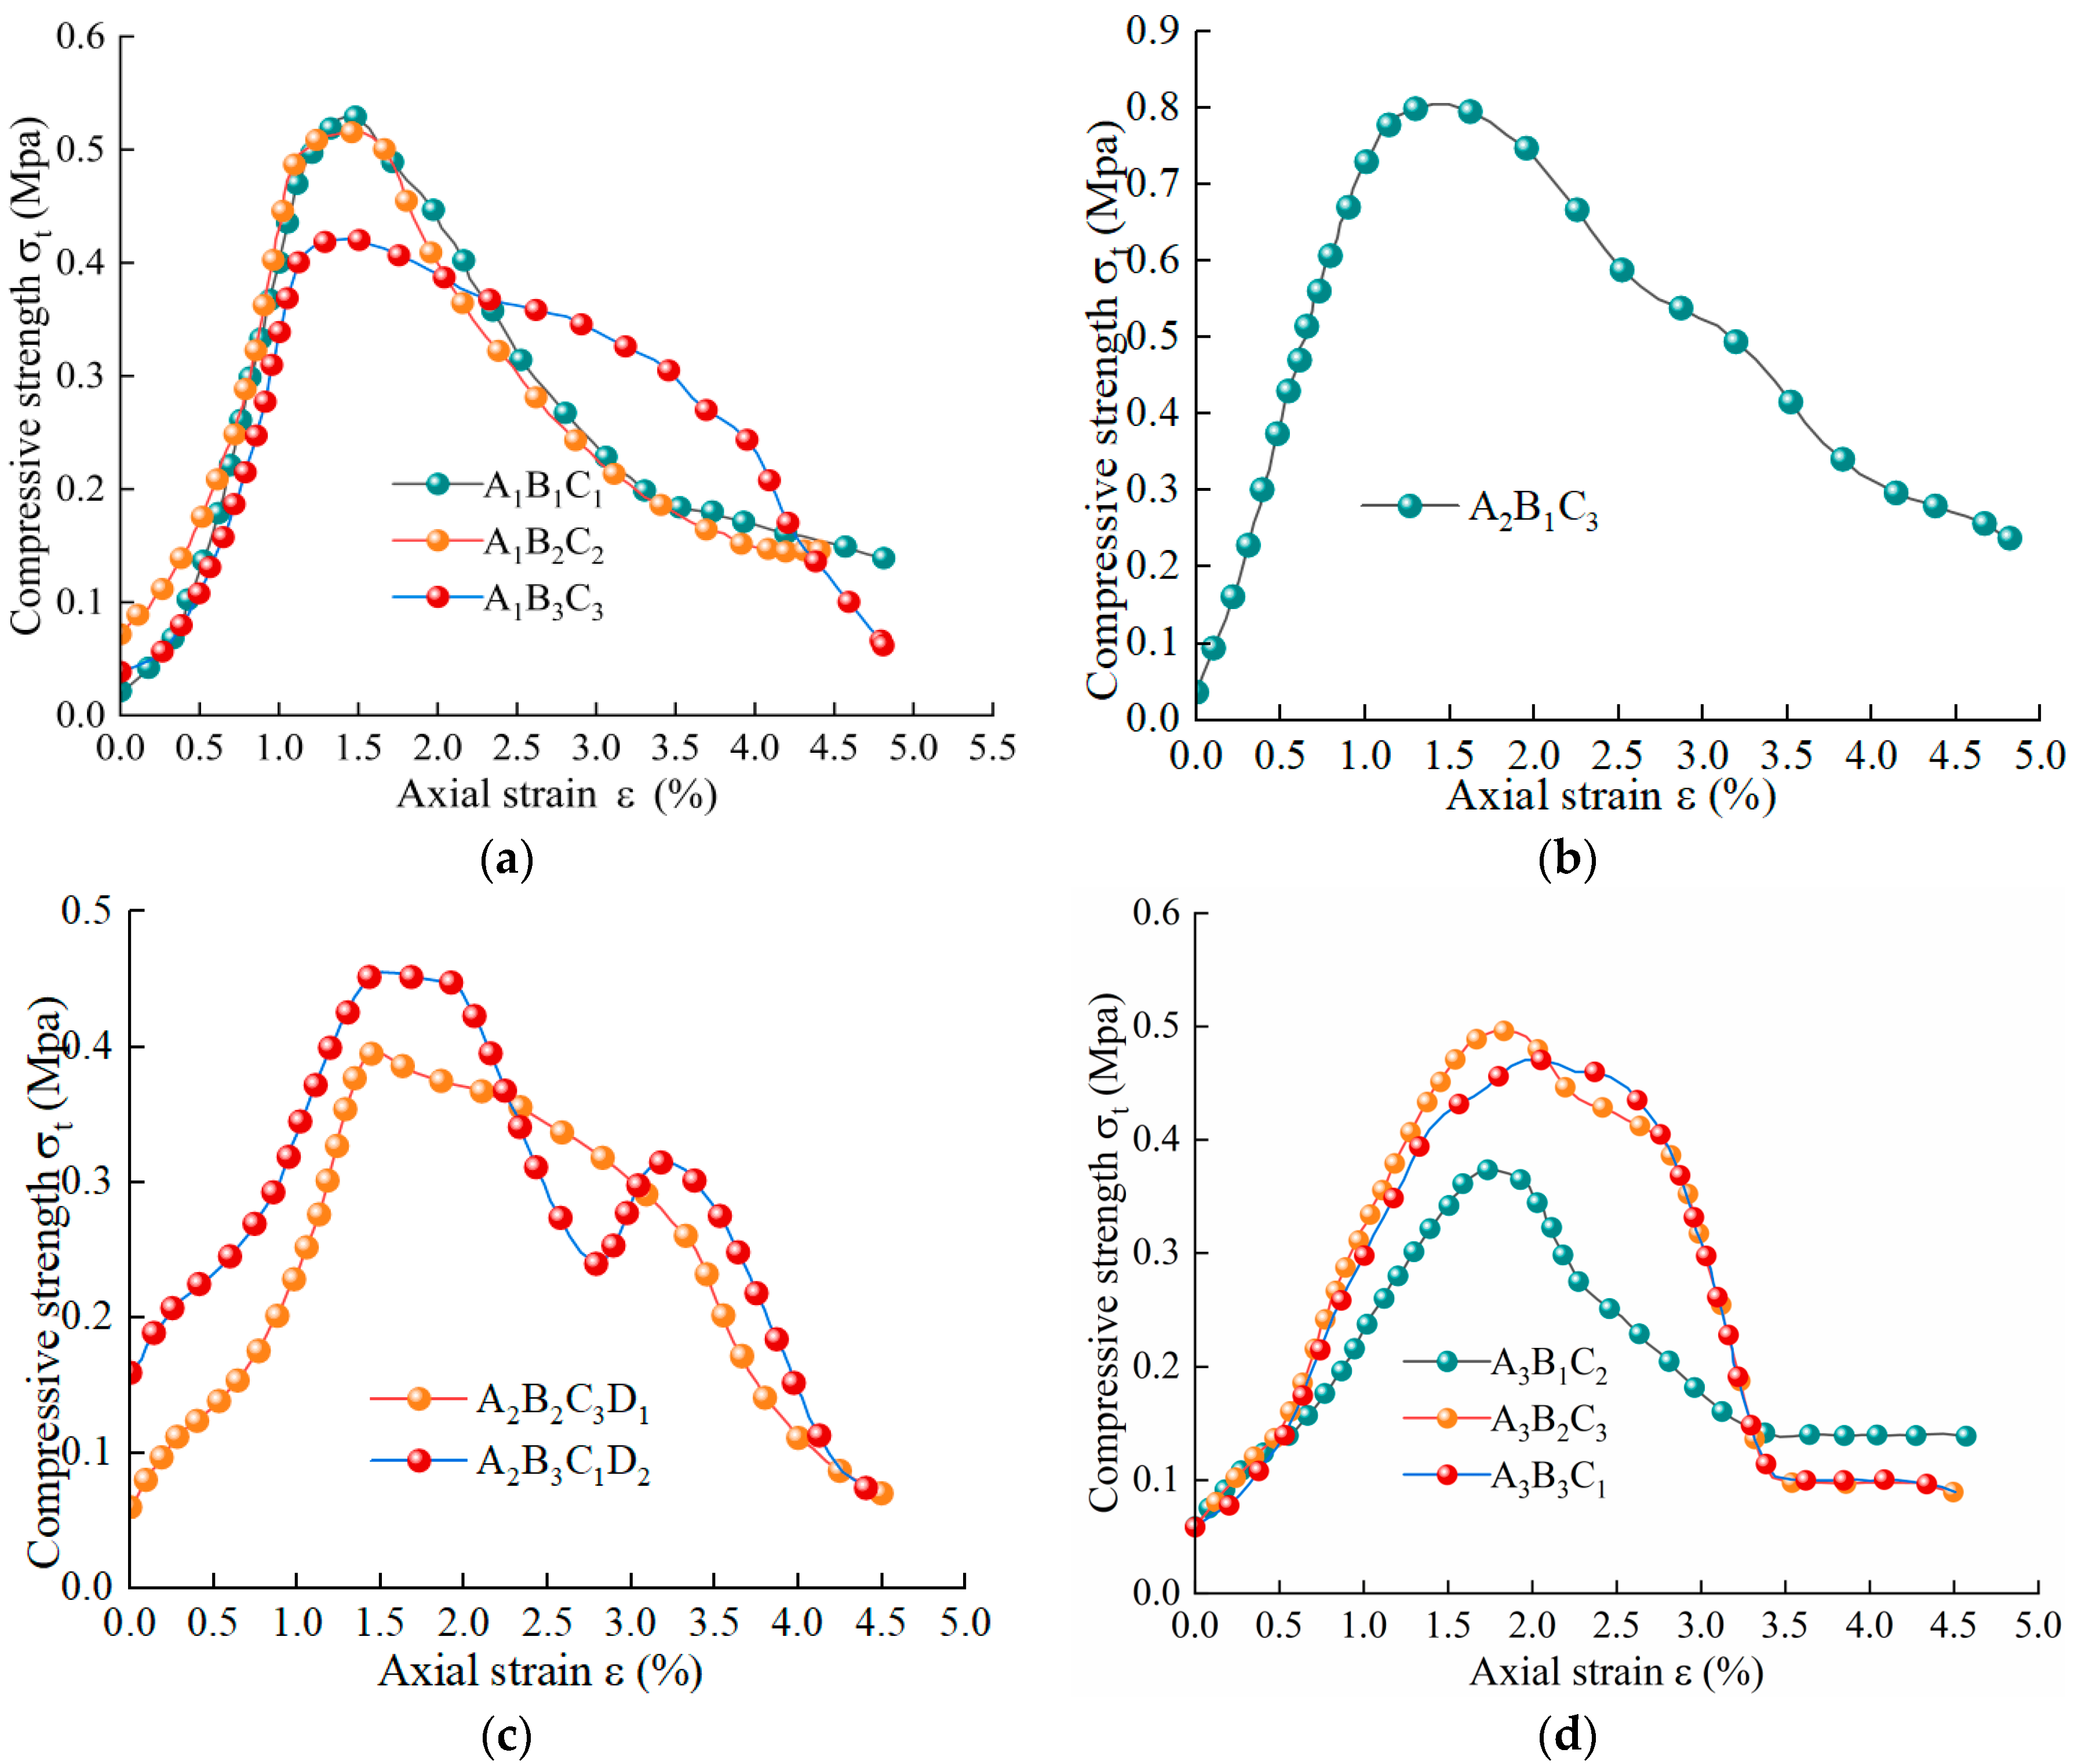
2.4.1. Compressive Strength

When the curing time reached 28 days, unconfined compressive strength (UCS) tests [33] were carried out to explore the mechanical performance of samples according to the standard GB/T 17671-2021 [34]. A TYE-2000-type (SANS, Shanghai, China) compression testing machine was used. Before the tests, the loading system applied a stress of 5 kPa to the samples, ensuring that the loading bar could be in close contact with the surface of each tested sample. A displacement loading rate of 10.0 mm/min was used to test the samples. All experiments were conducted three times, with the three results being averaged to gain the final results.

2.4.2. Thermal Conductivity

The steady-state method was chosen for measuring the thermal conductivity coefficient based on the physical properties of insulation materials [35]. The steady-state testing method for thermal conductivity (GB/T10294-2008) [36] was followed. Two samples were selected from each formula, and the difference in thickness between the two samples did not exceed 2%. The surfaces of the samples were ground smooth with sandpaper to ensure close contact with the heated and cooled plates, and all sides of the samples were wrapped in plastic film. After measuring the mass of each sample, the samples were placed in an oven until a constant weight was achieved. The temperature difference between the hot plate and the cold plate was set at 10 °C, which was required by the dial of the PDR 300 thermal conductivity meter (Leao Testing Instrument Co., Shanghai, China). The mean value was calculated as the thermal conductivity value for each group.

2.4.3. Scanning Electron Microscopy (SEM)

Under the General Rules for Scanning Electron Microscopy Measurement Methods (GB/T16594-2008) [37], the TESCAN MIRA3 field emission scanning electron microscope was selected for scanning in a high-vacuum environment [38]. The procedure was as follows: Samples were dried to a constant weight in a drying oven, the samples were evacuated, and fresh sections were sprayed with gold. Typical scanning points were selected for multi-angle photography, and SEM images at different magnifications were selected for analysis. The specific experimental procedure is shown in Figure 1.

3. Results and Discussion

The results of the tests of prepared specimens are displayed in Table 6. It should be noted that the compressive strength value after 28 days of curing ranged from 0.39 to 0.81 MPa, while the thermal conductivity value ranged from 0.268 to 0.386 w/k∙m. Obviously, the obtained thermal conductivity value was much lower than that of PC (1.71 w/k·m). The analysis and discussion are described in detail in the following sections.

3.1. Compressive Strength Analysis

The results of the compressive strength analysis of all samples are displayed in Figure 2.
The trend of the compressive strength test curve is shown in Figure 2. The stress carried by each sample increased continuously as the strain displacement increased. The stress reached the compressive strength limit when the strain changed by about 1–2%, and rapidly decreased. From Figure 3, it is apparent that the compressive strength of each experimental group was over 0.3MPa, with the highest value found in experimental group IV at 0.81MPa, specifically A2B1C3, where A, B, and C represent 60, 10, and 15, respectively. The compressive strength test results have similarities with the materials cited in the literature [39,40] as well as experimental results.
When the level of A doping was low, C doping failed to bond the tailing particles and led to a low compressive strength of the system. Conversely, when C doping was sufficient but B doping was too high, the specimen experienced uneven pressure, leading to an increase in the degree of porosity rupture and a subsequent reduction in compressive strength. However, when appropriately dosed with B, an increase in C doping optimized the system’s compressive strength, achieving the maximum value at a 60% level of A doping. This can meet the fundamental compressive needs of thermal insulation materials. Used alongside perimeter rock support and anti-cracking mesh, it offers thermal insulation, while preventing material cracking and enhancing the material’s strength tolerance.
Due to space limitation, only the compressive strength test results of the three groups of specimens in Figure 2a were analyzed. Results of two selected samples showed that the ratio of tailings to PC in A1B1C1 was 10:1. The amount of PC added was relatively small. Although small-size tailings can play a certain role in gelling, the alkaline conditions created after the reaction between tailings and slurry weakened the gelling effect of small-size tailings. Simultaneously, the micropores formed by the glass beads reduced the compressive strength of the sample. In contrast, the ratio of tailings to PC in A1B2C2 was 5:1, and the amount of PC added was higher than that in experiment no. 1, which can increase the durability and compressive strength of the material. However, increasing the amount of closed-cell glass beads increases the number of internal closed cells, which is not conducive to compressive strength materials. Therefore, the compressive strength test results for both formulas were similar. In A1B3C3, although PC reached a maximum of twice that of experimental group 1, the maximum compressive strength of the glass beads reached a maximum of 20% and the maximum compressive strength was only 0.43 MPa, but with increasing strain, the compressive strength decreased slowly, indicating that a high dosage of PC and glass beads can improve the toughness of the material.

3.2. Thermal Conductivity Analysis

Thermal insulation material containing tailings belongs to the family of inorganic mortar materials, whose thermal conductivity can be measured directly using a thermal conductivity meter. As shown in Table 6, the maximum and minimum values of thermal conductivity were 0.386 and 0.268 w/k∙m, respectively, in the nine groups of experiments. And these results have similarities with the literature [41,42].
Additionally, the difference in each group only reached 0.1 (w/k∙m), which was not significant. As is well known, porosity, along with the pore structure inside the material, is closely associated with thermal insulation performance. Taking the glass beads as an example, in this study, an increase in their content usually led to increasing porosity. The reduced thermal conductivity contributed to optimized thermal insulation performance. However, owing to other existing raw materials, the discharge pressure of partial pores was higher than the ultimate shear stress of the slurry, causing some pores to burst to form an interconnected structure. This phenomenon immensely weakened the thermal conductivity value that should have been reduced. The higher porosity represented an irregular pore structure inside the materials, affecting the mechanical properties of the material. Therefore, to obtain specimens with compactness, uniformity, and good applicability, the porosity of the material should be controlled to avoid an excessive value. That is to say, it is important to consider mechanical and thermal insulation properties comprehensively.

3.3. Orthogonal Experiment Result Analysis

Polar analysis of variance is a widely used tool in orthogonal tests to derive the order of precedence of the affectivity of the factors at each level of the test [43]. In the analysis of variance, k i represents the sum of the test data with a constant factor and level number i. For factor A, k 1 represents the sum of the test data for factor A at level 1. The arithmetic mean of k is denoted by k i ¯ . R represents the extreme variance, which is calculated as R = k m a x ¯ k m i n ¯ . The R value indicates the degree of influence of the factors on the test results. Table 7 and Table 8 show the results of polar analysis.
Table 7 and Table 8 imply that the order of effect of the three factors on the compressive strength is C > B > A and on the thermal conductivity is B > A > C. The optimum values of compressive strength and thermal conductivity were A2B1C2 and A2B1C3, respectively. Accordingly, optimum results were acquired with tailings of 60%, glass beads of 10%, and PC of 10~15%. Similar results were also investigated by Jiang et al. [44], who, using basalt fibers as the raw material, determined the order of influence of each factor on thermal insulation performance by using orthogonal tests and polar analysis of variance.

3.4. Microtext Analysis

The use of SEM can help to observe the internal structure of the material, including pores, cracks, and microstructures. In this section, the microstructures of groups 1 and 2 are presented in Figure 4.
Figure 4a shows that the surface of the cross section of A1B1C1 was rough, accompanied with irregular shaped and low interconnected pores. It can be clearly seen that porosity was relatively lower. Due to insufficient PC content, tailings with fine particles acted as a cementing agent. As a result, a cohesive structure was presented that was similar to a pile of tailing particles without porous characteristics. This is why there were fewer internal voids and a more agglomerated phase. Figure 4b presents a granular microstructure with irregular pores, high connectivity, and suitable porosity (A1B2C2). Compared to A1B1C1, increased PC caused a scaled internal microporous structure. A stable internal structure was formed under the support of larger tailing particles. Nevertheless, another finding is that connected pores accounted for a larger proportion compared with closed pores. Based on the literature [45], the heat transfer path was increased and the thermal conductivity of the material was reduced by the formation of a multi-scale porous structure with fine particles having a large specific surface area. The thermal conductivity efficiency of the interconnected pores was higher than that of the closed pores. Consequently, the overall mechanical strength was impaired.
As an additive applied in physical insulation, closed-glass beads contributed to reducing thermal conductivity due to their unique pore structure. Figure 5a,b shows that closed-cell glass beads have the potential to maintain a closed, uniform, and porous structure inside the material. However, they were closely bound to other substances under the bonding effect of PC and tailing particles. This played a key role in the thermal conductivity of the material. This finding is consistent with Yuan et al. [46], who demonstrated that increasing glass beads results in more internal connection holes. This reduces the thermal conductivity of the material and improves thermal insulation properties.

3.5. Model Fit Analysis

Based on Design Expert software, regression analyses were carried out on the compressive strength and thermal conductivity of the insulation materials at the age of maintenance. Comprehensive factors A, B, and C were analyzed, the model with the highest significance was selected, then the model was used to perform non-linear optimization prediction, and the predicting effect was ensured to obtain the optimum ratio of insulating materials with a high correlation coefficient.

3.5.1. Non-linear Fitting Analysis

Non-linear regression analysis was applied by means of a module of Design Expert software. Experimental results were subjected to regression analysis. A highly adaptive fitting regression equation was obtained through the significance test of the model and the analysis of variance.
Compressive   strength   ( C ) = 1.34947 + 0.001493 × A 0.146947 × B + 0.077947 × C + 0.002192 × A × B 0.003744 × B × C 0.00034 × A 2 + 0.001368 × B 2
Thermal   conductivity   ( T ) = 1.75516 0.014203 × A 0.157895 × B + 0.000421 × C + 0.00224 × A × B + 0.002712 × B × C 0.000123 × A 2 0.001636 × C 2
To check the reliability of the established regression equation, variance analysis was performed to test the significance of the constant, linear, quadratic (interaction), and quadratic (surface effect) terms in the fitted second-order equation model, as shown in Table 9 and Table 10. The results showed the effectiveness of the regression model in the prediction of response variables.
The model F-values for compressive strength and thermal conductivity were 275.47 and 281.28, respectively, indicating the significant effect of the model. p-Values less than 0.0500 indicated that the fitted model was statistically significant, implying that A, B, C, AB, BC, A2, and B2 are significant model terms. The lack-of-fit terms under two sets of parameters were found to be 0.2214 and 0.1832, respectively, which were not significant at the 0.05 level of significance, demonstrating high credibility of the regression equation. Table 11 also shows the statistical error analysis of the regression equation.
The regression equation obtained for compressive strength, for example, showed a high degree of accuracy. The corrected coefficient of determination was 0.9954, and the predicted R-squared value was 0.9917, which differed by less than 0.2. This indicated an excellent model fit. In addition, the signal-to-noise ratio of the model was 52.8788, with a ratio of values greater than 4, which was ideal and indicates that there was sufficient signal for the regression analysis. Similarly, the fitted regression equation for thermal conductivity met the test criteria and presented a good fit.
The difference between the actual and predicted values for compressive strength and thermal conductivity is shown in Figure 6. It should be noted that the difference between the two was less than 1.4%. Simultaneously, the deviation between the predicted values and the actual values was within the acceptable range, which is further evidence of the validity of the model.

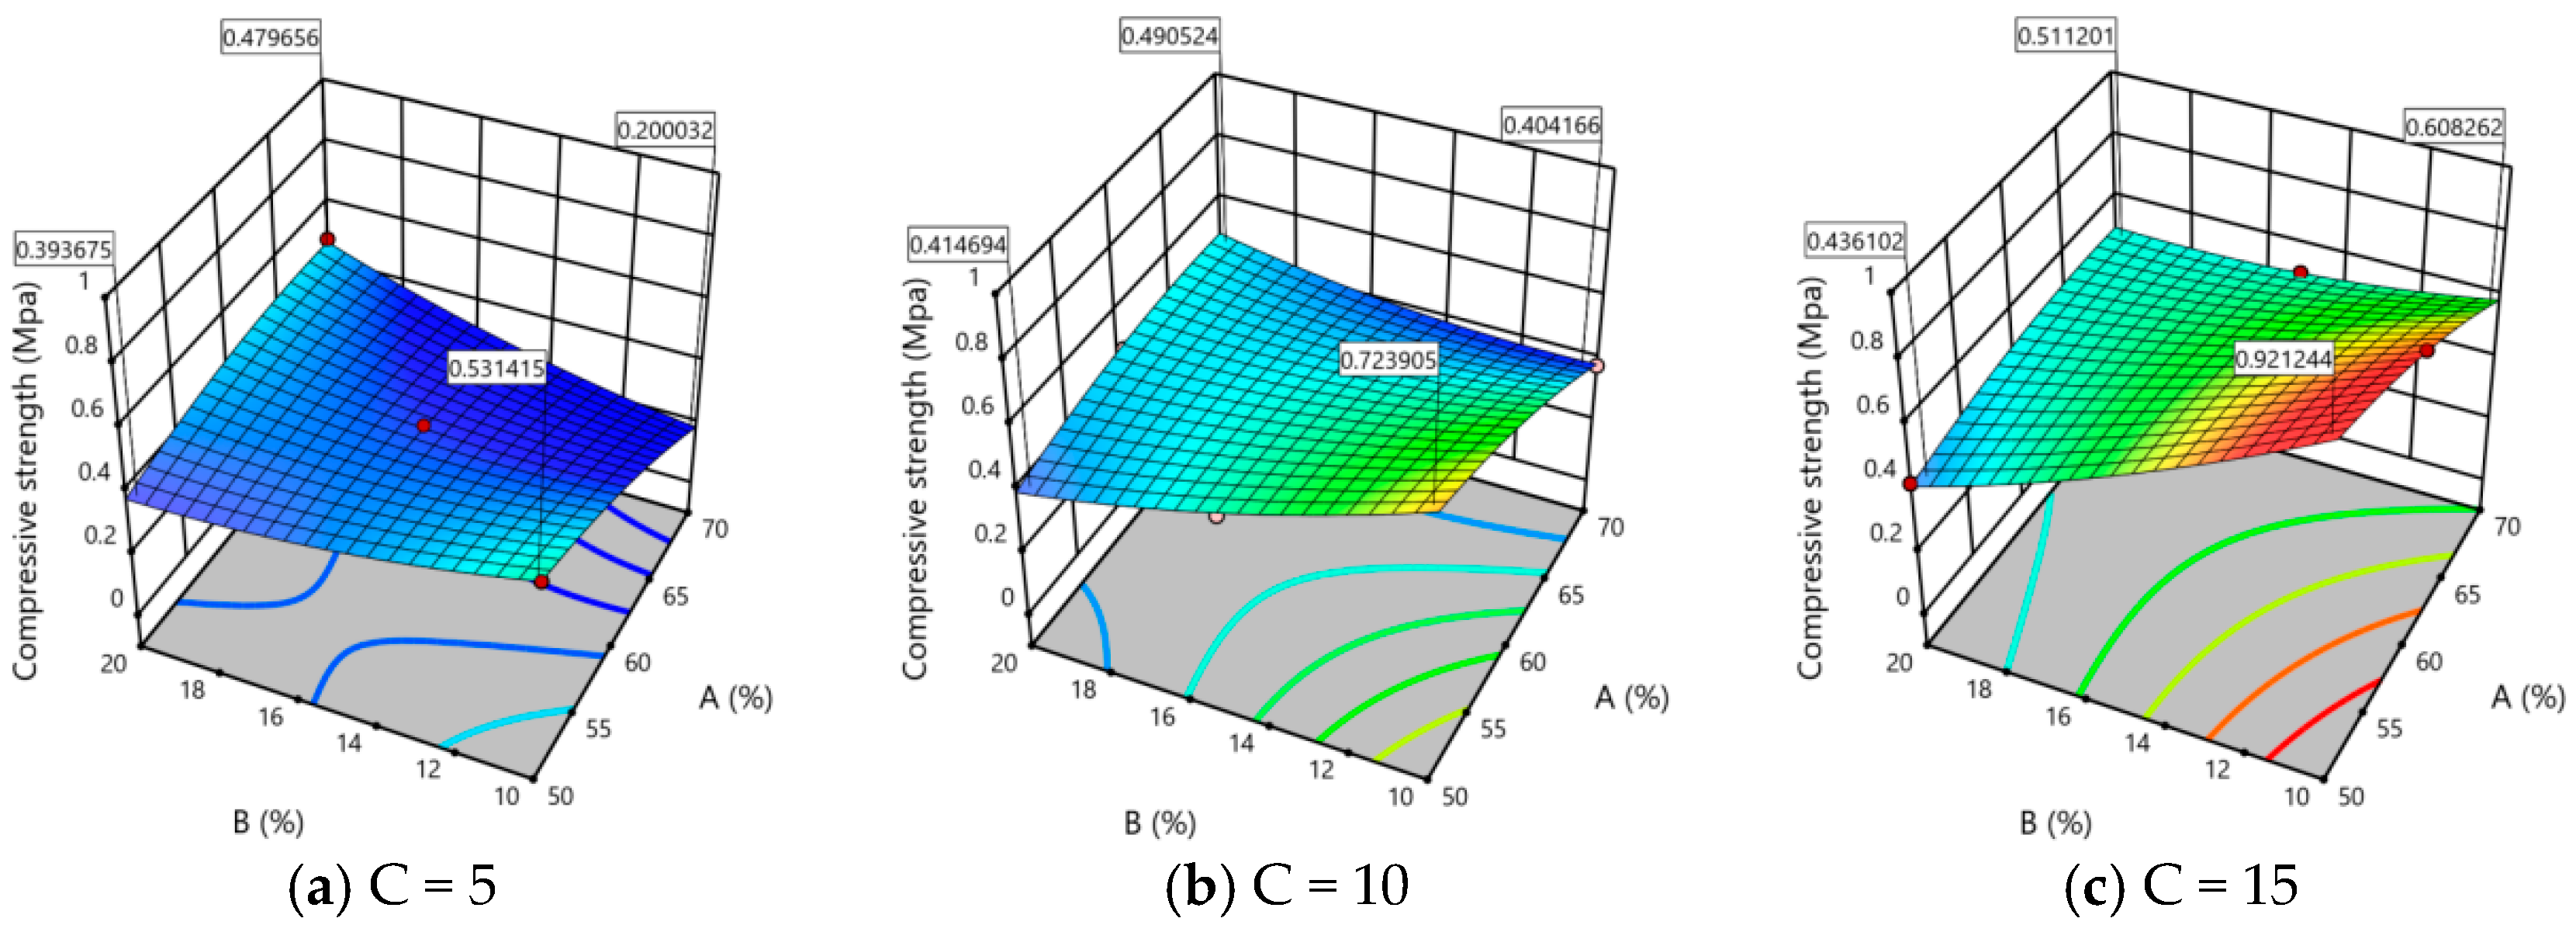
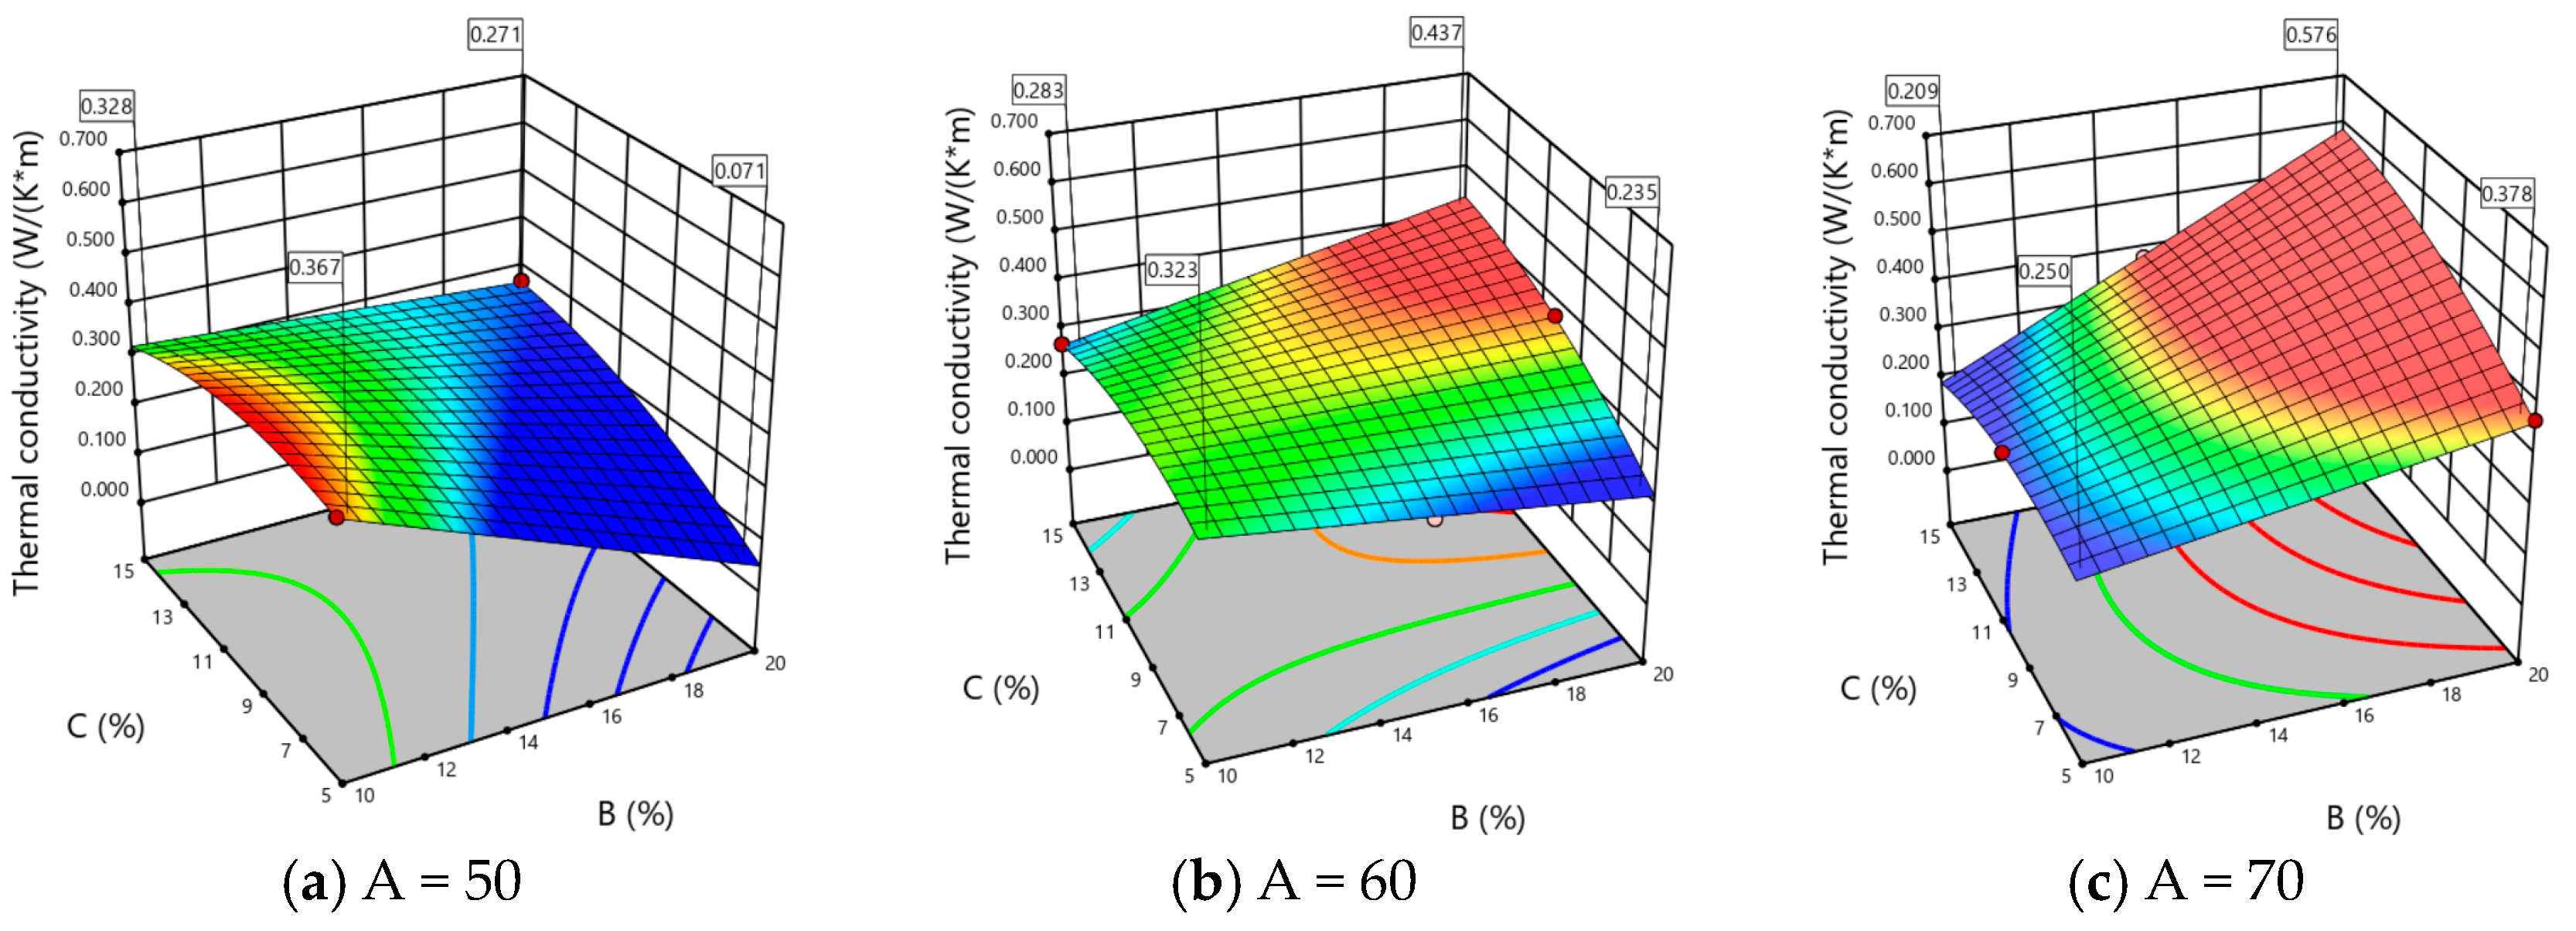
3.5.2. Visualization and Analysis

A 3D surface was generated from the square model. The effect of adjustment of the values of the factor variables on the interactive variation of compressive strength and thermal conductivity can be seen in Figure 7, Figure 8, Figure 9, and Figure 10, respectively. As can be seen from the four figures, different colors indicate the size of the resultant value, with colors closer to red indicating larger values and colors closer to blue indicating smaller values. The use of different color variations facilitates the analysis of the magnitude of the influence of each factor on the experimental results.
The interaction effects of factors A and B on compressive strength and thermal conductivity were analyzed by means of Figure 7 and Figure 9. As shown in Figure 7a, decreasing volume fractions of A and B doping increased compressive strength, with a small slope indicating weak interaction effects between these factors. As factor C increased, the interaction effects of factors A and B became more pronounced and the surface transitioned from a flat to a sloped state, with the maximum value occurring between a lower B factor (10–12%) and a lower A factor (50–55%). The compressive strength decreased as the volume fraction of factor B increased when the volume fraction of factor A was constant, with the decrease in amplitude increasing. The incorporation of glass beads had a more significant effect on compressive strength. The surface analysis of thermal conductivity as the dependent variable under the interaction effects of factors A and B is shown in Figure 9. As shown in Figure 9a, an optimum thermal conductivity value appeared when the volume fraction of factor C was 5%, with significant coupling effects between factors A and B. When the volume fraction of factor A was low, increasing the volume fraction of B led to a rapid decrease in thermal conductivity, with B having a more significant effect on thermal conductivity. However, as the volume fraction of factor C increased, the whole surface gradually floated upward, and the maximum value of thermal conductivity reached 0.572 w/k·m, with an irregular shape as the values of factors A and B changed. The coupling effect of factor B on thermal conductivity gradually decreased as the volume fraction of factor C increased. At C = 5%, good thermal conductivity performance was achieved at high glass bead (18–20%) and low waste (50–55%) content, where vitrification of the closed-cell glass beads could increase the proportion of closed pores and improve insulation performance. Reducing the PC reduced the degree of surface densification of the sample, which is beneficial for maintaining good insulation performance. Similarly, the interaction effects of factors B and C were analyzed, as shown in Figure 8 and Figure 10. As the analysis process was similar to that of factors A and B, only the results of factor B and C analysis are summarized. In terms of compressive strength, PC had a more significant effect than the glass microsphere. Optimum mechanical performance occurred at lower B factor (10–12%) and higher C factor (13–15%) values. In terms of thermal conductivity, the glass microsphere had a more significant effect than PC. The optimum thermal conductivity value occurred at lower cement (5–7%) and higher glass microsphere (18–20%) content.
The summary of the 3D surface analysis results shows that for compressive strength, the order of influence of the three factors was PC > glass beads > tailings (C > B > A), with optimal volume fractions occurring in the range of tailings (50–55%), glass beads (10–12%), and PC (13–15%). For thermal conductivity, the order of influence of the factors was glass beads > tailings (B > A) and glass beads > PC (B > C), with optimal volume fractions occurring in the range of tailings (50–55%), glass beads (18–20%), and PC (5–7%). In addition, a similar order of influence as the orthogonal test range analysis was found in the analysis of the interaction effects between the factors in the model fitting. Since the analysis focused on the range of values for each factor volume fraction that gave optimal results for compressive strength and thermal conductivity, it is necessary to consider both factors together to obtain optimal volume fractions that meet practical engineering needs.
Design Expert 12 software was used to analyze the optimal volume fractions of the surface model, considering the concept of environmentally friendly treatment of solid mine tailings [47,48]. The selection of a large number of tailings as the basic raw material for the production of thermal insulation materials, while ensuring optimal insulation performance, can reduce costs and have a positive effect on the improvement of the economic development benefits of mines. Therefore, the volume fraction data of each factor under the prediction model were calculated based on the compressive strength (C) maximum and the thermal conductivity (T) minimum. The optimal formulation was selected based on the principle of closeness to a feasibility coefficient of 1 and actual economic benefit requirements.
The predicted optimal combination ratios under the model were calculated as follows: A at 65.2%, B at 10.4%, and C at 14.7%. The predicted response results were C = 0.707 MPa and T = 0.234 w/k·m. To verify the compressive strength and thermal conductivity of the insulation material at this predicted optimum volume fraction, three tests were carried out for the same ratio under experimental conditions and the average value was taken as the final result. The experimental C was 0.698 MPa, and T was 0.231 w/k·m. The prediction deviation was calculated by taking the absolute difference between predicted values and experimental actual values, divided by the predicted values. The deviation of C was 0.42%, and that of T was 1.2%. The results showed that the optimum combination ratio under the fitting equation was accurate and reasonable, and the material ratio under the prediction model could achieve an optimum result with high reliability and excellent compressive strength and thermal insulation performance.

4. Conclusions

Through the orthogonal design of nine groups of tests to conduct thermodynamic parameter testing, to optimize the results of the study using response surface design to obtain the best ratio of theoretical calculations, and finally to meet the objective of the maximum compressive strength and minimum thermal conductivity to perform prediction and experimental verification, we found that the preparation of the conformity of thermal insulation materials can reduce the effect of the temperature and indicates high applicability of the study. The conclusions of the study are summarized as follows:
(1) The internal pore structure of highly doped tailing insulation material is irregular, and the proportion of interconnected pores is relatively larger. The optimum levels of compressive strength and thermal conductivity are obtained in the range of 60% of tailings, 10% of glass beads, and 10% to 15% of PC.
(2) The order of effect of the three raw materials on the compressive strength of the insulation material is PC > glass beads > tailings and on thermal conductivity is glass beads > tailings > PC.
(3) The multivariate non-linear regression fit equation obtained using response surface analysis had a signal-to-noise ratio much greater than 4. The order of interaction of compressive strength is PC > glass beads > tailings and of thermal conductivity is glass beads > tailings and glass beads > PC.
(4) The volume fractions of the optimum dosage of the three main raw materials of the prepared thermal insulation materials were synthesized from the fitted equations to be 65.2% for the tailings, 10.4% for the glass beads, and 14.7% for PC. The deviation values of compressive strength and thermal conductivity under the experimental preparation test and non-linear fitting were 0.42% and 1.2%, respectively. This indicated that the model is well optimized and the optimum doping results obtained are reliable.
The results obtained in this paper are practical and useful in the development of thermal insulation materials. Industrial application experiments in mines should be carried out in the future.

Author Contributions

Conceptualization, H.D., Y.L. and C.R.; methodology, C.R.; validation, H.D.; investigation, C.R.; writing—original draft preparation, C.R.; writing—review and editing, H.D. and C.R.; visualization, C.R.; supervision, H.D. All authors have read and agreed to the published version of the manuscript.

Funding

This research was funded by [Hongwei Deng] grant number [2022-JSKSSYS-08].

Institutional Review Board Statement

Not applicable.

Data Availability Statement

All data in this paper were obtained from our experiment and are authentic and reliable. The publication of data has the consent of all authors.

Conflicts of Interest

The authors declare no conflict of interest.

References

  1. Ranjith, P.G.; Jian, Z.; Ju, M. Opportunities and Challenges in Deep Mining: A Brief Review. Engineering 2017, 3, 546–551. [Google Scholar] [CrossRef]
  2. Li, X.B.; Zhou, J.; Wang, S.F.; Liu, B. Review and practice of deep mining for solid mineral resources. Chin. J. Nonferrous Met. 2017, 27, 27. [Google Scholar]
  3. You, S.; Sun, J.; Ji, H. Analysis of Thermal Environment and Its Influencing Factors in Deep Stope of Metal Mine. Geofluids 2022, 2022, 6408714. [Google Scholar] [CrossRef]
  4. Roghanchi, P.; Kocsis, K.C. Challenges in Selecting an Appropriate Heat Stress Index to Protect Workers in Hot and Humid Underground Mines. Saf. Health Work 2017, 9, 10–16. [Google Scholar] [CrossRef] [PubMed]
  5. Tu, R.; Huang, L.; Jin, A. Characteristic studies of heat sources and performance analysis of free-cooling assisted air conditioning and ventilation systems for working faces of mineral mines. Build. Simul. 2021, 14, 12. [Google Scholar] [CrossRef]
  6. Zhou, Z.; Cui, Y.; Tian, L. Study of the Influence of Ventilation Pipeline Setting on Cooling Effects in High-Temperature Mines. Energies 2019, 12, 4074. [Google Scholar] [CrossRef]
  7. Dingyi, W.; Cuifeng, D.; Haiyue, X. Influencing factors and correlation analysis of ventilation and cooling in deep excavation roadway. Case Stud. Therm. Eng. 2023, 14, 100483. [Google Scholar] [CrossRef]
  8. Chu, Z.; Ji, J.; Zhang, X. Development of ZL 400 Mine Cooling Unit Using Semi-Hermetic Screw Compressor and Its Application on Local Air Conditioning in Underground Long-Wall Face. Arch. Min. Sci. 2016, 61, 949–966. [Google Scholar]
  9. Van Staden, H.J.; Van Rensburg, J.F.; Groenewald, H.J. Optimal use of mobile cooling units in a deep-level gold mine. Int. J. Min. Sci. Technol. 2020, 30, 547–553. [Google Scholar] [CrossRef]
  10. Xin, S.; Han, X.; Li, S. Application of Data Envelopment Analysis in the Ventilation and Cooling Efficiency Evaluation of Hot Development Headings. Processes 2022, 10, 1375. [Google Scholar] [CrossRef]
  11. Agus, P.S.; Jundika, C.K.; Erik, B. Computational evaluation of thermal management strategies in an underground mine. Appl. Therm. Eng. 2015, 90, 1144–1150. [Google Scholar]
  12. Abu-Jdayil, B.; Mourad, A.H.; Hittini, W. Traditional, state-of-the-art and renewable thermal building insulation materials: An overview. Constr. Build. Mater. 2019, 214, 709–735. [Google Scholar] [CrossRef]
  13. Villasmil, W.; Fischer, L.J.; Worlitschek, J. A review and evaluation of thermal insulation materials and methods for thermal energy storage systems. Renew. Sustain. Energy Rev. 2023, 103, 71–84. [Google Scholar] [CrossRef]
  14. Liu, Z.; Lyu, J.; Fang, D.; Zhang, X. Threads for Thermal Insulation in Harsh Environments. ACS Nano 2019, 13, 5703–5711. [Google Scholar] [CrossRef] [PubMed]
  15. Abderraouf, T.; Zied, K. Mechanical properties and impact resistance of a high-strength lightweight concrete incorporating prickly pear fibres. Constr. Build. Mater. 2020, 262, 119972. [Google Scholar]
  16. Feng, J.; Zhang, C.; Feng, J. Carbon fiber reinforced carbon aerogel composites for thermal insulation prepared by soft reinforcement. Mater. Lett. 2011, 67, 266–268. [Google Scholar] [CrossRef]
  17. Zhang, Y.; Lu, S.; Zhang, X. Development of a novel heat barrier coating for deep mining application. Aust. J. Mech. Eng. 2018, 16, 112–116. [Google Scholar] [CrossRef]
  18. Yao, W.; Lyimo, H.; Pang, J. Evolution regularity of temperature field of active heat insulation roadway considering thermal insulation spraying and grouting: A case study of Zhujidong Coal Mine. High Temp. Mater. Process. 2021, 40, 151–170. [Google Scholar] [CrossRef]
  19. Zhu, S.; Wu, S.Y.; Zhu, S.X. Temperature Field Distribution Model and Analysis of the lnfluencing Factors of Heat Adjustment Circle of Wall Rock in Roadway. Ind. Saf. Environ. Prot. 2017, 43, 21–24. [Google Scholar]
  20. Hou, C.; Xin, S.; Zhang, L. Foundation Research on Physicochemical Properties of Mine Insulation Materials. Coatings 2020, 4, 355. [Google Scholar] [CrossRef]
  21. Guo, S.; Huang, R. The AHP Method of Orthogonal Trial. Coll. Math. 2004, 20, 114–117. [Google Scholar] [CrossRef]
  22. Dai, X.; Guo, J. Orthogonal optimal design and analysis of RPCVD simulation by CFD. J. Xidian Univ. 2013, 40, 72–78. [Google Scholar]
  23. Lan, W.; Wu, A.; Wang, Y.; Lil, J. Optimization of filling ratio of hemihydrate phosphogypsum based on orthogonal test. Chin. J. Nonferrous Met. 2019, 29, 1083–1091. [Google Scholar]
  24. Pang, J.; Yao, W.; Wang, L. Orthogonal Experiment and Regression Analysis on Ultra-fine Fly Ash Grouting Material for Teating Coal Mine Goaf. J. Yangtze River Sci. Res. 2018, 35, 103–108. [Google Scholar]
  25. Zhao, C. Experimental Investigation on Process Parameters during Laser-Assisted Turning of SiC Ceramics Based on Orthogonal Method and Response Surface Methodology. Materials 2022, 15, 4889. [Google Scholar]
  26. Huang, X.; Wang, T. Parameter Optimization of Laser Polishing Based on Orthogonal Experiment and Response Surface Method. Laser Optoelectron. Prog. 2022, 59, 316–325. [Google Scholar]
  27. Chaker, H.; Attar, A.E.; Djennas, M. A statistical modeling-optimization approach for efficiency photocatalytic degradation of textile azo dye using Cerium-doped mesoporous ZnO: A Central Composite Design in Response Surface Methodology. Chem. Eng. Res. Des. 2021, 171, 198–212. [Google Scholar] [CrossRef]
  28. Charyulu, N.C.B.; Saheb, S.K.A. A New Class of Second Order Response Surface Designs. Int. J. Appl. Math. Stat. 2018, 57, 115123–115132. [Google Scholar]
  29. Gao, L.; Yang, X. Optimization of the process for preparing sodium silicate from serpentine silicon-rich slag based on the Box-Behnken response surface method. J. Cent. South Univ. (Sci. Technol.) 2022, 53, 3802–3810. [Google Scholar]
  30. Ye, J.; Zhang, W.; Shi, D. Effect of Limestone Powder on Strength and Microstructure of Geopolymer. J. Chin. Ceram. Soc. 2017, 45, 260–267. [Google Scholar]
  31. Xu, Y.; Tan, L.; Cao, S.; Qu, W. Multiparameter and multiobjective optimization design of centrifugal pump based on orthogonal method. Proc. Inst. Mech. Eng. 2017, 231, 2569–2579. [Google Scholar] [CrossRef]
  32. Wang, J.; Xiao, Z.; Fan, Y.; Wang, N.; Wang, W.; Liu, J. Orthogonal Experiment Analysis on the Multiple Factors Influence of the lnterfacial Bondinc Performance of the Composite Concrete. Mater. Rep. 2022, 36, 87–92. [Google Scholar]
  33. Hansen, B.S.; Shannon, J.; Howard, I.L. Improved Understanding of Concrete Compressive Strength Utilizing Cement Paste Testing. Adv. Civ. Eng. Mater. 2019, 8, 20180134. [Google Scholar] [CrossRef]
  34. Method of Testing Cements. Determination of Strength. Available online: www.std.samr.gov.cn (accessed on 1 July 2023).
  35. Modarresi, F.; Bingham, P.A.; Jubb, G.A. Thermal conductivity of refractory glass fibres. J. Therm. Anal. Calorim. 2016, 125, 35–44. [Google Scholar] [CrossRef]
  36. Thermal Insulation. Determination of Steady-State Thermal Resistance and Related Properties. Guarded Hot Plate Apparatus. Available online: www.openstd.samr.gov.cn (accessed on 1 July 2023).
  37. General Rules for Measurement of Length in Micron Scale by SEM. Available online: www.openstd.samr.gov.cn (accessed on 1 July 2023).
  38. Nole, M.; Daigle, H.; Milliken, K.L.; Prodanović, M. A method for estimating microporosity of fine-grained sediments and sedimentary rocks via scanning electron microscope image analysis. Sedimentol. J. Int. Assoc. Sedimentol. 2016, 63, 1507–1521. [Google Scholar] [CrossRef]
  39. Liu, Y.; Liu, Z.; Li, K.; Deng, S.; Dong, L. A Cleaner Mining Method for Waste Tailings as Paste Materials to Goafs. Geofluids 2020, 2020, 8857290. [Google Scholar] [CrossRef]
  40. Feng, J.; Zhang, R.; Gong, L.; Li, Y.; Cheng, X. Preparation of Porous Thermal Insulation Material Using Fly Ash. J. Mater. Sci. Eng. 2014, 32, 5. [Google Scholar]
  41. Emsettin, K.; Metin, D.; Mehmet, A. The effect of pumice as aggregate on the mechanical and thermal properties of foam concrete. Arab. J. Geosci. 2018, 11, 289. [Google Scholar]
  42. Liu, S.; Yu, J.; Han, L.; Ma, B. Effects of xonotlite additive and forming pressure on the properties of the SiO2-based nanoporous thermal insulation materials. J. Ceram. Process. Res. 2018, 19, 206–210. [Google Scholar]
  43. Zhong, K.; Xiao, Y. Orthogonal experiment design and range analysis of TPCT extracting thermal energy from coal fire. China Saf. Sci. J. 2021, 31, 7. [Google Scholar]
  44. Jiang, Y.; Xin, S.; Li, H. Performance of Heat-Insulating Materials Doped with Basalt Fibres for Use in Mines. Polymers 2020, 12, 2057. [Google Scholar] [CrossRef] [PubMed]
  45. Xu, S.; Chen, L.; Gong, M. Characterization and engineering application of a novel ceramic composite insulation material. Compos. Part B Eng. 2017, 111, 143–147. [Google Scholar] [CrossRef]
  46. Yuan, Q.; Jiang, W.; An, L. Mechanical and thermal properties of high-density polyethylene toughened with glass beads. J. Appl. Polym. Sci. 2010, 89, 2102–2107. [Google Scholar] [CrossRef]
  47. Wang, X. The Recent Progress China Has Made in the Backfill Mining Method, Part I: The Theory and Equipment of Backfill Pipeline Transportation. Minerals 2021, 11, 1274. [Google Scholar]
  48. Chen, J.; Chen, J.; Yuan, X. Evaluation and Countermeasures of Green Mine Construction in Yongcheng City Based on DPSIR Model. Preprints 2017, 2017060043. [Google Scholar] [CrossRef]
Figure 1. Experimental procedure.
Processes 11 02652 g001
Figure 2. Results of compressive strength analysis: (a) A1B1C1, A1B2C2, and A1B3C3; (b) A2B1C3; (c) A2B2C1 and A2B3C2; and (d) A3B1C2, A3B2C3, and A3B3C1.
Processes 11 02652 g002
Figure 3. Histogram of compressive strength for each experimental group.
Processes 11 02652 g003
Figure 4. Scanning electron microscope observation results (mag. 500×): (a) group 1, A1B1C1, and (b) group 2, A1B2C2.
Processes 11 02652 g004
Figure 5. Scanning electron microscope observation results of glass beads: (a) mag. 100× and (b) mag. 500×.
Processes 11 02652 g005
Figure 6. Comparison of actual values and predicted values: (a) comparison results of compressive strength and (b) comparison results of thermal conductivity.
Processes 11 02652 g006
Figure 7. Interaction effect of factors A and B on compressive strength.
Processes 11 02652 g007
Figure 8. Interaction effect of factors B and C on compressive strength.
Processes 11 02652 g008
Figure 9. Interaction effect of factors A and B on thermal conductivity.
Processes 11 02652 g009
Figure 10. Interaction effect of factors B and C on thermal conductivity.
Processes 11 02652 g010
Table 1. Chemical composition of tailings.
Chemical CompositionSiO2Al2O3CaoMgOFeSnSbZnInPbSOther
Content (%)41.592.318.940.835.340.270.261.240.00110.275.7923.17
Table 2. Particle size distribution of unclassified tailings.
Particle Size−10−20−50−100−200−500−1000
Separate cumulative (%)7.739.017.498.1217.0110.872.79
Total cumulative (%)20.6229.6346.0864.8181.8297.21100
Table 3. Chemical composition of closed-cell glass beads.
Chemical CompositionSiO2Al2O3CaOMgOK2OFe2O3Other
Content (%)41.5914.52.20.55.53.3432.37
Table 4. Factor levels.
LevelA Tailings (%)B Glass Beads (%)C PC (%)
150105
2601510
3702015
Table 5. Baseline group levels.
NumberExperimental GroupA Tailings (%)B Glass Beads (%)C PC (%)
1A1B1C150105
2A1B2C2501510
3A1B3C3502015
4A2B1C3601015
5A2B2C160155
6A2B3C2602010
7A3B1C2701010
8A3B2C3701515
9A3B3C170205
Table 6. Results of the orthogonal experiment.
NumberExperimental GroupA
Tailings (%)
B
Class Beads (%)
C
PC (%)
Compressive Strength
(MPa)
Thermal Conductivity
(w/k·m)
1A1B1C1501050.540.378
2A1B2C25015100.530.292
3A1B3C35020150.430.274
4A2B1C36010150.810.273
5A2B2C1601550.410.268
6A2B3C26020100.470.376
7A3B1C27010100.390.262
8A3B2C37015150.520.386
9A3B3C1702050.490.374
Table 7. Range analysis of the orthogonal experiment (compressive strength).
Calculated ItemABC
k 1 1.501.741.44
k 2 1.691.461.39
k 3 1.401.391.76
k 1 ¯ 0.500.580.48
k 2 ¯ 0.560.490.47
k 3 ¯ 0.470.460.59
R0.090.120.13
High levelA2B1C2
Priority orderC > B > A
Table 8. Range analysis of the orthogonal experiment (thermal conductivity).
Calculated ItemABC
k 1 0.9440.9131.020
k 2 0.9170.9460.930
k 3 1.0221.0240.933
k 1 ¯ 0.3150.3040.340
k 2 ¯ 0.3060.3150.310
k 3 ¯ 0.3410.3410.311
R0.0350.0370.029
High levelA2B1C3
Priority orderB > A > C
Table 9. Analysis of variance results for the regression model of compressive strength.
SourceSum of SquaresDfMean SquareF-Valuep-Value
Model0.246870.0353275.47<0.0001Significant
A-A0.025510.0255199.59<0.0001
B-B0.036210.0362282.60<0.0001
C-C0.077410.0774604.61<0.0001
AB0.047410.0474370.44<0.0001
BC0.024810.0248193.71<0.0001
A20.003110.003124.080.0008
B20.004410.004434.700.0002
Residual0.001990.0004
Lack of fit0.001210.00122.170.2214Not significant
Pure error0.000780.0008
Table 10. Analysis of variance results for the regression model of thermal conductivity.
SourceSum of SquaresDfMean SquareF-Valuep-Value
Model0.046670.0067281.28<0.0001Significant
A-A0.013010.0130547.77<0.0001
B-B0.003410.0034143.44<0.0001
C-C0.009810.0098412.11<0.0001
AB0.037610.03761588.91<0.0001
BC0.011910.0119502.71<0.0001
A20.000410.000416.520.0028
B20.004810.0048203.79<0.0001
Residual0.001590.0011
Lack of fit0.000510.00169.230.1832Not significant
Pure error0.001080.0005
Table 11. Statistical analysis of regression equation errors.
Compressive Strength (C)Thermal Conductivity (T)
Statistical itemValueStatistical itemValue
R20.9954R20.9954
Adjusted R20.9917Adjusted R20.9919
Predicted R20.9303Predicted R20.9446
Adeq precision52.8788Adeq precision39.2708
Disclaimer/Publisher’s Note: The statements, opinions and data contained in all publications are solely those of the individual author(s) and contributor(s) and not of MDPI and/or the editor(s). MDPI and/or the editor(s) disclaim responsibility for any injury to people or property resulting from any ideas, methods, instructions or products referred to in the content.

