Article

HOMER-Based Multi-Scenario Collaborative Planning for Grid-Connected PV-Storage Microgrids with Electric Vehicles

School of Energy Science and Engineering, Nanjing Tech University, Nanjing 211816, China
*
Author to whom correspondence should be addressed.
Processes 2023, 11(8), 2408; https://doi.org/10.3390/pr11082408
Submission received: 29 June 2023 / Revised: 4 August 2023 / Accepted: 8 August 2023 / Published: 10 August 2023

Abstract

:
One of the crucial methods for adapting distributed PV generation is the microgrid. However, solar resources, load characteristics, and the essential microgrid system components are all directly tied to the optimal planning scheme for microgrids. This article conducts a collaborative planning study of grid-connected PV-storage microgrids under electric vehicle integration in various scenarios using HOMER 1.8.9 software. To be more specific, in multiple scenarios, we built capacity optimization models for PV modules, energy storage, and converters in microgrids, with several scenarios each accounting for the cleanliness, economic performance, and overall performance of microgrids. For multiple scenarios, this paper used the net present value cost and levelized cost of electricity as indicators of microgrid economics, and carbon dioxide emissions and the fraction of renewable energy were used as indicators of microgrid cleanliness. The optimal capacity allocation for economy, cleanliness, and a combination of economy and cleanliness were separately derived. Finally, on a business park in Wuhan, China, we conducted thorough case studies to compare and debate the planning performance under various scenarios and to undertake sensitivity analyses on the cases. The sensitivity analyses were conducted for the optimal configuration of microgrids in terms of the EV charging scale, carbon dioxide emissions, PV module unit cost, and storage unit cost. The results of the simulation and optimization show that the optimization approach could determine the ideal configuration for balancing economy and cleanliness. As the EV charging demand increased, the energy storage capacity required in the microgrid gradually increased, while the carbon dioxide emission limit was negatively correlated with the energy storage capacity demand. The unit investment cost of PV module units had a greater impact on the optimal system configuration than the cost of batteries.

1. Introduction

In recent years, the proportion of photovoltaic (PV) generation, wind power generation, and other renewable energy sources in the grid has been increasing, and the planning and construction of future renewable-dominated power systems have become key for building a modern energy system [1]. Although renewable generation has the advantages of environmental protection, energy saving, and emission reduction, it relies on external environmental conditions and shows the characteristics of uncertainties in power output [2]. Large-scale grid integration of renewable generation will cause many adverse effects on the normal operation of traditional power systems [3]. A microgrid, which is a combination of distributed renewable generation, energy storage devices, and various types of loads into a small power networks, provides a promising tool for renewable accommodation. Microgrids not only serve as a bridge for energy exchange between distributed power sources and distribution grids, but also play a positive role in load redistribution [4,5]. Optimal planning of microgrids in order to coordinate resources and loads is an important issue.
As electric vehicles (EVs) gain popularity and the share of EV charging load is continuously increasing, the characteristics of the loads in the microgrids are diverse [6]. Compared with the conventional electricity load, the EV charging load shows significant randomness and fluctuation in spatial and temporal distribution, and the EV charging decision is susceptible to real-time electricity price, weather, road conditions, battery state of charge, and other factors [7,8]. Users’ travel habits and usage habits also introduce variability to EV charging loads. Moreover, the diverse operational and charging characteristics of different EV types differ greatly, thus introducing more uncertainty to microgrid operations [9]. Microgrids planned with only conventional loads considered might fail to accommodate for the massive influx of EVs, and the electricity quality and economic performance of the microgrids will be significantly impacted by EV loads [10]. The large-scale access of EVs to the microgrid system will lead to load growth and affect the microgrid load architecture and characteristics, and the simultaneous access of a large number of EVs will also lead to a surge in the microgrid power supply pressure and deterioration of power quality [11,12], which will affect the operation stability and economy of the microgrid. In this context, the importance of taking into account EV charging loads in microgrid planning is pronounced.

Literature Review and Contributions

The problem regarding the optimal planning of microgrids has been widely studied. In the literature [13], using the loss of power supply probability (LPSP) as a constraint, the objective function of reducing the total capital cost was constructed and used to determine the best design of the microgrid’s energy storage capacity. In the literature [14], a model for the economic optimization of an off-grid microgrid was built, primarily taking temperature and battery capacity deterioration into account. The results showed that the overall economy of the microgrid system was effectively improved. In the literature [15], the optimal allocation of PV and energy storage in rural microgrids was achieved based on the second-generation non-dominated ranking genetic algorithm with the optimization objectives of maximum PV utilization and optimal economy, considering the load characteristics of rural areas, local environmental factors, and various economic factors. In the literature [16], an improved genetic algorithm was used to obtain the best planning for isolated hybrid systems using the total NPV reduction as the optimization goal. However, these studies mostly concentrated on economic reasons and inadequately took into account other crucial indicators, including the usage of renewable energy resources and carbon emissions. In the literature [17], a microgrid system with renewable resources and batteries was constructed, and the electric vehicle load was generated based on the Monte Carlo algorithm, with the lowest probability of power loss and the lowest life cycle cost as the optimization objectives, and, finally, the optimal configuration of the system was derived based on the particle swarm optimization algorithm. In the literature [18], the multi-objective algorithms of MOPSO and MO-CSA were used to create a hybrid system that was intended to reduce net present cost (NPC), LPSP, and CO2 both with and without operating reserves. In the literature [19], a capacity planning model was developed to optimize the sizing of a grid-connected microgrid, taking into account uncertainties in renewable generation. This model incorporated efficient scenario generation and reduction techniques using the deep convolutional generative adversarial network (DCGAN) and an improved k-medoids clustering algorithm. In the literature [20], for the purpose of establishing a new demand response strategy (DRS), a fuzzy logic controller was used to calculate the electricity tariff depending on the battery’s charge level, charging and discharging power, and the customer’s prior response. In pursuit of attaining the utmost economic efficiency and mitigating the risk of load shedding, an advanced cuckoo search (MCS) optimization algorithm was innovatively introduced to determine the optimal sizing of the hybrid energy storage (HES) components. This cutting-edge approach aimed to minimize the cost of energy (COE) while simultaneously reducing the probability of experiencing loss of load (LOLP). The aforementioned literature conducted studies by establishing optimization models and seeking solution algorithms. In addition, HOMER, which is a commercial software, provides an efficient platform for tailored microgrid planning. In the literature [21], The technical-economic evaluation of hybrid renewable energy systems to electrify three off-the-grid isolated settlements in Columbia was carried out using HOMER software. Based on the net present cost (NPC), levelized cost of electricity (LCOE), and initial capital cost, the most cost-effective system was suggested for each hamlet. In the literature [22], Rahman conducted a study in the Canadian Ontario region and set up seven generation scenarios based on the percentage of renewable energy. They applied HOMER for a hybrid energy generation design that could fulfill a peak load of 772 kW and an average load of 4.4 kWh/day. In addition, the carbon dioxide penalty cost was also considered in the total cost components, and solar surface radiation, wind speed, diesel price, and carbon dioxide penalty cost were analyzed as sensitive variables. The simulation results showed that the percentage of renewable energy was 100%, 80%, 65%, 50%, 35%, 21%, and 0%, and the corresponding electricity costs were UDS 1.48/kWh, USD 0.62/kWh, USD 0.54/kWh, USD 0.42/kWh, USD 0.39/kWh, USD 0.37/kWh, and USD 0.36/kWh, respectively. In the literature [23], based on HOMER software, an optimal configuration of a diesel−battery−wind−PV hybrid system was proposed considering NPC and LCOE. In the literature [24], HOMER Pro software was used to develop a stand-alone microgrid system with a mixture of wind power, PV power, diesel generators, and batteries in order to meet the agricultural load requirements using minimized NPC as the objective function, and resources, technology, reliability, and emissions as the constraints. In the literature [25], for a mixed-use building in the Philippines, Culaba modeled a PV with an Li-ion battery system in HOMER Grid. They took into account four scenarios: business-as-usual as the baseline case, battery only, PV only, and PV with battery. Based on the lowest net present cost (NPC), payback period, internal rate of return (IRR), and levelized cost of electricity (LCOE), the PV with a battery emerged as the best system architecture. In the literature [26], for a building that already had a 500 kW PV system, Patil designed an electric vehicle charging station. They used HOMER Grid to size the BESS and to determine the charging station’s financial viability after creating the load profile for the station using a Monte Carlo simulation in Matlab. In the literature [27], numerous scenarios were evaluated using HOMER software for the best design of an isolated EV charging station (EVCS) and a grid-connected EVCS, while taking the objectives of cost reduction and environmental pollution into consideration. Overall, the effectiveness of HOMER software has been verified in several scenarios.
Table 1 compares the model suggested in this work with others suggested in the literature. Although various methods to simulate the optimal sizing problem of microgrid systems have been developed in earlier studies, the following technological concerns related to microgrid capacity planning need more exploration:
(1)
The data used to characterize PV output and load demand are often insufficient. In this case, capacity planning studies based on optimization algorithms only used characterization data for a typical number of days, which resulted in a planning model that contained only a small number of typical scenarios, when in reality, the scenarios are much more complex than that.
(2)
Many microgrid capacity planning studies have only conducted sensitivity analyses in terms of overall cost and load demand, and have not further analyzed the impact of different component costs on microgrid capacity planning, as well as the impact of carbon dioxide emission limits on microgrid capacity planning.
(3)
Existing studies using HOMER did not comprehensively consider the technical, economic, and environmental-friendly performance of different components in microgrids, especially with multiple operating scenarios using EVs.
This paper created a capacity planning strategy to address this issue. In this paper, we conducted multi-scenario collaborative planning for grid-connected PV-storage microgrids with EVs using HOMER software. Specifically, we built a multi-scenario optimization model considering both the economic and cleanliness performance of EV-connected microgrids. Based on HOMER software, we built business park conventional load profiles as well as a multi-type EV charging load for 8760 h a year and considered the stochasticity of multi-type EV charging loads. The performance was quantified using indices such as NPC, LCOE, and carbon dioxide emission under multiple scenarios. The planning performance was compared and discussed using in-depth case studies on a business park in Wuhan, China, along with a sensitivity analysis considering particular circumstances. Specifically, this paper analyzed the impacts of electric vehicle charging scale, unit investment costs of the photovoltaic (PV) modules and battery storage, and carbon dioxide emission limits on the optimal planning scheme for grid-connected PV-storage microgrid systems, and derived the impacts of the sensitivities on the optimal configuration of the microgrid system under different unit cost multipliers. This paper analyzed the impact of the cost of each component on the optimal configuration of grid-connected PV-storage microgrids. The technical contributions from this work compared with the current solutions are outlined below:
(1)
This paper generated annual charging load data for multiple types of electric vehicles based on HOMER, which contained 8760 h of charging demand data, taking into account the stochastic nature of charging loads for multiple types of electric vehicles, and it derived the optimal capacity planning for microgrids based on this modeling.
(2)
Existing studies using HOMER have not fully considered the technical, economic, and environmentally friendly performance of different components in microgrids. In this paper, grid-connected PV-storage microgrids with an electric vehicle under multiple scenarios were planned collaboratively using HOMER software. The optimal capacity configurations for economy, cleanliness, and a combination of economy and cleanliness were separately derived.
(3)
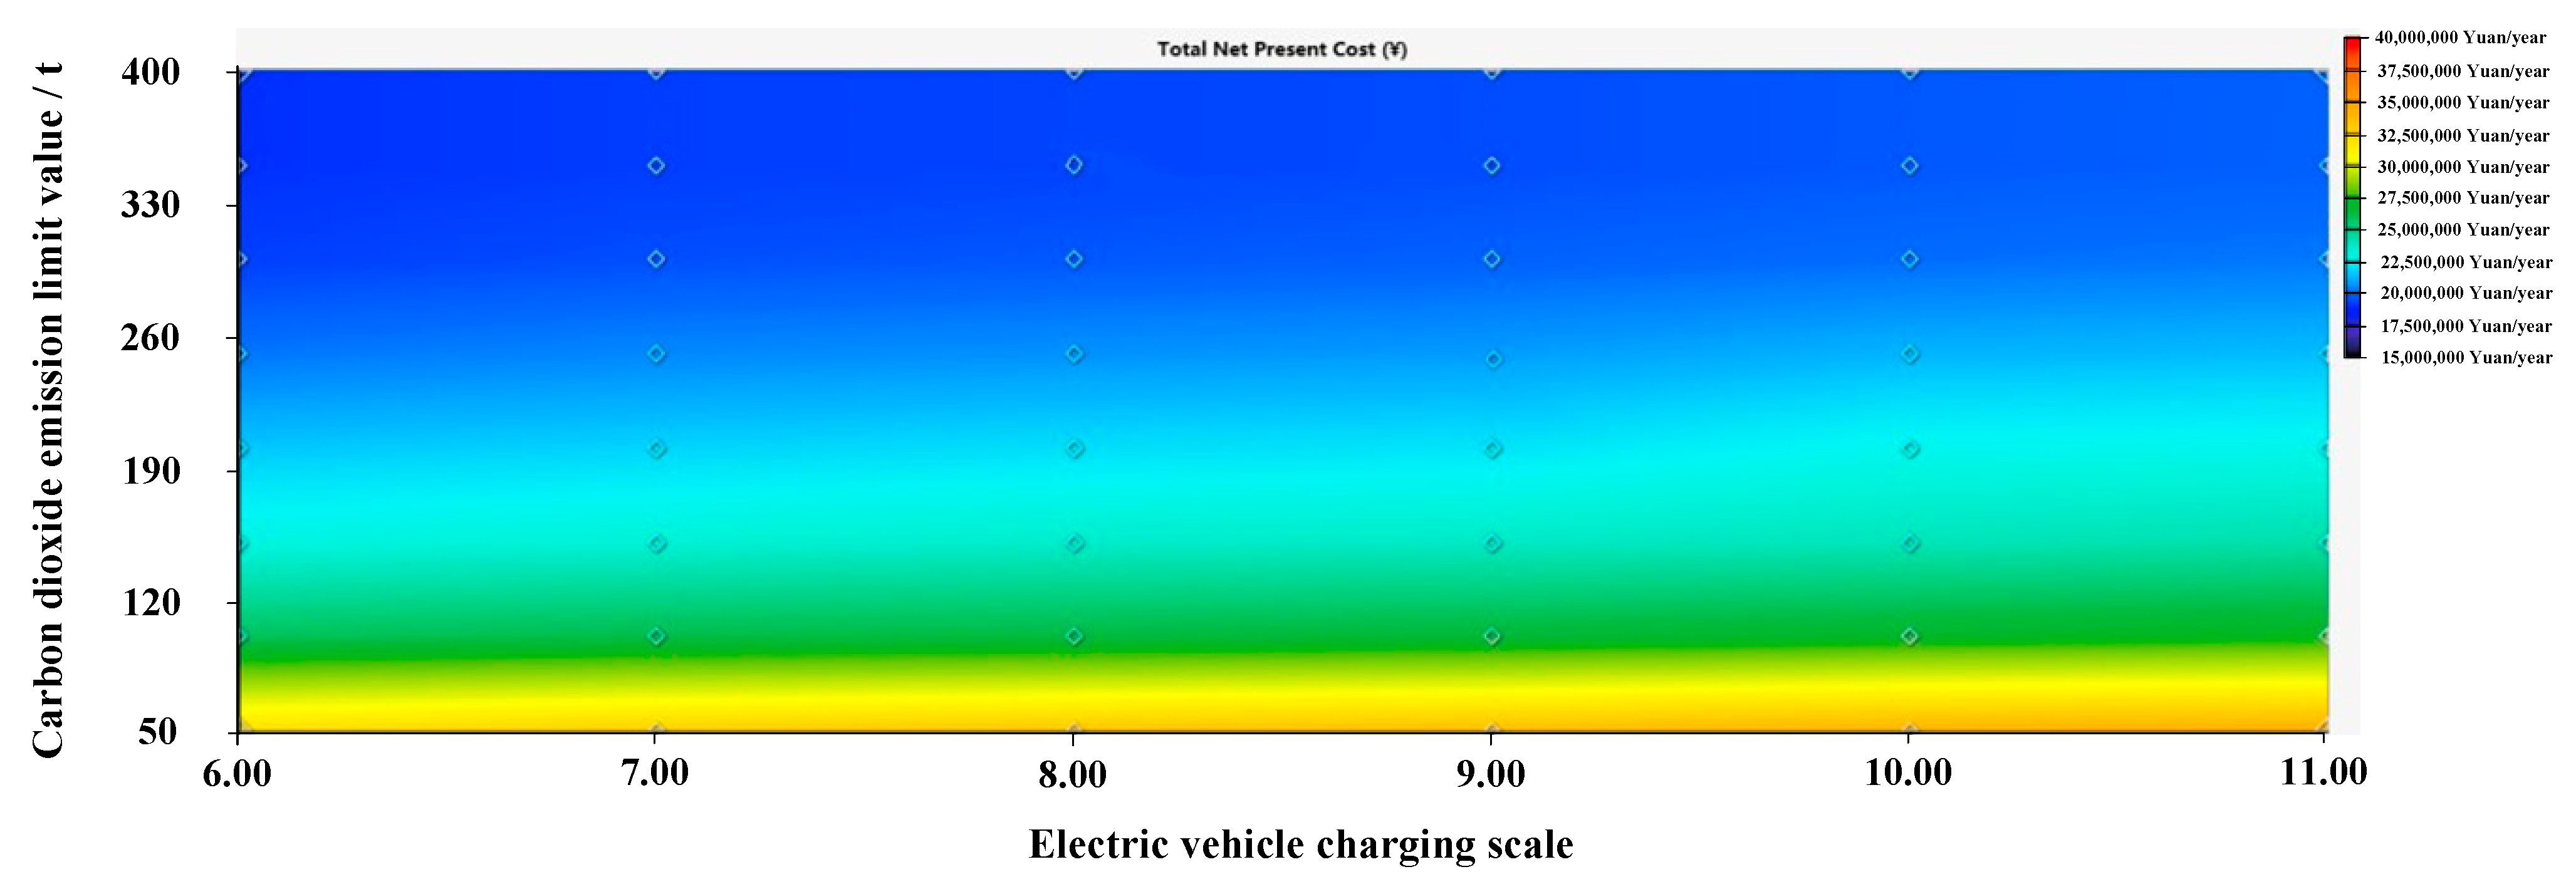
This paper analyzed the impacts of the electric vehicle charging scale, unit investment costs of photovoltaic (PV) modules and battery storage, and carbon dioxide emission limits on the optimal planning scheme for grid-connected PV-storage microgrid systems, and found the impacts of the sensitivity factors on the optimal configuration of microgrid systems and the impacts of the costs of components on the optimal configuration of the systems under different unit cost multipliers.
The rest of this paper is organized as follows. The HOMER-based modeling of each element of the grid-connected PV-storage microgrid is shown in Section 2. Section 3 presents the multi-scenario collaborative planning model. Section 4 conducts an extensive case analysis based on a business park in China. Section 5 concludes this paper.

2. Grid-Connected PV-Storage Microgrids Based on HOMER Software

2.1. Topology of Grid-Connected PV-Storage Microgrids

The grid-connected PV-storage microgrid system consists of PV modules, battery packs, converters, and conventional loads. Considering the growing access of EV charging load in the microgrid, EV charging piles are added to the microgrid system. The topology of a grid-connected PV-storage microgrid with EVs is built in HOMER, as shown in Figure 1.

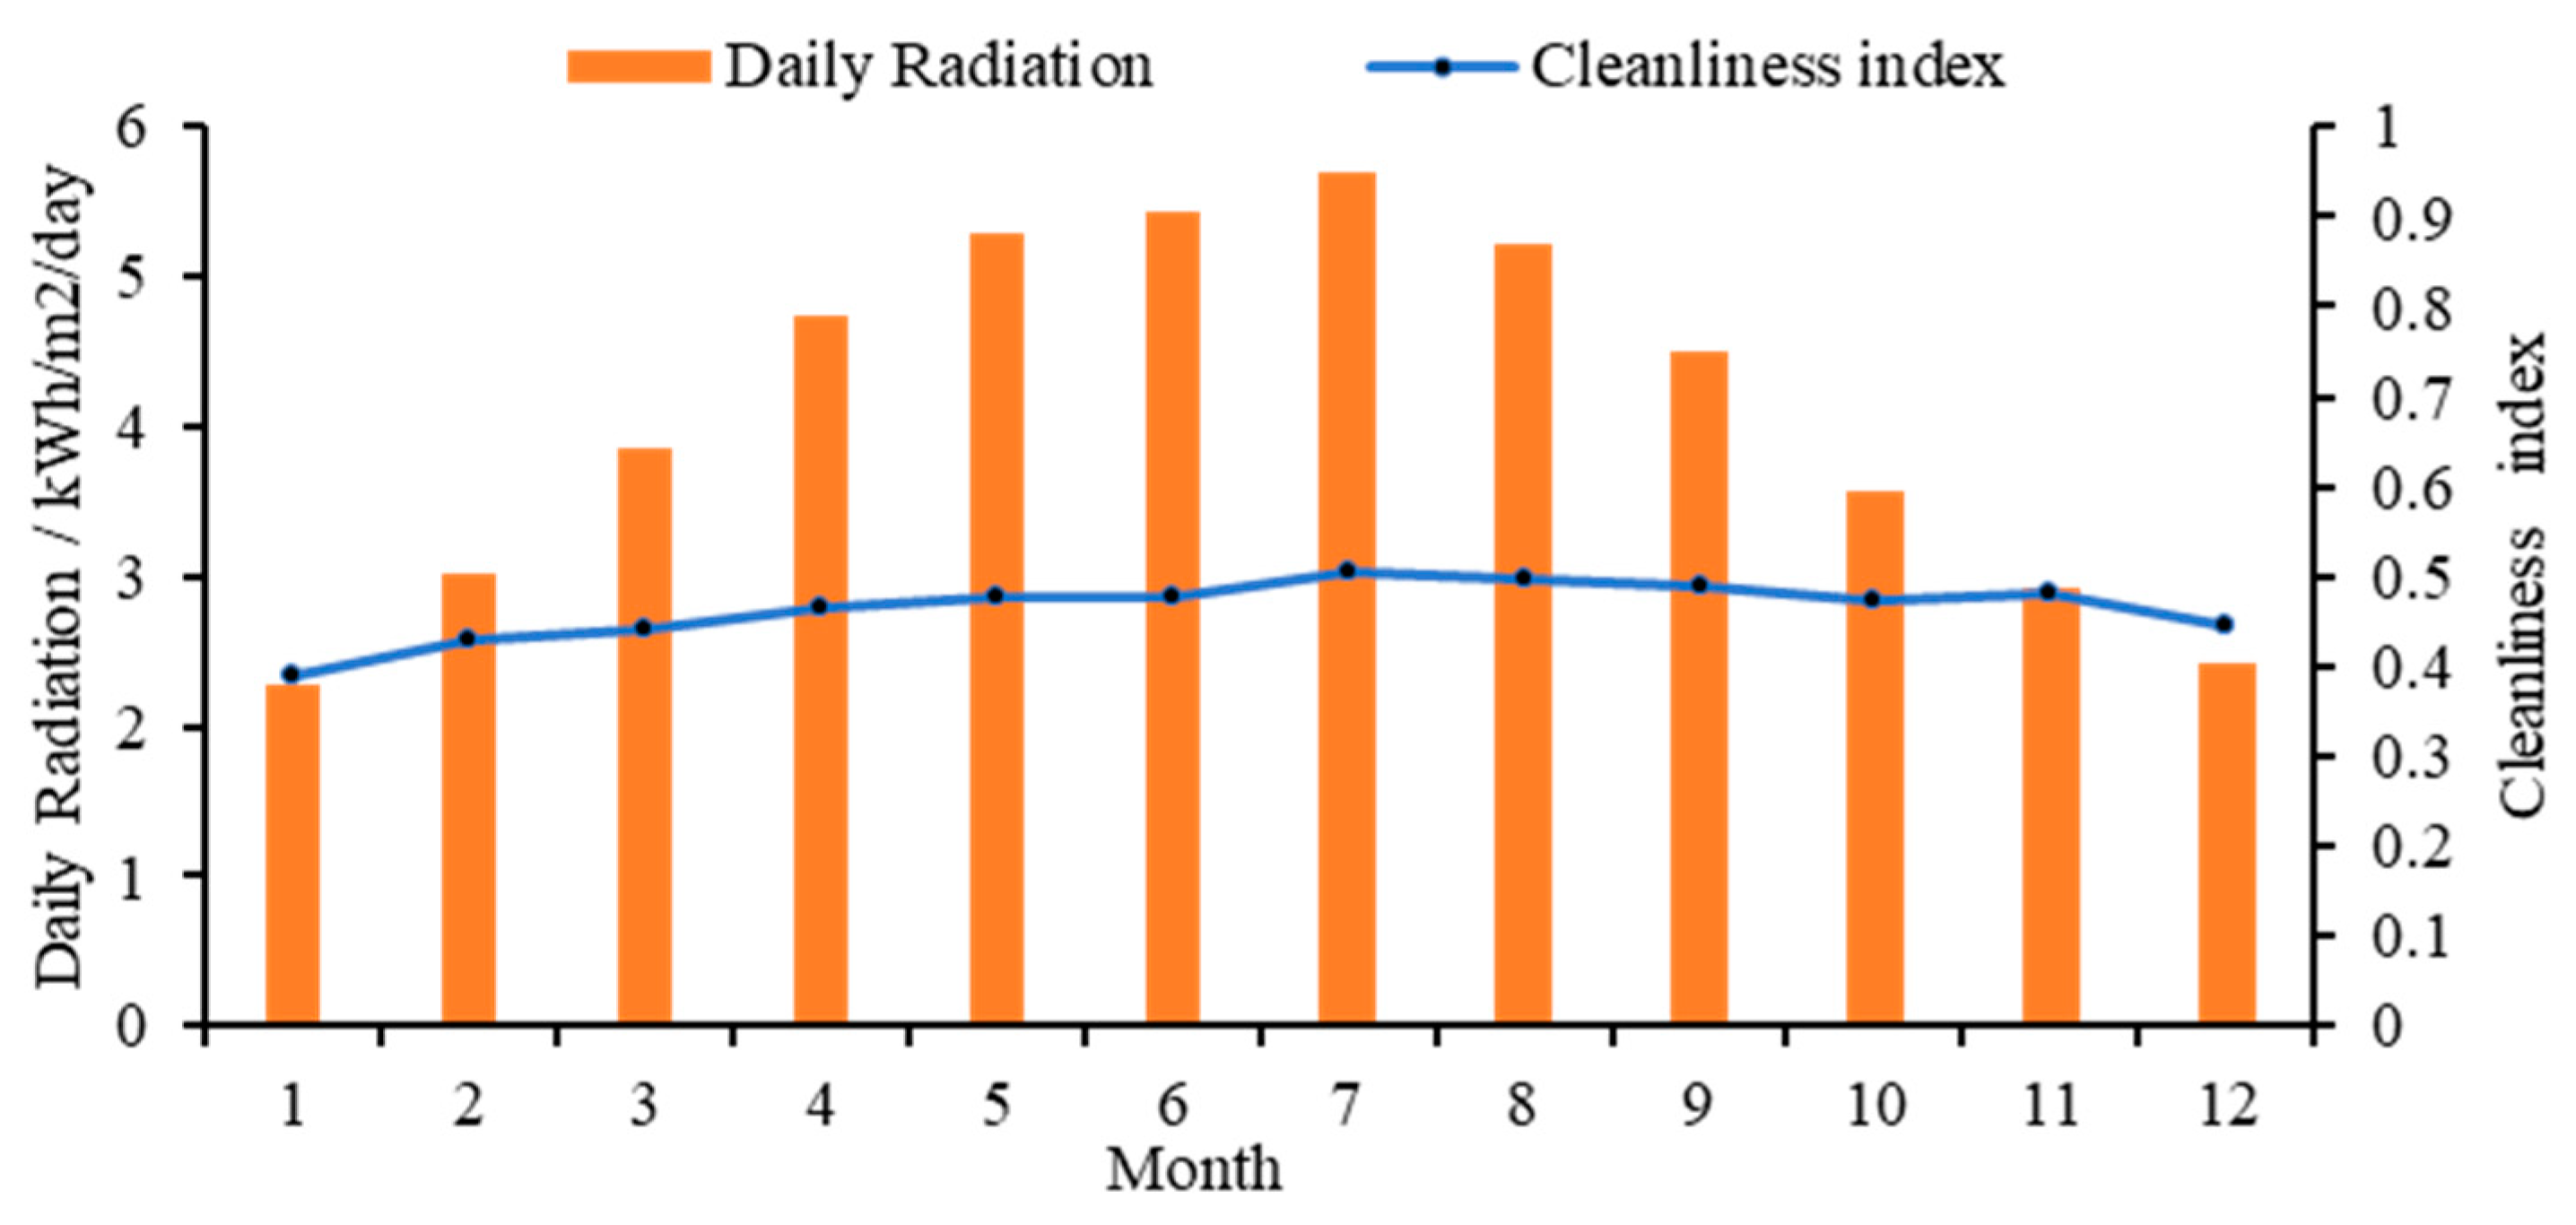
2.2. Distributed PV Power Generation Model

HOMER software calculates the available output power of distributed PV generation in microgrids based on input parameters such as PV array size, ambient temperature, and solar radiation intensity, using Equation (1), and continuously optimizes the final optimal power of PV [28].
P PV = Y PV f PV G ¯ T G ¯ T , STC 1 + a p ( T c T c , S T C )
where P PV is the output power of the PV panel, Y PV is the PV array output power (kW) under standard test conditions, f PV is the derating factor for the PV array, G ¯ T is the solar radiation that hits the photovoltaic array during the current time period, G ¯ T , STC is the solar radiation measured under typical test circumstances, a p is the coefficient of power temperature, T c is the current time period’s ambient temperature, and T c , S T C is the temperature in typical test circumstances. The current time period’s solar radiation impact on the PV array G ¯ T , STC in Equation (1) and the ambient temperature during the current time period T c can greatly affect the PV output.

2.3. Battery Storage Model

In the HOMER model, the operating characteristics of the battery are represented by the KiBam dynamic battery model [29]. The following are the power restrictions for the battery’s charging and discharging rates in the KiBam model:
P bat , cpmax = min P bat , cpmax , kbm , P bat , cpmax , mcr , P bat , cpmax , mcc η bat , c
P bat , dpmax = η bat , d P bat , amax , kbm
P bat , cpmax , kbm = k c Q max + k Q 1 e k Δ t + Q k c 1 e k Δ t 1 e k Δ t + c k Δ t 1 + e k Δ t
P bac , cpmax , mcr = 1 e a c Δ t Q max Q Δ t
P bac , cpmax , mcc = N bat I max V nom 1000
P bat , dpmax , kbm = k Q 1 e k Δ t + Q k c 1 e k Δ t 1 e k Δ t + c k Δ t 1 + e k Δ t
where P bat , cpmax is the maximum charging power of the energy storage battery (kW), P bat , dpmax is the maximum discharging power of the energy storage battery (kW), P bat , cpmax , kbm is the maximum charging power of the energy storage battery per time step (kW), P bat , cpmax , mcr is the maximum charging power of the energy storage battery in the maximum charging rate limit (kW), P bat , cpmax , mcc is the maximum charging power of the energy storage battery within the permitted maximum charging current (kW), P bat , amax , kbm is the energy storage battery ‘s maximum discharge power for each time step (kW), η bat , c is the charging efficiency of the energy storage battery (%), η bat , d is the discharging efficiency of the energy storage battery (%), Q 1 is the available energy of the energy storage battery (kJ), Q max is the maximum storage energy of the energy storage battery (kJ), k is the rate constant of the battery, c is the capacity ratio of the energy storage battery, a c is the maximum charging rate of the energy storage battery (Ah), N bat is the total number of series and parallel connections of the energy storage battery, V nom is the rated voltage of the energy storage battery (V), and I max is the maximum charging current (A).
A battery storage system can be set up in HOMER software to smooth the net load fluctuations of the distributed PV and loads. The setup battery storage system uses 100 kWh fixed capacity Li-ion batteries, with a rated voltage of 600 V for a single battery module and a maximum charging current of 167 A. The initial investment and replacement cost of the battery module is 2000 Yuan/kWh, and the annual operation and maintenance cost is 80 Yuan/kWh.

2.4. Converter Parameters

The conversion of the DC part and AC part of the microgrid is considered, and the converter configuration is incorporated into the planning model. The converter model selected in this paper is a general-purpose bidirectional converter, which can be freely set using several parameters. The converter efficiency modeling is presented in Equation (8). In a grid-connected PV-storage microgrid system, a bi-directional inverter converts the DC output from the photovoltaic array as well as the DC output from the battery to AC, and likewise converts the AC output from the grid to DC for storage in the battery. The investment cost and replacement cost of converters are 5393.54 Yuan/kW and 4800 Yuan/kW, respectively, and the maintenance cost is 60 Yuan/year/kW. The operating life of converters is 15 years, and the conversion efficiency is 95%.
η c n v = P o u p u t P i n p u t
where P o u p u t and P i n p u t are the output power and the input power of inverter, respectively.

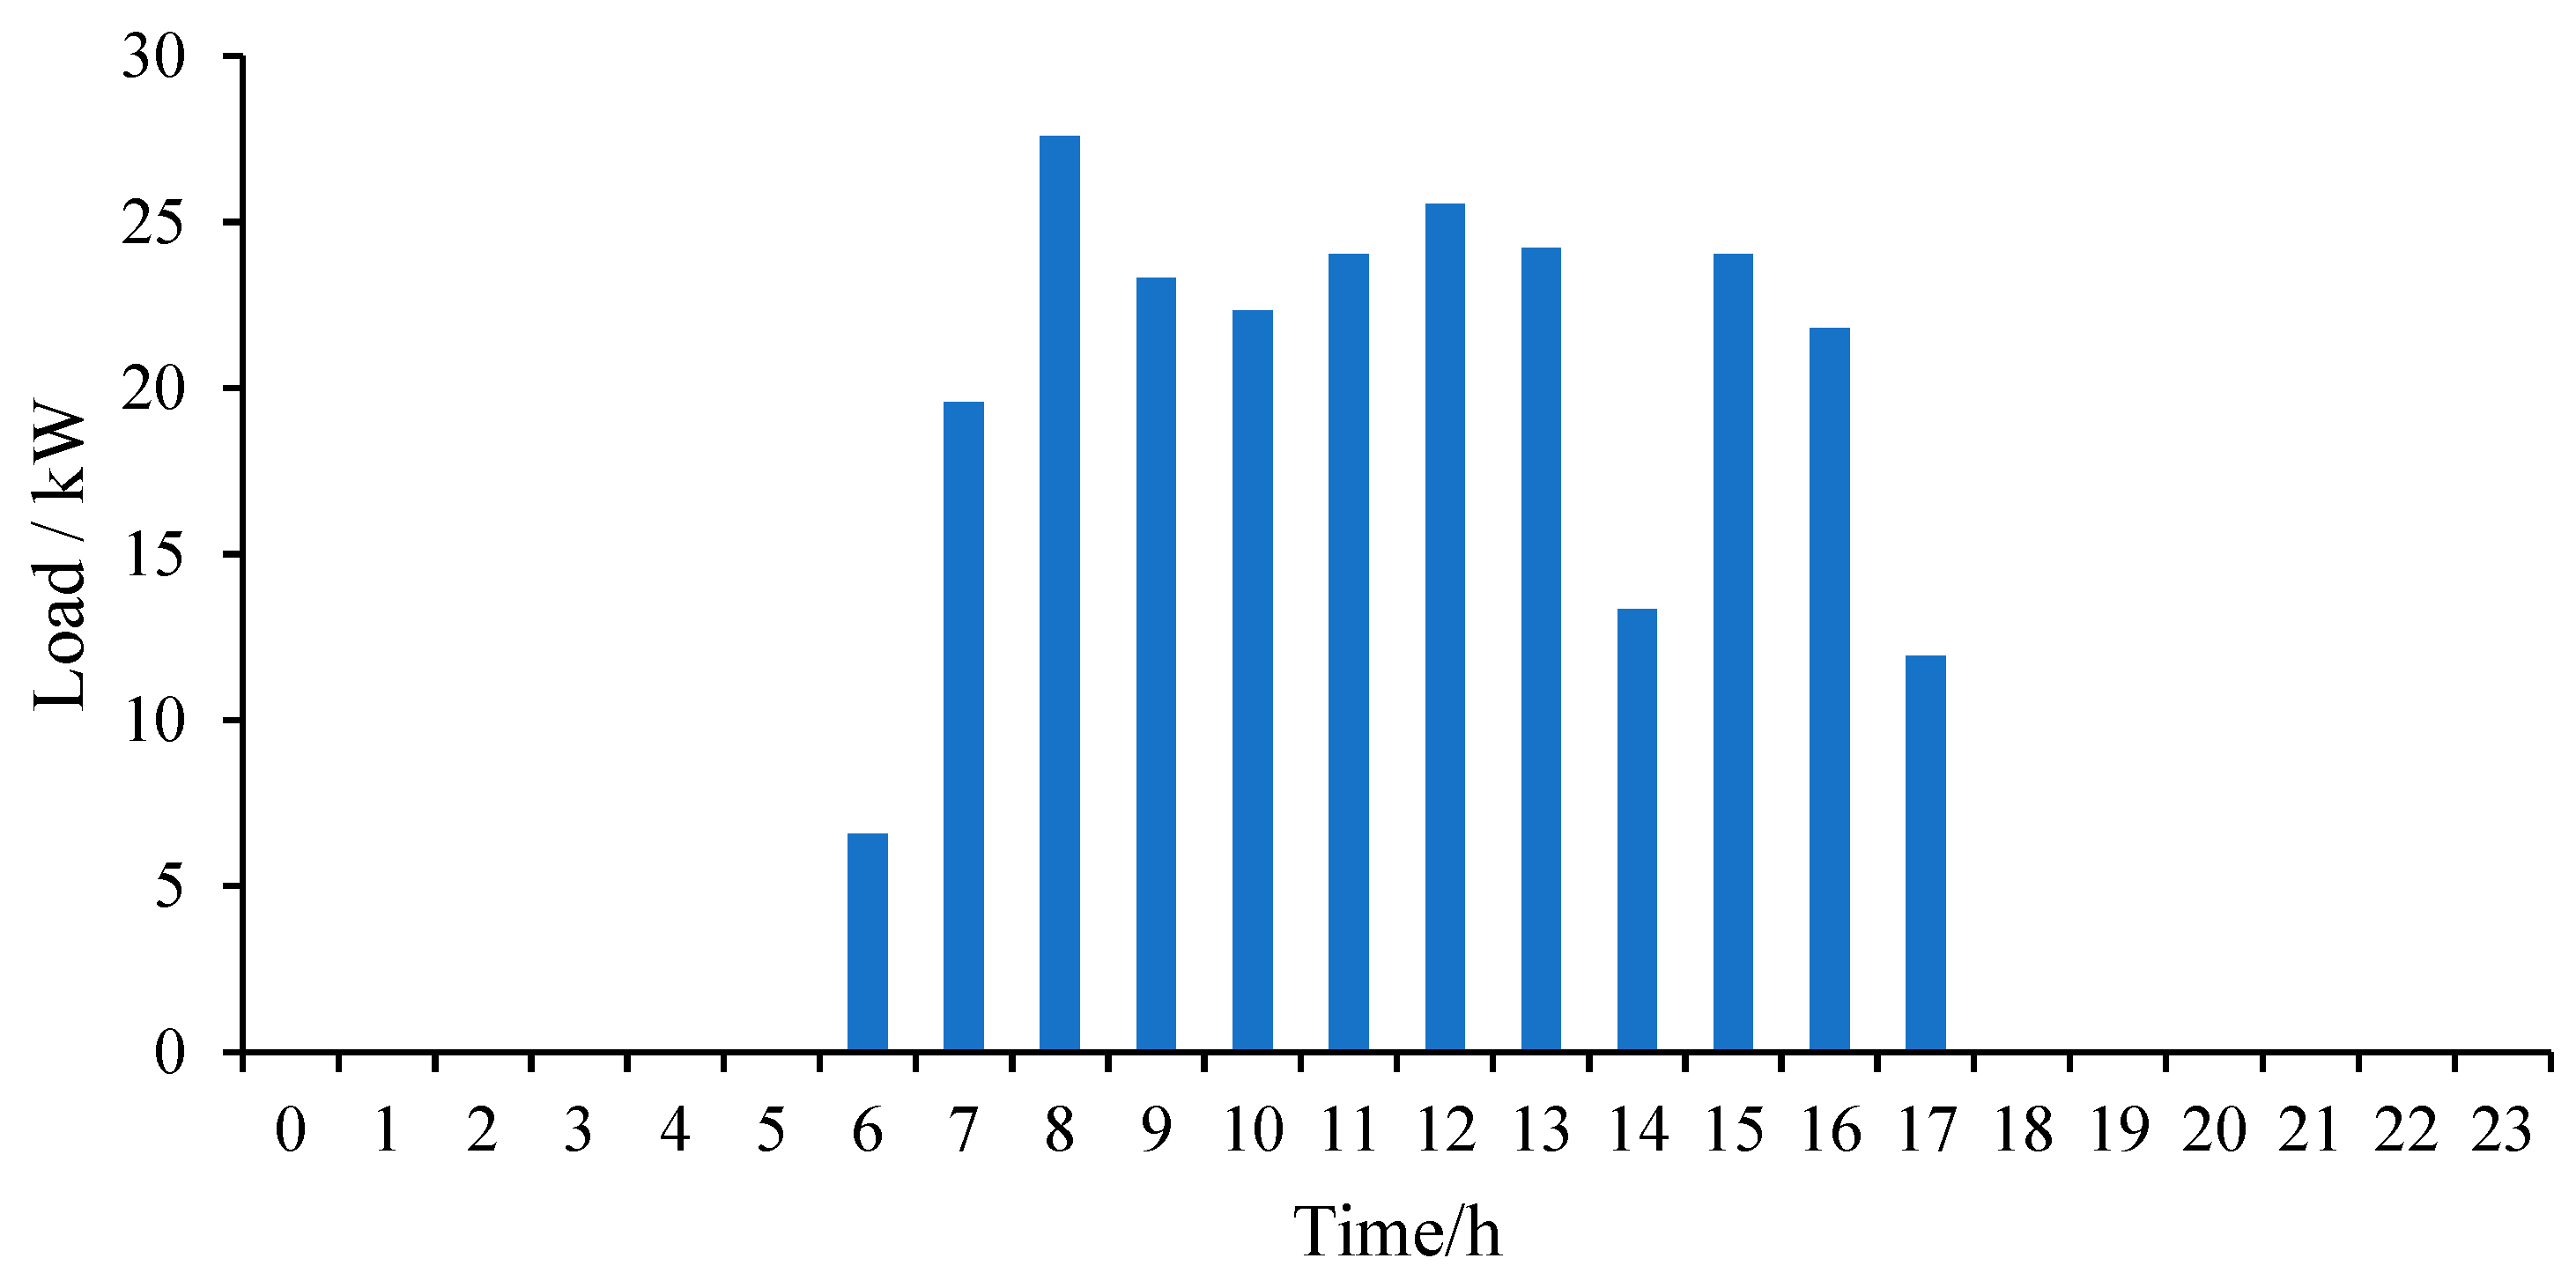
2.5. Load Characteristics

In addition to the conventional load in the microgrid, the charging load brought by the EVs is also considered. The types of EVs and their corresponding charging characteristics are set. Then, by setting the number of charging piles in the microgrid and their rated power, the charging load demand of EVs is simulated for 8760 h. The time scale for electric vehicle loads and conventional loads in this paper is 1 h. The EV charging scale is set to 6, which in turn generates an EV charging load profile of 8760 h a year, with an average annual EV charging load of 290 kWh/day. The average annual conventional load in business parks is about 2619.91 kWh/day.

3. HOMER-Based Multi-Scenario Collaborative Planning for Grid-Connected PV-Storage Microgrids

In this paper, using HOMER software, we developed a multi-scenario collaborative planning technique for grid-connected PV-storage microgrids with EVs. Specifically, multiple scenarios under two categories of indices, i.e., the cleanliness index and economic index, were considered. On this basis, a multi-scenario collaborative planning model was constructed.

3.1. Cleanliness and Economic Performance Indices

3.1.1. Indices for Cleanliness Performance

In this paper, based on HOMER software, the cleanliness performance of the grid-connected PV-storage microgrid was evaluated in terms of two indicators: renewable energy share and carbon dioxide emission. The percentage of non-renewable energy is calculated as shown in Equation (9), and the percentage of renewable energy is calculated as shown in Equation (10) [30].
f NRF = E nonren E served
f RF = 1 E nonren E served
where E nonren is the amount of electricity purchased from the grid in the microgrid system (kWh/year) and E served is the annual electrical load in the microgrid system (kWh/year). f NRF and f RF are the ratios of non-renewable energy generation and renewable energy generation, respectively. When f RF has a value of 0, it indicates that the electric load in the microgrid is supplied entirely by the main grid, while when the value of f RF is 1, it means that the electric load in the microgrid is supplied entirely by distributed PV.
For grid-connected PV-storage microgrids, the purchased power from the distribution network also indirectly causes carbon dioxide emissions in the power grid. Carbon dioxide emissions are calculated as shown in Equation (11).
f E C O 2 = k 1 E nonren
where f E C O 2 is the carbon dioxide emission (kg/kWh) from the grid-connected PV-storage microgrid, and k 1 is the carbon emission factor, which is 0.632 kg/ kWh.

3.1.2. Indices for Economic Performance

In this paper, the NPC and the LCOE are selected as the economic indicators of grid-connected PV-storage microgrids.
LCOE is the cost of generation calculated by leveling the cost and generation over the life cycle of the system [31], which is calculated as shown in Equation (12):
f LCOE = C ann , tot E served
where C ann , tot represents the system’s total annualized cost (Yuan/year) [32], which is calculated as shown in Equation (13):
C ann , tot = f NPC C R F ( i , N )
where f NPC is the overall net present value cost of the microgrid, which accounts for all expenses and income incurred throughout the course of the project, such as the original investment costs, operation and maintenance costs, replacement costs, salvage value, and revenue from power sales. The capital recovery factor C R F ( i , N ) , which transforms the current value into equivalent annual cash flows, is utilized [33]. C R F ( i , N ) is calculated as shown in Equation (14):
C R F ( i , N ) = i ( 1 + i ) N ( 1 + i ) N 1
where i and N stand for the discount rate and project life cycle, respectively.
A system’s NPC is calculated by subtracting the present value of all expenditures paid throughout its lifespan from the present value of all revenues generated over that same period. Investment expenses, replacement costs, operating and maintenance costs, fines for carbon dioxide emissions, and the price of grid power are all included in the cost component. The equipment’s remaining value as well as the money made from selling electricity generated by the microgrid to a larger grid are included in the revenue component [34]. It is calculated as shown in Equation (15):
f NPC = C anntot C R F ( i , N )

3.2. Optimal Planning of Grid-Connected PV-Storage Microgrids

In this paper, we considered three scenarios for optimal capacity configuration of grid-connected PV-storage microgrids.
Scenario I: Only the economic performance of the microgrid is considered, i.e., minimizing the f LCOE and f NPC indices. The objective function of collaborative planning is:
min   F 1 = m 1 f LCOE + m 2 f NPC
where m 1 and m 2 are the weights of f LCOE and f NPC indices, respectively.
Scenario II: Only the cleanliness performance of the microgrid is considered, i.e., minimizing the f NRF and f E C O 2 indices. In this scenario, the objective function is:
min   F 2 = n 1 f NRF + n 2 f E C O 2
Scenario III: Both the economic and cleanliness performance of microgrids are considered. In this scenario, the objective function is:
min   F 3 = ω 1 f LCOE + ω 2 f NPC + ω 3 f NRF + ω 4 f E C O 2
where ω i (i = 1, 2, 3, 4) is the weighting coefficient for the ith index.
The multi-objective function is constructed by determining the weights of each index in (19) based on the entropy weighting method [35]. The dispersion of an index may be determined by its entropy value from the standpoint of information entropy, as entropy is a measure of uncertain information. The greater the dispersion and greater the influence it has on the holistic evaluation, the lower the information entropy. The main steps include the construction of a decision matrix, data normalization, information entropy calculation, and the final determination of indicator weights [36].
(1) Decision matrix initialization. HOMER simulates the microgrid capacity configuration option at each time step of the year and derives the net present cost, levelized cost of energy, percentage of non-renewable energy, and carbon dioxide emission for each capacity configuration option. The decision metrics values corresponding to each capacity configuration option will make up the decision matrix. Equation (19) shows the decision matrix when there are m alternatives to be assessed based on n decision indicators:
A = ( a i j ) m n = a 11 a 1 n a m 1 a m n
where a i j is the index value of the j th decision index of the i th alternate solution.
(2) Normalization of the decision matrix. As the units of measurement of the decision indicators are not uniform, they need to be normalized before calculating the integrated weights. Specifically, the positive indicators are normalized as shown in Equation (20), and the negative indicators are normalized as shown in Equation (21) [37]:
r i j = a i j min j   a i j max j   a i j min j   a i j
r i j = max j   a i j a i j max j   a i j min j   a i j
(3) Calculation of information entropy. The information entropy of the decision indicator is calculated by Equation (22):
E j = ( ln   m ) 1 i = 1 m p i j ln   p i j
where E j represents the decision-making indicators’ information entropy, p i j represents the weight of the indicator value of option i under j decision indicators, and its calculation formula is shown in Equation (23):
p i j = r i j i = 1 m r i j
(4) Calculation of weighting factors. Based on the information entropy of the decision indicator, the weight value of the decision matrix ω j can then be derived by Equation (24).
ω j = 1 E j n j = 1 n E j

4. Case Analysis

4.1. Case Parameters Settings

In this paper, a grid-connected PV-storage microgrid located in a commercial area of Wuhan, China, is selected for the case analysis. In this region, there are about 211–272 days without frost per year and there are 1810–2100 h of sunlight overall., the total annual radiation is 104–113 kcal/cm2, the annual solar radiation intensity is shown in Figure 2, and the annual average temperature is 15.8–17.5 °C, as shown in Figure 3.
The load demand in this business park includes conventional load demand and EV charging load. The annual average conventional load is about 2619.91 kWh/day, with an average power of 109.16 kW and a maximum daily load of 376.19 kW, as shown in Figure 4. Figure 5 shows a typical daily conventional load profile for the business park, with the peak hours of the day from 09:00 a.m. to 20:00 p.m. The EV charging load includes SUV EVs and small electric cars with the parameters shown in Table 2. Four charging piles are used in this microgrid, with a rated power of 12 kW for each charging pile and the EV charging scale is set at 6. The annual EV charging load is shown in Figure 6, and the typical daily EV charging load is shown in Figure 7. The average annual EV charging load is 290 kWh/day, and in this business park, the EV charging load is mainly concentrated between 08:00 a.m. and 16:00 p.m. The microgrid sets a limit target for carbon dioxide emissions, stipulating that the portion exceeding 300,000 kg/year is penalized at 250 Yuan per ton. In this paper, the load data and PV output data are in hourly resolution, and the multi-scenario optimal allocation calculations are performed based on the PV output data of 8760 h a year as well as the load data.
In terms of cost parameters, the unit investment cost and replacement cost of the PV modules is 9599.26 Yuan/kW, and the operational life is set to 25 years. Among them, the derating factor for PV arrays is 80%. In addition, a horizontal axis continuous tracking strategy is adopted for the PV generation system with a ground reflectivity of 20% and a temperature coefficient of −0.5, with an operating temperature of about 47 °C and a flat panel efficiency of about 13%. The price for this microgrid to purchase electricity from and sell electricity to the distribution grid is 1.5 Yuan/kW and 0.4 Yuan/kW, respectively, and the carbon emission of electricity generation in the distribution grid is 632 kg/kWh.

4.2. Multi-Scenario Collaborative Planning Results

Considering the three scenarios set in Section 3.2, this section carries out the planning of grid-connected PV-storage microgrids with EVs based on HOEMER. The NPC, LCOE, non-renewable energy ratio, and carbon emission of the microgrid are used as the decision indicators. In Scenario III, the weights of each indicator based on the entropy weight method are derived, as shown in Table 3.
For each of the three scenarios, the planning outcomes and associated expenditures are displayed in Table 4 and Table 5, respectively. It is evident that the installed capacity of PV generation, battery energy storage, and converters in Scenario I are the smallest compared with that in the other two scenarios. The NPC and LCOE indices in Scenario I are the lowest in comparison with Scenario II and Scenario III, and the NPC and LCOE are 22.3 million Yuan and 1.471 Yuan/kWh, respectively. However, the cleanliness index in Scenario I is poor, with a reduction of 25.08% in the share of renewable energy and carbon dioxide emissions of 199,675.3 kg/year compared with the results in Scenario II. In Scenario II, the installed PV capacity and battery capacity are the highest, and Scenario II has the highest renewable energy ratio and the lowest carbon dioxide emissions. This is because the cleanliness performance is taken into account in the planning objective in Scenario II; however, this leads to a poor economic performance with its NPC and LCOE increasing by 126.01% and 28.69%, respectively, compared with that in Scenario I. In Scenario III, both the economic and cleanliness performance of the grid-connected PV-storage microgrid are considered, and the optimal planning scheme has 2195 kW PV generation, a 637 kW converter, and no battery energy storage. Compared with Scenario I, the installed PV capacity in Scenario III is much larger, but the battery energy storage reduces to 0 kWh, which decreases the LCOE by 34.09%, although the NPC is increased by 39.46%. In the meantime, the renewable energy ratio in Scenario III reaches 85.62%, and carbon dioxide emissions also decrease to 199,178.9 kg/year, demonstrating a better cleanliness performance. Additionally, compared with Scenario II, NPC and LCOE are both lowered by 62.06% and 72.56%, respectively, even though the carbon dioxide emissions are higher and the share of renewable energy is decreased by 13.24%, respectively, showing a better economic performance. Collaborative planning in Scenario III achieves an optimal trade-off that meets both system economic and cleanliness requirements.
The grid-connected PV-storage microgrid’s investment and operating costs for each scenario are provided in Table 6, and the specifications of various components are shown in Table 7. The optimal planning schemes for all three scenarios do not cause load shedding. Compared with the other two scenarios, the PV capacity and the battery energy storage capacity in Scenario I are the minimum. Therefore, the PV investment costs as well as the system operation and maintenance costs in Scenario I are the lowest. However, the lower PV capacity leads to a higher amount of electricity purchased from the distribution grid and higher carbon dioxide emissions. As a result of the smaller PV capacity, there is also less PV power leakage, which accounts for 15.12% of the overall energy usage. Furthermore, 110,542.8 kWh of electricity was sold to the grid. The optimal planning scheme in Scenario II has the largest PV capacity and the highest investment cost and operation and maintenance cost. Consequently, the highest annual PV power generation is observed in Scenario II, reaching 3,419,029 kWh/year. With a higher energy storage capacity, the grid-connected PV-storage microgrid in Scenario II has the least purchased electricity and the most sold power, at 996,154.8 kWh. The PV power spillage accounts for 36.15% of the total energy consumption. Nevertheless, the higher PV output and larger battery energy storage capacity in Scenario II contributes to a better cleanliness performance, but a lower economic performance. The annual throughput of storage in Scenario I is 133,973.5 kWh and in Scenario II is 307,623.8 kWh, which is an increase of 129.62% compared with Scenario I. The quantity of energy that passes through the storage bank in a year is known as the storage throughput. If the lifetime throughput of storage is attained, it will be necessary to replace the battery energy storage. In Scenario II, because the PV installed capacity is larger and the configuration of the battery pack capacity is larger, the annual throughput of its energy storage is also more, which also leads to a greater cost for replacement of the battery pack, compared with Scenario I, where the NPC is also increased by 126.01%. In Scenario III, the optimal planning scheme includes no energy storage, causing a higher PV power spillage compared with Scenario I, which accounts for 27.60% of the total electricity consumption. Moreover, deploying no energy storage greatly reduces the system investment and operation and maintenance costs. Electricity from the distribution grid is 0.24% cheaper than in Scenario I, but the income from selling the electricity to the distribution grid increases by 922.15%.

4.3. Sensitivity Analysis

We analyzed the impacts of EV charging demand, unit investment costs of PV modules and battery energy storage, and carbon dioxide emissions on an optimal planning scheme for grid-connected PV-storage microgrids. We used minimizing the NPC as the planning objective. Specifically, we set the unit investment cost parameters in Section 4.1 as the base case, then the values of the parameters to be analyzed were adjusted step by step in HOMER software.
Figure 8 presents the sensitivity of the microgrid planning to EV charging demand and carbon dioxide emission limits under different unit investment costs. The region below the lines in Figure 8 represents the optimal planning results consisting of only PV modules with no battery energy storage. The region above the lines denotes the optimal planning results with both PV modules and battery energy storage. As shown in Figure 8, with the base case parameters, when the carbon dioxide emission limit reached about 310 t/year or more, the optimal planning scheme of the grid-connected PV-storage microgrid contained only PV modules and were converted with no energy storage. As the carbon dioxide emission limit gradually increased, the dependence of microgrid on renewable energy decreased accordingly, and as the cost of power purchase was lower than the cost of deploying battery energy storage, the microgrid did not need to allocate energy storage in order to pursue a lower NPC index. In the meantime, as the EV charging demand increased, the lines under the unit investment cost parameters showed a slightly increasing trend, revealing the dependence of increased EV charging on energy storage. When the unit investment costs of PV modules and energy storage decreased from the base case to 60%, the boundary of the optimal planning scheme changed from the carbon dioxide emission limit value of about 310 t/year to 290 t/year. The optimal planning scheme of a grid-connected PV-storage microgrid with EV load was less prone to the impacts of the EV load scale. Specifically, the change in the scale of EV charging load did not increase the dependence of the microgrid system on energy storage, and the optimal planning scheme change boundary also tended to be stable. The optimal planning scheme of the microgrid under 60% unit investment cost was stable and less affected by the EV charging scale, while the optimal planning scheme of the microgrid under the unit investment cost was more affected by the EV charging scale.
The sensitivity of the microgrid to the EV charging demand and carbon dioxide emission that are limited when the unit investment costs of different components are reduced to 60% is shown in Figure 9. When the unit investment cost of PV modules decreases to 60% and the battery unit cost remains unchanged, the optimal planning scheme change boundary decreases to the carbon dioxide emission limit value of about 280 t/year. This is because the decrease in the unit cost of PV modules increases the affordable PV capacity with the same investment budget, thus reducing the amount of electricity purchased from the distribution network and reducing the required storage capacity, and enabling the microgrid to operate economically and environmentally at a lower carbon dioxide limit. When the unit investment cost of battery energy storage decreased to 60% and the PV module unit cost remained the same as the base case, the optimal planning scheme change boundary rose to the carbon dioxide emission limit of about 330 t/year. Comparing the change of planning schemes with different component investment costs further demonstrates that the impact of the unit investment cost of PV modules was greater than that of the battery energy storage.
Figure 10 and Figure 11 depict how influential elements have an impact on the system NPC. When the PV module and battery unit investment cost multiplier is 1, it can be shown that the system NPC will gradually increase with the increase in EV charging scale and the decrease in carbon dioxide emission limit. The increase in the PV penetration rate in grid-connected PV-storage microgrid is necessary in order to meet the increase in EV charging load under the fixed carbon emission limit, so the system NPC increases gradually with the increase in charging scale under the fixed carbon emission limit. Under the fixed EV charging scale, the system NPC gradually decreases as the carbon emission limit increases. Because the increase in carbon emission limit makes the microgrid less dependent on renewable energy, and the cost of installing solar panels and batteries for energy storage is more per unit than the cost of acquiring electricity from the distribution grid. The increase in carbon emission limit leads to an increased power exchange amount with the distribution grid and thus reduces the system NPC. When the PV and battery module unit cost multiplier is 0.6, the trend of system NPC is similar. However, the NPC is reduced by the decrease in the unit cost of PV and battery modules for the same carbon emission limit.

5. Conclusions

In this paper, the cooperative planning of a PV-storage microgrid with EVs was achieved using HOMER software. Several scenarios with various performances, e.g., economic and cleanliness performance of the microgrid, were incorporated into the collaborative planning. A case study of a business park in Wuhan, China, was used to compare and analyze the optimal PV-storage configuration of the microgrid. The economic and cleanliness performance under different scenarios were discussed and a sensitivity analysis was conducted. Through case studies, the following conclusions were drawn.
(1) Based on the proposed economic and cleanliness indices, the optimal planning scheme of grid-connected PV-storage microgrids under three different scenarios was obtained. The comparison of the planning results showed that when only the economic index was considered (Scenario I), the configured microgrid contained a lower percentage of renewable energy and was less clean, but it showed the best economic performance. When only the cleanliness index was considered (Scenario II), the economic performance of the microgrid was poor, and the LCOE reached 1.893 Yuan/kWh, which was 28.69% higher than the LCOE in Scenario I, but the cleanliness index was the highest. When both the economic and cleanliness indices were considered (Scenario III), the obtained optimal planning scheme balanced the economic and cleanliness performance.
(2) The sensitivity analysis demonstrated that the NPC of the microgrid was jointly determined by the unit investment of equipment, EV charging demand, and the carbon emission limits. The NPC gradually increased as the EV charging demand increased and the allowed carbon dioxide emission limits decreased. As the EV charging demand increased, the energy storage capacity required in the microgrid gradually increased, while the carbon dioxide emission limit was negatively correlated with the energy storage capacity demand. In addition, the unit investment cost of the PV and battery modules could significantly affect the optimal configuration of the microgrid. A lower unit investment cost of battery energy storage led to a larger energy storage capacity in the planning schemes, while a lower unit investment cost of PV modules resulted in a lower demand for energy storage in microgrids. The unit investment cost of the PV module units had a greater impact on the optimal system configuration than the cost of the batteries. The optimal planning scheme of the microgrid under 60% unit investment cost was stable and less affected by the EV charging scale, while the optimal planning scheme of the microgrid under the unit investment cost was more affected by the EV charging scale. Increasing the scale of EV charging at a unit investment cost will result in increased reliance of the microgrid on energy storage.

Author Contributions

Investigation, S.Y., W.Y., C.W., J.Y., Y.W. and L.L.; Writing—original draft, Y.Z. All authors have read and agreed to the published version of the manuscript.

Funding

This research was funded by Technical Standard of Shanghai 2020 “Technology Innovation Action Plan” (20DZ2205400).

Data Availability Statement

The data presented in this study are available on request from the corresponding author. The data are not publicly available due to the project works belonging to state-owned enterprises.

Conflicts of Interest

The authors declare that they have no conflict of interest.

Nomenclature

LCOE Levelized cost of energy (Yuan/ kWh)
NPC Net present cost (million Yuan)
P PV Output power of PV panel (kW)
Y PV PV array output power (kW)
f PV The derating factor for PV array
G ¯ T The solar radiation that hit the photovoltaic array during the current time period
G ¯ T , STC The solar radiation measured under typical test circumstances
α P The coefficient of power temperature
T c The current time period’s ambient temperature
T c , STC The temperature in typical test circumstances
P bat , cpmax The maximum charging power of the energy storage battery (kW)
P bat , dpmax The maximum discharging power of the energy storage battery (kW)
P bat , cpmax , kbm The maximum charging power of the energy storage battery per time step (kW)
P bac , cpmax , mcr The maximum charging power of the energy storage battery in the maximum charging rate limit (kW)
P bac , cpmax , mcc The maximum charging power of the energy storage battery in the maximum charging current limit (kW)
P bat , dpmax , kbm The maximum discharging power of the energy storage battery within each time step (kW)
η bat , c The charging efficiency of the energy storage battery (%)
η bat , d The discharging efficiency of the energy storage battery (%)
Q 1 Available energy of the energy storage battery (kJ)
Q max The maximum storage energy of the energy storage battery (kJ)
k The rate constant of the energy storage battery
c Capacity ratio of the energy storage battery
a c The maximum charging rate of the energy storage battery (Ah)
N bat The total number of series and parallel connections of the energy storage battery
V nom Rated voltage of the energy storage battery (V)
I max The maximum charging current (Ah)
f NRF Percentage of non-renewable energy (%)
f RF Percentage of renewable energy (%)
E nonren The amount of electricity purchased from the grid (kWh/year)
E served Annual electrical load(kWh/year)
f E C O 2 Carbon dioxide emission (kg/kWh)
P g r i d , t Power purchased from the grid (kW)
k 1 Carbon emission factor
C ann , tot Total annualized cost of the system (Yuan/ year)
f LCOE Levelized cost of electricity (Yuan/ kWh)
f NPC Net present cost of the microgrid system (million Yuan)
C R F ( i , N ) Capital recovery factor
i Discount rate
N Project life cycle (year)
a i j The index value of the j th decision index of the i th alternate solution
E j Information entropy of decision indicators
p i j The weight of indicator value of option i under j decision indicators
ω j The weight value of the decision matrix
NRF Percentage of non-renewable energy (%)
RF Percentage of renewable energy (%)

References

  1. Ren, G.R.; Liu, J.F.; Wan, J.; Guo, Y.F.; Yu, D. Overview of wind power intermittency: Impacts, measurements, and mitigation solutions. Appl. Energy 2017, 204, 47–65. [Google Scholar] [CrossRef]
  2. Ding, X.; Ma, H.; Yan, Z.; Xing, J.; Sun, J. Distributionally robust capacity configuration for energy storage in microgrid considering renewable utilization. Front. Energy Res. 2022, 10, 923985. [Google Scholar] [CrossRef]
  3. Fu, X.; Zhang, C.; Wu, X. Statistical machine learning model for uncertainty analysis of photovoltaic power. Front. Energy Res. 2022, 10, 956543. [Google Scholar] [CrossRef]
  4. Nara, K. Next-generation power delivery system with resiliency and environmental affinity. Glob. Energy Interconnect. 2022, 5, 274–280. [Google Scholar] [CrossRef]
  5. Hou, H.; Wang, Z.; Hou, T.; Fang, R.; Tang, J.; Xie, C. Optimal schedule of 100% renewable energy microgrid considering demand response of EVs. Energy Rep. 2023, 9, 1743–1750. [Google Scholar] [CrossRef]
  6. Chai, Y.T.; Che, H.S.; Tan, C.K.; Tan, W.N.; Yip, S.C. A two-stage optimization method for Vehicle to Grid coordination considering building and Electric Vehicle user expectations. Int. J. Electr. Power Energy Syst. 2023, 148, 108984. [Google Scholar] [CrossRef]
  7. Meng, S.X.; Qian, K.J.; Wang, H.; Yuan, J.; Zhou, H.; Shi, X.C. Electric vehicle charging strategy considering harmonics and the effect on current-carrying capacity and thermal life of distribution network cables. High Volt. Technol. 2020, 46, 1269–1280. [Google Scholar]
  8. Meng, T.; Ai, X. The operation of microgrid containing electric vehicles. In Proceedings of the 2011 Asia-Pacific Power and Energy Engineering Conference, Wuhan, China, 25–28 March 2011; pp. 1–5. [Google Scholar]
  9. Hu, Z.C.; Song, Y.H.; Xu, Z.W.; Luo, Z.W.; Zhan, K.Q.; Jia, L. Impact and utilization of electric vehicle access to power grid. Chin. J. Electr. Eng. 2012, 32, 1–10+25. [Google Scholar]
  10. Strnad, I.; Prenc, R. Optimal sizing of renewable sources and energy storage in low-carbon microgrid nodes. Electr. Eng. 2018, 100, 1661–1674. [Google Scholar] [CrossRef]
  11. Gong, Q.; Midlam-Mohler, S.; Marano, V.; Rizzoni, G. Study of PEV charging on residential distribution transformer life. IEEE Trans. Smart Grid 2011, 3, 404–412. [Google Scholar] [CrossRef]
  12. Gómez, J.C.; Morcos, M.M. Impact of EV battery chargers on the power quality of distribution systems. IEEE Trans. Power Deliv. 2003, 18, 975–981. [Google Scholar] [CrossRef]
  13. Xu, D.M.; Kang, L.C.; Chang, L.C.; Cao, B.G. Optimal sizing of standalone hybrid wind/PV power systems using genetic algorithms. In Proceedings of the Canadian Conference on Electrical and Computer Engineering, Saskatoon, SK, Canada, 1–4 May 2005; pp. 1722–1725. [Google Scholar]
  14. Goodall, G.; Scioletti, M.; Zolan, A.; Suthar, B. Optimal design and dispatch of a hybrid microgrid system capturing battery fade. Optim. Eng. 2019, 20, 179–213. [Google Scholar] [CrossRef]
  15. Yuan, H.; Ye, H.; Chen, Y.; Deng, W. Research on the optimal configuration of photovoltaic and energy storage in rural microgrid. Energy Rep. 2022, 8, 1285–1293. [Google Scholar] [CrossRef]
  16. Bernal-Agustín, J.L.; Dufo-López, R.; Rivas-Ascaso, D.M. Design of isolated hybrid systems minimizing costs and pollutant emissions. Renew. Energy 2006, 31, 2227–2244. [Google Scholar] [CrossRef]
  17. Sadeghi, D.; Naghshbandy, A.H.; Bahramara, S. Optimal sizing of hybrid renewable energy systems in presence of electric vehicles using multi-objective particle swarm optimization. Energy 2020, 209, 118471. [Google Scholar] [CrossRef]
  18. Movahediyan, Z.; Askarzadeh, A. Multi-objective optimization framework of a photovoltaic-diesel generator hybrid energy system considering operating reserve. Sustain. Cities Soc. 2018, 41, 1–12. [Google Scholar] [CrossRef]
  19. Chen, X.; Dong, W.; Yang, Q. Robust optimal capacity planning of grid-connected microgrid considering energy management under multi-dimensional uncertainties. Appl. Energy 2022, 323, 119642. [Google Scholar] [CrossRef]
  20. Eltamaly, A.M.; Alotaibi, M.A. Novel fuzzy-swarm optimization for sizing of hybrid energy systems applying smart grid concepts. IEEE Access 2021, 9, 93629–93650. [Google Scholar] [CrossRef]
  21. Mamaghani, A.H.; Escandon, S.A.A.; Najafi, B.; Shirazi, A.; Rinaldi, F. Techno-economic feasibility of photovoltaic, wind, diesel and hybrid electrification systems for off-grid rural electrification in Colombia. Renew. Energy 2016, 97, 293–305. [Google Scholar] [CrossRef]
  22. Fazelpour, F.; Soltani, N.; Rosen, M.A. Economic analysis of standalone hybrid energy systems for application in Tehran, Iran. Int. J. Hydrogen Energy 2016, 41, 7732–7743. [Google Scholar] [CrossRef]
  23. Fazelpour, F.; Farahi, S.; Soltani, N. Techno-economic analysis of hybrid power systems for a residential building in Zabol, Iran. In Proceedings of the 2016 IEEE 16th International Conference on Environment and Electrical Engineering (EEEIC), Florence, Italy, 7–10 June 2016; pp. 1–6. [Google Scholar]
  24. Elkadeem, M.R.; Wang, S.; Sharshir, S.W.; Atia, E.G. Feasibility analysis and techno-economic design of grid-isolated hybrid renewable energy system for electrification of agriculture and irrigation area: A case study in Dongola, Sudan. Energy Convers. Manag. 2019, 196, 1453–1478. [Google Scholar] [CrossRef]
  25. Culaba, A.B.; Del Rosario, A.J.R.; Ubando, A.T.; Chang, J.S. Optimal design of an integrated renewable-storage energy system in a mixed-use building. Int. J. Energy Res. 2020, 44, 9646–9658. [Google Scholar] [CrossRef]
  26. Patil, R.D.; Veena, S.; Sridhar, H.V. Design and Evaluation of Charging Stations Including Renewables and Storage. In Proceedings of the 2019 Global Conference for Advancement in Technology (GCAT), Bangalore, India, 18–20 October 2019; pp. 1–6. [Google Scholar]
  27. Hafez, O.; Bhattacharya, K. Optimal design of electric vehicle charging stations considering various energy resources. Renew. Energy 2017, 107, 576–589. [Google Scholar] [CrossRef]
  28. Turkdogan, S. Design and optimization of a solely renewable based hybrid energy system for residential electrical load and fuel cell electric vehicle. Eng. Sci. Technol. Int. J. 2021, 24, 397–404. [Google Scholar] [CrossRef]
  29. Manwell, J.F.; McGowan, J.G. Lead acid battery storage model for hybrid energy systems. Sol. Energy 1993, 50, 399–405. [Google Scholar] [CrossRef]
  30. Milone, D.; Curto, D.; Franzitta, V.; Guercio, A.; Cirrincione, M.; Mohammadi, A. An economic approach to size of a renewable energy mix in small Islands. Energies 2022, 15, 2005. [Google Scholar] [CrossRef]
  31. Podder, A.K.; Das, A.K.; Hossain, E.; Kumar, N.M.; Roy, N.K.; Alhelou, H.H.; Al-Hinai, A. Integrated modeling and feasibility analysis of a rooftop photovoltaic systems for an academic building in Bangladesh. Int. J. Low-Carbon Technol. 2021, 16, 1317–1327. [Google Scholar] [CrossRef]
  32. Riayatsyah, T.M.I.; Geumpana, T.A.; Fattah, I.M.R.; Rizal, S.; Mahlia, T.I. Techno-Economic Analysis and Optimisation of Campus Grid-Connected Hybrid Renewable Energy System Using HOMER Grid. Sustainability 2022, 14, 7735. [Google Scholar] [CrossRef]
  33. Cartland, R.; Sendegeya, A.M.; Hakizimana, J.D.K. Performance Analysis of a Hybrid of Solar Photovoltaic, Genset, and Hydro of a Rural-Based Power Mini-Grid: Case Study of Kisiizi Hydro Power Mini-Grid, Uganda. Processes 2023, 11, 175. [Google Scholar] [CrossRef]
  34. Arabzadeh, S.M.; Fazelpour, F.; Soltani, N.; Rosen, M.A. Performance analysis of a photovoltaic/wind/diesel hybrid power generation system for domestic utilization in winnipeg, manitoba, Canada. Environ. Prog. Sustain. Energy 2019, 38, 548–562. [Google Scholar] [CrossRef]
  35. Lu, J.; Wang, W.; Zhang, Y.; Cheng, S. Multi-objective optimal design of stand-alone hybrid energy system using entropy weight method based on HOMER. Energies 2017, 10, 1664. [Google Scholar] [CrossRef] [Green Version]
  36. Li, J.; He, Z.; Wang, Y.; Lv, J.; Zhao, L. A two-dimensional cloud model for condition assessment of HVDC converter transformers. Energies 2012, 5, 157–167. [Google Scholar] [CrossRef]
  37. Ji, Y.; Huang, G.H.; Sun, W. Risk assessment of hydropower stations through an integrated fuzzy entropy-weight multiple criteria decision making method: A case study of the Xiangxi River. Expert Syst. Appl. 2015, 42, 5380–5389. [Google Scholar] [CrossRef]
Figure 1. Topology of a grid-connected PV-storage microgrid.
Processes 11 02408 g001
Figure 2. Annual solar radiation.
Processes 11 02408 g002
Figure 3. Annual temperature parameters.
Processes 11 02408 g003
Figure 4. Annual conventional load curve.
Processes 11 02408 g004
Figure 5. Typical daily conventional load curve.
Processes 11 02408 g005
Figure 6. Annual EV charging load curve.
Processes 11 02408 g006
Figure 7. Typical daily EV charging load curve.
Processes 11 02408 g007
Figure 8. Sensitivity to EV charging demand and CO2 emission limits at different unit investment costs.
Processes 11 02408 g008
Figure 9. Sensitivity of the microgrid to EV charging demand and CO2 emission limits when the individual component cost multiplier is reduced to 0.6.
Processes 11 02408 g009
Figure 10. System NPC surface with unit investment cost multiplier of 1.
Processes 11 02408 g010
Figure 11. System NPC surface with a unit investment cost multiplier of 0.6.
Processes 11 02408 g011
Table 1. Comparison between microgrid capacity planning in the literature.
LiteratureComponentsObjective FunctionSensitivity Analysis
PVStorageEVOthersEconomic Performance IndicesCleanliness Performance Indices
[13] WindTotal capital cost
[14] Diesel generatorsTotal capital cost + system operating costs + LCOE
[15] Total capital cost + system operating costsPV utilization
[16] Diesel generatorsNPC
[17] Life cycle cost (LCC) + LPSP
[18] Diesel generatorsNPC + LPSPCarbon dioxide emission
[19] WindTotal capital costCarbon dioxide emission
[20] Diesel generators + windCost of energy + loss of load probability
[21] Diesel generatorsNPC + LCOE
[22] Diesel generatorsNPC
[23] Diesel generatorsNPC + LCOE
[24] Diesel generatorsNPC
[25] NPC
[26] NPC
[27]Diesel generatorsNPC
This paper NPC + LCOECarbon dioxide emission + percentage of renewable energy
Table 2. Electric vehicle technical parameters.
Type of CarPercentage (%)Maximum Charging Power (kW)Average Charging Time (min)
SUV Electric Vehicles30150260
Small electric cars7050260
Table 3. Weight of each index in Scenario III.
IndicatorInformation Entropy ValueInformation Utility ValueWeight
NPC0.9880.0124.971%
LCOE0.9940.0062.714%
NRF0.9310.06929.134%
E C O 2 0.8510.14963.181%
Table 4. Planning results for the grid-connected PV-storage microgrid.
System ComponentSystem Component ParameterConfiguration Result
Scenario IScenario IIScenario III
PVInstalled capacity (kW)874.8826342195
Battery bankNominal capacity × string (kWh)80044000
Converterrated power (kW)297.27637637
Table 5. Economic and cleanliness performance of the grid-connected PV-storage microgrid.
IndexScenario IScenario IIScenario III
NPC (million Yuan)223050403110
LCOE (Yuan/kWh)1.4711.8931.097
RF (%)73.0698.8685.623
E C O 2 (kg/year)199,675.314,857.95199,178.9
Table 6. Investment and operation and investment costs under different scenarios.
Scenario IScenario IIScenario III
PV module investment cost (million Yuan)839.8825302110
System operation and maintenance costs (million Yuan)116037502450
Table 7. Component parameters under different scenarios.
IndicatorScenario IScenario IIScenario III
Excess Electricity (kWh/year)219,546.21,244,603873,389.2
Excess Electricity (%)15.1248136.1536427.60093
Load shedding (%)000
PV/Production (kWh/year)1,135,6213,419,0292,849,191
100LI/Annual Throughput (kWh/year)133,973.5307,623.8\
Energy Purchased (kWh)315,941.923,509.41315,156.4
Energy Sold (kWh)110,542.8996,154.81,129,914
Disclaimer/Publisher’s Note: The statements, opinions and data contained in all publications are solely those of the individual author(s) and contributor(s) and not of MDPI and/or the editor(s). MDPI and/or the editor(s) disclaim responsibility for any injury to people or property resulting from any ideas, methods, instructions or products referred to in the content.

