Review

Desiccant Technologies for Improving Air Quality: An Overview of the Brazilian Scenario and Comparison of Available Design Software for Manufactured Desiccant Wheels

by
York Castillo Santiago
1,*,
Bruno Gomes Nunes
2,
Geovani Souza Fontana
2,
Daiane Busanello
2,
Alexandre Fernandes Santos
2,
Samuel Moreira Duarte Santos
1,3,
Estefania Neiva de Mello
3 and
Leandro A. Sphaier
1
1
Laboratory of Thermal Sciences (LATERMO), Mechanical Engineering Department (TEM/PGMEC), Fluminense Federal University, Rua Passo da Pátria 156, Niterói 24210-240, RJ, Brazil
2
Escola Técnica Profissional, Grupo ETP, Rua Eng. Rebouças 2213, Curitiba 80230-040, PR, Brazil
3
Centrais Elétricas Brasileiras S.A (ELETROBRAS), Rua da Quitanda 196, Rio de Janeiro 20091-005, RJ, Brazil
*
Author to whom correspondence should be addressed.
Processes 2023, 11(7), 2031; https://doi.org/10.3390/pr11072031
Submission received: 17 June 2023 / Revised: 27 June 2023 / Accepted: 4 July 2023 / Published: 7 July 2023
(This article belongs to the Special Issue Advances in Renewable Energy Systems)

Abstract

:
A review of desiccant dehumidification technologies for improving air quality is presented, mainly focusing on alternatives for air conditioning systems for minimizing Sick Building Syndrome. The principles and types of desiccant wheels, as well as the existing selection software for these types of equipment, were reviewed and comparatively evaluated. The study focused on the Brazilian context; thus, information about this country’s air conditioning systems and laws were evaluated. Possible applications of desiccant wheels, such as their integration into cooling cycles and the sensible heat wheel, were also analyzed. Finally, several examples of commercial desiccant wheel selection software that are useful in many situations were evaluated. Nevertheless, it was evidenced that the available software could not perform an operation analysis for only a specific period. Therefore, creating computational tools to select desiccant wheels is essential when considering the data from the different Brazilian regions for a year.

1. Introduction

In air conditioning design, it is essential to consider the addition of external air to closed environments such as offices, schools, hospitals, and malls, among others. The American Society for Heating, Refrigeration and Air-Conditioning Engineering (ASHRAE) established that if a building has more than 20% of people with symptoms of some disease or discomfort when exposed to this environment, it is considered a building that fits a Sick Building Syndrome (SBS) situation [1].
The lack of indoor air renewal causes the accumulation of chemical pollutants (carbon monoxide and dioxide, sulfur dioxide and formaldehyde, and ammonia, among others) and biological contaminants (fungi, algae, protozoa, bacteria, and mites), which makes the air hazardous for human health and is a risk factor for people with respiratory diseases [2]. Environments with high levels of these pollutants are conventionally called SBS; the World Health Organization (WHO) recognized this problem in 1982 [3].
In the 1970s, an energy crisis spread globally due to conflicts between oil-exporting countries in the Middle East. As a result, oil suffered a reduction in production and a price increase, reaching 400% in 1973. In the same period, engineers looking for alternatives to reduce electric energy consumption [4] reduced the external air supply to buildings [5,6]. Consequently, the first reports of SBS [7] were seen.
Fungal exposures are receiving increasing attention as an occupational and public health problem due to the high prevalence of fungal contamination in buildings [8]. Moisture and moisture-related problems are significant sources of fungal contamination in homes, buildings, and schools [9]. Indoor fungi can be inhaled, and the presence of such particles has been linked to many illnesses and symptoms (infections, allergic reactions, or toxic responses) among occupants of moisture-damaged buildings [10]. On the other hand, moisture damage in buildings could alter various components of building materials, which can be another source of deterioration in indoor air quality (IAQ) [11]. Fungal growth is associated with moisture content, defined as the ratio between a material’s free water and dry weight [12].
Some studies indicated a relation between humidity, indoor-measured visible biological contaminant growth, and its effects on human health. Sterling et al. [13] analyzed the humidity impact on contaminants (such as viruses, bacteria, and fungi) and the possible impacts on human health. At room temperature, the authors observed that the required humidity range for minimizing risks to human health by biological contaminants was between 40 and 60%, as shown in Figure 1.
In 1984, the WHO estimated that up to 30% of buildings could be affected by SBS. In the early 1980s, SBS was correlated with environmental problems. Table 1 shows some of the main symptoms associated with SBS. However, the concept is evolving, including in terms of psychological aspects, economic implications, energy savings, and climate change [14].
Brasche [15] observed that women suffer more from SBS when compared to men, with 44.3% of women suffering from SBS while only 26.2% of men faced this problem, as shown in Table 2. However, this percentage difference between genders was due to position within the company; in the same study, when men and women were in environments with the same IAQ, the rates of occurrence of SBS were similar.
In the mid-1990s, when the issue of indoor air quality began to gain importance in Brazil, air conditioning systems became a main subject for maintaining cleanliness and conservation. In 1998, with the death of the then-Minister of Communications Sérgio Motta, attributed mainly to the bacterium Legionella, the then-Minister of Health José Serra announced the formation of a study group to publish legislation that obliged those responsible for air conditioning systems to maintain clean systems, therefore preventing diseases in the Brazilian population [16].
The Ministry of Health published in 1998 the ORDINANCE N°3523 [17], which defines values and definitions to maintain IAQ as described in Art. 4, the definition of Sick Building Syndrome. Based on Art. 5, it is possible to mention the need to meet a minimum level of air renewal (27 m3/h/person) and a minimum filtration of class G1. On the other hand, the Brazilian Ministry of Health published in 2003 the RESOLUTION No. 09 (RE-09) [18], which presents additional information from ORDINANCE No. 3523/98. One of the definitions given in RE-09 is the concept of air conditioning, which corresponds to the air-treatment process intended to maintain the IAQ requirements of the conditioned space by controlling variables such as temperature, humidity, speed, particulate matter, biological particles, and carbon dioxide content.
RE No. 09 also presents parameters related to the maximum recommended value for microbiological contamination, which is 750 cfu/m3 (colony-forming unit/cubic meter), and chemical contamination, which is 1000 ppm for the concentration of carbon dioxide (CO2) and 80 μg/m3 of aero dispersoids. In addition to these parameters, there are recommended operating ranges for temperature, humidity, air speed, air renewal rate, and the degree of air purity that must comply with the Brazilian Regulatory Standard NBR 16401-3 for indoor air quality [19].
An essential point for maintaining IAQ is to keep the equipment in full operation; for this, it was necessary to create a Maintenance, Operation, and Control Plan (MOCP). Considering that in maintaining IAQ requirements in situations with a considerable latent heat load, as commonly found in HVAC applications, a significant amount of moisture removal is required, desiccant technologies have a significant advantage over the traditional vapor compression-based (also termed mechanical dehumidification) alternatives. This is because on the one hand, vapor compression systems need to cool the process airstream to temperatures below the dewpoint to obtain the dehumidification effect, which occurs due to regular condensation. Naturally, this involves an additional high-grade energy expense. On the other hand, when desiccant systems perform dehumidification, the subcooling becomes unnecessary, thus saving a considerable portion of high-grade energy.
In Brazil, the Civil House published Law No. 13,589 of 2018 [20], which obliges public and collective buildings to keep the MOCP active, thus guaranteeing the ranges established for a good IAQ. Increasing air renewal in buildings without proper treatment does not solve all the problems associated with IAQ. According to Che et al. [21], this methodology can increase indoor humidity, which can also substantially raise the potential for microbiological growth, as this increase in ventilation can augment the concentration of pollutants in the environment. However, the practice of increasing the rates of air renewal has established itself among designers [22]. Outdoor air recommendations are stipulated for each type of design for designers seeking to increase the speed of outdoor air to the maximum allowed according to NBR 16401-3 and obtain systems that provide temperature, humidity, and specific filtration control for the condition of the environment in question. It could consider using total heat exchangers as enthalpy wheels, which can provide energy savings to the building.
According to Pargeter [23], the energy consumption required by conventional air treatment practices for air conditioning in commercial buildings represents an average of 10% of all energy spent in the United States. The author also noted that a large part of the energy consumption for air conditioning in these commercial buildings is due to air renewal, which is different from the internal comfort conditions. In addition to electricity consumption, the higher air renewal rate leads to greater investments and maintenance costs for such Heating, Ventilation, and Air Conditioning (HVAC) systems.
One alternative to conventional refrigeration systems is the so-called desiccant cooling cycle [24,25], which employs active desiccant rotors for dehumidifying the outdoor air and running the produced dry air through evaporative coolers to provide the refrigeration effect. The main advantage of such technology is that no special refrigerant fluids are required and it is mainly driven by thermal energy, which means that solar or thermal waste energy can power these cycles. On the other hand, the COP of this cycle is quite low, which could not be a significant issue when considering that a renewable source or waste energy is being used as a source of power. These alternatives can also be used alongside other cooling systems, as previously demonstrated [26,27].
This research assessed alternatives for air HVAC systems to minimize Sick Building Syndrome and improve air quality while considering international programs/standards. For this purpose, an alternative technology known as desiccant wheels was studied by analyzing their principles and types when the existing selection software for these types of equipment was performed. In addition, energy-efficiency programs worldwide and in the Brazilian context were analyzed while aiming at implementing strategies in which desiccant wheels are appropriate. Finally, some examples of commercial software for desiccant wheels were compared with an aim to identify the different tools available in the air conditioning market.

2. Energy Efficiency Programs Worldwide

The International Energy Agency [28] estimated that about 2/3 of homes worldwide will have an air conditioner installed by the year 2050, representing sales of 10 air conditioners per second within the next 30 years. There is an expectation that air cooling systems could account for more than 20% of the world’s electrical energy demand growth (provided that no alternative technologies for air conditioning become available). According to the Brazilian Association of Refrigeration, Air Conditioning, Ventilation, and Heating (ABRAVA) [29], the Brazilian air conditioning and refrigeration sector in the year 2021 presented a percentage growth of 9.8% by the year 2020, while the amount of split-type air conditioners that were produced in 2021 exceeded 3.5 million units. This significant increase in sales in the HVAC sector resulted in an increase in energy consumption. Therefore, programs aimed at energy efficiency were created to obtain better results regarding air conditioning systems, increases in renewal air, and electricity consumption.

2.1. World

The first climate zoning initiatives for building energy-efficiency programs were mainly undertaken in countries (Sweden and Norway) dominated by heating with extreme weather conditions [30]. Nowadays, several countries, such as Australia [31], China [32], Germany [33], India [34], Japan [35], Saudi Arabia [36], the United Kingdom [37], and the United States [38], are subject to climate zoning for energy-efficiency analysis in buildings. In Brazil, the first definition of climatic zones was presented by Roriz et al. [39]. These climate zones are used for various purposes and support thermal regulations with prescription-based and performance-based requirements, standardized data for building energy calculation, energy standards, voluntary labeling programs, and design guidelines [40].
The number of zones needed to characterize a country is essential for the success of building energy-efficiency programs [41]. An excess of zones leads to complicated energy-efficiency programs for buildings, making their use and adoption difficult. A low number leads to extensive zones with significant climatic variations, making them unsuitable for any building energy-efficiency program [42].
The United States of America (USA) has a national building code applicable to its total territory but also has state-level building regulations that address smaller fractions of its territory [43]. According to the International Energy Conservation Code [44] and Standard 90.1-2019 of ASHRAE [38], the USA is divided into 17 zones. The low-resolution national climate zoning of the USA is contrasted with the climate zoning of the state of California, where significant energy-efficiency efforts have recently been implemented. California has a higher resolution climate zoning containing 16 zones, with climate zones defined by energy use [38].
On the other hand, Tunisia has two climate classifications (one for thermal regulation purposes and another for passive construction design guidelines) based on performance metrics such as energy consumption by HVAC and thermal comfort in buildings without HVAC. However, climate zoning developed for thermal-regulation purposes has minor sensitivity to some climatic variables, such as wind speed and direction [45]. Climate zoning is usually adopted to guide requirements for civil construction, which has a high economic impact. However, in some countries, such as Brazil, climate zoning took more time to become part of building requirements due to the slow transition from voluntary to mandatory requirements [46]. Another factor that complicates the implementation of climate zoning is an arbitrary number of zones, especially in the case of neighboring areas with similar climates but located on opposite sides of the boundaries between adjacent zones. For example, on the border between Argentina, Brazil, and Uruguay, recommended values for coverage based on climate zoning range from 0.5 to 2 W/m2K depending on which side of the border the building is located (despite negligible climatic variations in this region) [40].
The European Union has developed two strategies to combat CO2 emissions and promote building energy efficiency. Initially, energy performance certification was created in the 1990s as an essential method for reducing energy use and CO2 emissions. Subsequently, countries adopted an Energy Policy Strategy called Horizon 20-20 (“H2020”) to reduce greenhouse gas emissions. European Union countries have been implementing various methods, laws, and projects to achieve the targets prescribed by H2020; however, the main focus has been on building efficient new buildings and renovating older ones [47]. In China, mandatory minimum standards for home appliances have been adopted, and an increase in regulation and enforcement of these standards is noticeable. This country promotes a voluntary energy-efficiency labeling program for devices and uses EU-adopted labeling conventions. Corporate income tax incentives encourage energy-efficient technologies and measures [48].

2.2. Brazil

Due to the importance of air conditioning and the associated energy consumption, programs were created to optimize the electricity consumption of buildings, especially HVAC systems. Thus, programs have emerged aimed at studying technologies to improve the energy efficiency of an air treatment system. According to Xu et al. [49], in 2001, Brazil suffered the largest energy crisis, leading the population and institutions to mobilize and seek alternatives to save electricity. Therefore, different energy-efficiency programs were implemented in Brazil.

2.2.1. National Electric Energy Conservation Program

With the increasing concern about energy consumption, a discussion in Brazil on the energy issue began in 1984 conducted by The National Institute of Metrology, Standardization, and Industrial Quality (INMETRO). This institution contributed to creating the Brazilian Labeling Program (PBE in Portuguese), which works through informative labels to inform the consumer about the energy efficiency of the item in question [50]. The PBE gained strength by adding two partners: the National Energy Conservation Program (PROCEL in Portuguese) and the National Program for the Rationalization of the Use of Petroleum and Natural Gas Derivatives (CONPET in Portuguese) [51].
In 1993, the PROCEL Seal was created to inform consumers about more efficient equipment (mainly air conditioners, freezers, and refrigerators). Thus, it serves to identify the level of energy efficiency of appliances based on tests in laboratories certified by INMETRO and classified according to their level of energy consumption. Those that are classified as A are the ones that have better energy efficiency; that is, they consume less energy [52].
Considering buildings consume approximately 50% of Brazil’s energy, in 2003 the federal government created the PROCEL EDIFICA seal. This strategy seeks to evaluate commercial, residential, and public service building parameters to prepare buildings with the lowest possible energy expenditure by considering the facade, lighting, and air conditioning system [53]. In buildings that are structured from their conception to have the PBE EDIFICA seal, they present an energy reduction of up to 50% compared to buildings that have not adopted the PBE EDIFICA methodology. In buildings that have undergone significant retrofits, the percentage of energy reduction rises to 30% [54].
Figure 2 and Figure 3 present the results of annual investments and historical results obtained by PROCEL from 2008 to 2020 showing that there was an exponential increase in energy savings while investments after 2011 decreased.

2.2.2. Other Programs

In addition to PROCEL, other programs and mechanisms were created with the support of the Ministry of Mines and Energy, as well as laws and decrees in order to promote energy efficiency and energy conservation at the national level. Among all these, the main programs adopted are briefly presented:
  • National Program for the Rationalization of the Use of Petroleum and Natural Gas Derivatives (CONPET): CONPET is a Ministry of Mines and Energy program that Petrobras subsidizes through technical, administrative, and financial resources. It is a program instituted by decree in 1991 that is responsible for designing, operationalizing strategies, promoting institutional articulation, and disseminating the program’s actions. Initially, it aimed to encourage the efficient use of non-renewable sources in the economy;
  • Law No. 9478 of 6 August 1997: establishes the principles and objectives of the National Energy Policy, which aims to protect the environment and promote energy conservation. In addition, this law also created the National Energy Policy Council (CNPE). CNPE seeks to generate the rational use of the country’s energy resources. It will support regulatory agencies such as the National Electric Energy Agency (ANEEL) and the National Agency of Petroleum, Natural Gas, and Biofuels (ANP);
  • Law No. 9991 of 24 July 2000: establishes percentages of net operating revenue (NOR) of electric energy distributors to encourage the development of energy-efficiency projects aimed at use at the final point of consumption. In addition, it seeks the transformation of the electric energy market through equipment and new technologies;
  • Law No. 10,295 of 17 October 2001 (regulated by Decree No. 4059 of 19 December 2001): Law No. 10,295, also known as the Energy Efficiency Law, establishes the procedures to determine the electrical consumption of machines and energy-consuming appliances (whether they are manufactured or only marketed in the country) and target programs for each type of equipment. The main objective is to promote structural transformations in the market of energy-consuming equipment;
  • Decree No. 4059 also defines the procedures and responsibilities to establish the indicators and levels of energy efficiency. For this purpose, it instituted the Management Committee of Indicators and Energy Efficiency Levels (CGIEE) composed of the main institutions in the energy sector, such as the Ministry of Mines and Energy; the Ministry of Development, Industry, and Foreign Trade; the Ministry of Science and Technology and Innovation; ANEEL; and ANP, among others;
  • Law No. 13,280 of 3 May 2016: reserves 20% of the resources of electric energy companies destined for energy efficiency for application in PROCEL. This law also created the Energy Efficiency Management Committee, which transferred to ANEEL the power to define the collection schedule, fines, penalties, and payment method for the resources invested in PROCEL;
  • Sectoral Funds: these were created to provide financial resources to research, development, and innovation projects in Brazil and to contribute to the national advancement of technology, science, and innovation in their areas of activity, such as energy, water, mineral, oil, and natural gas. Sectoral funds use resources from the National Fund for Scientific and Technological Development (FNDCT), which was created in 1969;
  • PROESCO: this is intended to finance energy-efficiency projects and was approved in 2006 by the National Bank for Economic and Social Development. The program also supports implementing projects that present evidence that will contribute to energy savings and focuses mainly on lighting, compressed air, air conditioning and ventilation, refrigeration and cooling, and other sectors.

3. Desiccant Dehumidifiers

According to Kavanaugh [56], several improvements have already been implemented over the years in terms of the energy efficiency of air conditioning equipment. However, other technologies can reduce energy consumption, including desiccant wheels, enthalpy wheels, and cross-flow heat exchangers used to treat external air in buildings.

3.1. Background

In 1951, Carl Munters filed a patent for a desiccant-based drying system. He realized the potential for attracting water molecules and materials such as silica gel. From this concept, the process and development of drying technology using desiccant wheels began [57].
Desiccant wheels (Figure 4) are based on a wheel with desiccant crystals impregnated and grown on a fiberglass substrate. The lightweight wheel has a high surface-area-to-airflow ratio [58]. The desiccant wheel is a passive desiccant wheel or enthalpy wheel when there is no regeneration air heater. At the same time, it is called an active desiccant wheel when it is provided with an air heater, and the regeneration and process air sides are slatted apart. The wheel is installed with thermal insulation and air-proof material so that there is no mass and energy exchange with the surroundings [59].
During operation, the wheel rotates continuously and the desiccant cycles through adsorption, regeneration, and cooling every 4–5 min. Drying air is constantly regenerated in a closed circuit. The hot regeneration air passes through the desiccant medium, releasing the released moisture into the atmosphere [60]. No ambient air is introduced into the process because desiccant cooling is conducted using dry air. The desired dew point is achieved by changing the spin speed and other dryer variables without excessively drying the thermally sensitive materials [61]. Desiccant wheels are used in various heating and residential environments to prevent the growth of mold and mildew. As conventional air conditioning systems are limited, desiccants remove moisture (latent energy) in hot and humid climates [62].

3.2. Types of Desiccant Dehumidification Systems

Generally speaking, there are five types of desiccant dehumidification systems; however, the most widespread technology is the vertical desiccant rotor. Each of these technologies is described below.

3.2.1. Spray Drying Tower

The spray drying tower (Figure 5) has two tanks corresponding to the condenser and the regenerator. In this system, the humid air enters the segment of the condenser and passes through a saline fog that will capture the humidity of the air, while the dry air is inflated for the process. At the bottom of the condenser tank, the saline solution is pumped to the second tank (regenerator), through which the second flow of high-temperature external air passes, causing the saline solution to lose moisture to the regeneration air. Thus, the hygroscopic material returns to the condenser tank [63].

3.2.2. Dual-Tower Desiccant Dryers

The dual-tower desiccant dryers have two vessels (one for process and another for regeneration) as shown in Figure 6; each vessel has solid silica gel inside. Moist air passes through the first pressurized cylinder, trapping moisture in the silica gel until it saturates the hygroscopic material. After the saturation of the first cylinder, the direction of the process air to the second cylinder is reversed, the first being regenerated with external and heated air [65].

3.2.3. Tray Dryer

The spray dryer has two air flows (process and regeneration) as presented in Figure 7. The hygroscopic material responsible for capturing the humidity from the air is arranged in trays; the humid air passes through the process air sector, and the external air of the regeneration passes through 1/4 of the trays. The trays rotate so the silica gel passes from the process to the regeneration sector [66].

3.2.4. Multi-Belt Dryer

The multi-belt dryer has two streams of trays arranged vertically (Figure 8) in which the granular hygroscopic material is installed, and the humid process air passes through the trays. After the silica gel saturation, the tray rotates to the regeneration sector, where the moisture impregnated on the silica gel is eliminated [67].

3.2.5. Desiccant Dehumidifier

Figure 9 shows the working principle of the desiccant dehumidifier, which has two air flows; the first occupies ¾ of the wheel and is responsible for adsorbing all excess moisture from the air. After the air passes through the rotor, it is inflated with low moisture content [68].
The second airflow, called regeneration air, occupies ¼ of the rotor and is responsible for extracting moisture in a vapor state from the desiccant rotor using a flow of heated air. The rotor structure is constructed in the shape of a beehive in order to have the largest possible area of hygroscopic material in contact with the air [69]. The hygroscopic material may be silica gel or a mixture of silica gel and zeolites [70].

3.3. Desiccant Dehumidification by Heat-Recovery Wheel

Heat-recovery wheels have different operating characteristics from desiccant wheels; their main objective is to promote heat transfer and humidity between the two existing air flows in the equipment [71]. These types of equipment also can minimize cross-contamination due to exhaust and supply airflows and provide high-efficiency systems with a low-pressure drop in the airflows [72]. Thus, some technologies such as cross-flow heat exchangers and enthalpy wheels were developed [73].

3.3.1. Enthalpy Wheels

The rotary heat exchanger (Figure 10), commonly known as an enthalpy wheel, is an “air-air”-type heat exchanger that works on the principle of sensible heat (temperature) and latent heat (humidity) exchange between the flow of renewal air and the flow of exhaust air [74]. Enthalpy wheels can be classified as sensible heat wheels and enthalpy wheels. The denomination for these two types is due to their application, where the sensible heat wheels act with the function of only exchanging the sensible heat, while the enthalpy wheel works completely between the energies of the air (the sensible heat and the latent heat). These two processes occur between the two air masses that travel through the equipment [75].
The enthalpy wheel is an essential piece of equipment for building air-treatment systems that has some advantages and disadvantages. As an advantage, it can be mentioned that it is a technology that reaches efficiencies of around 50% to 80% [76]. Its operation and high operating flows provide energy savings since the cooling system that works after the enthalpy wheel can have a lower cooling load than the conventional one (without using the enthalpy wheel) [77]. For any design to meet the Green Building certifications, some minimum assumptions must be met, including the rate of air renewal of the central systems. Thus, it is possible to reduce the size of the cooling or heating coils of the air-treatment units [78]. Its main disadvantage is the initial investment in the system; however, this value has a short payback period [79].

3.3.2. Cross-Flow Heat Exchangers

The cross-flow heat exchanger is an “air-to-air” static heat exchanger. Like the enthalpy wheel, the cross-flow heat exchanger can be classified into two types [80]. The sensible cross-flow heat exchanger performs the function of only sensible heat exchange between the two air masses, and the conventional cross-flow heat exchanger (Figure 11) exchanges sensible heat and latent heat during the thermal exchange process of the equipment [81].
Cross-flow heat exchangers are generally used for gas-to-liquid heat-transfer applications in which the gas is on the outside and the liquid is on the tube side of the heat exchanger. Most of these exchangers have fins that increase the surface area and improve heat transfer. In most sensible heat-transfer applications, the external fluid is treated as unmixed flow, while the tube-side fluid is treated as mixed flow [82]. Nasif [83] found that cross-flow heat exchangers significantly reduce energy consumption. They reduces the latent load in hot and humid environments and provide 100% external air to the environment in question.

4. Software for Selecting Desiccant Wheels

Selecting a suitable desiccant requires that the involved dehumidification process be simulated. This can be quite time-consuming depending on the level of detail necessary for a specific simulation and a considerable amount of operating and construction data related to the wheel, as shown in previous works [84,85,86,87]. As a result, commercial software became available to facilitate the selection process of dehumidifiers while considering human breathing. Thus, Dong et al. [88] developed a plate dehumidifier model to analyze the shrinkage shape and the variable film thickness of the falling film. The results indicated that the moisture removal rates were augmented from 2.0 g/kg to 2.56 g/kg, the average film thickness decreased from 0.952 mm to 0.889 mm as the contact angles diminished from 85° to 5°, while the wetting area increased from 0.145 m2 to 0.176 m2.
Sun et al. [89] compared pre- and post-operative nasal airway models based on a 3-year-old nasal cavity model with apparent adenoid hypertrophy. The results showed that nasopharynx obstruction can induce significantly biased flow distribution in the central nasal passage even if the obstruction site is downstream of the nasal airway. Some review papers offered several works; for example, Tian and Ahmadi [90] studied the current state of computational modeling of micron and nano-elongated particle dynamics and their application to fiber transport and deposition in human respiratory airways; the most versatile and practical approach was the Eulerian–Lagrangian. Ma et al. [91] analyzed the parameters that affect the thermal performance of latent heat thermal energy storage systems (LHTES), including the inlet temperature of the heat transfer fluid, heat transfer rate, properties of the phase-change materials (PCMs), phase-change temperature, geometric parameters, and water tube layout, among others. Finally, the authors discussed the climatic conditions for air-LHTES and found that the higher ambient temperature led to incomplete solidification of the PCMs during the limited nighttime in air-LHTES.
This section presented software for selecting desiccant wheels provided by manufacturers, and some characteristics were analyzed. It is worth noting that there are other programs available for desiccant wheel simulations (TRNSYS, ESP, and Modelica, among others); however, this paper focused on desiccant manufacturer software; therefore, the analysis of other software was left for future studies.

4.1. Novel Aire

Novel Aire Technologies, based in the United States, is a company that has been operating in the dehumidification market for approximately 20 years with energy conservation products and desiccant wheels that has more than 500 customers in 25 countries around the world. The characteristics of Novel Aire software are presented in Table 3.

4.2. Munters

Munters was founded by Carl Munters in 1955 and is based in Sweden. It functions in the dehumidification and air conditioning market and serves thousands of customers with about 3500 employees, 17 factories worldwide, and an installed base of 320,000 air-treatment systems. The characteristics of Munters software are presented in Table 4.

4.3. Rotor Source

Rotor Source was founded in 1999 and is headquartered in the United States. It currently operates the dehumidification market and focuses on selling desiccant wheels to manufacturers of dehumidification equipment. The characteristics of Rotor Source software are presented in Table 5.

4.4. Puresci

Puresci is a China-based company with over 10 years of experience in the desiccant rotor field. It has projects with more than 1000 clients around the world. The characteristics of the rotor source Puresci are presented in Table 6.

4.5. Comparison between Software

Several companies that develop heat-recovery technologies using desiccant wheels are recognized by international organizations such as Eurovent and AHR Exhibition and by Brazilian agencies such as ABRAVA and the South Brazilian Association of Refrigeration, Air Conditioning, Heating and Ventilation (ASBRAV) were studied.
The research on commercial software for the technologies studied (Table 7) does not present a careful analysis of the operating results over a year; in most cases, the software only shows the efficiency and output data. In addition, it is necessary that for all software, the user must have external knowledge of thermal engineering to be able to analyze a project.
Therefore, the software should incorporate an updated database, such as the ASHRAE weather data viewer, into its source code to cover as many locations as possible with updated data. It is also necessary for the software to be able to perform a dynamic analysis of the total hours of the year and not just a one-off analysis.

5. Conclusions

This work presented options for reducing electrical energy consumption in air conditioning and refrigeration systems using desiccant dehumidification technologies. Initially, the importance of air renewal in buildings was analyzed, and it was observed that the circulation lack of renewed air could contribute to the environment being a favorable place for spreading respiratory diseases, which is a risk factor for a worker in any organization. Thus, a building with a high level of pollutants falls under the Sick Building Syndrome.
Subsequently, it was observed that the consumption of conventional air conditioning systems in countries such as the United States and Brazil may require up to 10% of the electricity demand of these countries. Therefore, programs aimed at energy efficiency were created or strengthened to obtain better results when referring to air conditioning systems, increases in renewal air, and electric energy consumption. For example, European Union countries adopted an energy policy known as Horizon 20-20 to reduce greenhouse gas emissions and implemented various laws and projects to achieve the Horizon 20-20 objectives.
The Brazilian Labeling Program has been implemented in Brazil since 1984 to indicate an item’s energy efficiency through informative labels. This program was strengthened by adding two policies: the National Energy Conservation Program and the National Program Rationalization of the Use of Petroleum Derivatives and Natural Gas. Other guidelines, such as Law No. 9478 of 1997, Law No. 9991 of 2000, and Law No. 10,295 of 2001, were implemented to promote efficiency and energy conservation in Brazil. All these programs were created to meet the current and future markets that demand high energy consumption. However, it is necessary to explore new technologies such as desiccant dehumidification, which have shown promising results in terms of energy efficiency.
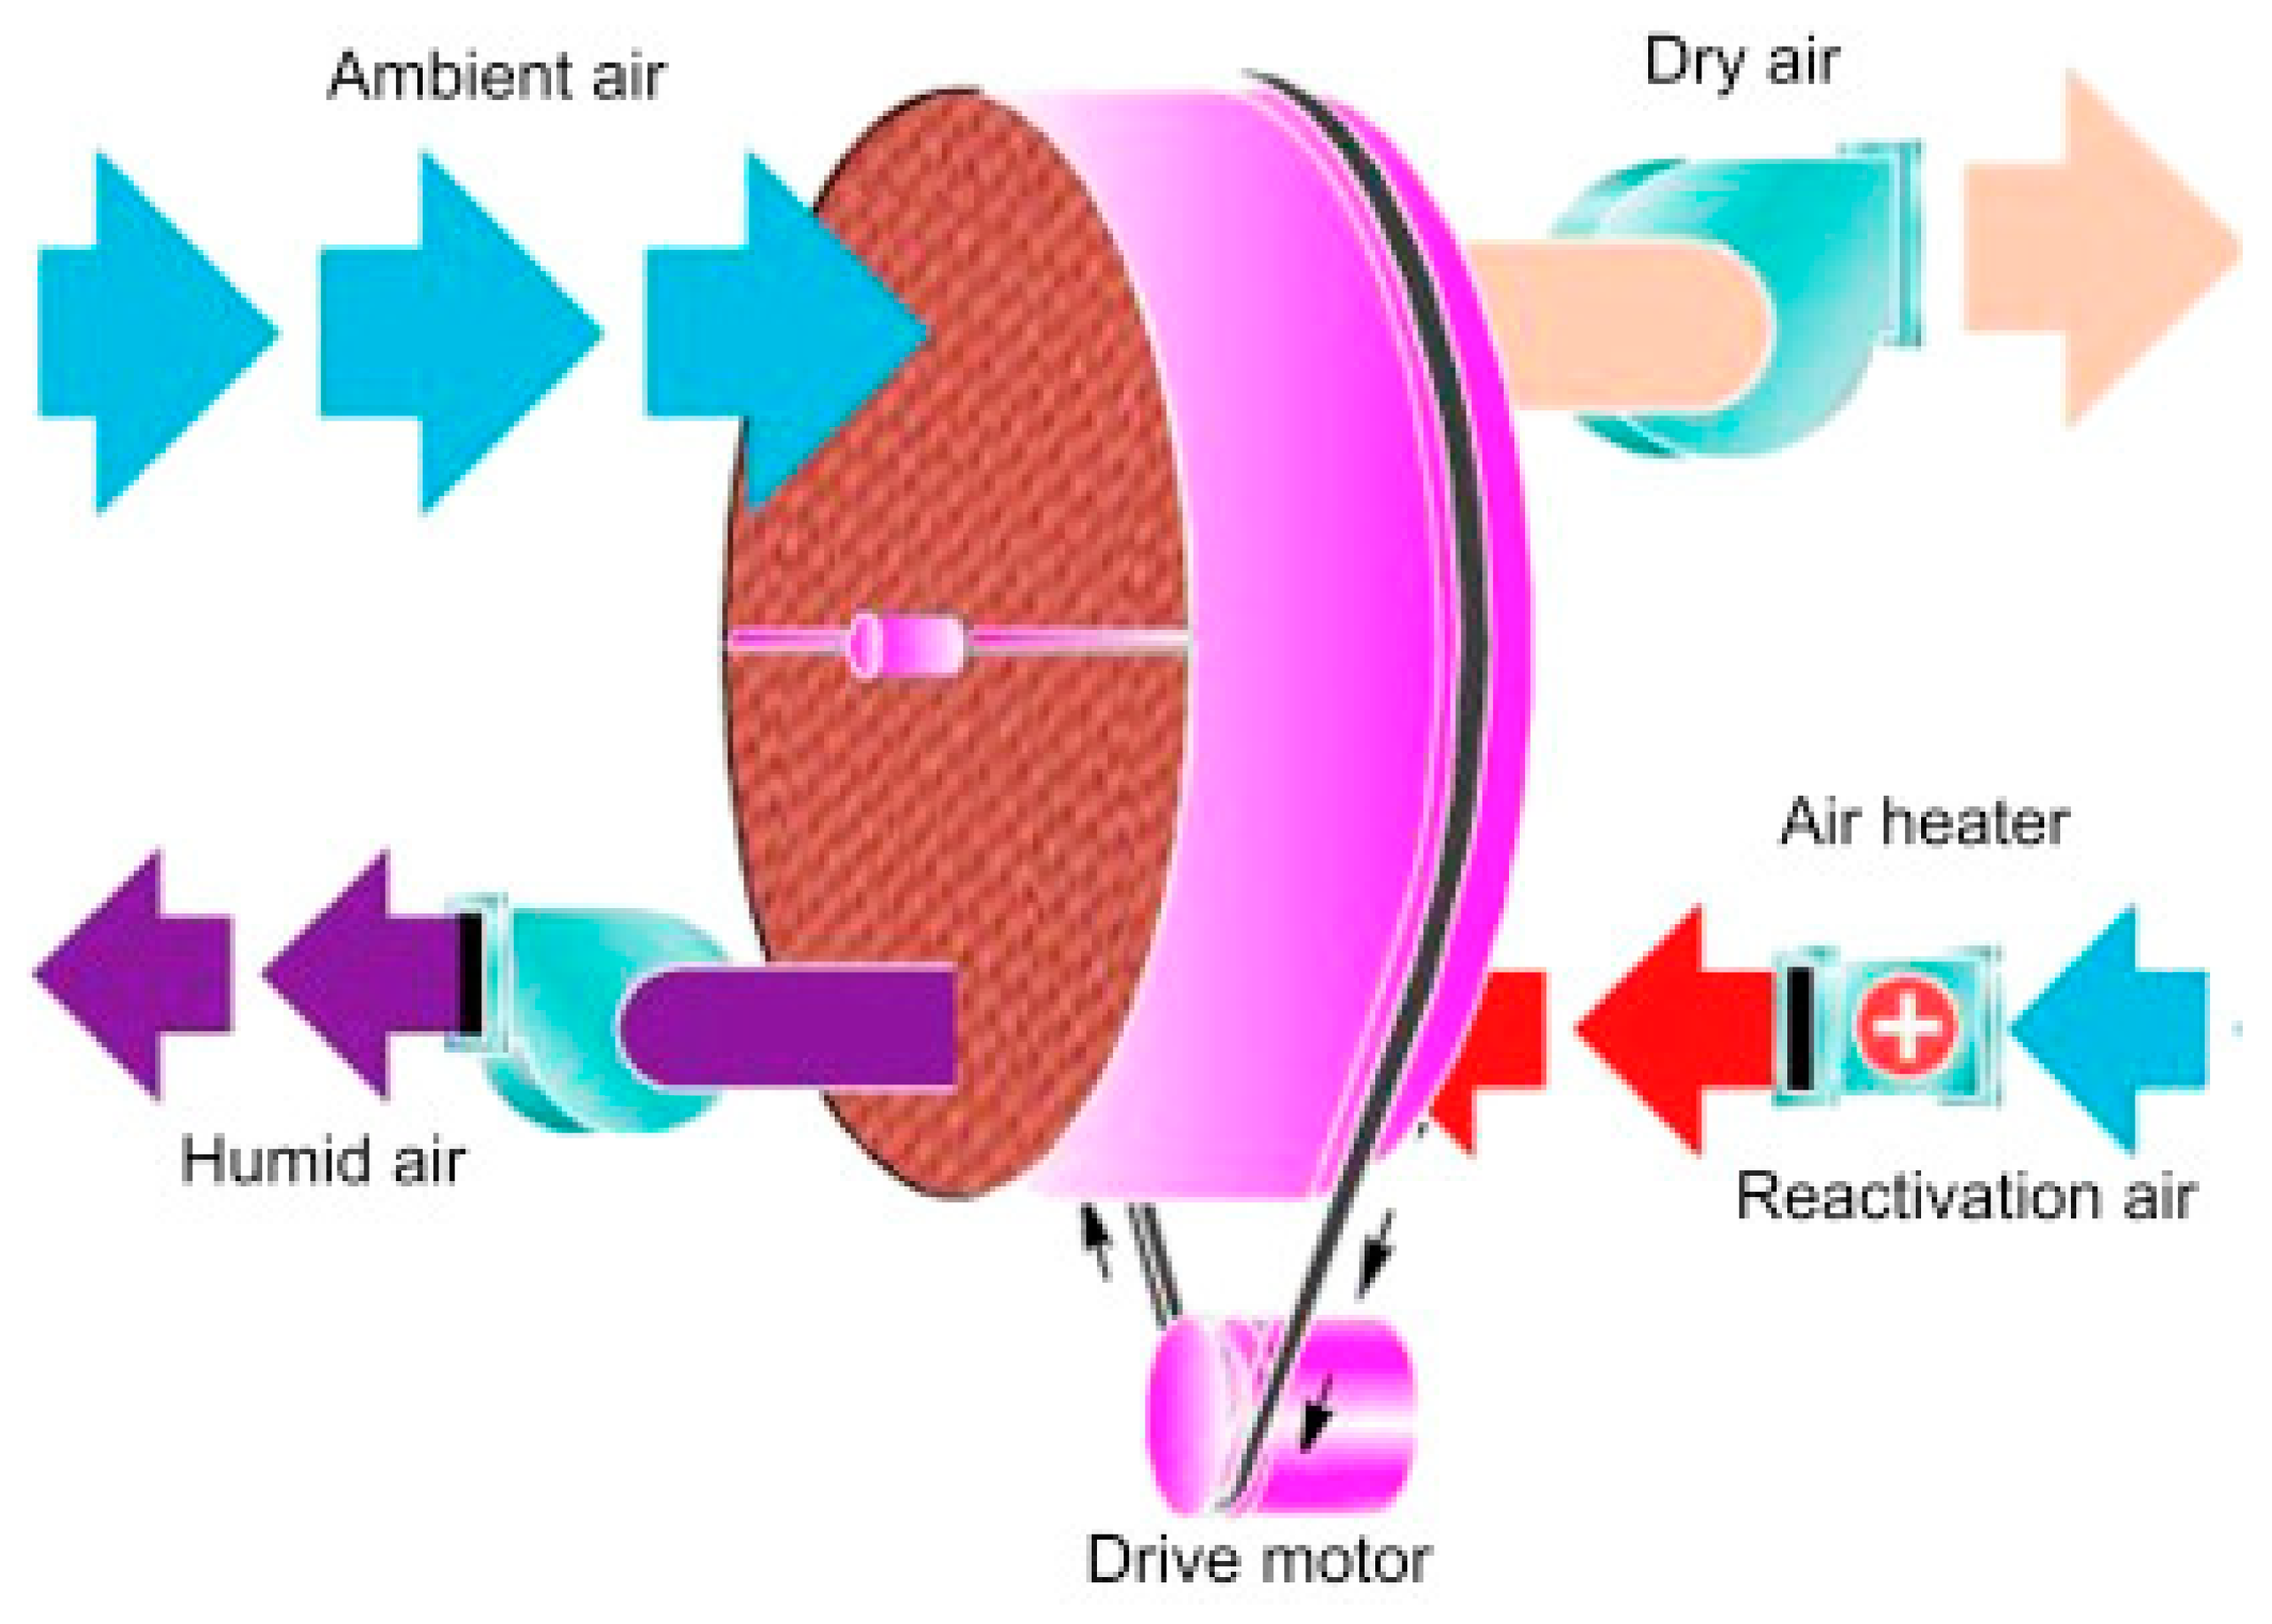
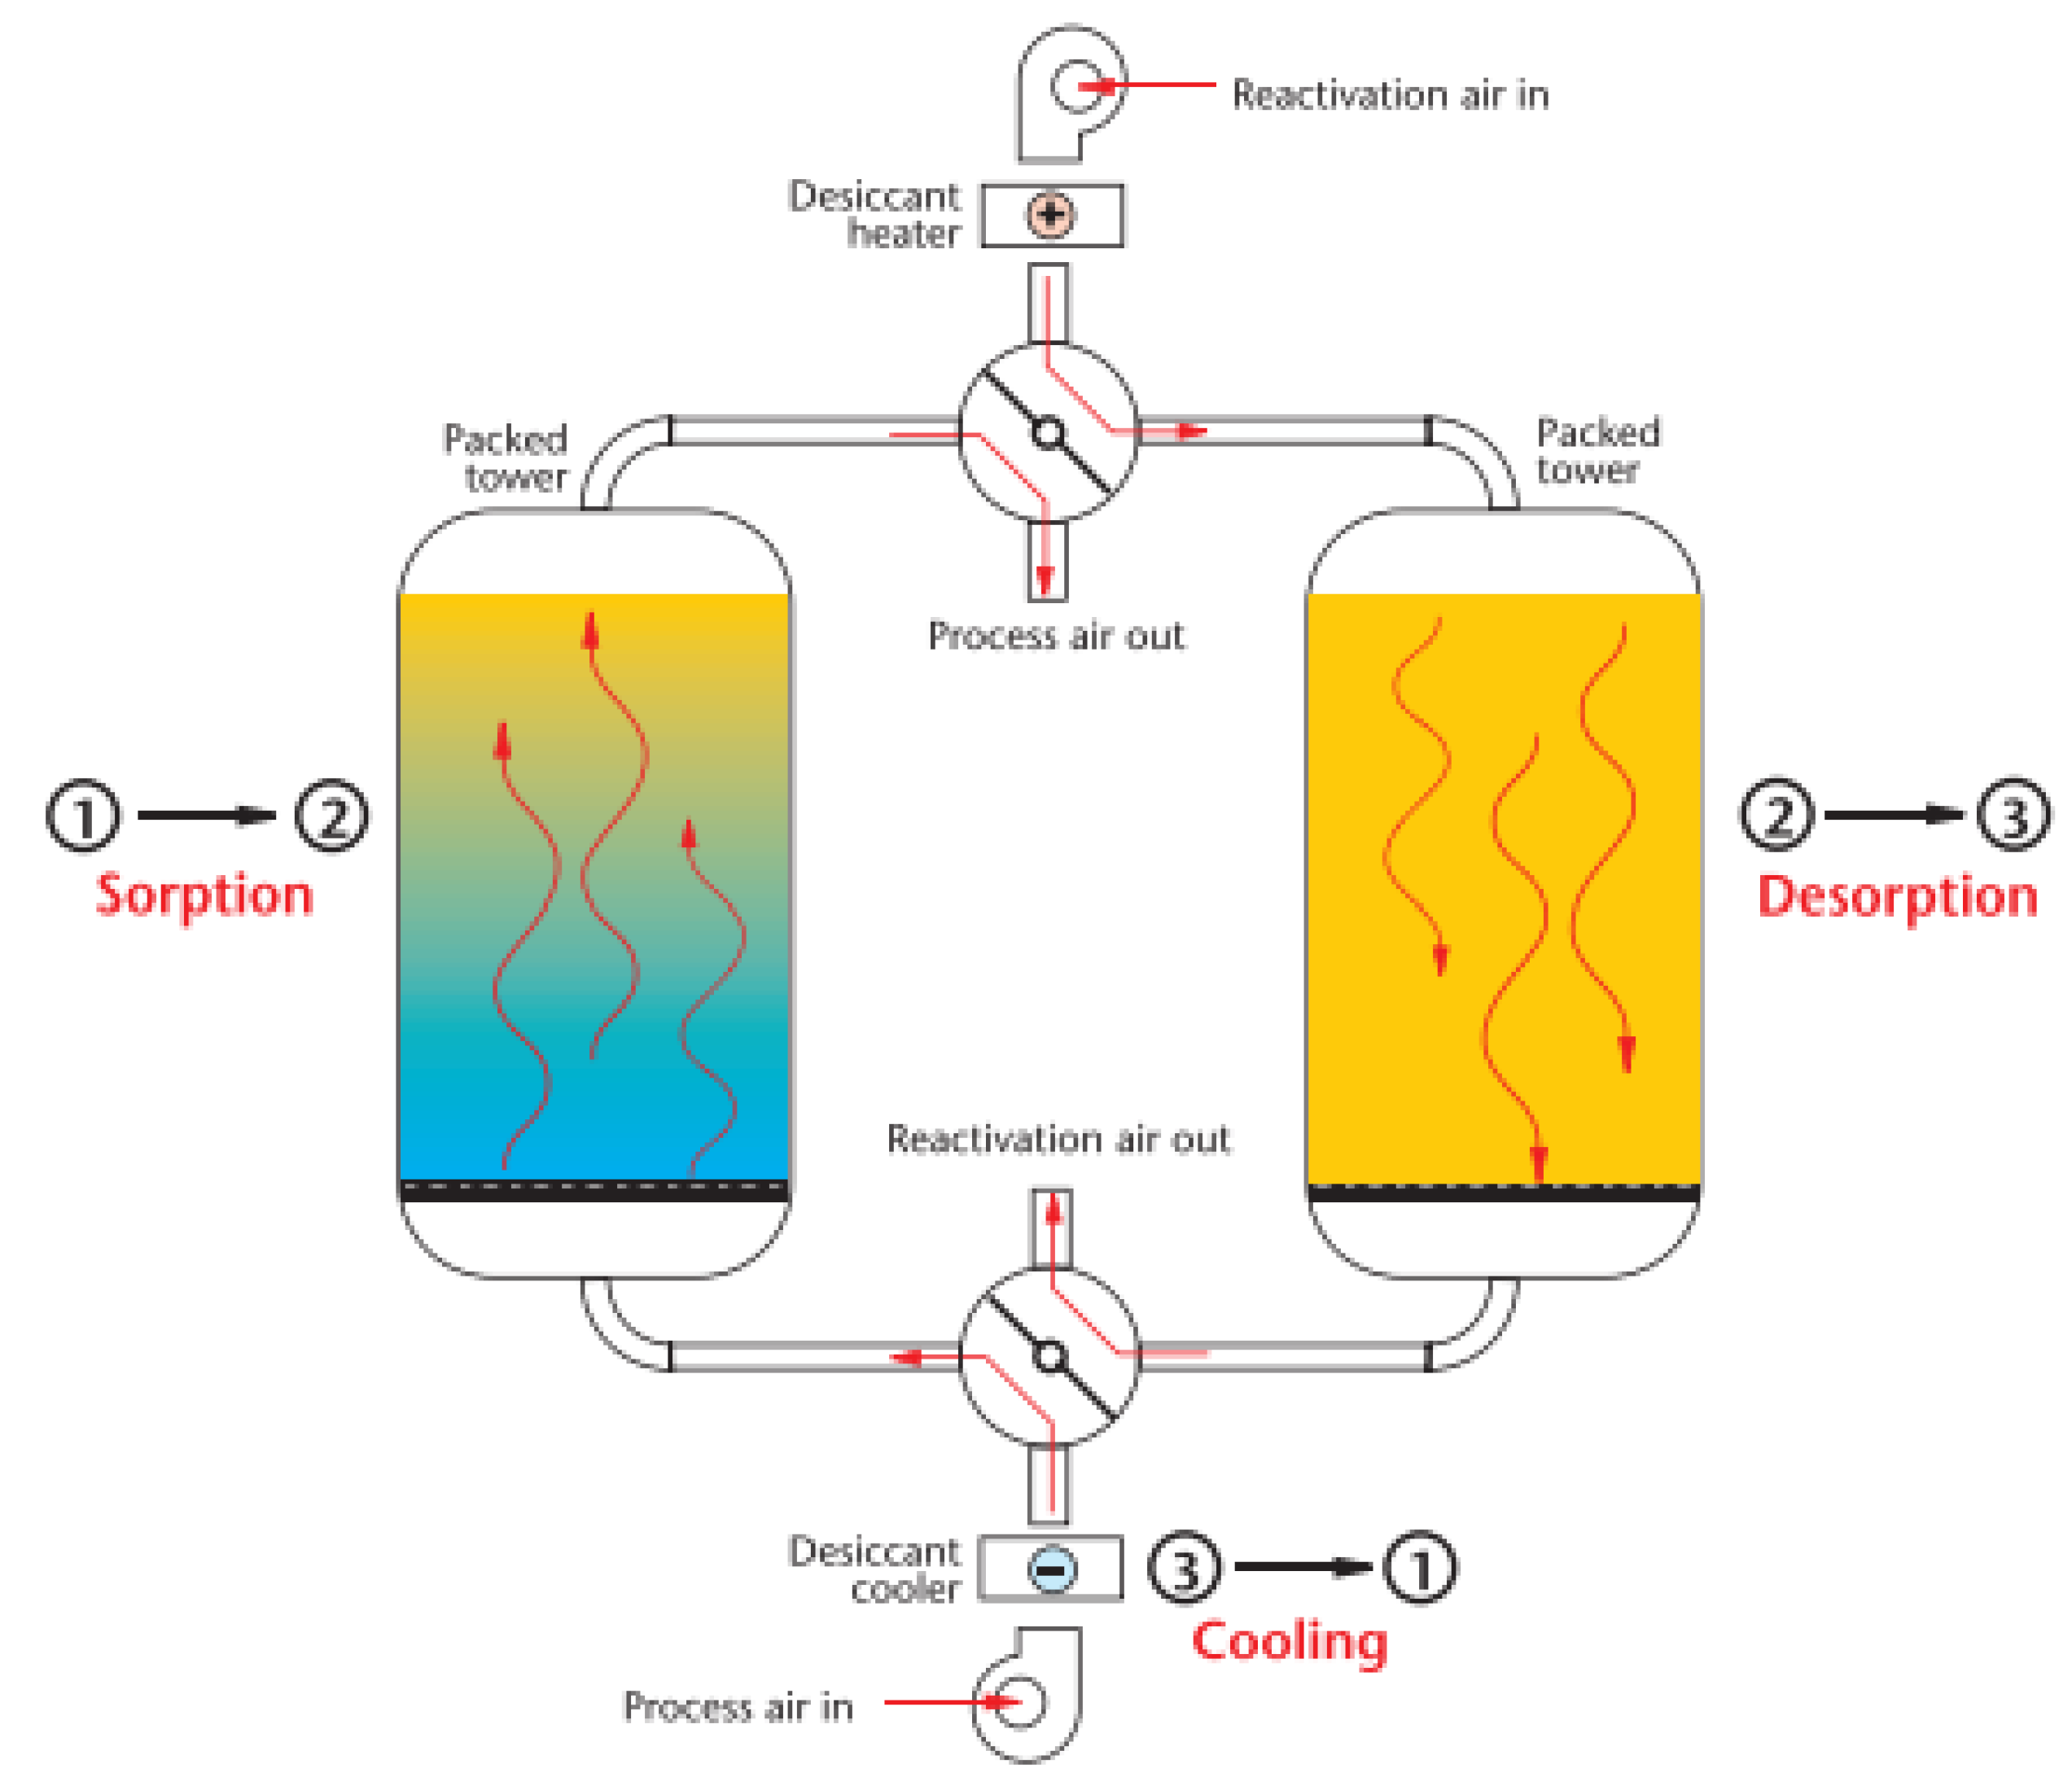
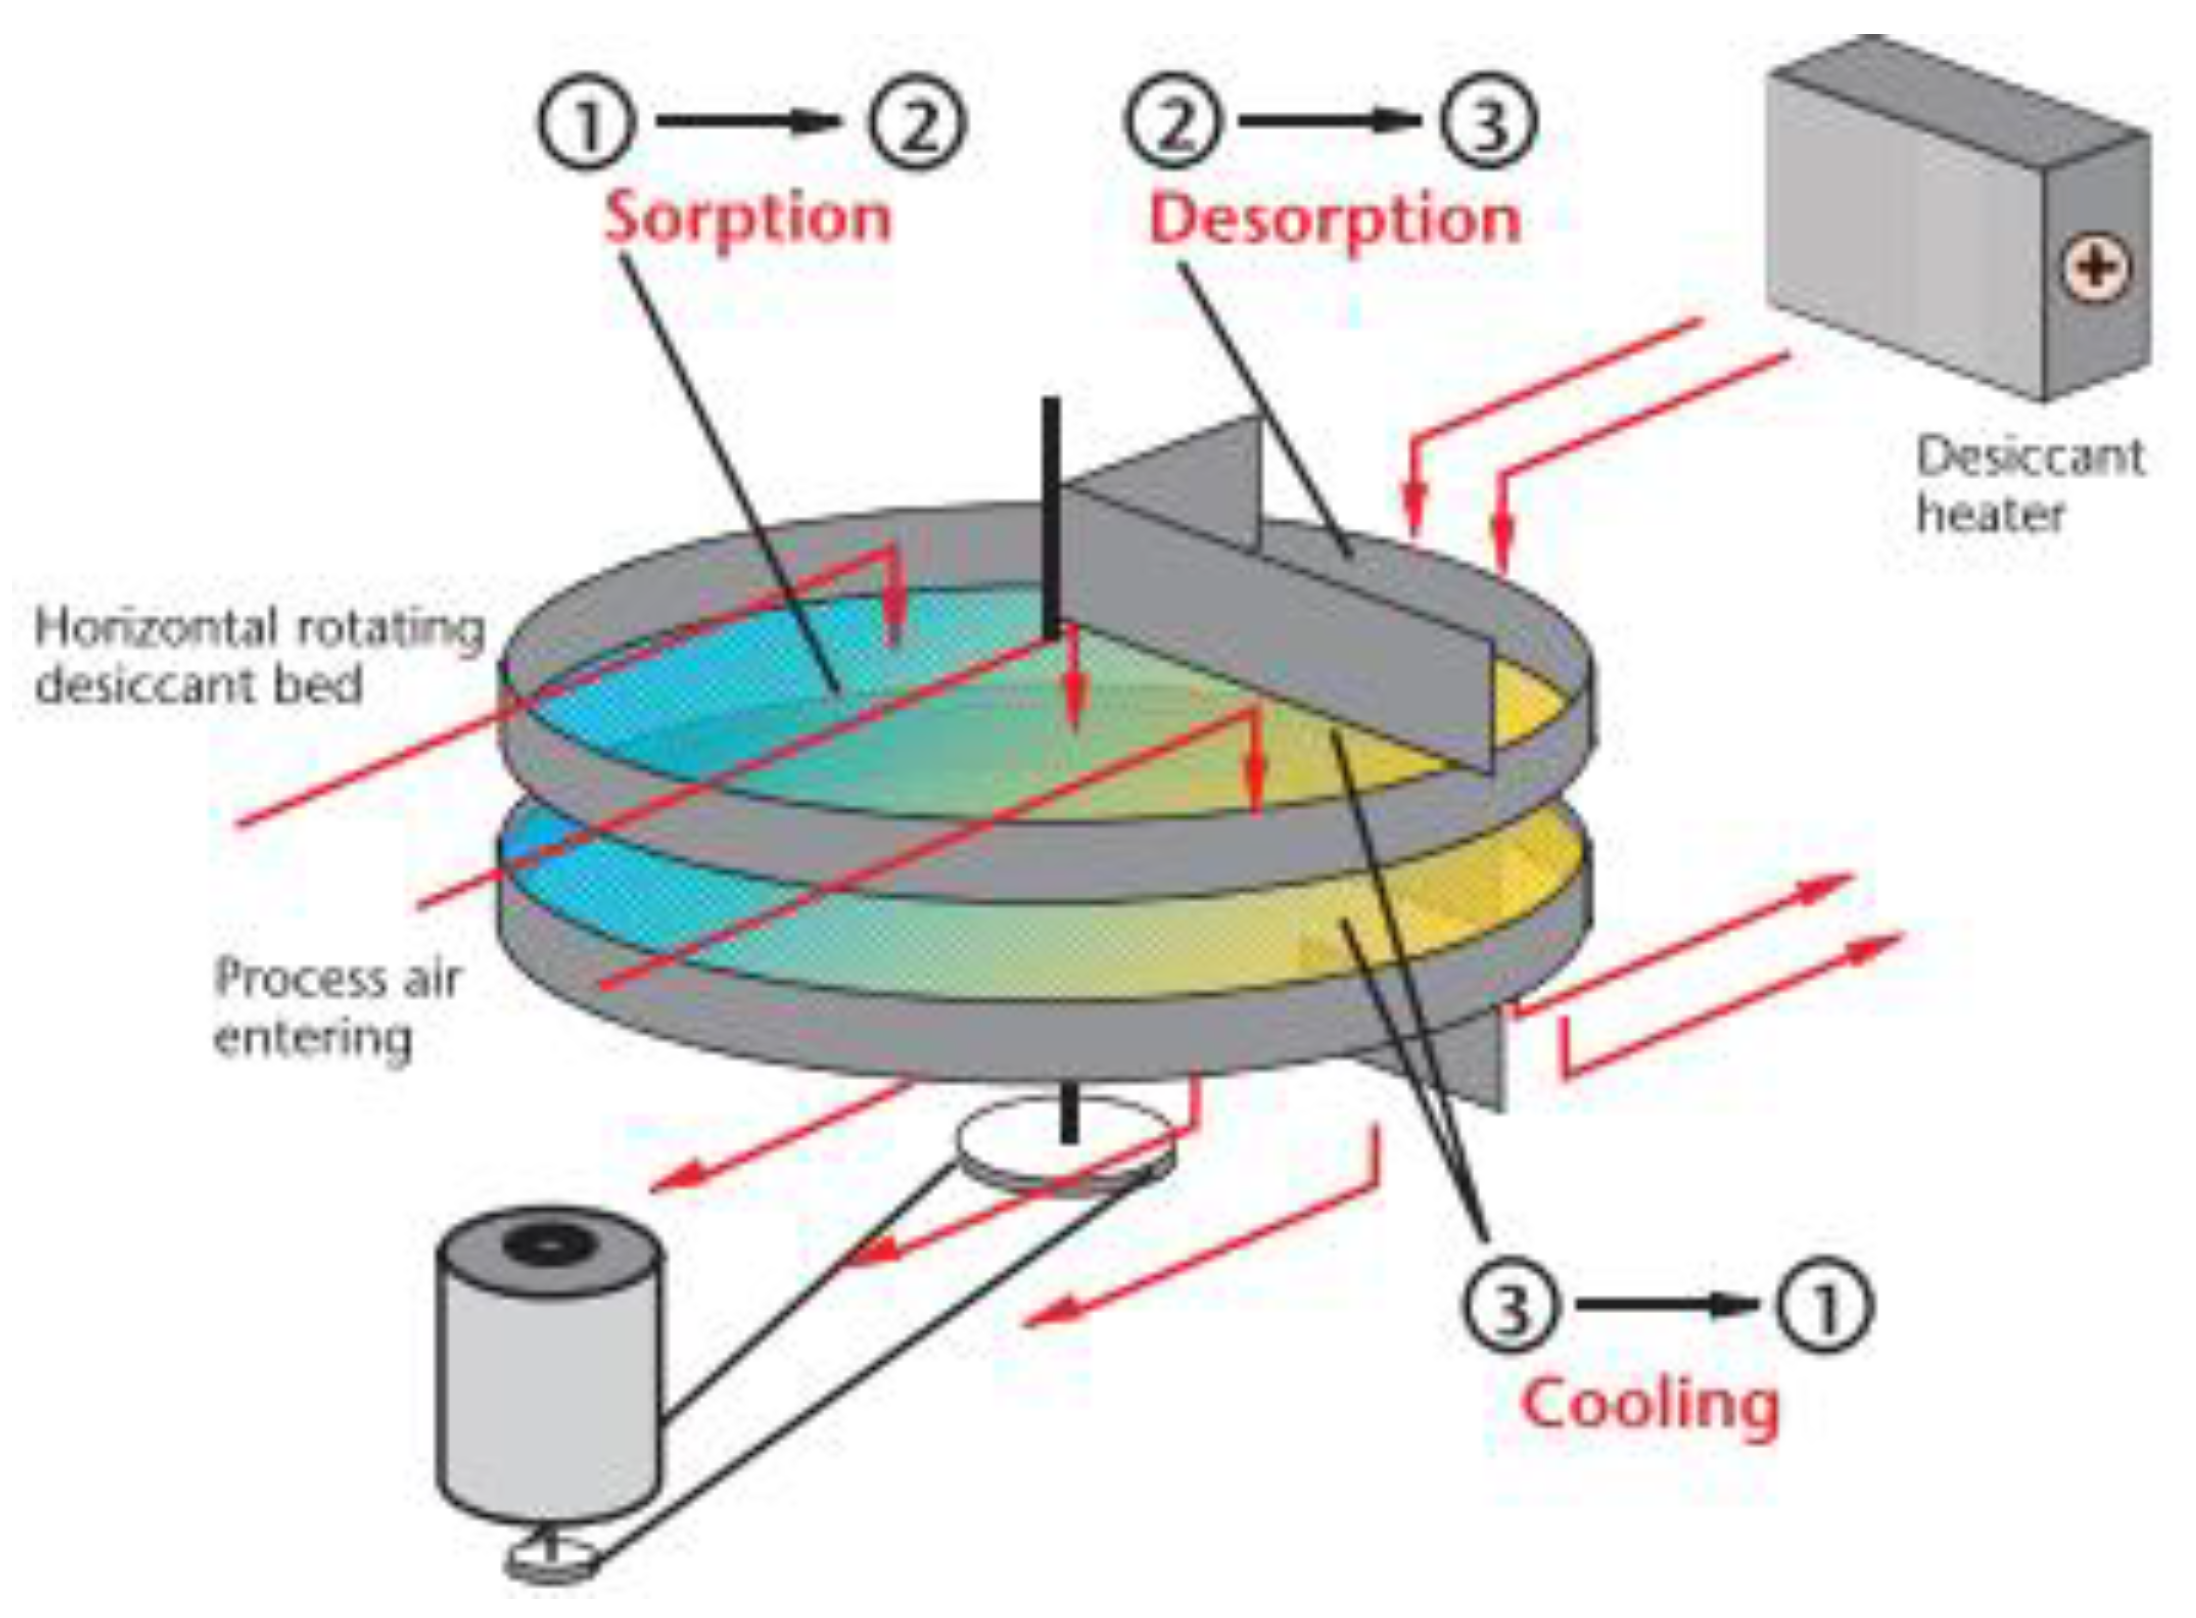
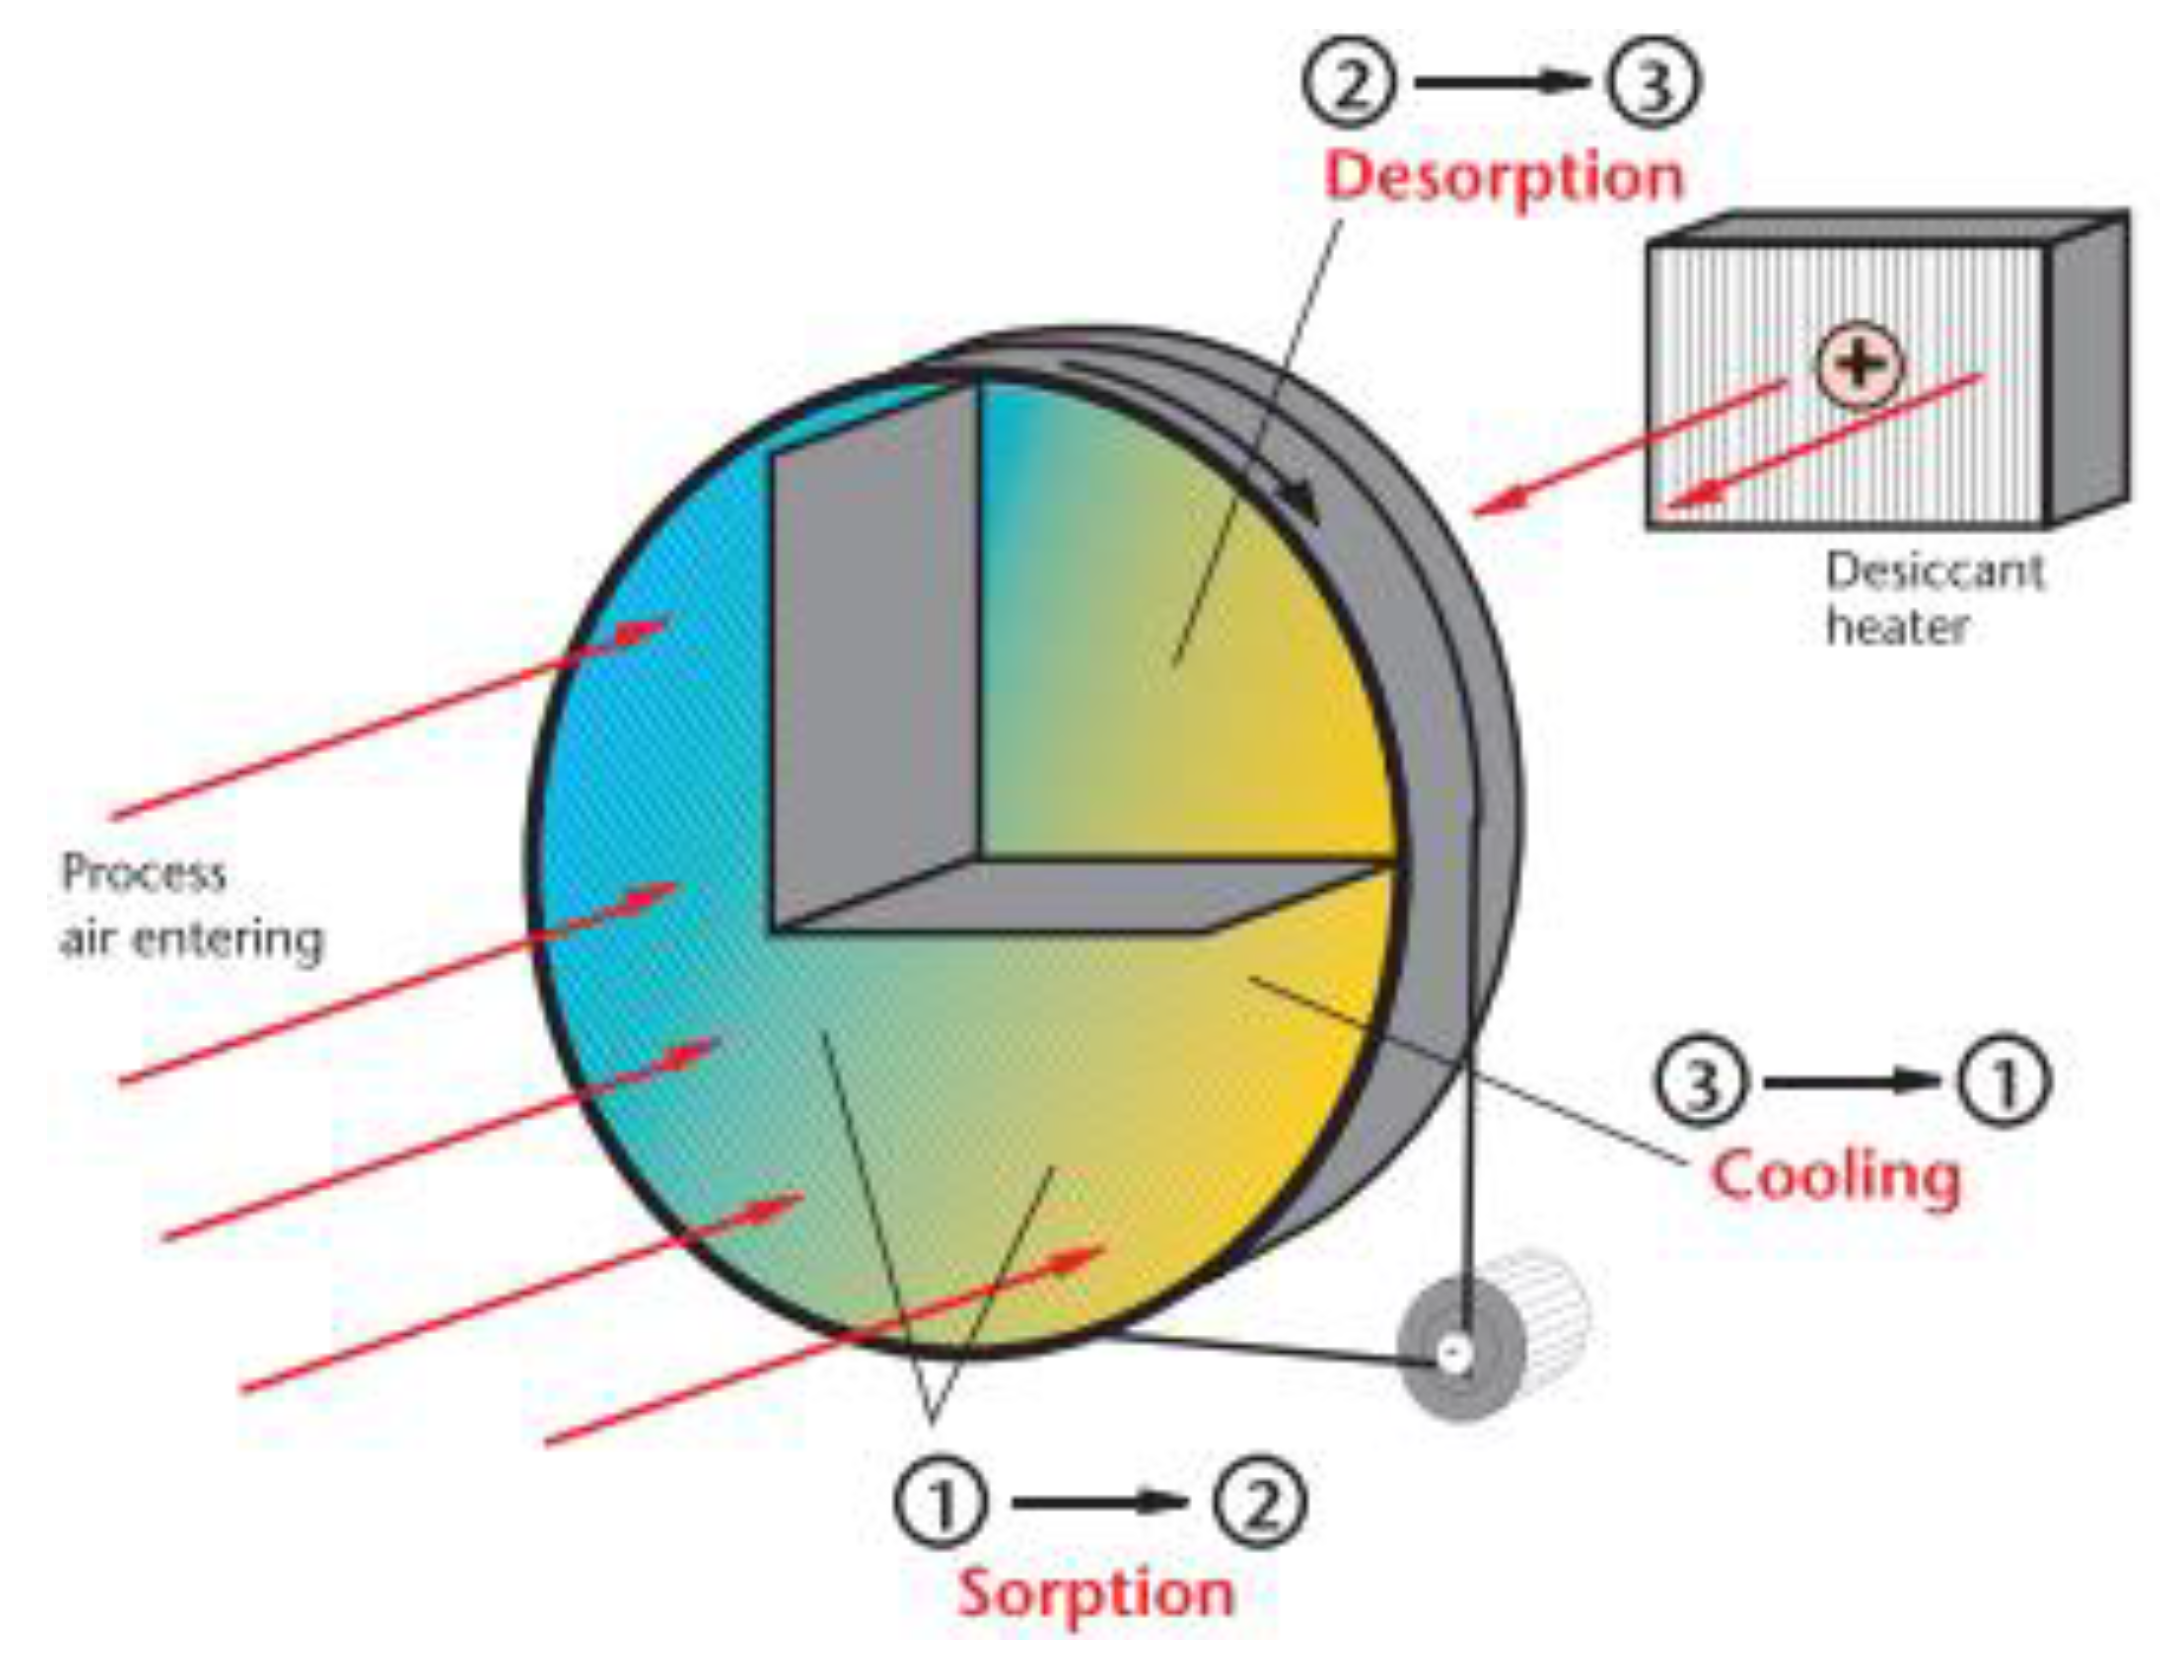
It is worth noting that a desiccant dehumidification system has a coating applied for airflow dehumidification. As the wheel turns, the desiccant alternately passes through the incoming air (where humidity is adsorbed) and through a regeneration zone (where the desiccant is dried and humidity is expelled). The wheel continues to rotate, and the adsorption process is repeated. Several variables can affect desiccant performance; these include the inlet dry bulb temperature, absolute inlet humidity, and speed of the desiccant face, among others. Hence, selecting desiccant wheels is fundamental depending on the project to be developed. Thus, several examples of desiccant wheel selection software were investigated to list and present the main characteristics of each one. It was observed that the multiple programs studied did not offer a detailed analysis of the annual operation and usually only showed the output data. Therefore, the selection software could be improved by incorporating a database update and considering ASHRAE weather data viewer to cover more locations, especially in Brazil.
For future studies, it is suggested to develop software focused on measuring energy and economic benefits when using the technology of desiccant/enthalpic wheels in the recovery of energy from the renewal air and that contemplates improvements concerning the software researched in this work. In addition, other examples of commercial software for desiccant wheel modeling can be assessed.

Author Contributions

Conceptualization, Y.C.S. and D.B.; methodology, Y.C.S.; software, B.G.N. and G.S.F.; validation, Y.C.S., A.F.S. and S.M.D.S.; formal analysis, L.A.S.; investigation, Y.C.S. and D.B.; resources, A.F.S.; data curation, S.M.D.S.; writing—original draft preparation, Y.C.S.; writing—review and editing, S.M.D.S. and L.A.S.; visualization, E.N.d.M.; supervision, E.N.d.M.; project administration, D.B.; funding acquisition, A.F.S. All authors have read and agreed to the published version of the manuscript.

Funding

For financial support, the authors acknowledge ELETROBRAS; FAPERJ (Grant: 210.805/2021, 210.061/2020, 211.731/2021, and 200.480/2023); and the National Agency of Petroleum, Natural Gas and Biofuels (PRH-ANP No 51.1).

Data Availability Statement

The data presented in this study are available upon request from the corresponding author. The data are not publicly available due to project privacy.

Conflicts of Interest

The authors declare no conflict of interest.

References

  1. Gül, H. Sick Building Syndrome from the Perspective of Occupational and Public Health. In Sick Building Syndrome: In Public Buildings and Workplaces; Abdul-Wahab, S.A., Ed.; Springer: Berlin/Heidelberg, Germany, 2011; pp. 89–104. ISBN 978-3-642-17919-8. [Google Scholar]
  2. Wang, X. Analysis on the Influence of Indoor Air Pollution on Human Health and Prevention Measures. IOP Conf. Ser. Earth Environ. Sci. 2019, 300, 032059. [Google Scholar] [CrossRef]
  3. World Health Organization. WHO Global Air Quality Guidelines; World Health Organization: Geneva, Switzerland, 2021.
  4. Suárez Useche, M.A.; Castillo Santiago, Y.; Restrepo, J.B.; Albis Arrieta, A.R.; Agámez Salgado, K.P. Evaluation of the Zinc Sulfate Catalytic Effect in Empty Fruit Bunches Pyrolysis. Processes 2022, 10, 1748. [Google Scholar] [CrossRef]
  5. Valencia Ochoa, G.; Castillo Santiago, Y.; Duarte Forero, J.; Restrepo, J.B.; Albis Arrieta, A.R. A Comprehensive Comparative Analysis of Energetic and Exergetic Performance of Different Solar-Based Organic Rankine Cycles. Energies 2023, 16, 2724. [Google Scholar] [CrossRef]
  6. Castillo Santiago, Y.; Henao, N.C.; Venturini, O.J.; Sphaier, L.A.; Duarte, S.V.; de Rezende, T.T.; Ochoa, G.V. Techno-Economic Assessment of Producer Gas from Heavy Oil and Biomass Co-Gasification Aiming Electricity Generation in Rankine Cycle. Processes 2022, 10, 2358. [Google Scholar] [CrossRef]
  7. Graf, R. Oil and Sovereignty Petro-Knowledge and Energy Policy in the United States and Western Europe in the 1970s, 1st ed.; Graf, R., Ed.; Berghahn Books: New York, NY, USA, 2018; ISBN 9781785338069. [Google Scholar]
  8. Mensah-Attipoe, J.; Toyinbo, O. Fungal Growth and Aerosolization from Various Conditions and Materials. In Fungal Infection; de Loreto, É.S., Tondolo, J.S.M., Eds.; IntechOpen: Rijeka, Croatia, 2019; pp. 1–13. ISBN 978-1-83880-469-5. [Google Scholar]
  9. Norbäck, D.; Zock, J.-P.; Plana, E.; Heinrich, J.; Svanes, C.; Sunyer, J.; Künzli, N.; Villani, S.; Olivieri, M.; Soon, A.; et al. Mould and Dampness in Dwelling Places, and Onset of Asthma: The Population-Based Cohort ECRHS. Occup. Environ. Med. 2013, 70, 325–331. [Google Scholar] [CrossRef] [Green Version]
  10. Wolkoff, P. Indoor Air Humidity, Air Quality, and Health—An Overview. Int. J. Hyg. Environ. Health 2018, 221, 376–390. [Google Scholar] [CrossRef]
  11. Makul, N.; Fediuk, R.; Szelag, M. Advanced Interactions of Cement-Based Materials with Microorganisms: A Review and Future Perspective. J. Build. Eng. 2022, 45, 103458. [Google Scholar] [CrossRef]
  12. Guerra, F.L.; Lopes, W.; Cazarolli, J.C.; Lobato, M.; Masuero, A.B.; Dal Molin, D.C.C.; Bento, F.M.; Schrank, A.; Vainstein, M.H. Biodeterioration of Mortar Coating in Historical Buildings: Microclimatic Characterization, Material, and Fungal Community. Build. Environ. 2019, 155, 195–209. [Google Scholar] [CrossRef]
  13. Sterling, E.M.; Arundel, A.; Sterling, T.D. Criteria for Human Exposure to Humidity in Occupied Buildings. ASHRAE Trans. 1985, 91, 611–622. [Google Scholar]
  14. Israeli, E.; Pardo, A. The Sick Building Syndrome as a Part of the Autoimmune (Auto-Inflammatory) Syndrome Induced by Adjuvants. Mod. Rheumatol. 2011, 21, 235–239. [Google Scholar] [CrossRef] [PubMed]
  15. Brasche, S. Why Do Women Suffer from Sick Building Syndrome More Often than Men?—Subjective Higher Sensitivity versus Objective Causes. Indoor Air 2001, 11, 217–222. [Google Scholar] [CrossRef] [Green Version]
  16. AERIS Brasil: Legionella e o Ar Condicionado. Available online: https://www.aerisrs.com.br/legionella-no-brasil-e-o-ar-condicionado (accessed on 29 September 2022).
  17. BRASIL. Ministério da Saúde, Gabinete do Ministro. PORTARIA Nº 3.523, DE 28 DE AGOSTO DE 1998. Available online: https://bvsms.saude.gov.br/bvs/saudelegis/gm/1998/prt3523_28_08_1998.html (accessed on 30 September 2022).
  18. BRASIL. RESOLUÇÃO-RE No 9, de 16 de JANEIRO de 2003. Revisa e atualiza a RE/ANVISAno 176, de 24 de Outubro de 2000, sobre Padrões Referenciais de Qualidade do Ar Interior em Ambientes Climatizados Artificialmente de Uso Público e Coletivo. Available online: https://bvsms.saude.gov.br/bvs/saudelegis/anvisa/2003/rdc0009_16_01_2003.html (accessed on 30 September 2022).
  19. ABNT. NBR 16401-3-2008—Sistemas Centrais e Unitários, parte 3: Qualidade do ar interior. Assoc. Bras. Normas Técnicas 2008, 24. Available online: http://www.caramuru.com.br/pdf/NBR_16401-3_2008%20(1).pdf (accessed on 30 September 2022).
  20. BRASIL. Presidência da República, Secretaria-Geral, Subchefia para Assuntos Jurídicos, LEI Nº 13.589, DE 4 DE JANEIRO DE 2018. Available online: https://www.planalto.gov.br/ccivil_03/_ato2015-2018/2018/lei/l13589.htm (accessed on 30 September 2022).
  21. Che, W.W.; Tso, C.Y.; Sun, L.; Ip, D.Y.K.; Lee, H.; Chao, C.Y.H.; Lau, A.K.H. Energy Consumption, Indoor Thermal Comfort and Air Quality in a Commercial Office with Retrofitted Heat, Ventilation and Air Conditioning (HVAC) System. Energy Build. 2019, 201, 202–215. [Google Scholar] [CrossRef]
  22. ABRAVA. Revista ABRAVA Climatização e Refrigeração—edição Dezembro de 2021. Available online: https://abrava.com.br/revista-abrava-refrigeracao-climatizacao-edicao-dezembro-2021-disponivel-para-download/ (accessed on 30 September 2022).
  23. Pargeter, S. Reducing Building HVAC Costs with Site-Recovery Energy. Facil. Manag. 2012, 28, 24–28. [Google Scholar]
  24. Sphaier, L.A.; Nóbrega, C.E.L. Parametric Analysis of Components Effectiveness on Desiccant Cooling System Performance. Energy 2012, 38, 157–166. [Google Scholar] [CrossRef]
  25. Sphaier, L.A.; Nóbrega, C.E.L. Desiccant Cooling Cycle Tuning for Variable Environmental Conditions. Heat Transf. Eng. 2014, 35, 1035–1042. [Google Scholar] [CrossRef]
  26. Nóbrega, C.E.L.; Sphaier, L.A. Desiccant-Assisted Humidity Control for Air Refrigeration Cycles. Int. J. Refrig. 2013, 36, 1183–1190. [Google Scholar] [CrossRef]
  27. Nóbrega, C.E.L.; Sphaier, L.A. Modeling and Simulation of a Desiccant–Brayton Cascade Refrigeration Cycle. Energy Build. 2012, 55, 575–584. [Google Scholar] [CrossRef]
  28. International Energy Agency (IEA). The Future of Cooling Opportunities for Energy-Efficient Air Conditioning; International Energy Agency (IEA): Paris, France, 2018.
  29. ABRAVA. Boletim Econômico ABRAVA; ABRAVA: São Paulo, Brazil, 2022. [Google Scholar]
  30. Yang, Y.; Javanroodi, K.; Nik, V.M. Climate Change and Energy Performance of European Residential Building Stocks—A Comprehensive Impact Assessment Using Climate Big Data from the Coordinated Regional Climate Downscaling Experiment. Appl. Energy 2021, 298, 117246. [Google Scholar] [CrossRef]
  31. Shui, B.; Evans, M.; Somasundaram, S. Country Report on Building Energy Codes in Australia; U.S. Department of Energy: Oak Ridge, TN, USA, 2009.
  32. Huang, J.; Deringer, J. Status of Energy Efficient Building Codes in Asia; Asia Business Council: Hong Kong, China, 2007. [Google Scholar]
  33. Werner, H. Energy Conservation Ordinance. Thermal Protection and Energy Economy in Buildings. Comments on DIN 4108-6; Energiesparverordnung. Waermeschutz und Energieeinsparung in Gebaeuden. Kommentar zu DIN V 4108-6; Beuth: Berlin, Germany, 2001. [Google Scholar]
  34. Bureau of Energy Efficiency. Energy Conservation Building Code; Bureau of Energy Efficiency: New Delhi, India, 2017.
  35. Evans, M.; Shui, B.; Takagi, T. Country Report on Building Energy Codes in Japan; U.S. Department of Energy: Oak Ridge, TN, USA, 2009.
  36. Youssef, A. Climate Zone Map (Czm) Tool for Building Energy Code Compliance in Saudi Arabia; ASHRAE: Orlando, FL, USA, 2016. [Google Scholar]
  37. BRE. SAP 2012 The Government’s Standard Assessment Procedure for Energy Rating of Dwellings; BRE: Hertfordshire, UK, 2014. [Google Scholar]
  38. ASHRAE. Standard 90.1-2019—Energy Standard for Buildings Except Low-Rise Residential Buildings; ASHRAE: Ann Arbor, MI, USA, 2019. [Google Scholar]
  39. Roriz, M.; Ghisi, E.; Lamberts, R. Bioclimatic Zoning of Brazil: A Proposal Based on the Givoni and Mahoney Methods. In Proceedings of the PLEA’99 Conference, Brisbane, Australia, 22–24 September 1999; University of Queensland: Brisbane, Australia, 1999; pp. 4–9. [Google Scholar]
  40. Walsh, A.; Cóstola, D.; Labaki, L.C. Review of Methods for Climatic Zoning for Building Energy Efficiency Programs. Build. Environ. 2017, 112, 337–350. [Google Scholar] [CrossRef] [Green Version]
  41. Walsh, A.; Cóstola, D.; Labaki, L.C. Performance-Based Validation of Climatic Zoning for Building Energy Efficiency Applications. Appl. Energy 2018, 212, 416–427. [Google Scholar] [CrossRef] [Green Version]
  42. Cao, X.; Dai, X.; Liu, J. Building Energy-Consumption Status Worldwide and the State-of-the-Art Technologies for Zero-Energy Buildings during the Past Decade. Energy Build. 2016, 128, 198–213. [Google Scholar] [CrossRef]
  43. Office of Energy Efficiency and Renewable Energy Status of State Energy Code Adoption. Available online: https://www.energycodes.gov/status (accessed on 23 September 2022).
  44. International Code Council. 2021 International Energy Conservation Code (IECC); International Code Council: Washington, DC, USA, 2021. [Google Scholar]
  45. Agence Nationale des Energies Renouvelables. Zonage Climatique Pour La Tunisie; Agence Nationale des Energies Renouvelables: Montplaisir, Tunis, 2004. [Google Scholar]
  46. Associação Brasileira de Normas Técnicas. ABNT NBR 15575-2: Edificações Habitacionais—Desempenho; Associação Brasileira de Normas Técnicas: Rio de Janeiro, Brazil, 2013. [Google Scholar]
  47. Fabbri, K. Energy Incidence of Historic Building: Leaving No Stone Unturned. J. Cult. Herit. 2013, 14, e25–e27. [Google Scholar] [CrossRef]
  48. Martínez-Molina, A.; Tort-Ausina, I.; Cho, S.; Vivancos, J.-L. Energy Efficiency and Thermal Comfort in Historic Buildings: A Review. Renew. Sustain. Energy Rev. 2016, 61, 70–85. [Google Scholar] [CrossRef]
  49. Xu, J.; Akhtar, M.; Haris, M.; Muhammad, S.; Abban, O.J.; Taghizadeh-Hesary, F. Energy Crisis, Firm Profitability, and Productivity: An Emerging Economy Perspective. Energy Strategy Rev. 2022, 41, 100849. [Google Scholar] [CrossRef]
  50. EPE—Empresa de Pesquisa Energética. Atlas of Energy Efficiency Brazil 2019; EPE—Empresa de Pesquisa Energética: Brasília, Brazil, 2019. [Google Scholar]
  51. INMETRO Programa Brasileiro de Etiquetagem. Available online: https://www.gov.br/inmetro/pt-br/assuntos/avaliacao-da-conformidade/programa-brasileiro-de-etiquetagem/conheca-o-programa (accessed on 2 September 2022).
  52. Ministério de Minas e Energia. Uso De Ar Condicionado No Setor Residencial Brasileiro: Perspectivas E Contribuições Para O Avanço Em Eficiência Energética; Ministério de Minas e Energia: Rio de Janeiro, Brazil, 2018. [Google Scholar]
  53. Dos Santos, E.R.; Salgado, M.S. BIM Na Verificação de Requisitos Do Procel Edifica. Ii Simpósio Bras. Tecnol. Inf. Comun. Na Construção 2019, 2, 1–8. [Google Scholar] [CrossRef]
  54. da Luz, N.D.G. Etiquetagem Em Edificações: Análise De Eficiência Energética De Uma Residência Unifamiliar De Toledo/PR; Universidade Tecnológica Federal do Paraná: Curitiba, Brazil, 2021. [Google Scholar]
  55. Nascimento, R.L. Política De Eficiência Energética No Brasil; MME: Brasília, Brazil, 2015. [Google Scholar]
  56. Kavanaugh, S. Probing the Effectiveness of ANSI/ASHRAE/IES Standard 90.1. Engineered Systems. 2020. Available online: https://www.esmagazine.com/articles/100699-probing-the-effectiveness-of-ansi-asrae-ies-standard-901 (accessed on 30 September 2022).
  57. Munters Munters’ Desiccant Rotor—Industrial Dehumidification at Its Best. Available online: https://www.munters.com/en/about-us/history-of-munters/history-news2/munters-desiccant-rotor--industrial-dehumidification-at-its-best/ (accessed on 11 July 2022).
  58. Kent, R. Services. In Energy Management in Plastics Processing; Kent, R., Ed.; Elsevier: Oxford, UK, 2018; pp. 105–210. ISBN 978-0-08-102507-9. [Google Scholar]
  59. Narayanan, R. Heat-Driven Cooling Technologies. In Clean Energy for Sustainable Development; Rasul, M.G., Azad, A.K., Sharma, S., Eds.; Academic Press: Oxford, UK, 2017; pp. 191–212. ISBN 978-0-12-805423-9. [Google Scholar]
  60. Rambhad, K.S.; Walke, P.V.; Tidke, D.J. Solid Desiccant Dehumidification and Regeneration Methods—A Review. Renew. Sustain. Energy Rev. 2016, 59, 73–83. [Google Scholar] [CrossRef]
  61. Guan, B.; Liu, X.; Zhang, T. Investigation of a Compact Hybrid Liquid-Desiccant Air-Conditioning System for Return Air Dehumidification. Build. Environ. 2021, 187, 107420. [Google Scholar] [CrossRef]
  62. ASHRAE. 2019 ASHRAE Handbook_HVAC Applications CH35.Pdf; ASHRAE: Orlando, FL, USA, 2019; ISBN 9781947192133. [Google Scholar]
  63. Kojok, F.; Fardoun, F.; Younes, R.; Outbib, R. Hybrid Cooling Systems: A Review and an Optimized Selection Scheme. Renew. Sustain. Energy Rev. 2016, 65, 57–80. [Google Scholar] [CrossRef]
  64. Munters. Dehumidificaion Handbook, 3rd ed.; Munters Corporation, Ed.; Munters Corporation Marketing Department: Amesbury, MA, USA, 2019; ISBN 2013206534. [Google Scholar]
  65. Ling-Chin, J.; Bao, H.; Ma, Z.; Roskilly, W.T. State-of-the-Art Technologies on Low-Grade Heat Recovery and Utilization in Industry. In Energy Conversion—Current Technologies and Future Trends; Al-Bahadly, I.H., Ed.; IntechOpen: Rijeka, Italy, 2018; pp. 55–74. ISBN 978-1-78984-905-9. [Google Scholar]
  66. Mujumdar, A.S.; Huang, L.-X.; Chen, X.D. An Overview of the Recent Advances in Spray-Drying. Dairy Sci. Technol. 2010, 90, 211–224. [Google Scholar] [CrossRef] [Green Version]
  67. Zhang, H.; Pang, B.; Kang, S.; Fu, J.; Tang, P.; Chang, J.; Li, J.; Li, Z.; Deng, S. The Influence of Feedstock Stacking Shape on the Drying Performance of Conveyor Belt Dryer. Heat Mass Transf. 2022, 58, 157–170. [Google Scholar] [CrossRef]
  68. Li, X. Analysis on the Utilization of Temperature and Humidity Independent Control Air-Conditioning System with Different Fresh-Air Handling Methods. Procedia Eng. 2017, 205, 71–78. [Google Scholar] [CrossRef]
  69. Chen, T.; Norford, L. Energy Performance of Next-Generation Dedicated Outdoor Air Cooling Systems in Low-Energy Building Operations. Energy Build. 2020, 209, 109677. [Google Scholar] [CrossRef]
  70. Gado, M.G.; Nasser, M.; Hassan, A.A.; Hassan, H. Adsorption-Based Atmospheric Water Harvesting Powered by Solar Energy: Comprehensive Review on Desiccant Materials and Systems. Process. Saf. Environ. Prot. 2022, 160, 166–183. [Google Scholar] [CrossRef]
  71. Nizovtsev, M.I.; Borodulin, V.Y.; Letushko, V.N. Influence of Condensation on the Efficiency of Regenerative Heat Exchanger for Ventilation. Appl. Therm. Eng. 2017, 111, 997–1007. [Google Scholar] [CrossRef]
  72. Calautit, J.K.; O’Connor, D.; Tien, P.W.; Wei, S.; Pantua, C.A.J.; Hughes, B. Development of a Natural Ventilation Windcatcher with Passive Heat Recovery Wheel for Mild-Cold Climates: CFD and Experimental Analysis. Renew. Energy 2020, 160, 465–482. [Google Scholar] [CrossRef]
  73. Xu, Q.; Riffat, S.; Zhang, S. Review of Heat Recovery Technologies for Building Applications. Energies 2019, 12, 1285. [Google Scholar] [CrossRef] [Green Version]
  74. Men, Y.; Liu, X.; Zhang, T. A Review of Boiler Waste Heat Recovery Technologies in the Medium-Low Temperature Range. Energy 2021, 237, 121560. [Google Scholar] [CrossRef]
  75. Herath, H.M.D.P.; Wickramasinghe, M.D.A.; Polgolla, A.M.C.K.; Jayasena, A.S.; Ranasinghe, R.A.C.P.; Wijewardane, M.A. Applicability of Rotary Thermal Wheels to Hot and Humid Climates. Energy Rep. 2020, 6, 539–544. [Google Scholar] [CrossRef]
  76. Liu, Z.; Li, W.; Chen, Y.; Luo, Y.; Zhang, L. Review of Energy Conservation Technologies for Fresh Air Supply in Zero Energy Buildings. Appl. Therm. Eng. 2019, 148, 544–556. [Google Scholar] [CrossRef]
  77. Jani, D.B.; Mishra, M.; Sahoo, P.K. Solid Desiccant Air Conditioning—A State of the Art Review. Renew. Sustain. Energy Rev. 2016, 60, 1451–1469. [Google Scholar] [CrossRef]
  78. Altomonte, S.; Schiavon, S.; Kent, M.G.; Brager, G. Indoor Environmental Quality and Occupant Satisfaction in Green-Certified Buildings. Build. Res. Inf. 2019, 47, 255–274. [Google Scholar] [CrossRef] [Green Version]
  79. Zender–Świercz, E. A Review of Heat Recovery in Ventilation. Energies 2021, 14, 1759. [Google Scholar] [CrossRef]
  80. Wang, Y.; Wang, L.; Huang, Q.; Cui, Y. Experimental and Theoretical Investigation of Cross-Flow Heat Transfer Equipment for Air Energy High Efficient Utilization. Appl. Therm. Eng. 2016, 98, 1231–1240. [Google Scholar] [CrossRef]
  81. Hye-Cho, J.; Cheon, S.-Y.; Jeong, J.-W. Development of empirical models to predict latent heat exchange performance for hollow fiber membrane-based ventilation system. Appl. Therm. Eng. 2022, 213, 118686. [Google Scholar] [CrossRef]
  82. Silaipillayarputhur, K.; Al-Mughanam, T. Performance of Pure Crossflow Heat Exchanger in Sensible Heat Transfer Application. Energies 2021, 14, 5489. [Google Scholar] [CrossRef]
  83. Nasif, M.S. Air-to-Air Fixed Plate Energy Recovery Heat Exchangers for Building’s HVAC Systems. In Sustainable Thermal Power Resources through Future Engineering; Sulaiman, S.A., Ed.; Springer: Singapore, 2019; pp. 63–71. ISBN 9789811329685. [Google Scholar]
  84. Santos, S.M.D.; Sphaier, L.A. Transient Formulation for Evaluating Convective Coefficients in Regenerative Exchangers with Hygroscopic Channels. Int. Commun. Heat Mass Transf. 2020, 116, 104691. [Google Scholar] [CrossRef]
  85. Sphaier, L.A.; Worek, W.M. Parametric Analysis of Heat and Mass Transfer Regenerators Using a Generalized Effectiveness-NTU Method. Int. J. Heat Mass Transf. 2009, 52, 2265–2272. [Google Scholar] [CrossRef]
  86. Sphaier, L.A.; Worek, W.M. Numerical Solution of Periodic Heat and Mass Transfer with Adsorption in Regenerators: Analysis and Optimization. Numer. Heat Transf. A Appl. 2008, 53, 1133–1155. [Google Scholar] [CrossRef]
  87. Sphaier, L.A.; Worek, W.M. The Effect of Axial Diffusion in Desiccant and Enthalpy Wheels. Int. J. Heat Mass Transf. 2006, 49, 1412–1419. [Google Scholar] [CrossRef]
  88. Dong, C.; Lu, L.; Qi, R. Model development of heat/mass transfer for internally cooled dehumidifier concerning liquid film shrinkage shape and contact angles. Build. Environ. 2017, 114, 11–22. [Google Scholar] [CrossRef]
  89. Sun, Q.; Dong, J.; Zhang, Y.; Tian, L.; Tu, J. Numerical study of the effect of nasopharynx airway obstruction on the transport and deposition of nanoparticles in nasal airways. Exp. Comput. Multiph. Flow 2022, 4, 399–408. [Google Scholar] [CrossRef]
  90. Tian, L.; Ahmadi, G. Computational modeling of fiber transport in human respiratory airways—A review. Exp. Comput. Multiph. Flow 2021, 3, 1–20. [Google Scholar] [CrossRef] [Green Version]
  91. Ma, Y.; Luo, Y.; Xu, H.; Du, R.; Wang, Y. Review on air and water thermal energy storage of buildings with phase change materials. Exp. Comput. Multiph. Flow 2021, 3, 77–99. [Google Scholar] [CrossRef]
Figure 1. Optimal humidity range for minimizing risks to human health. Source: [13].
Processes 11 02031 g001
Figure 2. Energy savings generated by PROCEL from 2008 to 2020. Source: adapted from [55].
Processes 11 02031 g002
Figure 3. The investments made in PROCEL. Source: adapted from [55].
Processes 11 02031 g003
Figure 4. Desiccant wheel [59].
Processes 11 02031 g004
Figure 5. Spray drying tower scheme. Source: [64].
Processes 11 02031 g005
Figure 6. Dual-tower desiccant dryer scheme. Source: [64].
Processes 11 02031 g006
Figure 7. Tray dryer scheme. Source: [64].
Processes 11 02031 g007
Figure 8. Multi-belt dryer scheme. Source: [64].
Processes 11 02031 g008
Figure 9. Desiccant dehumidifier scheme. Source: [64].
Processes 11 02031 g009
Figure 10. Enthalpy wheel [74].
Processes 11 02031 g010
Figure 11. Cross-flow heat exchangers.
Processes 11 02031 g011
Table 1. Symptoms associated with SBS. Source: [14].
SymptomsOccurrence (%)
Lethargy57
Stuffy nose47
Dry throat46
Headache43
Itchy eyes28
Dry eyes27
Runny nose23
Flu23
Breathing difficulty9
Chest pain9
Table 2. Gender-related differences in SBS. Source: [15].
WomenMen
People%People%
With symptoms39344.315126.2
Without symptoms49555.742673.8
Total888100577100
Table 3. Novel Aire software.
Airflow340 m3/h Up to 59,500 m3/h
Diameter of rotors250 mm up to 3050 mm
Main input dataProcess airflow
Table 4. Munters software.
Airflow120 m3/h Up to 170,000 m3/h
Diameter of rotorsN/A
Main input dataProcess airflow
Regeneration airflow
Table 5. Rotor Source software.
Airflow200 m3/h Up to 150,000 m3/h
Diameter of rotors220 mm up to 3300 mm
Main input dataProcess airflow
Regeneration airflow
Table 6. Puresci software.
AirflowN/A
Diameter of rotors350 mm up to 3050 mm
Main input dataProcess airflow
Regeneration airflow
Table 7. Software comparison.
Novel AireMuntersRotor SourcePuresci
Input data
Process inlet dry bulb temperatureXXXX
Absolute humidity entering the processXXXX
Regeneration inlet dry bulb temperatureXXXX
Absolute inlet humidity in regenerationXXXX
Dry bulb temperature after heating in regenerationXXXX
Output data
Output dry bulb temperature in the processXXXX
Output absolute humidity in the processXXXX
Dry bulb temperature after regeneration outputXXXX
Output absolute humidity at regeneration outputXXXX
Moisture removal chargeXX
Disclaimer/Publisher’s Note: The statements, opinions and data contained in all publications are solely those of the individual author(s) and contributor(s) and not of MDPI and/or the editor(s). MDPI and/or the editor(s) disclaim responsibility for any injury to people or property resulting from any ideas, methods, instructions or products referred to in the content.

