Abstract
One of China’s ambitious hydrogen strategies over the past few years has been to promote fuel cells. A number of hydrogen refueling stations (HRSs) are currently being built in China to refuel hydrogen-powered automobiles. In this context, it is crucial to assess the dangers of hydrogen leaking in HRSs. The present work simulated the liquid hydrogen (LH2) leakage with the goal of undertaking an extensive consequence evaluation of the LH2 leakage on an LH2 refueling station (LHRS). Furthermore, the utilization of an air curtain to prevent the diffusion of the LH2 leakage is proposed and the defending effect is studied accordingly. The results reveal that the Richardson number effectively explained the variation of plume morphology. Furthermore, different facilities have great influence on the gas cloud diffusion trajectory with the consideration of different leakage directions. The air curtain shows satisfactory prevention of the diffusion of the hydrogen plume. Studies show that with the increase in air volume (equivalent to wind speed) and the narrowing of the air curtain width (other factors remain unchanged), the maximum flammable distance of hydrogen was shortened.
1. Introduction
LH2 storage is preferable to compressed hydrogen storage due to its high mass-per-volume storage capacity, low pressure, low tank strength requirements, and lower propensity to react with tank components at low pressure [1]. However, compared with compressed hydrogen storage, LH2 storage is more dangerous because of the risk of explosion resulting from LH2 leakage [2,3]. LH2 leakage can also lead to low-temperature fluid injury accidents. Therefore, it is crucial to offer reliable protection against incidents involving the leakage of LH2 [4,5]. Several experimental studies have been conducted in response to LH2 leakage accidents, among which the following experiments are typical: The National Aeronautics and Space Administration (NASA) [6] conducted a large-scale LH2 flooding experiment at the White Sands Proving Ground to study the formation and diffusion laws of a combustible vapor cloud, which found that there is a close correlation between LH2 emission dynamics and the shape and evolution of the visible hydrogen cloud, and when the LH2 emission rate increases, plumes with higher rise rates are generated. The German Federal Institute for Materials Research and Testing [7,8] conducted experiments on LH2 leakage from residential areas in a small abandoned village and concluded that the heat exchange between the ground and the available gas in the cloud mixture influences the overall cloud dispersion and makes the dispersion process more complex and diverse. The UK Health and Safety Laboratory (HSL) [9,10] conducted continuous leakage experiments with small flow rates and ignition experiments to investigate hydrogen diffusion, ground liquid pool formation, atmospheric diffusion patterns without ignition of the cloud, flooding behavior under different storage conditions, and flame velocity, thermal radiation, and acoustic pressure after ignition of the gas cloud. The existence of the secondary explosion phenomenon was also predicted, and the safety distance in case of leakage ignition and explosion was initially estimated, while it was found that it was difficult to ignite the ignitable gas cloud because the surrounding air was more humid.
Meanwhile, domestic and foreign scholars have also conducted relevant theoretical and numerical simulations. Ichard et al. [11] established a simulation model of LH2 jet leakage to simulate the motion trajectory of the gas cloud based on the experimental data of HSL and found that when the leakage port is leaking in the horizontal direction of the jet, the oxygen and nitrogen phase change occurs in a small area (extending about 20 leak orifice diameters from the leak orifice), so neglecting the phase change of nitrogen and oxygen does not affect the calculation results too much. Hensen [12] found that a plume of high hydrogen concentration in the critical state behaves as a heavy gas in air, while the density of the plume decreases as the hydrogen concentration decreases, forming a neutral gas or floating plume, and the higher the humidity in the air, the lower the threshold of the hydrogen concentration needed to form a floating plume. Houf and Winters [13] compared the jet leakage of saturated state hydrogen, LH2, and subcooled LH2 at 1.03 MPa and found that the dilution distance (critical distance for hydrogen concentration of 4%) of subcooled LH2 is much greater than the first two conditions and that the cryogenic cloud is not greatly affected by gravity and gas buoyancy forces within the dilution distance due to the higher initial momentum at high pressure leakage. Giannissi et al. [14,15] compared LNG flooding and two-phase jet leaks and found that two-phase jet leaks are not sensitive to changes in ambient wind compared to flooding; he also studied LH2 leaks and found that although the phase change of water vapor in the air exothermically accelerates the uplift of the gas cloud, the solid particles produced after the phase change increase the density of the mixed gas cloud and thus offset part of the buoyancy effect, so the air humidity has less influence on the motion of the gas cloud. Pu et al. [16] made a detailed study on the diffusion mechanism and diffusion behavior of hydrogen after LH2 leakage and found that for instantaneous LH2 leakage, the low temperature severity is hardly harmful to people because of the short duration of low temperature hydrogen, but the risk of explosion still exists, especially under the influence of high wind speed, which is more likely to cause fire or explosion. Holborn et al. [17] conducted a detailed study of LH2 pool formation leakage and found that when the thermal conductivity of the ground material of the pool increases, the total amount of flammable gas (hydrogen concentration above 4% gas mixture) produced by evaporation will increase, but the total duration of the evaporation process will be shortened; additionally, he found that high wind speed will make the flammable distance of the flammable gas cloud larger compared to low wind speed, but at the same time the overall flammable range of the gas cloud is reduced.
Numerous professionals and academics have also researched real-world hydrogen use scenarios. Zhang et al. [18] conducted a comprehensive review on the safety analysis and protection strategies of fast filling hydrogen storage systems for fuel cell vehicle application. Qian et al. [19] conducted a simulation accident involving a hydrogen filling station with high-pressure hydrogen storage and discovered that the hydrogen leakage would spread in a flared shape, accumulate at the bottom of the obstructions after encountering them, and form an airflow circulation area underneath the obstructions. Tang et al. [20] analyzed the movement trajectory of a gas cloud after LH2 leakage occurred in a closed parking lot, and found that due to the crowded distribution of cars in the parking lot, the gas cloud would only begin horizontal diffusion when it reached the top of the parking lot. Compared with open space, the diffusion time and the duration of the explosion accident were longer, which had a huge impact. Klebanoff et al. [21,22] organized research to assess the potential for an LH2 leak and explosion on a boat. It was found that the small size of the hydrogen storage area made it almost impossible to have an explosion, so it was difficult to create a negative effect on the deck because of the low temperature LH2 liquefaction and heat absorption. However, it was still necessary to adequately ventilate the hydrogen storage area and reduce the ignition sources in order to reduce the risk.
The primary technique employed for low-temperature flammable gas leak protection is solid wall protection. Pua et al. [23] numerically concluded that a 1 m thick wall can effectively protect a rocket from the impact of hydrogen combustion. Liu et al. [24] investigated the impact of the presence of a solid enclosure on the trajectory of the gas cloud produced after an LH2 leak and conducted a detailed study. Sun et al. [25] compared the movement tracks of low-temperature clouds under three working conditions (the leakage source was completely surrounded by walls, only downwind with walls, and without walls) of LH2 flooding. Busini et al. [26,27] looked into how wall surface factors affected how cryogenic heavy gas dispersed (cryogas), and discovered that the wall’s size and height had a significant impact on this effect, but its surface shape (roughness, holes, etc.) had a negligible impact on enhancing LNG diffusion. This was because the large amount of LNG cloud released at once had a significant amount of inertia, and its turbulence was hardly affected by small changes in the wall surface. Additionally, raising the wall’s inclination resulted in substantial vorticity at its top, which improved the diluting of the cloud downwind.
The air curtain has been employed frequently in recent years as a means of protection against the diffusion of harmful gases since they are simpler to deploy than solid barriers and take up less room. In the event of a fire, Luo et al. [28] discovered that placing an air curtain at the stairwell entrance can effectively stop smoke from spreading from the hallway to the stairwell. Safarzadeh et al. [29] discovered that an air curtain can effectively stop toxic gases and overheating from spreading between rooms in a multi-room structure. According to Shih et al. [30], in the event of laboratory spills, an air curtain can effectively prevent the gaseous test products from spreading outdoors. Elicer-Cortés et al. [31] investigated the impact of air curtain speed on the confinement of the internal heat and flow field. The air curtain has better thermal insulation, according to Foster et al. [32], which can greatly lessen the cold loss brought on by the leakage of its internal cold when the cold storage is opened. Costa et al. [33] provided a numerical calculation approach to evaluate and quantify the air curtain’s sealing ability, and discovered that the air curtain can successfully block fluid flow and heat exchange from both sides to meet the needs of heat preservation and energy conservation. Yang et al. [34] discovered that high wind speeds of natural wind will pierce the air curtain, causing gas infiltration; to avoid this phenomenon, one must adequately manage the wind speed and tilt angle of the air curtain and effectively add solid impediments to hinder the natural wind. Shu et al. [35] developed a new technique to assess the effectiveness of the air curtain using the air curtain’s speed, angle, and inside and outside locations. Marsegan et al. [36] employed an air curtain for LNG leak protection and discovered that this method can both prevent the cloud from moving in and also supply a significant amount of air to dilute the LNG gas mass, significantly reducing the danger distance following an LNG leakage.
A survey of the literature shows that the protection of instantaneous overflow accidents under the protection of a solid wall has attracted much attention but the protection from continuous jet leakage accidents is not fully explored with regard to LH2 leakage. Additionally, the air curtain can be an effective method to be applied in the field of protecting against cryogenic fluid leakage. Accordingly, the present study presents a three-dimensional unsteady CFD numerical calculation model to simulate a small-scale LH2 jet in an open space. The numerical model was carefully validated by the near-field and far-field. Moreover, the air curtain as a method of hydrogen leakage protection was investigated. The simulation result can be a reference to the assessment and the prevention of liquid leakage.
In Section 2, the computational models including methodology, geometric modeling settings and grid independence validation are firstly calculated. Subsequently, model validation against experiments with both liquid nitrogen and liquid hydrogen is described in Section 3. Section 4 contains the results and discussion with regard to the settling and floating behavior of an LH2 leakage, the hydrogen diffusion behavior in LHRSs with different leakage directions, and the defending performance of the air curtain.
2. Computational Models
2.1. Methodology
Due to the large temperature difference between LH2 and air, flash vapor occurs when LH2 is first leaked and then a gas–liquid two-phase jet is formed. At the same time, convective heat transfer will also occur between the LH2 and the air in the process of efflux, so as to vaporize the LH2 and form hydrogen. Hydrogen is mixed with air and diffused in the air, so the leakage process and diffusion process of the LH2 jet is a multi-phase and multi-component flow process. In this paper, the mixture model is adopted, and the first phase is set as the mixture of air and hydrogen. Assuming that the leakage source is the atmospheric hydrogen storage device, the pressure of the gas fluctuates slightly during the whole process. Hence, the gas can be regarded as being under compression and the gas-phase mixture is set as an incompressible ideal gas. The second phase is LH2, which is assumed to have no change in physical properties due to its short existence time and its near saturation state at the exit.
The governing equations used in the calculation mainly include the mass conservation equation, momentum conservation equation and energy conservation equation:
where ρm represents the mix density. n and are the number of phases and the volume fraction of each phase, respectively. μm represents the mixed viscosity. The expression is the slip velocity of the kth term.
keef denotes the effective thermal conductivity. represents the volumetric heat source. denotes the average velocity of the mixed phase.
The mass transfer between liquid and gas phases is described by the vapor transport equation:
where and are the mass transfer rates caused by evaporation and condensation, respectively, and can be calculated as follows:
The saturation temperature (Tsat) of LH2 is 20.3 K. coeff denotes the mass transfer coefficient of phase transformation. In this paper, the evaporation coefficient is 0.55, determined by comparing the numerical calculation with the experimental results. Since the temperature of LH2 changes rapidly in the air, the phase transition of components in the air mainly occurs near the leakage hole and has little influence on the whole leakage and diffusion process. Therefore, the phase transition of other components in the air is ignored. The moisture content of the air is assumed to be 0, and only the evaporation of LH2 is considered.
2.2. Geometric Modeling and Boundary Condition Setting
Based on an actual LH2 hydrogenation station, a geometric model was established, as shown in Figure 1. The model comprises important buildings and furnishings, including a station house, a fence, an LH2 pump, a vaporizer, a long tube trailer and an LH2 truck. The minimum distance between the two cars and the leak source is 3.5 m and 6.5 m, respectively. The two vehicles are 1 m apart and have the same length, width, and height of 14 m, 2 m, and 2 m, respectively. The vaporizer is 2.5 m long, 3 m wide, and 2.5 m high, and the LH2 pump is 2.7 m long, 2.4 m wide, and 2.5 m high. The minimum distance between the LH2 pump and the leakage source is 1.8 m, and the minimum distance between the vaporizer and leakage source is 6.5 m. The wall in the west must be at least 14.6 m away from the leakage source, and the wall in the south must be at least 13.6 m away. The height of the wall is 2 m, and the thickness of the wall is 0.25 m. The station house is 10 m long, 5 m wide and 5 m high. The minimum distance from the leakage source is 8.3 m, and the angle between the long side and the due east direction is 9°.
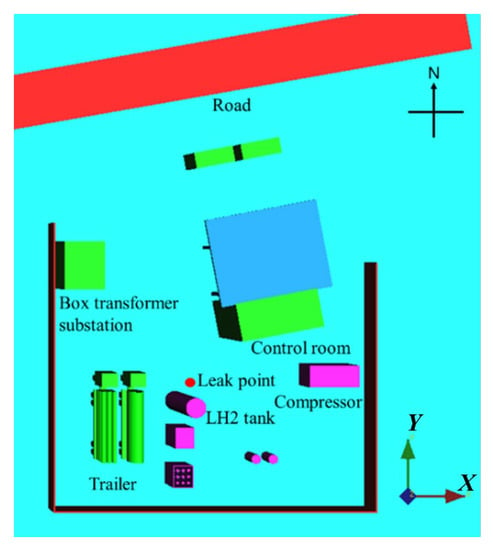
Figure 1.
Schematic configuration of the LHRS.
The following assumptions were made for the LH2 leakage simulation:
- The leakage source is assumed to be the LH2 storage tank inside the hydrogen refueling station. The simulated accident is an LH2 jet leakage caused by the failure of the equipment connection, with a leakage hole equivalent diameter of 20 mm. The proportion of liquid phase in the outlet jet is 1. According to a simulation study by Ichard et al. [11] based on HSL experiments, the leakage velocity is 12.6 m/s.
- The leakage disaster starts to happen at time t = 0, and it lasts for a total of 60 s. Three directions are used to compare and mimic the downwind leaking accident: due west (where the long tube trailer and LH2 truck were traveling), due south (direction of the LH2 pump and vaporizer), and northeast (direction of the station house). According to the city meteorological conditions, the ambient temperature is set to 289.15 K and the natural wind speed is set at 2 m/s. The air pressure is set at 0.1 MPa.
- In the simulation of the LH2 jet leakage accident occurring along different directions, the dimensions of the calculation domain are set to 40 m (X) × 40 m (Y) × 20 m (Z), the boundaries of the long tube trailer, LH2 truck, LH2 pump, vaporizer, station house, enclosure wall and ground are set to wall boundary conditions, and the temperature of the wall is set to 289.15 K. The station house and enclosure wall materials are made of limestone, and the materials of the other facilities are made of aluminum. The front and back surfaces are set as symmetric surfaces. The velocity inlet is set at the left surface of the calculation domain to simulate the natural wind, and the pressure outlet is set at the upper and right surfaces of the calculation domain. The temperature is set at 289.15 K and the pressure value is one standard atmosphere (101.3 kPa).
2.3. Grid Independence Validation
Three alternative grids were employed to test the grid independence. Figure 2 illustrates the temperature variation along the Y axis after an LH2 leakage lasting for 100 s. It is seen that the temperature distribution with the fine grid is approaching that with the refined grid. Finally, the fine mesh was chosen.
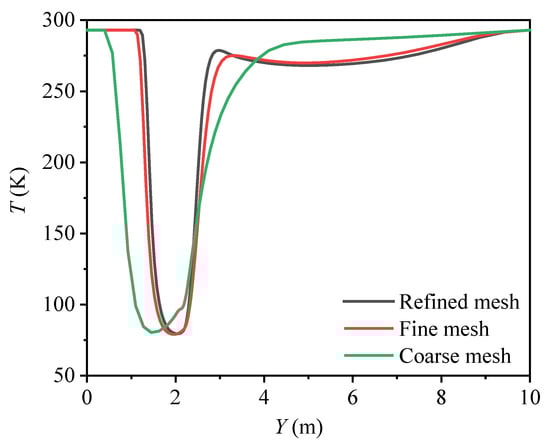
Figure 2.
Temperature distribution with different grid numbers (t = 100 s, X = 0, Z = 1.4 m).
3. Model Validation
3.1. Experimental Verification with Liquid Nitrogen for the Near-Field Cryogenic Dense-Gas Deposition Behavior
- 1.
- Experimental setup
Figure 3 displays the schematic and physical diagram of the test rig, which is composed of three key components, including the liquid nitrogen (LN2) supply system, data collecting system, and data processing system. The storage tank for LN2, the adiabatic pipeline, and the nozzle make up the bulk of the LN2 supply system. The atomizing nozzle is a solid conical spray pressure nozzle (Spray, 1-4HH-12.5). During the experiment, the tank is pressurized by opening the pressurization valve and then the LN2 at the bottom of the tank flows into the adiabatic pipeline before being sprayed into the air through the nozzle. Meanwhile, the tank is filled with nitrogen at the top and LN2 at the bottom.
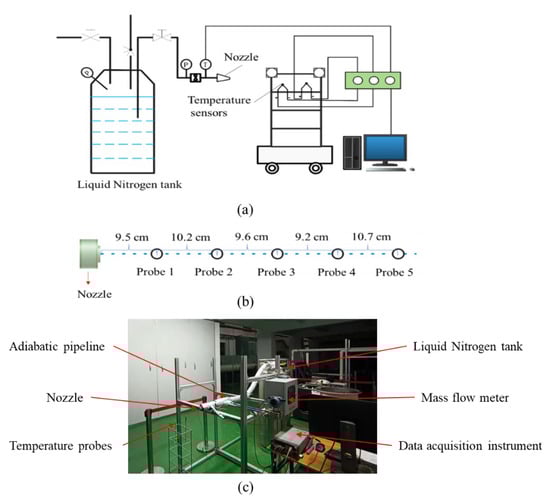
Figure 3.
Schematic and physical diagram of test rig. (a) schematic diagram, (b) temperature measurement distribution, (c) picture of the test rig.
The data collecting system consists of an armored T-type thermocouple (Omega TT series, temperature range 73.15–623.15 K, uncertainty 1 K), T-type thermocouples (Omega 5TC series, measurement range 73.15–623.15 K, uncertainty 1 K) fixed on the data acquisition vehicle, a mass flow meter (Hoffer, HFC2000 series, measuring range 0–0.96 kg/min, error 0.2%) and pressure sensors (Xingyi, CYYZ11 series, measurement range 0–1.5 MPa, error 0.2%). According to the data acquisition device, the uncertainty analysis of the main experimental data was carried out as in Table 1. During the experiment, the thermocouples are moved along with the data gathering cart to measure the flow field temperature. On the nozzle axis, five temperature measurement points are taken, and their locations are marked as shown in Figure 3.

Table 1.
Uncertainty analysis of experimental data.
- 2.
- Experimental results
The ambient atmospheric pressure is 0.1 MPa. The LN2 storage tank’s gauge pressure is 0.90 MPa, and the ambient temperature is 282 K. The adiabatic pipe’s gauge pressure is 0.21 MPa during the injection process. The volume flow rate of LN2 at the nozzle exit is approximately 8.10 L/min, and the spray velocity reaches 16.9 m/s, according to the nozzle’s flow characteristic curve. The nozzle rises 1 m above the surrounding surface.
When LN2 is injected into the air through a nozzle, it undergoes two throttling processes at the valve and the nozzle. These two throttling processes can be regarded as the isenthalpic process. Since the total enthalpy during the throttling process remains unchanged, some of the LN2 is lost to throttling and vaporization. The enthalpy of the gas–liquid fluid before and after the throttling process can be expressed as follows:
where h0−g, h0−l, h1−l, and h1−g represent the enthalpy of the gas phase and liquid phase before the throttling process, and the enthalpy of the gas phase and liquid phase after the throttling process, respectively. x0 and x1, respectively, indicate the dryness of the fluid before and after the throttling process. It is known that the dryness of LN2 before throttling is 0, and the temperature of the two-phase fluid that is finally injected into the air is measured to be 77.2K. Hence, it is a saturated fluid with the same pressure as atmospheric pressure. The thermal characteristics of nitrogen are displayed in Table 2. The calculation results show that at the nozzle outlet, LN2 accounts for around 28.97% of the mass and 1.383% of the volume.
Table 2.
Thermophysical properties of LN2.
In Figure 4, the average nitrogen temperature measured experimentally at the same location within 60 s is compared to the temperature trend of the cryogenic hydrogen cloud as determined by numerical simulation. The errors between the simulation results and the experimental results are within 10%.
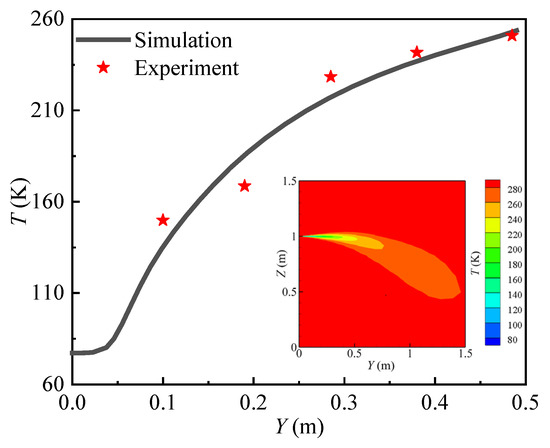
Figure 4.
Numerical vs. experimental temperature variation.
3.2. Experimental Verification with LH2 for the Far-Field Hydrogen Diffusion
The experimental results from test7 of the HSL experiment were used to confirm the accuracy of the numerical model in the simulation of the far-field hydrogen diffusion characteristics under the parameters presented in Table 3. The temperature measurement locations are evenly spaced throughout the X = 0 plane, measuring 0.75 m in height and 1.5 m apart. In Figure 5, the solid line represents the simulated value and the black dot represents the experimental value. The dashed line is a linear fit to the experimental value and, the simulated temperature change of the hydrogen cloud is contrasted with the experimental value. The comparison results in Figure 5 show that there is good agreement between the temperature variation trend of the hydrogen cloud by numerical calculation and experimental data.
Table 3.
Experimental condition of test7 by HSL.
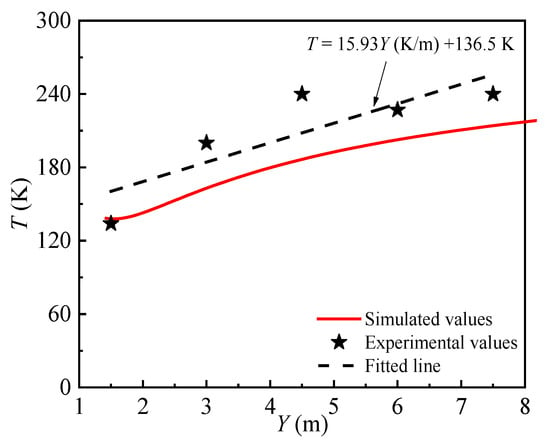
Figure 5.
Numerical vs. experimental temperature variation.
4. Results and Discussion
4.1. Settling and Floating Behavior of LH2 Leakage
The diffusion characteristics of leaking LH2 can be classified into four stages, as shown in Figure 6 and Figure 7, which exhibit the concentration diagram and temperature field diagram of hydrogen diffusion after the leakage of the LH2 jet, respectively.
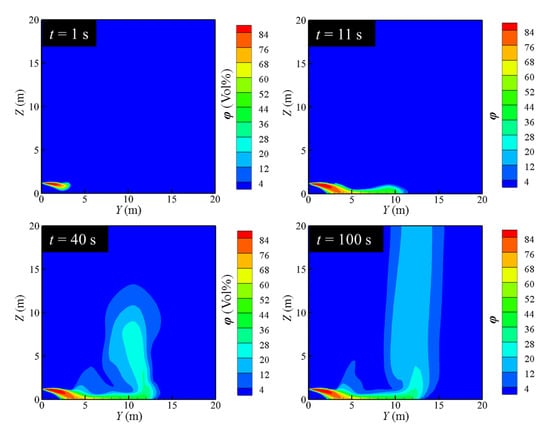
Figure 6.
Variation of hydrogen concentration distribution.
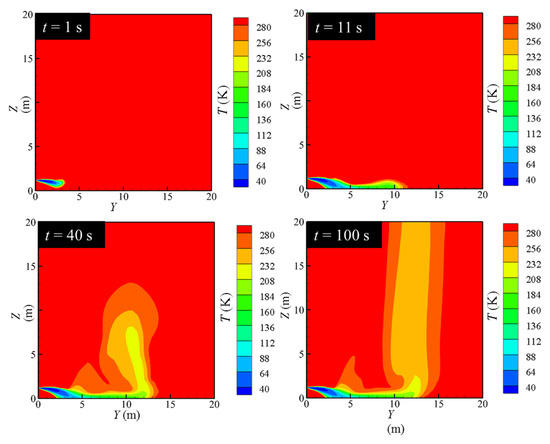
Figure 7.
Variation of temperature distribution.
As Figure 6 and Figure 7 illustrate, it can be concluded that the diffusion characteristics of LH2 leakage can be divided into four stages. At the beginning of the leakage, the phase change of the LH2 is insufficient. The LH2 behaves as a spray jet. The jet tends to settle down, although the volume of gaseous hydrogen is small. The first stage can be named as the free outflow stage. As the leakage proceeds, the LH2 absorbs heat from the surrounding air to cause a phase change, which produces a large amount of cryogenic gas hydrogen. The cryogenic gas hydrogen mixes with the cooled air to form the cryogenic combustible gas cloud. Due to a large density caused by the low temperature, this cryogenic combustible gas cloud settles under the force of gravity and advances along the direction of the leakage. The second stage can be called the phase-change settlement stage. As the temperature increases continually, the cryogenic gas cloud rises gradually, which is called the rising stage. In this stage, the cryogenic gas cloud moves to the farthest distance in the Y-axis direction. At about 100 s, the flow field gradually stabilizes, which is named as the stable dissipation stage. It is seen that stable settlement region forms in the near field. The cryogenic combustible gas cloud accumulates near the ground and flows away from the leakage hole along the axis of the leakage nozzle. The transition occurs at about Y value approaching 10 m. The gas cloud quickly rises and escapes into the high altitude.
It can be seen from the contours at different moments that in the early stage of leakage, the hydrogen cloud presents an obvious settlement trend. As the leakage continues, the hydrogen cloud rises roughly at the tail of the flow field. Giannissi and Venetsanos [37] obtained similar flow patterns of a hydrogen cloud. However, they did not explain the above mentioned phenomenon. The Richardson number (Ri), representing the dimensionless number of the ratio of the magnitude of the buoyancy effect to the inertia effect, yields the following:
where Fr stands for the Froude number and g denotes the gravitational acceleration. ρa and ρp represent the densities of the air and gaseous hydrogen, respectively. u represents the velocity of the fluid in the horizontal direction. d is the characteristic size, and the diameter of the leakage hole is taken (0.002 m). After post-processing of the calculated results, the distribution of the Ri number in the area where the hydrogen volume fraction is above 4% in the flow field in the quasi-steady state stage is obtained, as shown in Figure 8. It can be seen from the figure that at the initial time (t = 1 s), the value of Ri is small, and the hydrogen cloud mainly shows the trend of forward movement and settlement. In the initial stage, the role of buoyancy is not obvious. Hence, the role of the inertia force is dominant. As the leakage continues, the hydrogen cloud at the tail of the flow field rises rapidly, and the value of Ri in the corresponding area also increases sharply. Hydrogen and air at the tail of the flow field are fully mixed. The inertia force of the hydrogen cloud is weakened, and the buoyancy plays a dominant role. Thus, the motion of the hydrogen cloud can be explained by the variation of the value of Ri.
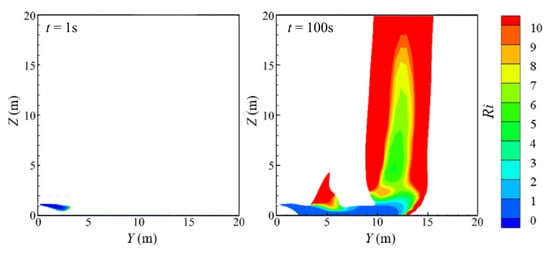
Figure 8.
Distribution of Ri number at various times.
4.2. Hydrogen Diffusion Behavior in LHRS with Different Leakage Directions
Figure 9 shows the diffusion contours of the hydrogen cloud with different leakage directions. Obstacles in the different leakage directions were set according to the actual structural layout in Figure 1. The obstacles are short and wide in the west side, short and narrow in the south side, and tall and wide in the north-east side. As can be seen from Figure 9a, after the leakage occurs in the due west direction, the cryogenic cloud moves forward through the bottom of the two trailers under the combined action of natural wind and inertial force, and then spreads rapidly. As the leakage continues, a part of the hydrogen cloud begins to spread over the wall to the outside of the hydrogen refueling station. The other part of the hydrogen cloud moves horizontally along the wall and trailers inside the hydrogen refueling station, and gradually begins to diffuse inside the hydrogen refueling station. As can be seen from Figure 9b, after the leakage occurs in the due south direction, the hydrogen cloud is hindered by the LH2 pump and vaporizer along the downwind direction, so the transverse diffusion is blocked and the hydrogen cloud accumulates near the LH2 pump and vaporizer. As can be seen from Figure 9c, after the leakage occurs in the northeast direction, the station house plays a role in diverting the gas cloud due to a certain angle between the station house and the leakage direction. The hydrogen cloud begins to diffuse around the station house. As the leakage continues, the hydrogen cloud envelopes the station house and spreads outwards.
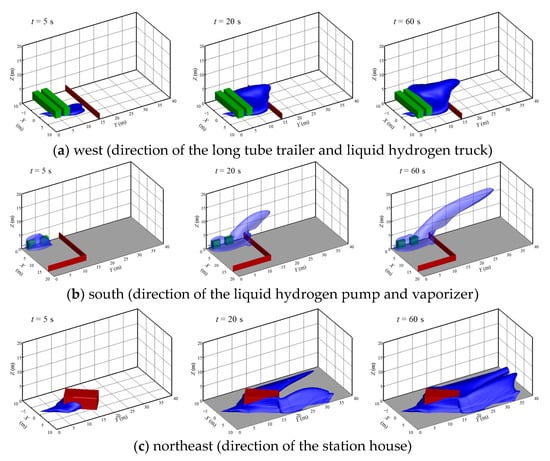
Figure 9.
Diffusion contours of hydrogen cloud with different leakage directions.
By comparing the leakage accidents in the due west direction and due south direction, due to the larger volume, the obstruction effect of the trailers is stronger than that of the LH2 and the vaporizer. Hence, the transverse diffusion of the hydrogen cloud is more obvious and the diffusion distance in the downwind direction is obviously shorter. Meanwhile, the hydrogen cloud bifurcates due to the special angle and high height of the station house. It is clear that when an LH2 leakage accident occurs inside the real LH2 refueling station, no matter in which direction the leakage occurs, the hydrogen cloud will accumulate near the physical facilities of the hydrogen refueling station and gradually surround the facilities. At this time, if a spark or arc ignites the hydrogen cloud and causes an explosion accident, it will lead to a huge negative impact on the equipment and personal injury.
4.3. Defending Performance of Air Curtain
The top view of the air curtain is shown in Figure 10, which surrounds the leakage source in a semi-enveloping shape. The main parameters include the width of the air curtain (wac) and the distance from the leakage source (dac).
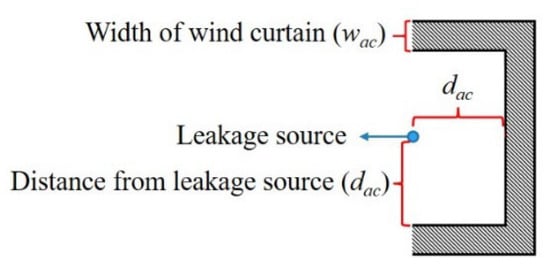
Figure 10.
Schematic diagram of air curtain.
- 1.
- The influence of different air volumes on protective effect
The width and position of the air curtain are kept unchanged to explore the influence of the volume of air on the protective effect of the air curtain. Because of the one-to-one correspondence between the volume of air and wind speed, wind speed is taken as a single independent variable for the numerical simulation. Figure 11 is the iso-surface of 4% hydrogen concentration under different wind speeds. Figure 12 shows the contour lines in the front view of the hydrogen cloud under different wind speeds. It can be seen that when the wind speed of the air curtain is small (vac = 6 m/s), the lifting effect of the air curtain is weak, and the gas cloud cannot be effectively diluted. Therefore, it fails to lift the gas cloud to a higher height. Meanwhile, after the gas cloud passes around the air curtain area, it falls quickly and starts to move to the ground. The maximum combustible distance of the cloud reaches more than 40 m. At this time, the protective effect of the air curtain is very limited. As the wind speed of the air curtain increases, the protective effect of air curtain is gradually enhanced, and the diffusion of the hydrogen cloud begins to be restricted. When the vac reaches 10 m/s, the hydrogen cloud can be lifted off the ground completely under the action of the air curtain, and the maximum combustive distance of the hydrogen cloud along the Y direction is significantly reduced (within 25 m). Subsequently, as the speed of the air curtain continues to increase, the overall shape of the hydrogen cloud essentially ceases to change. The reduction in the combustible distance gradually decreases and the cloud gradually begins to deflect upwards. At the same time, it is noted that within the air curtain region (Y < 2 m), the outline of the hydrogen cloud is basically similar, which means that increasing the air curtain exit wind speed has little effect on the diffusion of the hydrogen cloud at the exit area of the air curtain.
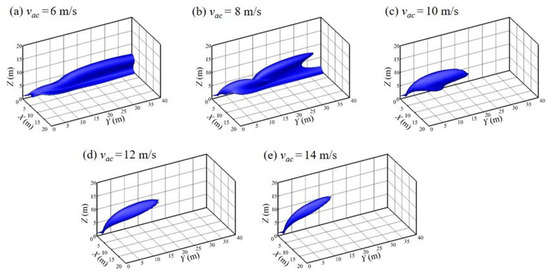
Figure 11.
Iso-surface of 4% hydrogen concentration with various vac values (wac = 0.25 m, dac = 2 m, t = 100 s).
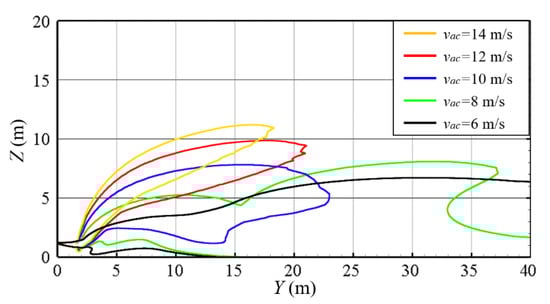
Figure 12.
Contours lines in front view with various vac values (wac = 0.25 m, dac = 2 m, t = 100 s).
- 2.
- The influence of different air curtain widths on the protective effect
By changing the width of the air curtain (wac), and keeping the position of the air curtain and the volume of air unchanged (dac = 2 m, Qac = 12 m3/s), the influence of different air curtain widths on the protection effect of the air curtain is explored. Simulations were carried out with different widths of air curtain to compare the calculated results after the flow field reaches a steady state (t = 100 s). Figure 13 is the iso-surface of 4% hydrogen concentration under different widths of air curtain. Figure 14 shows the contour lines in the front view of the hydrogen cloud under different widths of the air curtain. It can be seen that with the decrease in the width of the air curtain, the maximum combustible distance of the hydrogen cloud gradually diminishes. The overall height of the cloud rises and the protection effect of the air curtain is significantly improved. The major reason is that a small width of the air curtain leads to a high wind speed while the air volume rate remains the same. A high wind speed means a great capacity to lift the hydrogen cloud, improving the protection effect of the air curtain.
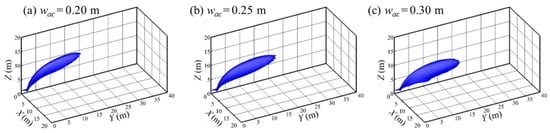
Figure 13.
Iso-surface of 4% hydrogen concentration with various wac values (Qac = 12 m3/s, dac = 2 m, t = 100 s).
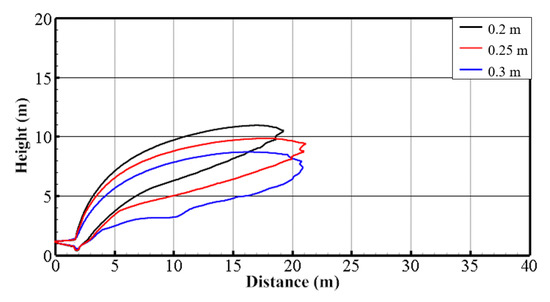
Figure 14.
Contour lines in front view with various wac values (Qac = 12 m3/s, dac = 2 m, t = 100 s).
5. Conclusions
The leakage of LH2 jet and the diffusion of the cryogenic cloud in the LHRS are studied in the present work. The means of using an air curtain are proposed and the protective effect of the air curtain on LH2 leakage is studied. The main conclusions are as follows:
- The numerical model is validated using cryogenic heavy gas settlement experiments in the near-field and hydrogen diffusion experiments in the far-field, which prove the reliability of the numerical model.
- The leakage process can be divided into four stages according to the change of flow pattern: free outflow stage, phase-change settlement stage, rising stage, stable dissipation stage. The Richardson number is employed to balance between the buoyancy and inertia satisfactorily to improve the explanation of the flow pattern evolution.
- The leakage of the jet flow in different directions in an LHRS is simulated. The shape and location of different facilities have a great impact on the diffusion trajectory of hydrogen cloud. The hydrogen cloud gradually spreads inside LHRS under the action of the ambient wind, and the gas cloud accumulates and surrounds the facilities in the LHRS.
- Increasing the volume of air can significantly enhance the air curtain protection. Furthermore, the maximum combustible distance of the hydrogen cloud decreases, but the benefits brought by increasing the volume of air also decrease. Meanwhile, decreasing the width of the air curtain leads to the rising of the hydrogen cloud. Accordingly, the protective effect is enhanced.
Author Contributions
Conceptualization, Y.R. and J.G.; Writing- Original draft preparation, J.P. and X.L.; Methodology and Validation, X.L. and J.C.; Writing Reviewing and Data curation, X.Z., X.P. and J.C.; Supervision, S.C. All authors have read and agreed to the published version of the manuscript.
Funding
This research received no external funding.
Data Availability Statement
The data are available from the corresponding author on reasonable request.
Conflicts of Interest
The authors declare no conflict of interest.
Nomenclature
| x0 | Dryness of the fluid before throttling (%) | Greek symbols | |
| x1 | Dryness of the fluid after throttling (%) | Density () | |
| h0−g | Enthalpy of hydrogen before throttling () | ||
| h0−l | Enthalpy of LH2 before throttling () | Subscripts | |
| h1−l | Enthalpy of LH2 after throttling () | a | Air |
| h1−g | Specific heat at constant volume() | ac | Air curtain |
| g | Gravitational acceleration () | h | Gaseous hydrogen |
| u | Velocity of the fluid in the horizontal direction () | Abbreviation | |
| d | Characteristic size (m) | Fr | Froude number |
| T | Temperature (K) | HSL | The UK Health and Safety Laboratory |
| Tsat | Saturation temperature (K) | LNG | Liquid natural gas |
| t | Time (s) | LH | Liquid hydrogen |
| v | Wind speed () | LN | Liquid nitrogen |
| W | Width of air curtain (m) | Ri | Richardson number |
| dac | Distance from the leakage source (m) | NASA | The National Aeronautics and Space Administration |
| Qac | Volume of air () | ||
References
- Züttel, A. Hydrogen storage methods. Naturwissenschaften 2004, 91, 157–172. [Google Scholar] [CrossRef] [PubMed]
- Pasman, H.J.; Rogers, W.J. Risk assessment by means of Bayesian networks: A comparative study of compressed and liquefied H2 transportation and tank station risks. Int. J. Hydrogen Energy 2012, 37, 17415–17425. [Google Scholar] [CrossRef]
- Shu, Z.; Liang, W.; Liu, F.; Lei, G.; Zheng, X.; Qian, H. Diffusion characteristics of liquid hydrogen spills in a crossflow field: Prediction model and experiment. Appl. Energy 2022, 323, 119617. [Google Scholar] [CrossRef]
- Sakamoto, J.; Sato, R.; Nakayama, J.; Kasai, N.; Shibutani, T.; Miyake, A. Leakage-type-based analysis of accidents involving hydrogen fueling stations in Japan and USA. Int. J. Hydrogen Energy 2016, 41, 21564–21570. [Google Scholar] [CrossRef]
- Sun, R.; Pu, L.; Yu, H.; Dai, M.; Li, Y. Modeling the diffusion of flammable hydrogen cloud under different liquid hydrogen leakage conditions in a hydrogen refueling station. Int. J. Hydrogen Energy 2022, 47, 25849–25863. [Google Scholar] [CrossRef]
- Witcofski, R.D.; Chirivella, J.E. Experimental and analytical analyses of the mechanisms governing the dispersion of flammable cloudscloud formed by LH2 spills. Int. J. Hydrogen Energy 1984, 9, 425–435. [Google Scholar] [CrossRef]
- Statharas, J.C.; Venetsanos, A.G.; Bartzis, J.G.; Würtz, J.; Schmidtchen, U. Analysis of data from spilling experiments performed with liquid hydrogen. J. Hazard. Mater. 2000, 77, 57–75. [Google Scholar] [CrossRef]
- Schmidtchen, U.; Marinescu-Pasoi, L.; Verfondern, K.; Nickel, V.; Sturm, B.; Dienhart, B. Simulation of accidental spills of cryogenic hydrogen in a residential area. Cryogenics 1994, 34, 401–404. [Google Scholar] [CrossRef]
- Hooker, P.; Willoughby, D.; Royle, M. Experimental Releases of LH2. In Proceedings of the 4th International Conference on Hydrogen Safety, San Francisco, CA, USA, 12–14 September 2011. [Google Scholar]
- Hall, J.E.; Hooker, P.; Willoughby, D. Ignited releases of LH2: Safety considerations of thermal and overpressure effects. Int. J. Hydrogen Energy 2014, 39, 20547–20553. [Google Scholar] [CrossRef]
- Ichard, M.; Hansen, O.R.; Middha, P.; Willoughby, D. CFD computations of liquid hydrogen releases. Int. J. Hydrogen Energy 2012, 37, 17380–17389. [Google Scholar] [CrossRef]
- Hansen, O.R. LH2 releases show dense gas behavior. Int. J. Hydrogen Energy 2020, 45, 1343–1358. [Google Scholar] [CrossRef]
- Houf, W.G.; Winters, W.S. Simulation of high-pressure LH2 releases. Int. J. Hydrogen Energy 2013, 38, 8092–8099. [Google Scholar] [CrossRef]
- Giannissi, S.G.; Venetsanos, A.G.; Markatos, N.; Willoughby, D.; Royle, M. Simulation of Hydrogen Dispersion Under Cryogenic Release Conditions. In Proceedings of the 5th International Conference on Hydrogen Safety (ICHS), Brussels, Belgium, 9–11 September 2013. [Google Scholar]
- Giannissi, S.G.; Venetsanos, A.G.; Markatos, N.; Bartzis, J.G. Numerical simulation of LNG dispersion under two-phase release conditions. J. Loss Prev. Process Ind. 2013, 26, 245–254. [Google Scholar] [CrossRef]
- Pu, L.; Shao, X.; Zhang, S.; Lei, G.; Li, Y. Plume dispersion behaviour and hazard identification for large quantities of LH2 leakage. Asia-Pac. J. Chem. Eng. 2019, 14, e2299. [Google Scholar] [CrossRef]
- Holborn, P.G.; Benson, C.M.; Ingram, J.M. Modelling hazardous distances for large-scale LH2 pool releases. Int. J. Hydrogen Energy 2020, 45, 23851–23871. [Google Scholar] [CrossRef]
- Zhang, C.; Cao, X.; Bujlo, P.; Chen, B.; Zhang, X.; Sheng, X.; Liang, C. Review on the safety analysis and protection strategies of fast filling hydrogen storage system for fuel cell vehicle application. J. Energy Storage 2022, 45, 103451. [Google Scholar] [CrossRef]
- Qian, J.; Li, X.; Gao, Z.; Jin, Z.J. A numerical study of hydrogen leakage and diffusion in a hydrogen refueling station. Int. J. Hydrogen Energy 2020, 45, 14428–14439. [Google Scholar] [CrossRef]
- Tang, X.; Pu, L.; Shao, X.; Lei, G.; Li, Y.; Wang, X. Dispersion behavior and safety study of LH2 leakage under different application situations. Int. J. Hydrogen Energy 2020, 45, 31278–31288. [Google Scholar] [CrossRef]
- Klebanoff, L.E.; Pratt, J.W.; LaFleur, C.B. Comparison of the safety-related physical and combustion properties of LH2 and liquid natural gas in the context of the SF-BREEZE high-speed fuel-cell ferry. Int. J. Hydrogen Energy 2017, 42, 757–774. [Google Scholar] [CrossRef]
- Klebanoff, L.E.; Pratt, J.W.; Leffers, C.M.; Sonerholm, K.T.; Escher, T.; Burgard, J.; Ghosh, S. Comparison of the greenhouse gas and criteria pollutant emissions from the SF-BREEZE high-speed fuel-cell ferry with a diesel ferry. Transp. Res. Part D Transp. Environ. 2017, 54, 250–268. [Google Scholar] [CrossRef]
- Pua, C.; Hu, P.; Ji, C.; Zhu, Z.; Zheng, B.; Zhai, S. Simulation analysis of protective wall against hydrogen combustion from liquified hydrogen storage tank on the offshore launching platform. Int. J. Hydrogen Energy 2023, 48, 12501–12518. [Google Scholar] [CrossRef]
- Liu, Y.; Wei, J.; Lei, G.; Lan, Y.; Chen, H.; Gao, X.; Wang, T.; Jin, T. Numerical investigation on the effects of dike around LH2 source on vapor cloud dispersion. Int. J. Hydrogen Energy 2019, 44, 5063–5071. [Google Scholar] [CrossRef]
- Sun, R.; Pu, L.; Yu, H.; Dai, M.; Li, Y. Investigation of the hazardous area in a LH2 release with or without fence. Int. J. Hydrogen Energy 2021, 46, 36598–36609. [Google Scholar] [CrossRef]
- Busini, V.; Rota, R. Influence of the shape of mitigation barriers on heavy gas dispersion. J. Loss Prev. Process Ind. 2014, 29, 13–21. [Google Scholar] [CrossRef]
- Busini, V.; Lino, M.; Rota, R. Influence of large obstacles and mitigation barriers on heavy gas cloud dispersion: A liquefied natural gas case-study. Ind. Eng. Chem. Res. 2012, 51, 7643–7650. [Google Scholar] [CrossRef]
- Luo, N.; Li, A.; Gao, R.; Zhang, W.; Tian, Z. An experiment and simulation of smoke confinement utilizing an air curtain. Saf. Sci. 2013, 59, 10–18. [Google Scholar] [CrossRef]
- Safarzadeh, M.; Heidarinejad, G.; Pasdarshahri, H. Air curtain to control smoke and fire spread in a ventilated multi-floor building. Int. J. Therm. Sci. 2021, 159, 106612. [Google Scholar] [CrossRef]
- Shih, Y.; Yang, A.; Lu, C. Using air curtain to control pollutant spreading for emergency management in a cleanroom. Build. Environ. 2011, 46, 1104–1114. [Google Scholar] [CrossRef]
- Elicer-Cortés, J.C.; Molina, N.; Severino, G.; Fuentes, A.; Rojas, P. Turbulent transport mechanisms on the heat confinement in tunnels by using low-velocity air curtain. Appl. Therm. Eng. 2020, 181, 115852. [Google Scholar] [CrossRef]
- Foster, A.M.; Swain, M.J.; Barrett, R.; D’Agaro, P.; Ketteringham, L.P.; James, S.J. Three-dimensional effects of an air curtain used to restrict cold room infiltration. Appl. Math. Model. 2007, 31, 1109–1123. [Google Scholar] [CrossRef]
- Costa, J.J.; Oliveira, L.A.; Silva, M.C.G. Energy savings by aerodynamic sealing with a downward-blowing plane air curtain—A numerical approach. Energy Build. 2006, 38, 1182–1193. [Google Scholar] [CrossRef]
- Yang, S.; Alrawashdeh, H.; Zhang, C.; Qi, D.; Wang, L.L.; Stathopoulos, T. Wind effects on air curtain performance at building entrances. Build. Environ. 2019, 151, 75–87. [Google Scholar] [CrossRef]
- Shu, C.; Wang, L.L.; Zhang, C.; Qi, D. Air curtain effectiveness rating based on aerodynamics. Build. Environ. 2020, 169, 106582. [Google Scholar] [CrossRef]
- Marsegan, C.; Busini, V.; Rota, R. Influence of active mitigation barriers on LNG dispersion. J. Loss Prev. Process Ind. 2016, 44, 380–389. [Google Scholar] [CrossRef]
- Giannissi, S.G.; Venetsanos, A.G. A comparative CFD assessment study of cryogenic hydrogen and LNG dispersion. Int. J. Hydrogen Energy 2019, 44, 9018–9030. [Google Scholar] [CrossRef]
Disclaimer/Publisher’s Note: The statements, opinions and data contained in all publications are solely those of the individual author(s) and contributor(s) and not of MDPI and/or the editor(s). MDPI and/or the editor(s) disclaim responsibility for any injury to people or property resulting from any ideas, methods, instructions or products referred to in the content. |
© 2023 by the authors. Licensee MDPI, Basel, Switzerland. This article is an open access article distributed under the terms and conditions of the Creative Commons Attribution (CC BY) license (https://creativecommons.org/licenses/by/4.0/).