Abstract
Photovoltaic (PV) systems are becoming increasingly prevalent worldwide, particularly in power distribution networks. However, their intermittency and integration into distribution networks can have adverse effects. This study investigates the impact of large-scale solar integration into a typical Malaysian power grid network, focusing on voltage stability, short circuits, and power loss under peak and no-load conditions. Using Digsilent Power Factory software, static and dynamic power flow analyses were performed on a network consisting of two 132/11 kV transformers, an 11 kV busbar, and 112 loads served through eight feeders. Solar PV of 100 kW was integrated into each node, and the maximum allowable solar grid connection level was determined. The static results show that there were no violations in no-load conditions at 100 kW PV penetration. However, during peak load, there were violations at 0% PV penetration, but by increasing the level of solar grid connection to 60% (60 kW), the voltage level moves up to the acceptable range. Under contingency conditions, the results show that the minimum level of solar penetration is 80% (80 kW). The highest power loss occurs during peak time and is observed at 0% PV penetration. Feeder 8, the lounge feeder with the highest number of loads, is identified as the main cause of power loss. According to the short circuit analysis in peak and no-load conditions, the system experiences the highest shorts during peak loads. On the other hand, we conducted a dynamic simulation with load characteristics and compared the results for different levels of PV penetration. The results from the dynamic simulations show that lower limit violations occur even at 100% PV penetration for a brief period in all case studies. This study identifies the maximum permissible PV penetration as 125 kW.
1. Introduction
There has been a significant increase in photovoltaic (PV) power generation worldwide in recent years, and PV-distributed generation plays a vital role in using renewable energy. The cumulative installed capacity of solar panels worldwide is expected to grow from 500 GW in 2020 to 2840 GW in 2030 and reach 8519 GW [1]. Malaysia has set a goal to assign 200 MW for the initial plant in Peninsular Malaysia and 50 MW in the state of Sabah [2]. It has been widely promoted and developed because the wide range of capabilities (from kW to MW) make it flexible and highly adaptable [3]. There has been an increasing focus on distributed power generation, which has led to the transformation of the distribution network from a traditional passive distribution system (PDS) to an active distribution system (ADS) consisting of small and medium-sized power generators. This has resulted in an improvement in the efficiency of the distribution system. However, large-scale integration of solar PV systems in distributed power generation systems can result in large amounts of reverse power flow, which can pose serious challenges to managing voltage in distribution networks, equipment protection, and safety issues. Extensive study is necessary to anticipate potential challenges in integrating PV systems into the grid [4,5,6].
Much research has been conducted on solar grid connections; for instance, Dilini et al. [7] thoroughly investigate the use of active power curtailment and reactive power absorption strategies by solar PV inverters to regulate voltage in medium voltage (MV) distribution networks. Sreekumar et al. [7] studied the impacts of grid-connected, distributed PV systems on the distribution network regarding power losses and voltage drops that may be caused by the PV system on the distribution network. Karunarathne et al. [8] examined how the position of a DG in the grid affected the voltage profile and the network power losses of radial distribution networks. Kmaruzzaman et al. [9] reviewed various factors impacting voltage fluctuations in a distribution network when solar PV systems are integrated into the grid. In Reference [10] it has been proposed that uncertainty in distribution networks needs to be considered and that a probabilistic power flow maintains the voltage profile of nodes within the distribution network. Numerous studies have investigated the technical challenges that may arise due to the large-scale penetration of solar PV in distribution networks. Some of these findings have been recently published.
The stochastic nature of solar units renders their output unpredictable and uncontrollable [11]. Overvoltage problems can occur when there is a fluctuation in power output and load demands. When PV generation is high, but the demand is low, a surplus of power will flow to the substation, leading to a reverse power flow to the network. This can cause disruptions in the distribution network’s performance, resulting in an increase in voltage levels that can potentially cause the network to fail. It is important to note that these consequences may sometimes be intensified based on the network topologies, size, position, climatic conditions, and other factors. Additionally, the large-scale solar grid connection in the distribution network, in conjunction with the experience of increasing active power losses, might also affect the operational efficiency of the network [12]. In the past, the effects of solar PV have mainly been studied and measured using deterministic and probabilistic methods to assess their impact.
In recent years, Digsilent Power Factory has offered quasi-dynamic simulation services for a wide range of electrical research projects, as well as medium- to long-term project management solutions [13]. This program uses consumer time-step sizes to simultaneously carry out multiple load-flow calculations, resulting in faster results since not all calculations need to be solved. Several studies [14] have shown that, in contrast to quasi-static methods, quasi-dynamic methods are more accurate [15], making it a preferred choice in various fields of power system engineering. Gaitan et al. [16], using a quasi-dynamic approach, investigated the impact of economic dispatch optimization on the performance of two transmission grids that provide services to industrial clients. The study analyzed a distribution system of various consumer types to evaluate potential changes and behaviors that may arise when DG is installed at a particular busbar location [17]. Since the popularity of large-scale solar connected to the grid has risen, the challenges related to distributing the energy generated by these systems have become more significant. Therefore, companies must proactively identify and understand potential issues and provide effective solutions to address them [18]. Although various techniques have been used to analyze the performance of single-point PV systems, their application to large-scale solar PV with multiple solar PV units distributed across a wide area is limited. While numerous research has examined how to integrate large-scale solar into distribution systems, very few studies have focused on planning distribution networks to ensure that PV systems can be widely deployed [19]. Many studies have treated photovoltaic (PV) systems and loads as PQ nodes without considering their dynamic behavior. Nevertheless, it’s crucial to keep in mind that the actual load power consumption is heavily influenced by its connection to a busbar, which means simulation results may not accurately reflect real-world consumption. Therefore, further research is necessary to address these gaps in understanding.
This study aimed to assess large-scale solar penetration’s impact on the medium voltage grid network. It determined the technical challenges, with the goal of helping utilities enhance their management of PV integration into the grid. Using Digsilent Power Factory software, the reference network for 132/11 kV voltage transmission was simulated (as shown in Figure 1). Both static and dynamic power flow analyses were employed to assess the effects of PV integration during peak and no-load periods. The study was designed to achieve the following objectives:
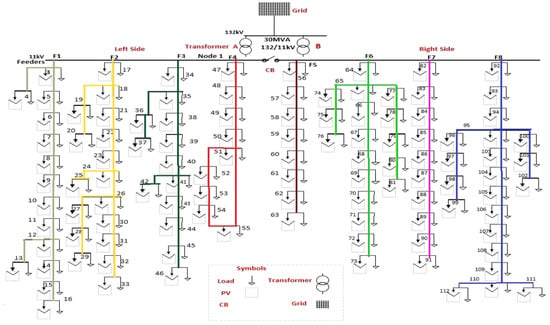
Figure 1.
Network Topology. In parallel, two 132/11 kV, 30 MVA transformers are connected to a 11 kV bus bar to provide power to the grid. In the 11 kV busbar, 8 feeders in total serve 112 nodes.
- To conduct a power flow analysis during peak load and no-load conditions;
- To examine short-circuit currents and power losses associated with PV penetration levels during no-load and peak-load conditions;
- To analyze dynamics simulations based on different scenarios;
- To determine the maximum PV capacity and find sensitive nodes.
2. Materials and Methods
The objective of this section is to provide a comprehensive explanation of the methodology utilized in the study to accomplish its research goals. This section discusses the simulation model, tools, and analysis strategies. The methodology can be divided into two main phases: a description of network data and a network evaluation. The network data includes information about transformers, lines, buses, and solar irradiation, and dynamic and static power flow analyses are used for network evaluation. The following section provides detailed instructions for each step of the methodology:
- Data collection: The information to be gathered includes the network single-line diagram, the load profile, and solar PV generation data.
- Analysis of time-series power flows: The Power Factory software will compute the power flow every minute to obtain accurate results.
- Voltage limit assessment: Overvoltage violations will indicate the maximum allowable PV penetration level.
- Identification of the highest voltage node: In case of an overvoltage violation, the node and bus with the highest voltage will be identified and reported.
- Dynamic simulation: This analysis will be conducted to identify sensitive feeders and nodes.
2.1. Network Topology Description
Figure 1 presents a simplified single-line diagram of a typical medium voltage distribution network in Malaysia that has been integrated with solar PV systems. The grid connects to the 11 kV bus bar through two 132/11 kV, 30 MVA transformers linked in parallel. Eight feeders are connected to the 112 nodes serviced by the 11 kV bus. The network is divided into two zones using a bus section circuit breaker, and a breaker separates the two transformers at the feeder one. To simplify the analysis, the four feeders on the left side of the network are referred to as the “Left Side”, whereas the remaining four feeders on the right side are the “Right Side”. Table 1 shows the load distribution among the feeders, which are presented in different colors. The total active and reactive loads connected to the 11 kV bus bar are 13.394 MW and 6.612 MVAR, respectively, for a total of 20.006 MVA. Two scenarios were established during the simulations to assess the impact of integrating large-scale solar PV into a typical Malaysian grid.

Table 1.
Network load characteristics among the 8 feeders.
- The no-load condition refers to turning off all loads in the network to evaluate how grid voltage profiles are affected by PV penetration.
- The peak-load condition involves the activation of all loads in the network to evaluate how PV penetration affects the voltage profiles of the grid.
2.2. Solar PV Integration Level
The concept of PV integration describes the ratio between the total connected PV capacity and the maximum PV capacity permitted by the system. The percentage of PV penetration is calculated based on the maximum possible power from the PV system. The entire medium voltage distribution grid in Figure 1 is implemented using Digsilent software version 2021. Different levels of solar PV penetration (0 kW—0%, 20 kW—20%, 60 kW—60%, and 100 kW—100%) were tested on the distribution network during peak load periods and no-load situations to determine whether lower limit violations occurred. This testing was conducted to evaluate the impact of increasing large-scale solar grid connections on the network. Statutory tolerances for voltage variation between +5% and −5% are set by Tenaga Nasional Berhad (TNB) for MV distribution networks in Malaysia. Sustainable grid voltage limits were taken into consideration to evaluate PV penetration levels. Furthermore, the study investigated the maximum level of PV penetration to analyze the potential energy generation from PV systems.
2.3. Network Evaluation Strategies
Several studies were conducted on three different cases to assess the network’s performance under various conditions, including periods of peak load and no-load periods. These studies aimed to examine the network’s effectiveness under different scenarios. In case 1, the circuit breaker on the 11 kV bus section was closed, and two 132/11 kV transformers operated in parallel. In case 2, the circuit breaker at Node 1 was open, and the transformers were working independently. In case 3, the network’s performance during a contingency outage condition was examined, where Transformer B was not working but the circuit breaker for the bus section was closed. Transformer A powered all the loads to simulate the contingency scenario. Different approaches, such as static and dynamic power flow analysis, were used to evaluate the network’s performance, as depicted in Figure 2. The primary aim of this study is to assess the impacts of varying levels of PV integration on individual nodes across different scenarios. To model and simulate the network, conventional power systems data, such as network topology, transformer data, power generation data, busbar data, transmission lines, and load profiles, are required.
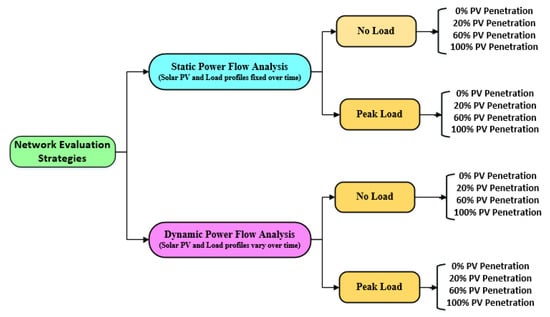
Figure 2.
Strategies for Evaluating Networks: Static and dynamic analyses were conducted to assess the network’s performance in periods of peak load and in no-load situations among cases 1,2, and 3.
2.4. Power Flow Analysis (Static)
Static power flow analysis determines the magnitude and phase of voltage levels at each busbar in the distribution grid network. Various analyses are performed on different situations and case studies to evaluate their effectiveness. A radial distribution network tends to lose voltage as it moves away from the bus bar, depending on the line’s resistance and the current flowing through it. With the increasing integration of solar PV, the line’s current decreases, reducing the conventional generation current and the actual power losses. However, there is also the possibility that, after a certain penetration level, the actual power losses could increase because the current from the solar PV flows back into the system. Moreover, short-circuit evaluations are performed in all case studies to examine how the system behaves under such conditions. Digsilent has a powerful short-circuit calculation toolbox incorporating several techniques, such as IEEE 141/ANSI C37, IEC 60909, G74, VDE 0102/0103, and IEC 61363, which are used for this purpose. The short-circuit current limit of the network, defined by the Malaysian distribution code at 31.5 kA for the 132 kV bus, is evaluated in several case studies to ensure compliance.
2.5. Dynamic Power Flow Analysis
To conduct a dynamic power flow analysis, the PV generation and load profiles must be considered to perform a proper analysis. The impact of solar PV penetration was evaluated during peak load and no-load conditions, focusing on examining the voltage profiles of distribution networks at various levels of PV penetration. To determine the maximum solar PV distributed generation output that the distribution networks can handle, the level of PV penetration at which the statutory voltage limit of ±5% is violated is identified. Equipment failures such as motor stalling or generator trips can occur at low voltage levels. In contrast, high voltage instances can lead to significant equipment damage, insulation failure, or critical transmission equipment tripping. Various levels of solar PV penetration (20%—20 kW, 60%—60 kW, and 100%—100 kW) were tested in both peak load and no-load conditions to investigate the integration of solar PV into the distribution network and whether voltage violations occurred during testing.
3. Results
This section presents static and dynamic simulation results for each case in graphical and table formats. The graphical results demonstrate the location and pattern of voltage fluctuations in the network across various levels of solar grid integration. By examining the voltage profile graphs for all cases during peak and no-load conditions, a simpler detection of voltage violations in the network was facilitated. Furthermore, the results for any feeders that experienced voltage violations were tabulated. These tabulated results summarize the condition of the feeders for all scenarios of solar PV penetration levels, making it easier to determine which feeder is the most affected during the discussion.
3.1. Static Power Flow Analysis
To achieve the aim and objective, we examined the maximum allowable PV penetration without statutory limit violations under no-load (the worst-case scenario) and peak load conditions of 100 kW. The voltage profiles for cases 1, 2, and 3 during no-load conditions are shown in Figure 3. It can be seen that there are no voltage violations for all 112 nodes in all case studies up to 100% (100 kW) solar PV penetration level. Furthermore, the voltages are within acceptable statutory limits of the grid code. As the penetration level of solar PV was increased beyond 100%, the maximum penetration level of solar PV was examined in the study. The grid code voltage limits were not violated until solar integration reached 125% (125 kW). In effect, this was the maximum penetration level that could be achieved without violating voltage. The figure clearly shows that the solar PV penetration at 125 kW hits the upper limit voltage at feeder 8 (nodes 111–112), as shown by the green line. This feeder is the lounge feeder with the highest number of loads.
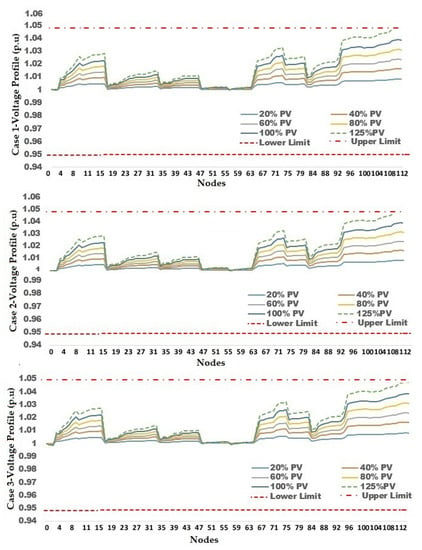
Figure 3.
Comparing voltage profiles during no-load conditions for three case studies.
Based on case studies 1, 2, and 3, Figure 4 illustrates the difference in voltage profiles during peak loads. The analysis examined the varying levels of PV penetration in the different case studies, as shown in the following graphs. It is evident that there are lower limit violations in all three case studies, from node 92 to node 112 (feeder 8). In the case of studies 1 and 2, by integrating 60% of the penetration level, indicated by the yellow line, all nodes shift to an acceptable level. Conversely, in case 3 (contingency condition), the blue color shows the minimum solar PV penetration level required to overcome lower limit violations is 80% (80 kW). The results show that nodes at feeder 8 are the main cause of lower limit violations in this network. Furthermore, the study investigated the impact of increasing solar PV penetration levels beyond 100% on the distribution network and identified that the maximum permitted penetration level is 125% (125 kW).
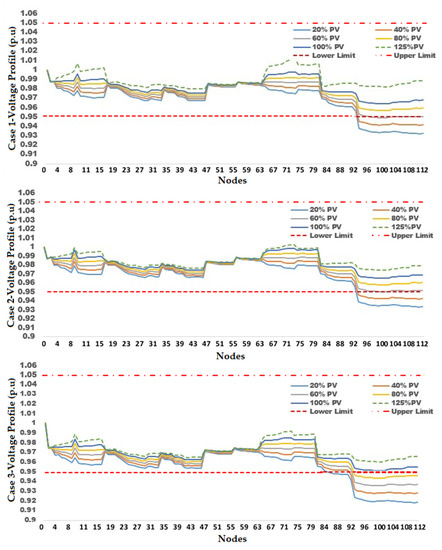
Figure 4.
Comparison voltage profile all the busbars under peak load conditions for all case studies.
3.2. Power Losses Evaluation Results
Table 2 presents power loss calculations for all case studies under peak load conditions. The table is divided into two sections with gray lines. The first section displays power losses at different levels of solar PV penetration, ranging from 0% to 100% (100 kW) across all case studies. The data shows a reduction in power losses as solar PV penetration increases. The maximum power loss of 329 kW was observed for case 3 at a 0% penetration level. Part two of Table 2 compares the power losses produced by solar PV for the network at the highest level of solar PV penetration possible under the grid code’s voltage limit of 125% (125 kW). However, increasing PV penetration by more than 100% is likely to result in significant increases in losses. This study concludes that increasing solar PV penetration beyond 125% is not advisable based on the results obtained.

Table 2.
A comparison of power losses during period of peak load among cases 1,2, and 3.
As mentioned earlier, one of the challenges of PV penetration into the grid is power losses in the network. Table 2 shows the greatest power losses during full loads observed at 0% PV penetration. However, by increasing PV penetration, power losses can be minimized. Therefore, it is essential to investigate the main causes of network losses to mitigate these challenges. Figure 5 illustrates feeder power losses at peak loads for 0% and 100% PV penetration levels. Feeder 8 has the highest percentage of power losses due to the number of loads and the long feeder line.
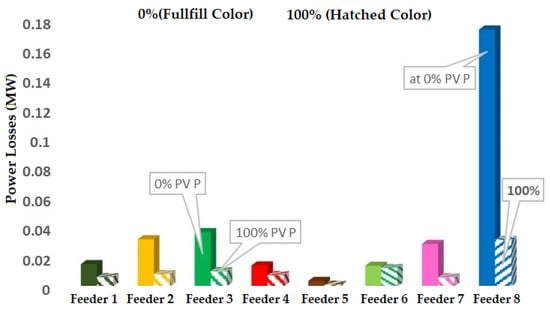
Figure 5.
Power loss among feeders at peak load for 0% and 100% PV penetration.
3.3. Short-Circuit Current Network Evaluation
Network designers often conduct short-circuit tests to ensure network reliability during emergency situations. This section aims to evaluate the short circuit analysis of three case studies conducted on two buses, at 132 kV and 11 kV, in periods of peak load and in no-load situations. Table 3 compares the short-circuit currents at the 132 kV and 11 kV busbars among the three case studies. It also shows that the maximum short-circuit current value at the 132 kV busbar occurs at 100% penetration level, with values of 28042A, 28042A, and 28050A for cases 1, 2, and 3, respectively. Additionally, the short-circuit current at the 11 kV busbar was evaluated in peak-load and no-load situations, as shown in Table 4. The maximum value of the short-circuit current record for the 11 kV busbar is 6515A under contingency conditions at 100% PV penetration when operating at no load and 6469A during full load.

Table 3.
A comparison of short-circuit currents during a period of no-load.

Table 4.
A comparison of short-circuit currents during a period of peak load.
3.4. Dynamic Simulation under Peak Load Scenario
As a part of the study, network parameters such as impedances and the lengths of lines used in typical Malaysian MV distribution networks were taken into consideration. According to Figure 6, we have shown a normalized load consumption and solar PV generation profile used to conduct this study. As shown in the figure, solar PV generation profiles are shown in blue, whereas load demand profiles are shown in red. Due to these load characteristics, daytime tends to have a high amount of load demand. We obtained solar and load time characteristics from a local distribution company.
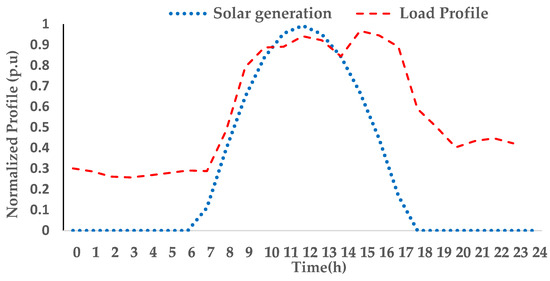
Figure 6.
Normalized load consumption and solar PV generation profile.
This section of the study investigates the dynamic simulations under peak load conditions across different penetration levels (20%, 60%, and 100%). Figure 7 shows the dynamic simulation during peak load among three case studies. Increasing PV penetration improves the voltage profile in all three case studies, and it is observed that there is a violation among all three case studies, even after 100% solar PV penetration. In cases 1 and 2, the voltage profile is at 20%. Penetration has a lower limit violation for nodes 93–112 (feeder 8, shown by the blue color). Increasing penetration to 60% means a lower limit violation occurs only briefly between 4 pm and 6 pm. In addition, it is observed that even after 100% solar PV penetration, there is still a lower limit violation in a few nodes at feeder 8, including nodes 96–112 at the end of this feeder.
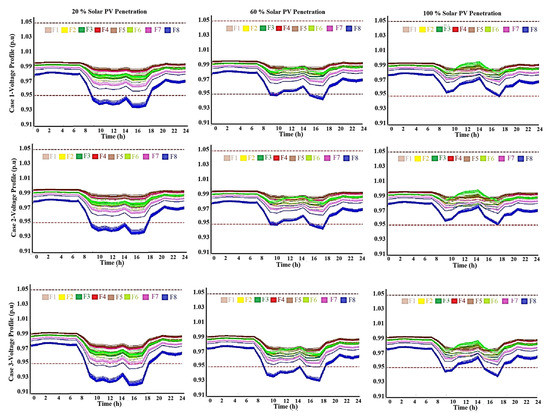
Figure 7.
Comparing the dynamics of PV penetration level at peak loads for all case studies.
Nevertheless, case 3, when penetration of solar PV is 20%, indicates lower limit voltage violations for all buses at feeders 7 and 8 (purple and blue). Raising the level of solar PV penetration to 60% enables nodes in feeder seven to exceed the lower limit, but most of the nodes in feeder eight still exist. In addition, despite 100% PV penetration, voltage limit violations continue to occur at nodes 93–112 between 9 and 11 am and 3 and 6 pm, but only for a short duration.
4. Conclusions
The performance of a PV system was evaluated under different scenarios through three case studies. The studies analyzed the PV system’s effectiveness under low, at 20% (20 kW); medium, at 60% (60 kW); and high, at 100% (100 kW) levels of PV penetration. The static power flow analysis revealed that for all 112 busbars in the three case studies, there were no voltage violations at the no-load condition up to a solar penetration level of 125 kW (125%). It was also noted that the voltage levels remained within the statutory limits of ±5% as set by the grid code regulations. Under peak load conditions, voltage violations were found to occur at nodes 92–112 (feeder 8) in the grid when the solar PV integration was at 0%. The maximum penetration limit of solar PV was determined by increasing the solar PV penetration level beyond 100%. The study revealed that the grid code voltage limits could not be exceeded beyond a maximum PV penetration of 125% (125 kW). The load flow analysis takes into account power loss as a crucial factor. Based on the study, the highest power loss was observed during peak time with zero solar PV integration, with values of 320 kW and 319 kW for cases 1 and 2, respectively, and 329 kW for case 3. As the level of solar PV penetration increased, the power loss decreased.
Moreover, the results also indicated that the maximum short-circuit currents occurred at 100% solar PV penetration level, equal to 28,050 A. Dynamic simulations were conducted for each case study at peak load conditions as part of the study. The Digsilent power factory utilized a load profile and solar PV generation profile acquired from a local power supply company to assess the network’s performance at various PV penetration levels every minute of the day. The study’s results indicated that the voltage profile improved with increasing PV penetration. For cases 1 and 2, it was found that feeder 8 had lower limit voltage violations up to 60% PV penetration. Still, after increasing the PV penetration to 100%, most nodes are overcome, though nodes 96–112 for a short duration around 6 pm still exist. However, in case 3, the voltage profiles of feeders 7 and 8 indicate lower limit violations at 20% PV penetration. However, after increasing the PV penetration to 100%, only a low limit violation at feeder 8 for a short duration still exists. As this is a contingency situation, it is not a major concern because it may be only a brief period of time before this occurs. A future research effort will focus on exploring and implementing mitigation techniques, such as demand response and energy storage programs, in order to address voltage fluctuations in the grid and enhance the integration of solar PV.
Author Contributions
Software, M.R.M.; methodology, M.R.M., C.M.L. and J.P.; conceptualization M.R.M., C.M.L. and J.P.; formal analysis, M.R.M.; writing—review and editing, M.R.M. and J.P.; validation, M.R.M. and J.P.; visualization, M.R.M. and C.M.L.; investigation, M.R.M. and C.M.L.; resources, J.P.; data curation, J.P.; writing—original draft preparation, M.R.M.; supervision, J.P.; project administration, J.P.; funding acquisition, J.P. All authors have read and agreed to the published version of the manuscript.
Funding
This research publication is funded through J510050002–IC-6 BOLDREFRESH2025-CENTRE OF EXCELLENCE from the iRMC of Universiti Tenaga Nasional.
Institutional Review Board Statement
Not applicable.
Informed Consent Statement
Not applicable.
Data Availability Statement
Not applicable.
Acknowledgments
The authors would like to thank the Tenaga Nasional Berhad (TNB), Malaysia, for supporting the research work through UNITEN R&D Sdn. Bhd. TNB R&D Seeding Fund U-TD-RD-21-14. This publication was supported by Tenaga Nasional Berhad (TNB) and UNITEN through the BOLD Refresh Publication Fund under the project code of J510050002-IC-6 BOLDREFRESH2025-Centre of Excellence.
Conflicts of Interest
The authors declare no conflict of interest.
Abbreviations
| List of Abbreviations | Nomenclature | ||
| DG | Distributed Generation | Vpu | Voltage per unit |
| PV | Photovoltaic | Vmin | Minimum Voltage |
| PV DG | Photovoltaic Distributed Generation | Vmax | Maximum Voltage |
| MV | Medium Voltage | Vactual | Actual Voltage |
| LV | Low Voltage | V base | Voltage base |
| PPU | Main Distribution Substation | P | Real Power |
| PMU | Main Intake Substation | Q | Reactive Power |
| QD | Quasi Dynamic Simulation | PU | Per unit |
| NL | No-Load | PL | Peak Load |
References
- Gervais, E.; Shammugam, S.; Friedrich, L.; Schlegl, T. Raw material needs for the large-scale deployment of photovoltaics–Effects of innovation-driven roadmaps on material constraints until 2050. Renew. Sustain. Energy Rev. 2021, 137, 110589. [Google Scholar] [CrossRef]
- Chua, S.C.; Oh, T.H. Solar energy outlook in Malaysia. Renew. Sustain. Energy Rev. 2012, 16, 564–574. [Google Scholar] [CrossRef]
- Maghami, M.R.; Asl, S.N.; Rezadad, M.E.; Ale Ebrahim, N.; Gomes, C. Qualitative and quantitative analysis of solar hydrogen generation literature from 2001 to 2014. Scientometrics 2015, 105, 759–771. [Google Scholar] [CrossRef] [PubMed]
- Chaudhary, P.; Rizwan, M. Voltage regulation mitigation techniques in distribution system with high PV penetration: A review. Renew. Sustain. Energy Rev. 2018, 82, 3279–3287. [Google Scholar] [CrossRef]
- Almeida, D.; Abeysinghe, S.; Ekanayake, M.P.; Godaliyadda, R.I.; Ekanayake, J.; Pasupuleti, J. Generalized approach to assess and characterise the impact of solar PV on LV networks. Int. J. Electr. Power Energy Syst. 2020, 121, 106058. [Google Scholar] [CrossRef]
- Almeida, D.; Pasupuleti, J.; Ekanayake, J.; Karunarathne, E. Mitigation of overvoltage due to high penetration of solar photovoltaics using smart inverters volt/var control. Indones. J. Electr. Eng. Comput. Sci. 2020, 19, 1259–1266. [Google Scholar] [CrossRef]
- Sreekumar, S.; Savier, J.S. Investigative scheme to assess ultimate penetration level of grid connected solar photovoltaic systems in distribution network. Int. Trans. Electr. Energy Syst. 2021, 31, e12647. [Google Scholar] [CrossRef]
- Karunarathne, E.; Pasupuleti, J.; Ekanayake, J.; Almeida, D. Optimal placement and sizing of DGs in distribution networks using MLPSO algorithm. Energies 2020, 13, 6185. [Google Scholar] [CrossRef]
- Kamaruzzaman, Z.A.; Mohamed, A.; Shareef, H. Effect of grid-connected photovoltaic systems on static and dynamic voltage stability with analysis techniques—A review. Univ. Kebangs. Malays. 2015, 2015, 1–8. [Google Scholar] [CrossRef]
- Weschenfelder, F.; Leite, G.d.N.P.; da Costa, A.C.A.; de Castro Vilela, O.; Ribeiro, C.M.; Ochoa, A.A.V.; Araujo, A.M. A review on the complementarity between grid-connected solar and wind power systems. J. Clean. Prod. 2020, 257, 120617. [Google Scholar] [CrossRef]
- Atmaja, W.Y.; Putranto, L.M. A Voltage Rise Mitigation Control Scheme of Utility-Scale Battery in High PV Penetration. In Proceedings of the 2021 3rd International Conference on High Voltage Engineering and Power Systems (ICHVEPS), Bandung, Indonesia, 5–6 October 2021; pp. 634–639. [Google Scholar]
- Almeida, D.; Pasupuleti, J.; Ekanayake, J. Assessing the performance of smart inverter functionalities in PV-Rich LV distribution networks. In Proceedings of the 2020 IEEE Student Conference on Research and Development (SCOReD), Selangor, Malaysia, 8–9 November 2022; pp. 90–95. [Google Scholar]
- Gaitán, L.F.; Gómez, J.D.; Rivas-Trujillo, E. Quasi-Dynamic Analysis of a Local Distribution System with Distributed Generation. Study Case: The IEEE 13 Nodes System. TecnoLógicas 2019, 22, 140–157. [Google Scholar] [CrossRef]
- DIgSilent, P. Digsilent Powerfactory 15 User Manual. 2014. Available online: https://www.digsilent.de/en/downloads.html (accessed on 20 February 2023).
- Raoofsheibani, D.; Henschel, D.; Hinkel, P.; Ostermann, M.; Wellssow, W.H.; Spanel, U. Quasi-dynamic model of VSC-HVDC transmission systems for an operator training simulator application. Electr. Power Syst. Res. 2018, 163, 733–743. [Google Scholar] [CrossRef]
- Gaitan, L.F.; Gómez, J.D.; Trujillo, E.R. Simulation of a 14 Node IEEE System with Distributed Generation Using Quasi-dynamic Analysis. In Proceedings of the Workshop on Engineering Applications, Medellin, Colombia, 17–19 October 2018; pp. 497–508. [Google Scholar]
- Hoang, A.T.; Nguyen, X.P. Integrating renewable sources into energy system for smart city as a sagacious strategy towards clean and sustainable process. J. Clean. Prod. 2021, 305, 127161. [Google Scholar] [CrossRef]
- Al-Shetwi, A.Q.; Hannan, M.; Jern, K.P.; Mansur, M.; Mahlia, T.M.I. Grid-connected renewable energy sources: Review of the recent integration requirements and control methods. J. Clean. Prod. 2020, 253, 119831. [Google Scholar] [CrossRef]
- Almeida, D.; Pasupuleti, J.; Ekanayake, J. Performance evaluation of PV penetration at different locations in a LV distribution network connected with an off-load tap changing transformer. Indones. J. Electr. Eng. Comput. Sci. 2021, 21, 987–993. [Google Scholar] [CrossRef]
Disclaimer/Publisher’s Note: The statements, opinions and data contained in all publications are solely those of the individual author(s) and contributor(s) and not of MDPI and/or the editor(s). MDPI and/or the editor(s) disclaim responsibility for any injury to people or property resulting from any ideas, methods, instructions or products referred to in the content. |
© 2023 by the authors. Licensee MDPI, Basel, Switzerland. This article is an open access article distributed under the terms and conditions of the Creative Commons Attribution (CC BY) license (https://creativecommons.org/licenses/by/4.0/).