Abstract
The transmission in automobiles is the core component to ensure operational stability. Heat accumulation in the meshing process will reduce the transmission efficiency and affect the service life. Here, the essential physical process to improve transmission heat dissipation is the dynamic evolution process and the thermal transfer characteristics of lubricating oil fields during gear meshing. This paper presents a modeling and solving method for gear meshing lubrication and thermal transfer features based on the volume of the fluid model and piecewise linear interface construction (VOF-PLIC). The dynamic mesh technique combines spring smoothing and reconstruction to optimize the numerical solution process. The dynamic evolution law of gear meshing lubrication and thermal transfer is obtained by analyzing the lubrication evolution process under different speed/steering conditions. The results show that the proposed modeling and solving method could well reveal the lubrication and thermal transfer laws of the gear meshing. The temperature of the gear meshing regions was higher than that in the other regions, and the lubrication temperature showed an increasing linear trend with the stirring process. As the gear speed increased, the meshing resistance moment increased, the transmission power loss increased, and the lubrication oil temperature was larger than that of the gearbox. The power loss under the clockwise rotation of the driving gear G4 was higher than that under the counterclockwise rotation of the driving gear. The relevant results can provide theoretical references for the dynamic analysis of automotive transmission lubrication and technical support for gear profile design and lubrication optimization.
1. Introduction
As an important intermediate link connecting the power input and output of the vehicle, the performance of the transmission system directly affects the transmission efficiency, power performance, and economic performance of the vehicle. Transmission is an indispensable part of the vehicle transmission system, which can protect the driving stability of the vehicle [1,2,3,4]. In the process of movement and power transmission, there are power losses such as gear meshing loss, oil mixing loss, and wind resistance loss, and the parts in the gearbox will release a lot of heat when working. Suppose the lubrication system of the gearbox cannot absorb the heat released by the parts in the working process. In that case, the temperature of the parts and oil in the gearbox will be too high, affecting the regular transmission operation [5,6,7]. Therefore, it is of great significance to study the dynamic evolution characteristics of the lubrication flow field of automobile transmission to improve its service life and working efficiency.
Good lubrication in the transmission of electric vehicles is an essential guarantee for the stable operation of the gear transmission system. Poor lubrication will lead to premature failure of the transmission system [8,9,10]. However, fully immersed oil lubrication can easily cause a stirring loss of gear. Therefore, it is of excellent application prospect to study the lubrication evolution mechanism of the gear drive under working conditions and master the power consumption characteristics. However, the fluid in the gearbox is a mixed flow formed by the mixing of lubricating oil and air. The dynamic characteristics of the mixed flow are very complex, presenting significant challenges in numerical modeling and solving.
To solve the above problems, scholars have conducted a lot of research. Pallas analyzed the eccentric structure stirring, obtained the moving evolution process of the oil phase, and reduced the stirring loss [11]. Seetharama simulated the temperature field of the two-phase flow in the gearbox and obtained the temperature field of the gearbox at different speeds [12]. Lemfeld analyzed the fluid flow pattern of the lubricating oil in the gear meshing region and found that the meshing gear generated the temperature and pressure in the lubricating oil [13]. Dab proposed an approximate hydrodynamic model of oil and gas and found that the loss caused by suction lubricating oil in the meshing area became the primary source of power loss [14]. Corla simulated three oil immersion depths based on the smooth particle hydrodynamic method and obtained the oil distribution cloud diagram [15]. Currently, the research on the lubrication process of gear transmission has mainly focused on the simple gear meshing state and disturbance factors. For the multilevel gear meshing process, the dynamic evolution law and thermal transfer mechanism of the hot oil field of the gear meshing process are still unclear. Therefore, the modeling and solving optimization method for the gear meshing lubrication faces great difficulty.
This paper presents a dynamic modeling and solving method for the hot fluid field of gear meshing lubrication. By analyzing different speed/steering conditions, the dynamic evolution law and thermal transfer features of the mixing flow field were obtained. In general, the proposed method in this paper can provide a theoretical reference for the dynamic analysis and thermal transfer process of automobile transmission lubrication and technical support for transmission tooth profile design and lubrication optimization.
2. Mathematical Model and Solution Method
2.1. Volume Fraction Equation and Interface Reconstruction Method
The research object of this paper was the oil and gas two-phase flow in the gearbox. The volume of fluid (VOF) model is a surface tracking method based on fixed Euler mesh, which is suitable for capturing and tracking the interface between one or more non-melting fluids [16,17,18,19]. The model solves the volume fraction of each fluid passing through the region to simulate the fluid and obtain the interphase interface.
In the VOF model, the volume fraction of the ith phase is αi, and the sum of each unit of the fluid-phase volume fraction is 1. If αi = 0, the cell does not contain the fluid phase i; if 0 < αi < 1, the cell has both phase i and interface; if αi = 1, the cell is only the fluid phase i. According to the proportion of each phase, the transport equation and the fluid function control equation constitute the VOF model’s control equation [20,21,22]. The interphase interface is tracked in real-time by solving the volume fraction of single-phase or multiphase fluid. For phase i, the equation is expressed as follows [23,24,25]:
where αi, vi, and ρi represent the volume fraction, velocity, and density of phase I; S is the source items of the αi; and mij and mji are the mass transport of the two-phase fluids. Based on the above equation, the volume fraction of each phase fluid can be solved, but the constraint equation ρ = Σα ρ must be satisfied at the same time.
The piecewise linear interface construction (PLIC) method has a better simulation and reduction effect on the free interface of rotation and the shear velocity field, and the constructed interface is exact [26,27,28]. To realize accurate transmission tracking, the PLIC method was used in this paper to solve the free interface shape in the Euler fixed grid method. The basic idea is to move the interface in the normal direction so that the area ratio of the unit liquid region matches the value of the VOF function. The secant method iteratively obtains the vertical distance between the element center and the phase interface. Different fluid volume VOF function values have different reconstruction interfaces. However, through geometric space transformation, it can be summarized into several typical surface shapes in Figure 1. If the fluid’s volume fraction determines the shape of the free surface, the accessible interface will transport the fluid volume between the grids as the fluid moves.
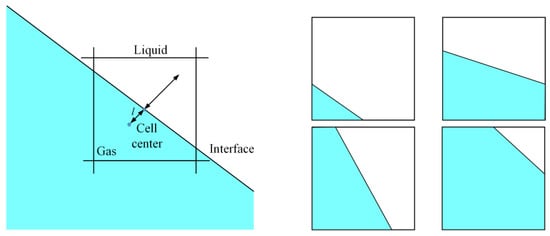
Figure 1.
Typical interface form of piecewise linear interface reconstruction.
2.2. Momentum Conservation Equation
Momentum conservation is a general law that should be followed in a fluid motion. Considering the incompressibility and viscosity of the fluid medium, its differential form is as follows [29,30]:
where τxx, τxy, and τxz are the components of the viscous stress τ, and fx, fy, and fz denote the force per unit mass in three directions. If the mass force is just gravity, and the z-axis is straight up, fx = fy = 0, fz = −g. The above components are expressed as follows.
where μ is the dynamic viscosity; λ is the second viscosity; and u is the velocity vector.
2.3. Energy Conservation Equation
Due to the energy loss in the transmission mixing process, the energy conservation equation should be considered in the flow field calculation [31,32,33]. The general expression of the energy conservation law is as follows:
where U is the change in the internal energy of the fluid per unit time; η is the fluid domain; fF is the heat flow vector; u is the fluid velocity; p′ is the amount of heat absorbed by the fluid domain from the outside world per unit time; and q is the heat distribution function of unit mass in unit time under the thermal radiation.
2.4. Turbulent Kinetic Equations
The standard turbulent kinetic energy–dissipation (k–ε) model is used to simulate the disturbance degree of the transmission stirring process and to provide an accurate solution model for the governing equation in a turbulent state. The turbulent kinetic energy transport equation is derived mathematically, and the dissipation rate is approximated by physical reasoning and mathematical equations. Therefore, it has high physical reliability. The k–ε is a classical two-equation turbulence model, and the transport equation of turbulent kinetic energy k and dissipation rate ε is as follows [34,35,36]:
where Gk is the turbulent kinetic energy caused by the average velocity gradient; Gb is the generation term of turbulent kinetic energy due to the buoyancy effect; YM is the effect of compressible turbulent pulsation expansion on the total dissipation rate; σk and σε are the Prandtl number corresponding to turbulent kinetic energy and dissipation rate, respectively, and C1ε, C2ε, and C3ε are the empirical constants.
The standard k–ε model is widely used in the calculation of turbulent flow fields because of its high accuracy, high economy, and high stability. The model regards the disordered fluid flow mode as the homogeneous turbulence mode of all phases. The research object in this paper conforms to the characteristics of turbulence isotropy, and the model has good stability and accuracy, which can meet the needs of the numerical calculation.
3. Numerical Model Implementation
3.1. Numerical Model
In the working process of the gearbox, the power loss caused by gear rotation accounts for about 80% of the whole power loss. The high-speed rotation of the gear mainly causes the change in the heat flow field distribution in the gearbox. The numerical calculation was based on the ANSYS 15.0 commercial software. To save simulation time and costs, this paper analyzes the transmission lubrication system by studying the heat flow field distribution and the lubrication effect of two pairs of meshing gears.
This paper also simplified the gearbox model appropriately. The original complex gearbox was simplified into a cuboid model based on retaining the original box length, width, and height characteristics. The three-dimensional model of transmission lubrication is shown in Figure 2. The multiphase fluid domain was divided by the tetrahedral grid, and the number of the total mesh was 453,426. The mesh quality was adjusted to the highest specification (above 0.8) that could meet the transient calculation accuracy. To facilitate the distinction, the differential gear was named the G1 gear, the fixed pinion gear was named the G2 gear, the fixed pinion gear was named the G3 gear, and the planetary gear was named the G4 gear. As the input shaft of the transmission of the electric vehicle is the planetary gear shaft, gear G4 starts to rotate in the working process of the transmission, then drives the gears G2 and G3 in the same intermediate shaft to rotate. Finally, gear G2 drives gear G1, so G4 is the driving gear of the transmission system. The basic geometric parameters of the gears is listed in Table 1.
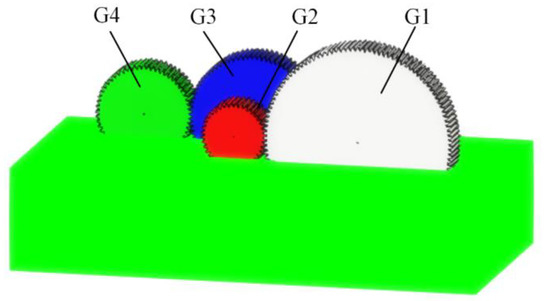
Figure 2.
Three-dimensional model of transmission lubrication.

Table 1.
The basic geometric parameters of the gears.
3.2. Boundary Conditions and Initial Conditions
Before the simulation starts, the relevant boundary conditions need to be defined. The main boundary conditions include oil and gas parameters in the box, gear speed, gear steering, gear oil immersion depth, etc. Table 2 lists the oil and gas parameters in the container. The immersion depth of the stirring lubrication model was 25 mm, and the gear speed was 1000 rad/min, rotating in the counterclockwise direction.
Table 2.
The basic parameters of the air and lubricating oil.
During the working process of the gearbox, the high-speed rotation of the gear in the box will cause dramatic changes in the flow field space. The volume grid units in the flow field will constantly change shape with the changes in the flow field. Suppose the grid is not processed in real-time. In this case, large area deformation of the grid may occur quickly, affecting the calculation accuracy and even terminating the calculation. To ensure the normal simulation calculation, the fluid mesh limit distortion value should be set before the simulation starts. Once the fluid mesh approaches the distortion value, dynamic mesh technology is used to reconstruct it to ensure that the mesh quality can support the uninterrupted operation of the simulation. In this paper, the elastic smoothing and mesh reconstruction methods were combined with monitoring the degree of mesh deformation in the fluid domain. The mesh close to the deformation limit was updated in real-time to ensure the accuracy and stability of the simulation solution.
According to the mathematical model, numerical model, and boundary conditions, the flow field was initialized, and an incompressible pressure base solver was used to solve the fluid governing equation. The pressure staggering option (PRESTO) method discretizes and interpolates the pressure to prevent large pressure fluctuations and high swirling flow in the flow field [37,38,39]. The pressure implicit split operator (PISO) algorithm was adopted for coupled processing of pressure and velocity to ensure the efficiency of numerical convergence [40]. Finally, a second-order upwind scheme dealt with the momentum and rotation velocity to obtain accurate solutions [40,41,42,43,44].
4. Numerical Simulation Results
4.1. Dynamic Evolution of Lubrication
The velocity distribution diagram of the oil phase was obtained to study the dynamic evolution process of the lubrication flow field, as shown in Figure 3. The blue part shows the oil distribution in the tank.
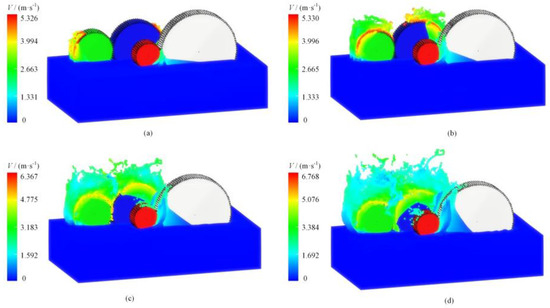
Figure 3.
The dynamic evolution process of the lubrication flow field. (a) t = 0.02 s; (b) t = 0.04 s; (c) t = 0.06 s; (d) t = 0.08 s.
As can be seen from the figure, the lubricating oil was stirred with the rotation of the G3 and G4 gears. Since the speed of the G1 gear was much lower than that of the G4 gear, the lubricating oil at the G1 and G2 gears had not been stirred. At t = 0.02 s, the lubricating oil at the G1 and G2 gears began to stir, and a small part of the lubricating oil entered the gear meshing. The lubricating oil continued to move along the direction of gear rotation during t = 0.02 s~0.04 s, and the height of the stirred oil gradually increased with time. During t = 0.04 s~0.06 s, part of the lubricating oil at the G4 gear end started to break away from the tooth surface and rushed to the top of the box under the high-speed rotating gear. The lubricating oil around the box was also gradually stirred. During t = 0.06 s~0.08 s, part of the lubricating oil at the G3 gear end started to break away from the tooth surface and rushed to the top of the box, and the amount of agitated oil around the box body gradually increased. The lubricating oil between the G1 and G2 gears was stirred, however, due to the low gear speed, the height of the lubricating oil stirred up was limited.
During the working process of the gearbox, the temperature of the gear meshing zone is much higher than that of other areas. If the oil cannot fully lubricate the meshing zone, the temperature of the meshing zone will be quickly transferred to the rest of the components in the box. This will lead to a sharp rise in the box’s overall temperature, which greatly impacts the gear’s overall transmission efficiency. Therefore, oil lubrication on the gear meshing zone is a necessary standard to judge the lubrication quality. After entering the steady state, the oil quantity of each gear meshing zone has a strong representative, which can be used as an essential index to evaluate the lubrication effect of the gear under different working conditions. Therefore, this paper intends to evaluate the lubrication effect by evaluating the oil distribution of the gear meshing zone in the box at the steady state time.
Figure 4 shows the oil distribution cloud diagram of the gear meshing area during lubrication. As seen in Figure 4, the amount of oil in the gear meshing zone of G3 and G4 was rich and evenly distributed. The amount of oil in the gear meshing zone of G1 and G2 was slightly less than that in the gear meshing zone of G3 and G4 due to the influence of gear steering. Still, the distribution was relatively uniform, and sufficient oil was distributed on the tooth surface of each tooth. Therefore, the lubricating oil could thoroughly lubricate the gear meshing area.
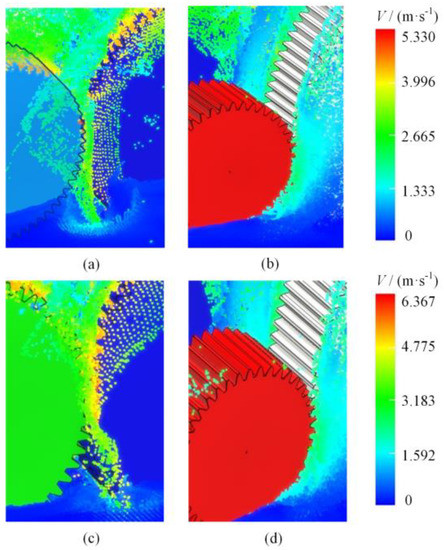
Figure 4.
The oil distribution cloud diagram of the gear meshing area during lubrication. (a) t = 0.04 s; (b) t = 0.04 s; (c) t = 0.06 s; (d) t = 0.06 s.
4.2. Basic Characteristics of the Flow Field
The high-speed rotation of the internal gear will drive the lubricating oil and air inside the box to move together. Because the lubricating oil and air inside the box initially do not have kinetic and potential energy, it belongs to passive motion. In the passive motion process, specific resistance will be generated to hinder the rotation of the gear. The resistance moment changes of the four gears are monitored, and real-time resistance moment values are output, as shown in Figure 5.
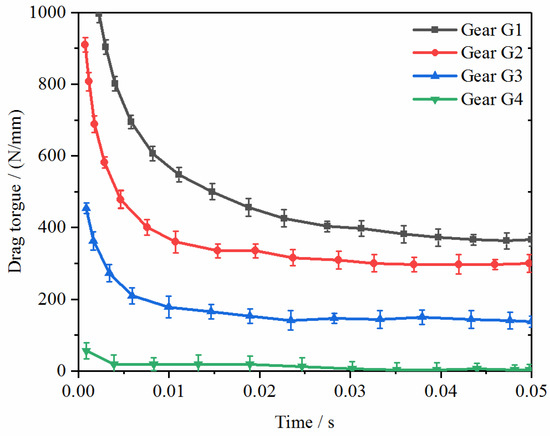
Figure 5.
The resistance moment changes of the four gears.
Due to lubricating oil being deposited at the bottom of the transmission in the initial stage, part of the gears is immersed in lubricating oil. Aside from air resistance, the rotation of the gears also needs to overcome the oil resistance brought by the lubricating oil, so the resistance moment of the gears is relatively large. Driven by the rotating gear, the oil gradually begins to spill out of the gear to the rest of the parts in the box. Oil is significantly less deposited at the bottom of the box, and the depth of the gear oil is also significantly reduced. Hence, the rotation of the gear needed to overcome the stirring resistance will be significantly reduced. After t = 0.04 s, the fluid movement in the gearbox gradually tends to be stable, and the resistance moment does not change significantly.
Figure 6 shows the tank’s lubricating oil and surface temperature rise. Here, the initial heat source of the temperature field simulation is input to ensure that the heat generated by the heat source can raise the transmission gear temperature. As seen from the figure, the tank’s temperature increased linearly at the beginning of the moving process. Subsequently, the temperature of the box tended to stabilize. The temperature of stirring oil increased linearly with the process of stirring. In the working process of the gearbox, high-speed rotation of the gears, meshing friction, and overcoming fluid work will release a lot of heat. Heat accumulation will lead to a rapid rise in temperature inside the gearbox in a short time. The high temperature in the box will not only affect the transmission efficiency of the gear but also increase the failure rate in the working process of the gear, thus causing damage to the gear and the box.
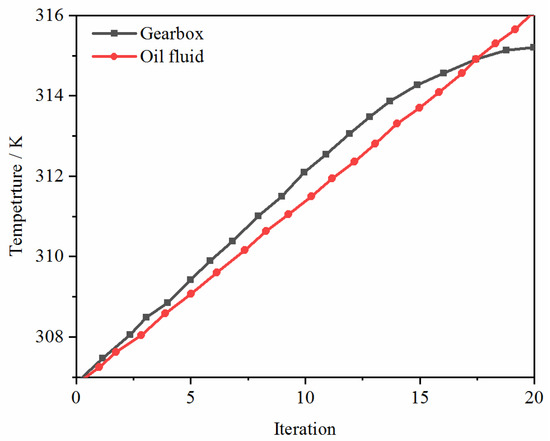
Figure 6.
A temperature rise in the tank’s lubricating oil and the tank’s surface.
4.3. Heat Flow Field at Different Speeds/Steering
Speed/steering is essential in studying thermal flow coupling and power loss of the gears. It is of great significance to study the influence of speed/steering on the lubrication performance of transmission during the working process of electric vehicle transmission lubrication. Gear speed refers to the speed of the input shaft of the transmission, that is, the corresponding G4 gear speed. Gear steering refers to the input shaft steering of the transmission, that is, it corresponds to the rotation direction of the G4 gear. Figure 7 shows the resistance moment histograms of each gear under different speed/steering conditions.
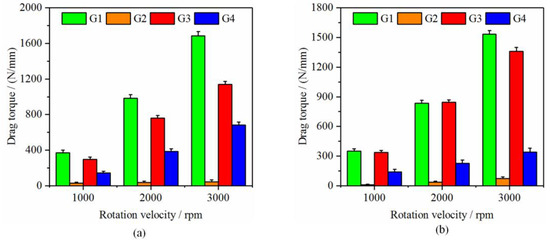
Figure 7.
The resistance moment histograms of each gear under different speed/steering conditions. (a) Anticlockwise rotation; (b) clockwise rotation.
When the gearbox starts to work, the lubricating oil distribution in the box is relatively chaotic, resulting in the overall resistance moment value of the gear fluctuating wildly. As time goes by, the lubricating oil in the box gradually becomes stable, and the power loss in the box gradually tends to be stable. Generally, the flow field in the box begins to enter the steady state after 0.04 s, and the fluctuation of the resistance moment gradually decreases and slightly oscillates around the steady-state average. The steady-state resistance moment value (after 0.04 s) was used to calculate the mean value of the resistance moment after 0.04 s, and the bar chart is shown in Figure 7. From the figure, it can be seen that when the rotation direction of the gear was the same, the gear’s resistance moment increased with the rotational speed, and then the power loss of the gear increased. The above characteristics agree with the numerical results of Mo et al. [45]. When the other conditions remained the same, only the gear steering was different, the gear resistance moment changed little, and the overall power loss of the transmission system was not different. Therefore, it can be concluded that the gear speed significantly impacts the power loss of the transmission system, but the steering does not impact the power loss.
In Figure 8a, when the speed of the gear was low, the temperature of the counterclockwise rotation of the gear was significantly higher than that of clockwise rotation. Under low speed, the temperature difference between the box and the lubricating oil was insignificant, showing a uniform increase trend. In Figure 8b, when the rotational speed increased, the temperature variation trend of the box under the counterclockwise and clockwise rotation of the gear was the same, and the temperature difference was not significant. However, when the gear was turned counterclockwise, the temperature of the lubricating oil was not much different from that of the clockwise gear at the beginning. With the evolution of the flow field, the temperature difference increased continuously.
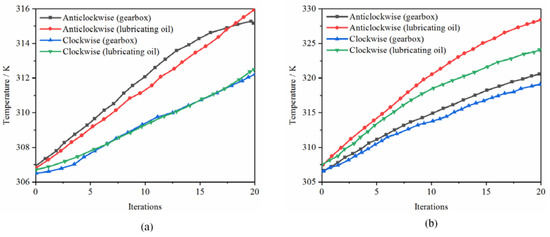
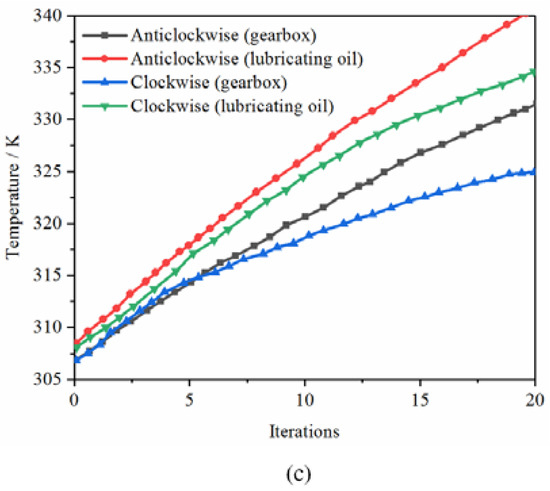
Figure 8.
Comparison of gear steering temperature appreciation under different rotation velocities: (a) 1000 rpm; (b) 2000 rpm; (c) 3000 rpm.
In Figure 8c, when the gear speed increased further, regardless of how the gear rotated, the temperature of the lubricating oil was greater than that of the box. However, the temperature difference of the box increased under counterclockwise rotation. With the increase in gear speed, the gearbox box’s maximum surface temperature and the lubricating oil’s temperature increased significantly. Table 3 shows the comparison of temperature appreciation under different gear rotation conditions. It can be seen that when the rotation direction of the gear is different, the overall temperature rise in the transmission under the anticlockwise rotation condition of the G4 gear was significantly higher than that under the clockwise rotation condition of the G4 gear.
Table 3.
Comparison of the gear steering temperature appreciation.
5. Conclusions
Research on the evolution process and thermal transfer features of electric vehicle transmission lubrication are of great significance for improving the service life and reducing power loss. This paper proposed a dynamic modeling and solving method for the lubrication oil field of the gear meshing process, and the dynamic evolution law and thermal transfer features under different speeds/steering were obtained. The following conclusions were obtained.
- (1)
- A VOF-PLIC modeling and solving method of the gear lubrication and thermal transfer process is presented. The lubricating oil fully lubricates the gear meshing zone, and the lubricating oil is evenly distributed in the meshing zone. As the gear speed increases, the oil resistance overcome by the gear rotation becomes smaller and smaller until it reaches a steady state.
- (2)
- For the thermal transfer process, when the temperature of the gear meshing regions is higher, the gear will release more heat in the working process, resulting in a linear increase in the box temperature at the beginning stage. The temperature of stirring oil increases linearly with the process of stirring.
- (3)
- With the increase in the rotational speed, the resistance moment of the gear increases, and the power loss of the gear increases. As the gear speed rises, the gear box’s maximum temperature and lubricating oil temperature increase significantly, and the overall temperature rises considerably under the counterclockwise rotation condition.
In summary, the main contribution of this paper is the proposal of a dynamic modeling and solving method for the hot fluid field of gear meshing lubrication. It can supply a helpful reference for research on dynamic analysis and the thermal transfer process of automobile transmission lubrication and has general engineering value for the transmission tooth profile design and lubrication optimization. Subsequent studies will explore facets of the multiphase coupled mechanism and fractal dimensions of the lubrication flow pattern and fluid-solid vibration characteristics of the gear meshing lubrication.
Author Contributions
Conceptualization, Y.G. and G.Z.; Article identification, screening, retrieval, selection, and analysis, G.Z. and Y.G.; Formal analysis and investigation, Y.G. and G.Z.; Writing—original draft preparation, Y.G.; Tables and figures generation, Y.G.; Review and editing, G.Z. and Y.G.; Supervision, Y.G. All authors have read and agreed to the published version of the manuscript.
Funding
This research received no external funding.
Institutional Review Board Statement
Not applicable.
Informed Consent Statement
Not applicable.
Data Availability Statement
Not applicable.
Conflicts of Interest
The authors declare that they have no conflict of interest.
Nomenclature
| C1ε | Empirical constant |
| C2ε | Empirical constant |
| C3ε | Empirical constant |
| fF | Heat flow vector |
| g | Gravitational acceleration |
| Gb | Generation term of turbulent kinetic energy due to the buoyancy effect |
| Gk | Turbulent kinetic energy caused by the average velocity gradient |
| mij | Mass transport of the two-phase fluids |
| S | Source items of the αi |
| q | Heat distribution function of unit mass in unit time |
| u | Velocity vector |
| U | Change in the internal energy of the fluid per unit time |
| vi | Velocity of phase i |
| YM | Effect of compressible turbulent pulsation expansion on the total dissipation rate |
| αi | Volume fraction of phase i |
| τ | Viscous stress |
| ε | Dissipation rate |
| λ | Second viscosity |
| η | Fluid domain |
| μ | Dynamic viscosity |
| μt | Turbulent viscosity coefficient |
| ρi | Fluid density of phase i |
| σk | Prandtl number of turbulent kinetic energy k |
| σε | Prandtl number of dissipation rate ε |
References
- Yazdani, M.; Soteriou, M.C. A novel approach for modeling the multiscale thermo-fluids of geared systems. Int. J. Heat Mass Transf. 2014, 72, 517–530. [Google Scholar] [CrossRef]
- Fernandes, C.M.C.G.; Rocha, D.M.P.; Martins, R.C. Finite element method model to predict bulk and flash temperatures on polymer gears. Tribol. Int. 2018, 120, 255–268. [Google Scholar] [CrossRef]
- Li, L.; Lu, B.; Xu, W.X.; Gu, Z.H.; Yang, Y.S.; Tan, D.P. Mechanism of multiphase coupling transport evolution of free sink vortex. Acta Phys. Sin. 2023, 72, 034702. [Google Scholar] [CrossRef]
- Ji, Z.; Stanic, M.; Hartono, E.A. Numerical simulations of oil flow inside a gearbox by Smoothed Particle Hydrodynamics (SPH) method. Tribol. Int. 2020, 127, 47–58. [Google Scholar] [CrossRef]
- Li, L.; Xu, W.X.; Tan, Y.F.; Yang, Y.S.; Yang, J.G.; Tan, D.P. Fluid-induced vibration evolution mechanism of multiphase free sink vortex and the multi-source vibration sensing method. Mech. Syst. Signal Process. 2023, 189, 110058. [Google Scholar] [CrossRef]
- Simon, V.V. Improvements in the mixed elastohydrodynamic lubrication and in the efficiency of hypoid gears. Proc. Inst. Mech. Eng. Part J. Eng. Tribol. 2020, 234, 795–810. [Google Scholar] [CrossRef]
- Li, L.; Fang, H.; Yin, Z.C.; Wang, T.; Wang, R.H.; Fan, X.H.; Zhao, L.J.; Tan, D.P.; Wan, Y.H. Lattice Boltzmann method for fluid-thermal systems: Status, hotspots, trends and outlook. IEEE Access 2020, 8, 27649–27675. [Google Scholar] [CrossRef]
- Li, L.; Gu, Z.H.; Xu, W.X.; Tan, Y.F.; Fan, X.H.; Tan, D.P. Mixing mass transfer mechanism and dynamic control of gas-liquid-solid multiphase flow based on VOF-DEM coupling. Energy 2023, in press. [Google Scholar]
- Concli, F.; Gorla, C. Numerical modeling of the power losses in geared transmissions: Windage, churning and cavitation simulations with a new integrated approach that drastically reduces the computational effort. Tribol. Int. 2016, 103, 58–68. [Google Scholar] [CrossRef]
- Liu, H.; Jurkschat, T. Determination of oil distribution and churning power loss of gearboxes by finite volume CFD method. Tribol. Int. 2019, 109, 348–354. [Google Scholar] [CrossRef]
- Pallas, S.; Marchesse, Y.; Changenet, C. A windage power loss model based on CFD study about the volumetric flow rate expelled by spur gears. Mech. Ind. 2012, 13, 317–323. [Google Scholar] [CrossRef]
- Seetharama, S.; Kahraman, A. Load-Independent Spin Power Losses of a Spur Gear Pair: Model Formulation. J. Tribol. 2009, 131, 022202. [Google Scholar] [CrossRef]
- Lemfeld, F.; Fran, K.; Unger, J. Numerical simulations of unsteady oil flows in the gearboxes. J. Appl. Sci. Thermodyn. Fluid Mech. 2007, 1, 1–5. [Google Scholar]
- Diab, Y.; Ville, F. Experimental and Numerical Investigations on the Air-Pumping Phenomenon in High-Speed Spur and Helical Gears. Mech. Eng. Sci. 2005, 219, 785–800. [Google Scholar] [CrossRef]
- Gorla, C.; Concli, F.; Stahletal, K. Hydraulic losses of a gearbox: CFD analysis and experiments. Tribol. Int. 2013, 66, 337–344. [Google Scholar] [CrossRef]
- Yin, Z.C.; Ni, Y.S.; Li, L.; Wang, T.; Wu, J.F.; Li, Z.; Tan, D.P. Numerical modelling and experimental investigation of a two-phase sink vortex and its fluid-solid vibration characteristics. J. Zhejiang Univ.-Sci. A 2022, in press. [Google Scholar]
- Tan, D.P.; Li, L.; Yin, Z.C.; Li, D.F.; Zhu, Y.L.; Zheng, S. Ekman boundary layer mass transfer mechanism of free sink vortex. Int. J. Heat Mass Transf. 2020, 150, 119250. [Google Scholar] [CrossRef]
- Ge, J.Q.; Ren, Y.L.; Li, C.; Li, Z.A.; Yan, S.T.; Tang, P.; Xu, X.S.; Wang, Q. Ultrasonic coupled abrasive jet polishing (UC-AJP) of glass-based micro-channel for micro-fluidic chip. Int. J. Mech. Sci. 2023, in press. [Google Scholar] [CrossRef]
- Li, L.; Qi, H.; Yin, Z.C.; Li, D.F.; Zhu, Z.L.; Tangwarodomnukun, V.; Tan, D.P. Investigation on the multiphase sink vortex Ekman pumping effects by CFD-DEM coupling method. Powder Technol. 2019, 360, 462–480. [Google Scholar] [CrossRef]
- Li, L.; Lu, B.; Xu, W.X.; Li, Q.H.; Wu, J.F.; Ni, Y.S.; Tan, D.P. Fluid-induced vibration transition behaviors and sensing platform of the multiphase sink vortex. Energy 2023, in press. [Google Scholar]
- Li, H.X.; Wang, Q.; Lei, H. Mechanism analysis of free-surface vortex formation during steel Teeming. ISIJ Int. 2014, 54, 1592–1600. [Google Scholar] [CrossRef]
- Li, L.; Tan, D.P.; Yin, Z.C.; Wang, T.; Fan, X.H.; Wang, R.H. Investigation on the multiphase vortex and its fluid-solid vibration characters for sustainability production. Renew. Energy 2021, 175, 887–909. [Google Scholar] [CrossRef]
- Tan, D.P.; Li, L.; Zhu, Y.L.; Zheng, S.; Ruan, H.J.; Jiang, X.Y. An embedded cloud database service method for distributed industry monitoring. IEEE Trans. Ind. Inform. 2018, 14, 2881–2893. [Google Scholar] [CrossRef]
- Tan, Y.F.; Ni, Y.S.; Wu, J.F.; Li, L.; Tan, D.P. Machinability evolution of gas-liquid-solid three-phase rotary abrasive flow finishing. Int. J. Adv. Manuf. Technol. 2023, in press. [Google Scholar] [CrossRef]
- Li, L.; Yang, Y.S.; Xu, W.X.; Lu, B.; Gu, Z.H.; Yang, J.G.; Tan, D.P. Advances in the multiphase vortex-induced vibration detection method and its vital technology for sustainable industrial production. Appl. Sci. 2022, 12, 8538. [Google Scholar] [CrossRef]
- Li, L.; Tan, D.P.; Wang, T.; Yin, Z.C.; Fan, X.H.; Wang, R.H. Multiphase coupling mechanism of free surface vortex and the vibration-based sensing method. Energy 2021, 216, 119136. [Google Scholar] [CrossRef]
- Zheng, G.A.; Gu, Z.H.; Xu, W.X.; Li, Q.H.; Tan, Y.F.; Wang, C.Y.; Li, L. Gravitational surface vortex formation and suppression control: A review from hydrodynamic characteristics. Processes 2023, 11, 42. [Google Scholar] [CrossRef]
- Sun, Z.; Jin, H.; Xu, Y. Severity-insensitive fault diagnosis method for heat pump systems based on improved benchmark model and data scaling strategy. Energy Build. 2022, 256, 111733. [Google Scholar] [CrossRef]
- Ghani, I.A.; Sidik, N.A.C.; Kamaruzaman, N. Hydrothermal performance of microchannel heat sink: The effect of channel design. Int. J. Heat Mass Transf. 2017, 107, 21–44. [Google Scholar] [CrossRef]
- Yin, Z.C.; Wan, Y.H.; Fang, H.; Li, L.; Wang, T.; Wang, Z.; Tan, D.P. Brain-computer interfaces: Trends and outlook. Appl. Intell. 2022, in press. [Google Scholar] [CrossRef]
- Zhang, K.K.; Chan, K.H.; Liao, X.H. Asymptotic theory of resonant flow in a spheroidal cavity driven by latitudinal libration. J. Fluid Mech. 2012, 692, 420–445. [Google Scholar] [CrossRef]
- Li, L.; Li, Q.H.; Ni, Y.S.; Wang, C.Y.; Tan, Y.F.; Tan, D.P. Critical penetrating vibration evolution behaviors of the gas-liquid coupled vortex flow. Energy 2023, in press. [Google Scholar]
- Ruan, Y.W.; Yao, Y.; Shen, S.Y. Physical and mathematical simulation of surface-free vortex formation and vortex prevention design during the end of casting in tundish. Steel Res. Int. 2020, 91, 1900616. [Google Scholar] [CrossRef]
- Li, L.; Lu, B.; Xu, W.X.; Wang, C.Y.; Wu, J.F.; Tan, D.P. Dynamic behaviors of multiphase vortex-induced vibration for hydropower energy conversion. Energy 2023, in press. [Google Scholar]
- Mulligan, S.; De Cesare, G.; Casserly, J.; Sherlock, R. Understanding turbulent free-surface vortex flows using a Taylor-Couette flow analogy. Sci. Rep. 2018, 8, 824. [Google Scholar] [CrossRef]
- Duinmeijer, A.; Clemens, F. An experimental study on the motion of buoyant particles in the free-surface vortex flow. J. Hydraul. Res. 2021, 59, 947–962. [Google Scholar] [CrossRef]
- Wei, N.; Sun, W.T.; Meng, Y.F.; Liu, A.Q.; Zhao, J.Z.; Zhou, S.W.; Zhang, L.H.; Li, Q.P. Multiphase non equilibrium pipe flow behaviors in the solid fluidization exploitation of marine natural gas hydrate reservoir. Energy Sci. Eng. 2019, 6, 760–782. [Google Scholar] [CrossRef]
- Song, S.L.; Zhao, Q.B.; Chong, D.T.; Chen, W.X.; Yan, J.J. Numerical simulation of vortex in residual heat removal system during mid-loop operation. Nucl. Eng. Des. 2018, 337, 428–438. [Google Scholar] [CrossRef]
- Ezure, T.; Ito, K.; Tanaka, M.; Ohshima, H.; Kameyama, Y. Experiments on gas entrainment phenomena due to free surface vortex induced by flow passing beside stagnation region. Nucl. Eng. Des. 2019, 350, 90–97. [Google Scholar] [CrossRef]
- Tan, D.P.; Li, P.Y.; Ji, Y.X.; Wen, D.H.; Li, C. SA-ANN-based slag carry-over detection method and the embedded WME platform. IEEE Trans. Ind. Electron. 2013, 60, 4702–4713. [Google Scholar] [CrossRef]
- Yang, Y.; Bashir, M.; Li, C.; Michailides, C.; Wang, J. Mitigation of coupled wind-wave-earthquake responses of a 10 MW fixed-bottom offshore wind turbine. Renew. Energy 2020, 157, 1171–1184. [Google Scholar] [CrossRef]
- Wang, C.; Hu, B.; Zhu, Y.; Wang, X.L.; Luo, C.; Cheng, L. Numerical Study on the Gas-Water Two-Phase Flow in the Self-Priming Process of Self-Priming Centrifugal Pump. Processes 2019, 7, 330. [Google Scholar] [CrossRef]
- Chakraborty, A.; Ghose, J.; Chakraborty, S.; Chakraborty, B. Vision-based detection system of slag flow from ladle to tundish with the help of the detection of undulation of slag layer of the tundish using an image analysis technique. Ironmak. Steelmak. 2021, 49, 10–15. [Google Scholar] [CrossRef]
- Zheng, G.A.; Shi, J.L.; Li, L.; Li, Q.H.; Gu, Z.H.; Xu, W.X.; Lu, B. Fluid-solid coupling-based vibration generation mechanism of the multiphase vortex. Processes 2023, in press. [Google Scholar]
- Mo, S.; Zou, Z.X.; Feng, Z.Y.; Dang, H.Y.; Gao, H.J.; Ca, X.L. Research on lubrication characteristics of asymmetric helical gear based on CFD method. Lubr. Sci. 2020, 32, 14–28. [Google Scholar] [CrossRef]
Disclaimer/Publisher’s Note: The statements, opinions and data contained in all publications are solely those of the individual author(s) and contributor(s) and not of MDPI and/or the editor(s). MDPI and/or the editor(s) disclaim responsibility for any injury to people or property resulting from any ideas, methods, instructions or products referred to in the content. |
© 2023 by the authors. Licensee MDPI, Basel, Switzerland. This article is an open access article distributed under the terms and conditions of the Creative Commons Attribution (CC BY) license (https://creativecommons.org/licenses/by/4.0/).