Abstract
Xenobiotics, which include a wide range of synthetic chemicals and compounds, have become a significant threat to water quality and biodiversity. The need for innovative and sustainable solutions to mitigate the impact of pollutants on our ecosystems has become a hot topic of numerous discussions and research. One such solution lies in the potential application of simulated solar radiation and hydrogen peroxide to remove pesticides from aqueous solutions. In this paper, we investigated the possibility of removing selected pesticides (acetamiprid, clothianidin, and thiacloprid) under the influence of simulated solar radiation with and without the presence of hydrogen peroxide (H2O2). The influence of pH value and H2O2 concentration on removal and toxicity before and after photolytic removal was examined. The results showed that clothianidin is almost completely removed (94.80–96.35%) after 5 h under the influence of simulated solar radiation, while thiacloprid and acetamiprid confirm their persistence and resistance to photolytic degradation. The addition of H2O2 leads to the removal of all three pesticides and results in a significant acceleration of the degradation process itself and the removal of the individual pesticides already within 2 h. According to the data obtained, the k values obtained in the paper follow the following trend: clothianidin > thiacloprid > acetamiprid.
1. Introduction
In our modern world, the production and use of xenobiotics, chemical compounds previously unknown to the biosphere and mainly of anthropogenic origin, have raised serious concerns about environmental sustainability. Xenobiotics include a wide range of chemicals, including pesticides, personal care products, food additives, dyes, disinfectants, and more. Although not all xenobiotics are toxic, their entry into the environment through daily use represents an alarming challenge. Their direct entry into the environment and their incomplete removal in wastewater treatment plants (WWTPs) pose a threat to the ecosystem and human health. Xenobiotics are also classified as so-called emerging contaminants or micropollutants, and more recently they have also been called contaminants of emerging concern (CECs) [1,2,3,4,5].
The use of pesticides, especially those from the neonicotinoid group, has become a common practice to protect agricultural crops from insects. However, despite its effectiveness, this approach conflicts with the principles of green chemistry, ecological food production, and the global imperative to reduce pollution to zero. Properties such as toxicity, accumulation, and persistence make pesticides the most dangerous group of chemicals to which the human body is exposed. Due to their direct application in the environment and under the influence of atmospheric conditions, pesticides easily enter water reservoirs and significantly affect water quality. However, they are irreplaceable for the mass production of food, and this is absolutely necessary as the number of people on Earth is already approaching eight billion. The large number of people, the use of pesticides, and the increasing demand for food, which is not evenly distributed across all parts of the world, would not be a problem if resources such as soil and potable water were not diminishing. In reality, however, there is less and less unpolluted soil and water that can be used without restriction. Of course, there are fewer and fewer such resources, but unfortunately, anthropological pollution of the environment is not limited to soil and water but also extends to air, sediment, and biota. The main problem is basically water, because municipal and industrial wastewater is discharged into the environment after treatment. A series of scientific papers several decades ago demonstrated that small molecules of xenobiotics are passed through WWTPs, and this also applies to pesticides [5,6,7,8,9,10].
In the 20th century, the use of pesticides from the neonicotinoid group was widespread because it was believed that they do not harm bees, birds, mammals, and various aquatic species and at the same time are very effective in controlling insects, i.e., they contribute to plant production by protecting agricultural crops from various insects. In the meantime, however, in its Decision (EU) 2015/495, the European Commission provided an additional list of substances to be monitored in the field of water policy pursuant to Directive 2008/105/EC of the European Parliament. This list also includes a group of neonicotinoid pesticides. It is a worrying fact that only about 5% of the active ingredient of neonicotinoid pesticides ends up on the treated plants or crops and most of the rest ends up in the environment. This fact has been confirmed in many studies, as the active ingredient of neonicotinoids has been detected in a number of non-target organisms, particularly honey bees and bumblebees, but negative effects have been found in vertebrates and humans. Indeed, neonicotinoids are extremely persistent in wastewater treatment performed by conventional wastewater treatment plants (WWTPs), as evidenced by several studies in which some of the nicotinoids were found at concentrations in the order of ng/L in surface water, even tap water. However, even at such low concentrations, neonicotinoids can have long-term negative effects on non-target organisms due to their continuous use [11,12,13,14,15,16,17,18,19]. The study of pesticides, their removal, and their transformation products is essential to assess the risks to the environment and human health, and to facilitate the development of a strategy for environmental protection and the regulation of pesticide use.
Today, various physical and chemical methods are used to remove pollutants from water, but there is no universal process that can be used with equal efficiency for all pollutants. From an energy and financial point of view, there is a tendence towards methods of removing pollutants from water that consume as little energy as possible and are financially justifiable. One of these pollutant removal techniques is photodegradation processes based on the use of UV radiation. These methods have proven to be very effective in advanced water treatment technologies for the remediation of groundwater and drinking water. The UV radiation to perform photolysis is most commonly obtained from low- and medium-pressure mercury lamps. This treatment requires the ability of the compounds to absorb light, most often the UV-C component at 254 nm, to achieve the direct photodegradation of pollutants. Specified UV light with a wavelength of 254 nm is often used for disinfection, particularly on a laboratory scale to obtain redeionized water, but also for disinfection in general [20,21,22].
Solar radiation is a permanent natural energy source that has great potential for widespread use due to its availability [23]. Photolytic degradation is an important factor influencing the fate of many organic compounds in the environment, including neonicotinoids [24]. If pollutants are soluble in water and sensitive to sunlight, photolytic decomposition can play a significant role in reducing their concentration, especially in surface waters. Because a portion of solar radiation has a wavelength corresponding to the UV range, there is an opportunity to use photo treatment systems that use sunlight and H2O2 for water treatment [25]. Common advanced oxidation processes based on UV radiation, such as UV/H2O2 combinations, are known to be effective for the degradation and mineralization of resistant pollutants due to the generation of reactive hydroxyl radicals that react with most organic compounds [11]. The use of solar radiation could solve economic and environmental problems, such as the frequent replacement of light bulbs, mercury toxicity, and the shortened lifespan with each lamp cycle [26].
Photolytic degradation of some neonicotinoids by different light sources as well as some advanced oxidation processes (AOPs) based on UV radiation have been described in the literature. The photolysis of some neonicotinoids under natural sunlight conditions has also been investigated. In addition, UV radiation at 254 nm has been described in the literature for the removal of certain neonicotinoid insecticides either by single photolysis or by a combined UV/chlorine process. The experimental conditions are still not comparable and it is necessary to verify and/or validate the implemented methods. For this reason, the photodegradation of three neonicotinoid insecticides included in the list of substances of Decision (EU) 2015/495 was investigated in this work: clothianidin (CTD), thiacloprid (TCP), and acetamiprid (AMP) [24,27,28,29].
The main goal of this work is therefore to monitor selected neonicotinoid insecticides, which are very often used and banned in many countries, during photolysis under artificial sunlight as one of the ways of their removal and to evaluate the individual reactivity of these compounds to UV irradiation. For this reason, the influence of solar radiation on their decomposition is investigated, and the Suntest CPS+ device is used for this purpose. The main advantage of this device compared to the devices used in other studies is the wide range of wavelengths. While other devices work at precisely defined wavelengths, the Suntest CPS+ offers the possibility to measure in a wider wavelength range from 300 to 800 nm. With the goal of complete mineralization, the influence of hydrogen peroxide, a very commonly used disinfectant, especially in the age of COVID-19, is also monitored. This is because we not only want to determine the possibility of its removal but we also want to determine all degradation and transformation products and determine whether the newly formed products are more toxic than the initial component. All experiments were monitored using an analytical high-performance liquid chromatograph with a diode array (HPLC-DAD), a high-performance liquid chromatograph with a UV detector and mass spectrometer (HPLC-MS), and bioanalytical (Vibrio fischeri) methods.
2. Materials and Methods
2.1. Chemicals
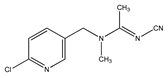
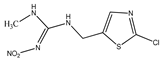
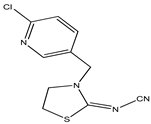
The pesticide standards tested in this work were purchased from Sigma-Aldrich, St. Louis, MO, USA. According to the supplier, the purity of the pesticides was ≥98%. The chemical structure of the tested pesticides and their physico-chemical properties are shown in Table 1. Stock solutions with a concentration of 100 mg/L were prepared in methanol. Working solutions of pesticides with an initial concentration of 10 mg/L were prepared in demineralized water. The pH values of the working solutions were corrected with NaOH and HCl solutions (0.001–1 mol/L), taking care that the added volume of the correction solution did not exceed 5% of the total volume of the reaction mixture. The pH values at which the xenobiotic removal analysis was performed were 4, 7, and 10.

Table 1.
Physico-chemical and general properties of pesticides.
Hydrogen peroxide (30.0%, w/w) was provided by GRAM-MOL d.o.o., Croatia. Yeast extract and peptone for bacterial use were purchased from Biolife (Milan, Italy), and agar was purchased from Liofilchem (Roseto degli Abruzzi, Italy). Other chemicals according to the standard required for toxicity testing (p.a. purities) were purchased from Lach-Ner (Neratovice, Czech Republic), Fischer Scientific (Loughborough, UK), and Thermo Scientific (Kandel, Germany). HPLC-grade acetonitrile and formic acid from Fisher Scientific (Loughborough, UK) were used for liquid chromatography with ultrapure water (Milli-Q water). Milli-Q water was prepared by the Millipore Simplicity UV system (Millipore Corporation, Burlington, MA, USA).
2.2. Preliminary Experiments—Direct Oxidation
To determine the effect of the direct oxidation of H2O2, the corresponding volume of 10 mg/L working solution with adjusted pH value was pipetted into the glasses, making sure that the total volume of the working solution after addition of the specified volume of H2O2 was 40 mL. To ensure the homogeneity of the solution, direct oxidation with hydrogen peroxide was carried out on IKA magnetic stirrer RT 10 mixing stands from IKA™, Germany, with the option of heating. The experiment was carried out at room temperature (22–23 °C) for 5 h with a magnetic stirrer set to 200 rpm. Samples were taken every hour and analyzed using an HPLC-DAD device. During oxidation, the glasses were protected with aluminum foil to avoid the influence of light on the removal.
2.3. Photolysis
The influence of solar radiation on the photolytic stability of pesticides was investigated using simulated solar radiation, i.e., the Suntest CPS+ device (Atlas, Linsengericht, Germany). The device contains a xenon lamp that emits a broad spectrum of electromagnetic radiation similar to solar radiation. Quartz vials with contents were exposed to simulated solar radiation using a Suntest CPS+ device to determine the effect of photolysis with and without H2O2. The working solutions with adjusted pH values were transferred to quartz containers, making sure that the total volume of the working solution was 40 mL after adding the specified amount of hydrogen peroxide. The parameters of the device were constant and were the following: temperature: 25 °C, exposure time: up to 5 h, and irradiation intensity: 500 W/m2.
When analyzing the effects of photolysis in the Suntest Atlas CPS+ device without and with H2O2, samples were taken at the time intervals indicated in Table S1 and analyzed by HPLC-DAD.
The photolysis rate (r) was calculated according to the equation:
where c0 is the initial concentration of the pesticide and ct is the residual concentration at time t [30]. By processing the data, the coefficients of the pesticide degradation rate (k) and half-life (t1/2) were calculated according to the following equations:
2.4. Experimental Design
As the removal of the pesticides was not complete in the preliminary tests, it was decided to carry out a removal test under the influence of hydrogen peroxide and simulated solar radiation, taking into account the test values given in Table 2.
Table 2.
Factors and levels estimated for pesticide removal using simulated solar radiation and H2O2.
The aim is to analyze the effects of pH values and the initial concentration of H2O2 on elimination after 5 h of treatment (experimental response). The development of the plan and the statistical analysis were carried out using the Design Expert 7.0 software package. The same numerical variables at three equal levels were used for all experiments.
2.5. Chemical Analysis
HPLC-DAD and HPLC-MS were used to analyze pesticide removal.
The analysis and quantification of a portion of the samples was performed with an HPLC-DAD Varian ProStar 500 (Palo Alto, CA, USA) as described in Babić et al. [31]. An InertSustain C18 column (GL Sciences, Tokyo, Japan) was used for the analysis. The dimensions of the column are 250 mm × 4.6 mm, and the particle size is 5 μm. The sample injection volume is 30 μL, and the temperature is 20 to 25 °C. Before and after analyzing the samples, the column was washed for one hour with 65% acetonitrile at a flow rate of 0.5 mL/min. The mobile phase used for the chromatographic separation consisted of solvent A (0.01% formic acid in water) and eluent B (0.01% formic acid in acetonitrile) with gradient elution. The flow rate of the mobile phase was 0.5 mL/min. The elution started with a 2.3 min linear gradient from 100% A to 8% B, followed by a 3.7 min linear gradient to 10% B, a 5 min linear gradient to 30% B, a 4 min linear gradient to 60% B, and finally a 3 min linear gradient to 95% B, which was maintained for 10 min, followed by a 0.1 min linear gradient back to the initial conditions.
The high-performance liquid chromatograph LC-20ADXR with an SPD-20AV UV detector and LCMS 2020 mass spectrometer, manufactured by Shimadzu, Kyoto, Japan, was the second instrument that was used to analyze part of the samples studied. It consists of an LC-20ADXR binary pump, a SIL-20AC XR thermostated autosampler, and a CTO-20AC thermostated housing (Shimadzu, Kyoto, Japan). The analysis was performed under the same conditions as the second gradient method described above. Elution started with a 7 min linear gradient from 40% B to 60% B, followed by a 2 min linear gradient to 90% B, a 7 min linear gradient to 95% B, a 2 min linear gradient back to initial conditions, and maintenance for 2 min.
The chromatograms were recorded at wavelengths of 241, 245, and 265 nm. The limit of detection (LOD) in demineralized water was 0.05 mg/L and the limit of quantification (LOQ) was 0.1 mg/L.
2.6. Toxicity
Toxicity tests were performed according to the standard bioluminescent method ISO 11348-1 [32] using fresh Vibrio fischeri bacteria; the method was previously described in the paper by Babić et al. [31]. Lyophilized bacteria were obtained from Hach Lange (Luminiscent bacteria test LCK 484, Düsseldorf, Germany) and a fresh bacterial mass was prepared from them on a microbial growth medium. A freshly prepared Vibrio fischeri bacterium was used for further measurements.
The bacterial luminescence measurements were carried out with a LUMIStox 300 Hach Lange instrument (Berlin, Germany), which was used with a thermostated LUMIStherm block to incubate the bacteria. The instrument complies with the technical requirements of DIN 38412 L34/L341 [33] as well as the international standard ISO 11348-1 [32].
Luminescence was monitored initially and after 30 min as a parameter indicating toxicity or inhibition. All measurements were performed at an operating temperature of the device of 15 ± 1 °C. The geometric sequence with 2% NaCl solution was used to prepare the dilutions and measurements.
3. Results and Discussion
3.1. Photolysis and Toxicity
3.1.1. Acetamiprid
Direct photolysis depends largely on the decade molar absorption coefficient of the compound at a given wavelength [34]. Acetamiprid shows a remarkable absorption maximum at 220–260 nm (Figure S1), but it exhibits no absorption above 290 nm, so direct photolysis is not expected. For this reason, in a previous study, ACE was declared as the least photosensitive neonicotinoid in the group of five neonicotinoids (thiamethoxam, imidacloprid, clothianidin, thiacloprid, and acetamiprid) [11]. This was also demonstrated in this research, in which ACE was found to be photolytically stable during a 5 h exposure to simulated solar radiation, as shown in Figure 1.
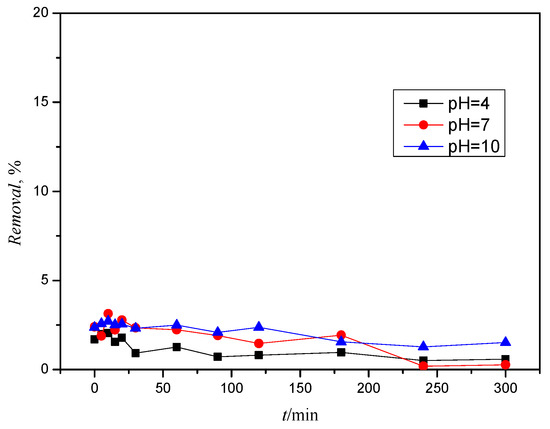
Figure 1.
Removal of acetamiprid during 5 h of solar radiation at different pH values.
Studies have shown that the stability of certain pesticides under prolonged irradiation may be related to the chemical structure of the compound, so that pesticides with a cyanoimine functional group such as ACE have greater stability [11].
Removal was studied at three pH values, but no pKa values are available for ACE (see Table 1), so only undissociated forms are present throughout the pH range of the operation.
That ACE is not subject to photolytic degradation can also be seen in Figure S2, where a comparison of the ACE chromatogram for pH = 4 recorded for the initial solution with a concentration of 10 mg/L with the ACE chromatogram after 5 h of exposure to solar radiation shows that there are no significant changes in concentration, which is consistent with previous studies. Li et al. [35] showed that ACE was not photolytically degraded under the influence of stimulated sunlight and a UV-A lamp, whereas it was completely degraded after 150 min with a UV-C lamp. The wavelength of the emitted radiation played a significant role here, with the UV-A lamp emitting radiation with a wavelength of 310–400 nm, while the UV-C lamp emits radiation of 100–280 nm. ACE can absorb photons in UV radiation with a wavelength of 254 nm, which is in good agreement with the UV spectrum of the ACE solution, and the good removal at 254 nm was confirmed by previous studies [11,34].
The influence of photolysis on the toxicity of pesticides, i.e., the influence of potentially occurring degradation or transformation products, was examined before and after photolysis was carried out.
In order to exclude the possibility of a toxic effect of the methanol present in the solutions on bacteria when interpreting the results, an aqueous solution with 2.5% methanol was prepared as a blank test and examined for its toxicity. The methanol content of 2.5% did not prove to be toxic to the bacterial culture used at various pH values, so the assumption that it contributes to the toxicity of the pesticides tested was rejected.
Figure 2 shows the graph of the toxicity curve of ACE at pH values of 4, 7, and 10 before and after 5 h of photolysis.
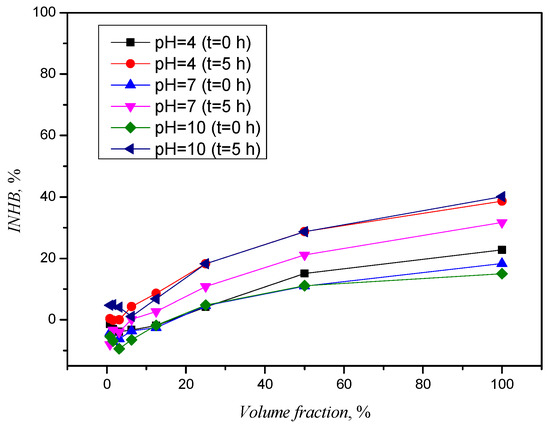
Figure 2.
Toxicity curves for ACE before and after photolysis.
At large dilutions, where the volume fraction of the sample is smaller, ACE has been shown to be non-toxic, but an increase in the proportion of ACE solutions analyzed leads to an increase in inhibition. The influence of pH value changes is visible in Figure 2, where the difference in inhibition of the initial solutions (with 100% of the ACE solutions tested) is visible but not significant. The influence is to be expected due to the sensitivity of the bacterial culture, which has to work in the pH range of 6.8 to 7.2. An increase in inhibition can be seen in the ACE solutions after photolysis, although the sample with a pH value of 7 nevertheless exhibited a lower inhibition than the solutions for pH 4 and 10. Acetamiprid, as mentioned above, is not an ionic compound and a change in pH value does not lead to protonation or deprotonation reactions, and photolytic degradation products that could be considered responsible for an increase in toxicity were not observed in the chromatographic analysis and are assumed to be below the detection limit.
3.1.2. Clothianidin
Figure 3 shows the decrease in the concentration, i.e., the removal, of CLO at each pH value, and it can be said that the compound has almost completely disappeared after 5 h of exposure to solar radiation.
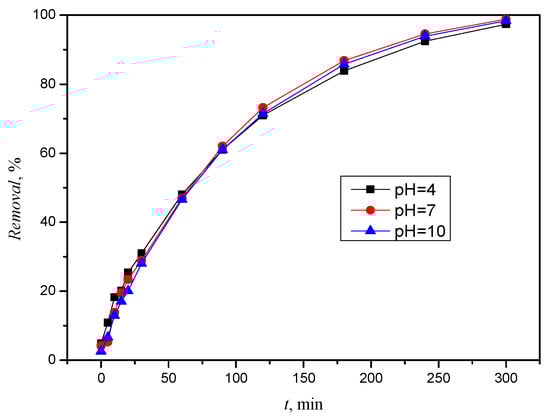
Figure 3.
Removal of CLO during 5 h of solar radiation at different pH values.
The UV spectrum (Figure S3) of CLO shows an absorption band extending to >290 nm, which means that the insecticide absorbs in the tropospheric region of sunlight, and it is therefore susceptible to direct photolysis [23]. The photolysis rate was calculated using Equation (2). In experiments, the linear regression of ln(ct/c0) with respect to time (t) showed that photodegradation follows first-order kinetics with R2 > 0.99. Data processing was used to calculate the CLO degradation rate coefficients (k), i.e., the half-life was calculated using Equation (3) (t1/2), which ranges from 65 to 72 min depending on the pH value.
A photodegradation of 5 h was sufficient for the complete degradation of CLO. In the experiments, however, a new component was formed during the photolytic degradation of CLO, which is visible in the chromatogram in Figure 4.
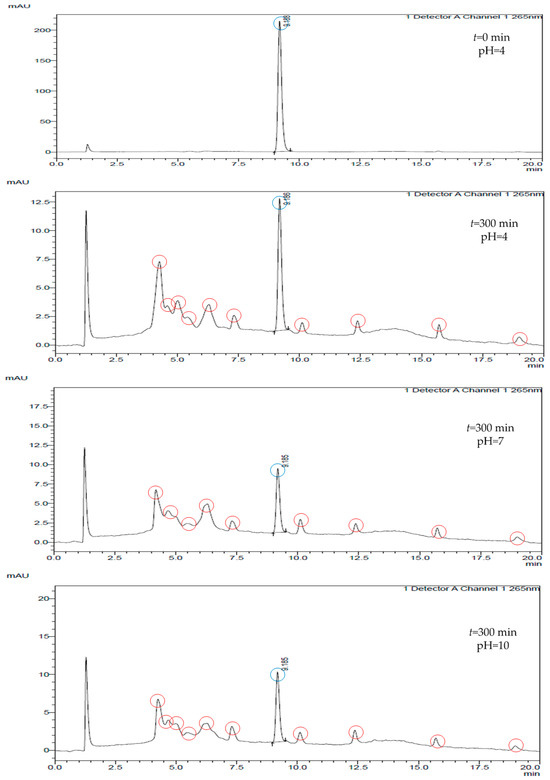
Figure 4.
Chromatograms of CLO (blue color) and degradation/transformation products (red color) at different pH values.
Due to its pKa value of 11.1 (see Table 1), CLO is present in a dissociated form at a pH above 11.1. Because the experiments were carried out at a pH of 4–10, which is typical for surface water and secondary effluents, the pKa value of CLO is outside the pH range investigated, so dissociated species do not occur [11].
At each pH value, a series of new chromatographic curves were observed between retention times of 4 and 9 min and between 9 and 20 min. This is an indication of the possible newly formed degradation and/or transformation products of CLO. As part of their research, Li et al. [35] investigated the photolytic degradation of CLO in soil, and new degradation and/or transformation products were observed, with a decrease in the concentration of the parent compound.
Toxicity analyses should not only be carried out for the parent component but also for the degradation/transformation products after photolysis, as other, more toxic products may be formed. The results of the toxicity assessment for samples after the photolytic degradation of CLO at initial concentrations of 10 mg/L are shown in Figure 5. The initial solution of CLO did not prove to be toxic at any pH value, and the curves obtained for the samples before photolysis show a negative inhibition on the bacterial culture. The negative inhibition is an indicator that CLO solutions have no toxic effect on bacteria, and after 30 min of incubation, the bacteria have a higher luminescence than at the beginning.
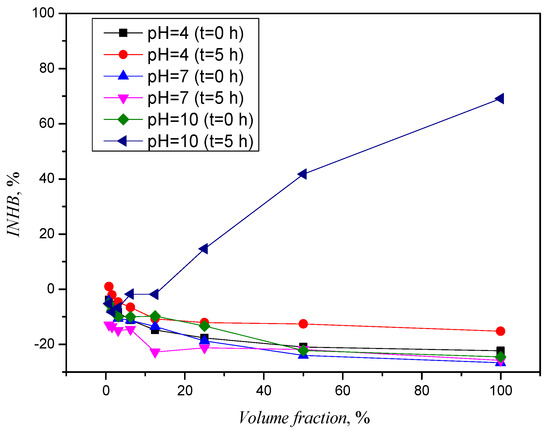
Figure 5.
Toxicity curves for CLO before and after photolysis.
The curves for the samples with pH values of 4 and 7 after photolytic treatment showed no toxic effect, while the curve for the sample with a pH value of 10 showed an extraordinary jump and an inhibition of more than 69%. The optimum value for working with bacteria is between 6.8 and 7.2, but because the other samples tested did not show such a drastic jump at pH 10, the assumption of a significant influence of pH value on inhibition growth is rejected. At a pH value of 10, the faster degradation of CLO was confirmed, and the analysis of the chromatogram revealed more degradation and/or transformation products of the photolysis of CLO (Figure 4). We assume that the occurrence of the unexpected toxicity at the pH value of 10 is due to the product with a retention time of 7.3 min, whose area under the curve increases with an increasing pH value. However, further investigation is required to determine the exact cause of the toxicity. In addition to the ecotoxicity analysis, it is necessary to identify the degradation or transformation product in order to better monitor its fate and behavior in the environment.
3.1.3. Thiacloprid
Thiacloprid (TIA) strongly absorbs UV radiation in a broad wavelength range, from 200 to 280 nm (Figure S4), with a maximum absorption band at 242 nm. Therefore, only UV sources with a good output below about 280 nm can be used for the direct photolysis of TIA [36]. Thiacloprid, however, shows no absorption above 290 nm, so direct photolysis is not to be expected. Accordingly, Figure 6 shows the highly variable behavior of TIA and its removal during photolysis.
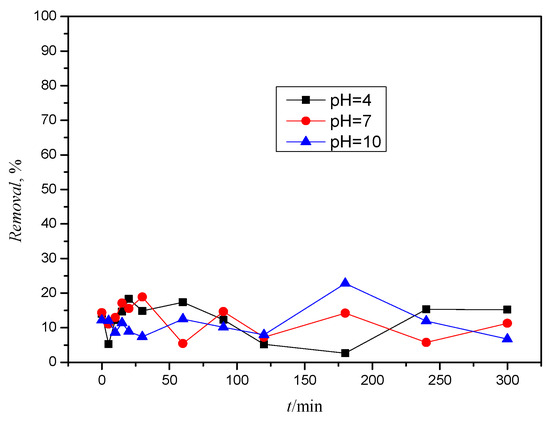
Figure 6.
Removal of TIA during 5 h of solar radiation at different pH values.
Figure S5 shows chromatograms before and after photolysis at pH = 4. The chromatograms show that TIA is not degraded during photolysis, and this behavior was recorded at all pH values. The appearance of new chromatographic curves, which would indicate the formation of degradation and/or transformation products, was not recorded. Such a drastic change in concentrations during photolysis could therefore be due to the log KO/W value (see Table 1) and the tendency for sorption and desorption on the walls of the quartz vessel.
Like ACE and TIA, it contains a cyanoimine functional group that is associated with stability during prolonged irradiation [11]. TIA also has no present pKa values (see Table 1), i.e., it does not dissociate at any pH value, and therefore only undissociated forms of TIA are present throughout the pH range.
Thiacloprid was found to be resistant to photodegradation and biodegradation and the concentration of TIA remained unchanged under sunlight [23]. The Food and Agriculture Organization (FAO) and the European Commission reported a t1/2 of TIA of 80 days under simulated sunlight and 324 days under natural sunlight in Phoenix [24]. Figure 7 shows the toxicity curves of the TIA samples before and after photolysis. The measurement of the samples before photolysis showed that the samples are toxic at a pH value of 7 in all dilutions, while they are toxic in 80 to 100% of the samples at pH values of 4 and 10. However, the degree of induced inhibition is not significant. The samples after photolysis showed no significant inhibition deviations (increase/decrease in the range of 6 to 10%).
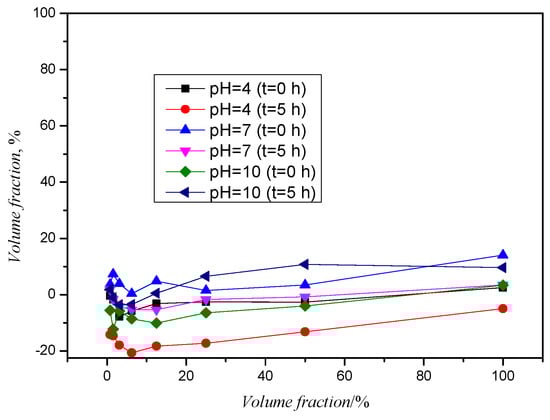
Figure 7.
Toxicity curves for TIA before and after photolysis.
3.2. Direct Oxidation with Hydrogen Peroxide
The results (Figure S6) show that the addition of hydrogen peroxide achieves the removal of ACE in a range from 0.72 to 20.17%. The highest removal of 20.17% was achieved at the highest H2O2 concentration and a solution pH of 10. The removal of ACE was more influenced by the pH value of the solution but not significantly. It can be seen that the lowest amount of pesticide was removed at a pH value of 7. When comparing the chromatograms obtained, no new chromatographic curves were observed that would indicate the formation of degradation and/or transformation products. It can be concluded that ACE cannot be effectively degraded only under the influence of a chemical oxidant, which is also consistent with previous studies [34].
The results (Figure S7) show a significantly higher removal of CLO by direct oxidation compared to ACE, whereby the removal depends on both the hydrogen peroxide concentration and the pH value of the solutions. However, it should be emphasized that the removal of xenobiotics does not change significantly within 5 h but that the removal varies around the same value depending on the H2O2 concentration. In the experiment performed with hydrogen peroxide c(H2O2) = 20 mM, the pesticide removal is at least about 10%. A solution with a pH value of 4 has the highest removal compared to the other two pH values. It can also be concluded from the graph that the removal of CLO is lowest at pH 10 (<10%). From Figure S7, it can be concluded that the H2O2 concentration and the pH value of the solution significantly affect the removal of KLO. It can be seen that a greater removal of xenobiotics occurs at higher H2O2 concentrations. Furthermore, we can confirm the statement in Figure S7, which stated that better removal of CLO takes place at a lower pH value and that with an increasing pH value the removal decreases, with some exceptions at pH = 7. No new chromatographic curves of degradation and/or transformation products were determined by chromatographic analysis.
As far as the removal of TIA by hydrogen peroxide is concerned, the pH value has a greater effect on the removal than the hydrogen peroxide concentration itself. The removal of TIA is generally between 10 and 50%, regardless of the concentration of hydrogen peroxide added. However, the removal of pesticides at any peroxide concentration is highest at a pH of 10. On the other hand, removal is lowest at higher peroxide concentrations under neutral conditions, as shown in Figure S8.
3.3. Photolysis in the Presence of Hydrogen Peroxide
3.3.1. Acetamiprid
The results show that under simulated solar radiation and the presence of hydrogen peroxide, the removal of ACE is ≥98% (Figure 8). From the results, it can be seen that the removal of xenobiotics is greatest at pH 4 and it is in the acidic solution that ACE was removed first, and with an increase in pH value, the removal becomes slightly slower.
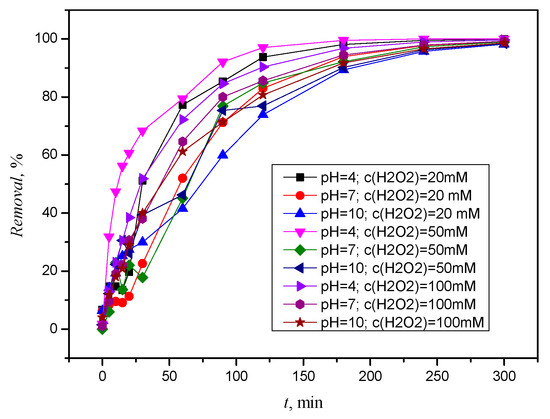
Figure 8.
Removal of ACE by simulated solar radiation and H2O2, c(H2O2) = 20 mM, c(H2O2) = 50 mM, and c(H2O2) = 100 mM.
The faster removal under acidic conditions is consistent with other studies [11]. It is noticeable that faster removal occurs not only at a pH value of 10 but also at hydrogen peroxide concentrations of 20 and 50 mM. Hydrogen peroxide also acts as a HO scavenger, producing much less reactive hydroperoxyl radical (HO2·). The scavenging effect becomes significant at higher H2O2 concentrations, so that less HO· is available for the removal of ACE [36].
The chromatographic analysis (Figure S9) shows that after two hours of photolysis in acidic solution, a number of transformation or degradation products occur in the interval from 13.224 min to 18.064 min, some of which also occur after application of higher H2O2 concentrations. The same trend was observed in the neutral solution with the formation of an additional product at 15.427 min. In the alkaline solution (Figure S10), it can be seen that significant, but not complete, degradation of ACE occurred after two hours and three degradation or transformation products were formed. Figure S11 shows absorption spectra for the resulting product with retention times of 20.963 min (blue arrow). At a pH of 10, it is significant that ACE was not completely removed after five hours. It is assumed that the UV/H2O2 process is significantly inhibited under basic conditions by the reduction in the oxidizing power of HO· due to the redox potential [34].
The results mentioned so far show that ACE is completely removed in an acidic medium regardless of the hydrogen peroxide concentration. A major advantage is that a lower concentration of hydrogen peroxide can be used, thus reducing the harmful effects on the environment when ACE is removed.
After analyzing the data and entering the parameter values into the Design Expert 7.0 program package, the response surface of the predicted model for the degradation of ACE by photolysis in the presence of hydrogen peroxide was obtained (Figure 9).
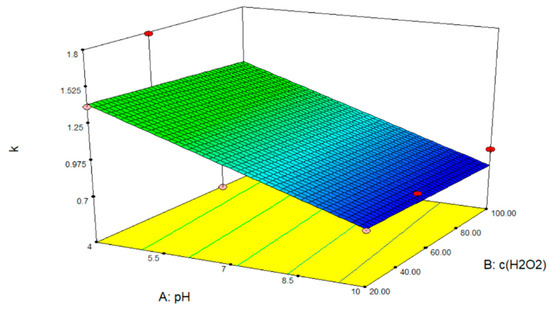
Figure 9.
Response surface model of ACE removal by photolysis with hydrogen peroxide.
From Figure 9, it can be concluded that only the pH value of the solution influences the removal of ACE and that regardless of the hydrogen peroxide concentration, the removal of ACE is achieved first in an acidic solution, it is somewhat slower in a neutral solution, and at pH = 10, no complete removal will take place.
The multifactorial design of the pesticide removal experiment is shown in Table 2. To obtain the surface response, a multi-factor plan with three levels was used, consisting of two factors and three levels for each factor. The two factors that make up this plan are the pH value and hydrogen peroxide concentration. By reading the slope of the direction obtained, the search k values were determined, which are shown in Table 3.
Table 3.
Obtained k values for ACE.
The k listed in Table 3 is a further indicator of the significant influence of the pH value, because the higher the k value, the more clearly it indicates which conditions achieve greater efficacy [34]. Previous studies using UV radiation at 254 nm and hydrogen peroxide removed 60% of ACE within 60 min at significantly lower concentrations of H2O2 [34]. However, with the use of simulated artificial radiation, removal is promoted in a reasonable amount of time, utilizing the potential of using a natural energy source.
3.3.2. Clothianidin
CLO is gradually removed by photolysis in contact with hydrogen H2O2. Figure 10 shows that it took 2 h for complete removal in an acidic medium at all H2O2 concentrations, while at a pH of 7, complete removal only occurred after two hours at an H2O2 concentration of 100 mM. As with ACE (3.3.1), faster removal was observed in the acidic pH range, where a removal of more than 99% was achieved after 90 min, while in the alkaline pH range, it was slightly slower and removal ≥99% required 180 min.
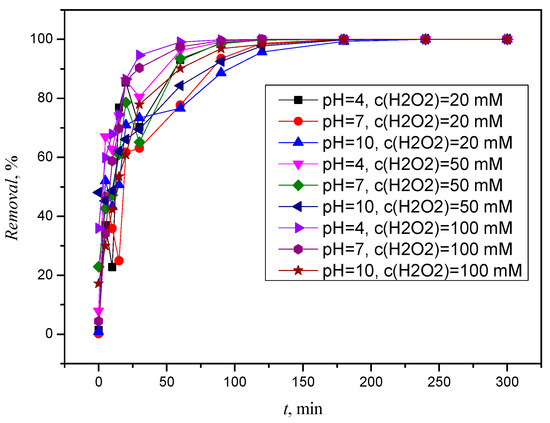
Figure 10.
Removal of CLO by simulated solar radiation and H2O2, c(H2O2) = 20 mM, c(H2O2) = 50 mM, and c(H2O2) = 100 mM.
Figures S12 and S13 also confirm that CLO is completely degraded after two hours at a pH of 4. In addition, two degradation or transformation products were formed. The first has a retention time of 13.168 min and is below the detection limit, the second has a retention time of 16.979 min and occurs in neutral solutions and its absorption spectrum is shown in Figure S14. After five hours, the CLO was completely degraded under all conditions, and the previously formed transformation or degradation products were decomposed.
As for the alkaline solution, no significant changes or products were observed during the five hours, but it is important to mention that CLO was already removed in the third hour. A significant improvement compared to ACE is that CLO can be completely removed at all H2O2 concentrations and pH values, i.e., after five hours, CLO was removed from every solution. However, as we stated in Section 3.1.2, CLO undergoes degradation under the influence of simulated solar radiation and it can be concluded that in this process, photolytic degradation associated with indirect photolysis (radical pathway) plays the main role in the removal of CLO, as stated by Acero et al. [11]. Very few degradation or transformation products were detected during the process, which were completely degraded over time.
After analyzing the data and entering the parameter values into the Design Expert 7.0 program package, the response surface of the predicted model for the degradation of clothianidin by photolysis in the presence of hydrogen peroxide was obtained (Figure 11).
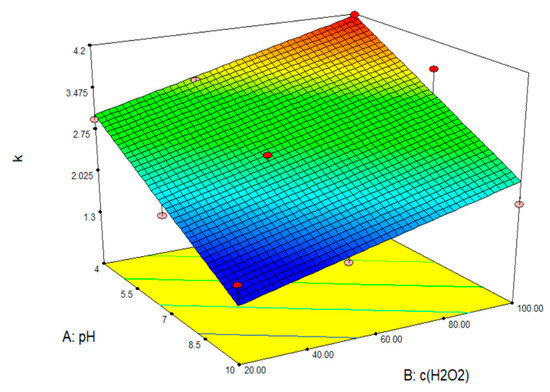
Figure 11.
Response surface model of CLO removal by photolysis with hydrogen peroxide.
The calculated k values are in Table 4. From Figure 11 and Table 4, it can be concluded that the removal of CLO depends on both the hydrogen peroxide concentration and the pH value of the solution. It can be seen from Table 4 that the k values assume higher values in the acidic pH range, and in relation to the H2O2 concentration, the highest k values were obtained at 100 mM. From the comparison of Table 3 and Table 4, it is evident that CLO assumes significantly higher values, which is probably due to the contribution of photolytic degradation as the main degradation pathway, which is not present in ACE. From Figure 11, it can be concluded that the CLO removal process is favored by the higher hydrogen peroxide concentration and the lower pH value of the solution. It is also important to emphasize that CLO was removed from all solutions after five hours, regardless of the pH value and H2O2 concentration.
Table 4.
Obtained k values for CLO.
3.3.3. Thiacloprid
Figure 12 shows the excellent removal of TIA already at the beginning of photolysis, but only after five hours was a removal of ≥99% achieved at all three pH values. TIA is initially removed in an acidic solution, and complete removal was achieved in 4 h. While a slower removal occurred at the medium H2O2 concentration, a faster removal of TIA was achieved at the highest H2O2 concentration. Considering the very good removal right at the beginning of photolysis, the differences in removal at different pH values are almost unnoticeable, but as with other concentrations, the removal of TIA is best favored by an acidic environment.
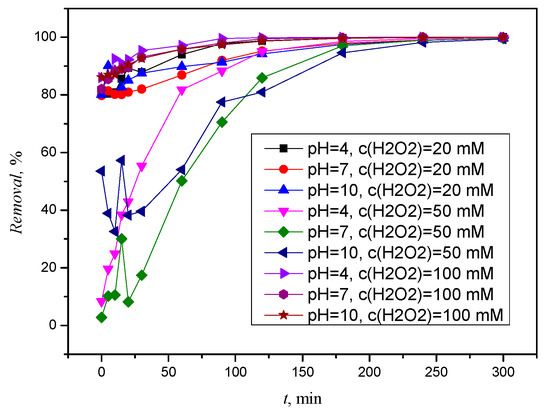
Figure 12.
Removal of TIA by simulated solar radiation and H2O2, c(H2O2) = 20 mM, c(H2O2) = 50 mM, and c(H2O2) = 100 Mm.
After two hours in solutions of all pH ranges, TIA is not completely removed, and three degradation or transformation products are formed, with retention times of 14.656 min, 17.757 min, and 22.971 min, which are frequently repeated in other solutions (Figure S16). In the case of TIA, significantly more new chromatographic curves occurred that were below the detection limit. After five hours, TIA was completely degraded (Figure S16), but in no case were all transformation or degradation products formed during the process.
A comparison of all the results obtained shows that TIA is removed after five hours regardless of the pH value and H2O2 concentration used. Moreover, it is of great advantage that even a low concentration of hydrogen peroxide leads to a significant removal of the mentioned pesticide, already in the first hour. Regarding CLO, more degradation or transformation products were detected, and the same products often appeared in different solutions.
After analyzing the data and entering the parameter values into the Design Expert 7.0 program package, the response surface of the predicted model for the degradation of CLO by photolysis in the presence of H2O2 was determined (Figure 13).
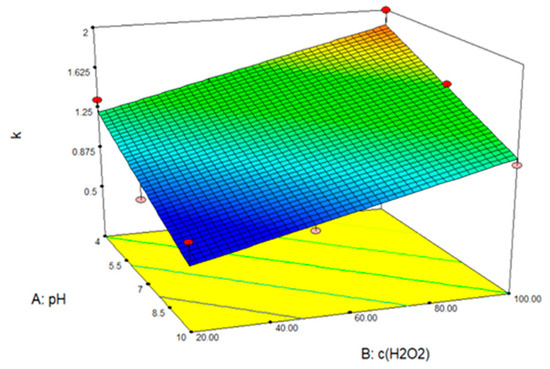
Figure 13.
Response surface model of TIA removal by photolysis with hydrogen peroxide.
Figure 13 shows that the removal of TIA is influenced by the pH value of the solution and the H2O2 concentration. Regarding the pH value, it was found that TIA was initially completely removed in an acidic solution (pH = 4). In an aqueous study by Acer et al., a slightly faster removal was also observed in an acidic solution [11]. It was also observed that the removal of TIA is more efficient when increasing the H2O2 concentration. At the highest concentration, TIA was removed after only three hours, which is not the case at the lowest concentration. The optimal conditions for the removal of TIA are therefore a high concentration of hydrogen peroxide in an acidic environment. In their research, Abramović et al. achieved 97% removal within 120 min with a UV/H2O2 combination, at a concentration of 0.32 mM H2O2, whereas in this research, removal within 120 min was in the range of 80 to 99%, but using significantly higher H2O2 concentrations and simulated sunlight [36].
The calculated k values are in Table 5.
Table 5.
Obtained k values for TIA.
According to Table 5, higher k values were obtained for all pH values at the highest H2O2 concentration, which, according to the accompanying data, plays a greater role than pH value in the removal of TIA.
Based on the k values presented in the table for all xenobiotics tested, it can be concluded that they follow the trend shown in the work of Chen et al.: CLO>TIA>ACE [34]. This confirms to us that the application of simulated solar radiation and H2O2 will remove CLO.
4. Conclusions
Acetamiprid and thiacloprid were found to be resistant to photodegradation, while clothianidin is the only active ingredient that is almost completely degraded and forms a number of new degradation and/or transformation products under the influence of simulated solar radiation. The determination of the toxicity of acetamiprid, clothianidin, and thiacloprid samples after photolysis leads to the following conclusions: when analyzing neonicotinoid pesticides (10 mg/L), acetamiprid was the only pesticide that showed a toxic effect of 20% inhibition of bacteria at 100% analyte concentration at all measured pH values (pH = 4, 7, and 10) without the influence of photolysis on its decomposition. The highest toxicity was measured for the clothianidin sample at pH = 10, TU = 15.9. The chromatograms obtained by recording on the HPLC-DAD system for clothianidin showed photolytically formed degradation products, the appearance of which in an alkaline medium may lead to unexpected toxicity. However, for this type of conclusion, more detailed investigations of the structure of the degradation products and their toxicity are required, using a chromatographic system coupled to a mass spectrometer (LC-Q-TOF-MS, UPLC-ESI/MS/MS).
Direct oxidation of acetamiprid in the presence of hydrogen peroxide, without exposure to solar radiation, will not completely remove it or significantly reduce its concentration over time. In the case of clothianidin and thiacloprid, removal is more effective but not complete. The effectiveness of removing pesticides from an aqueous solution using only hydrogen peroxide depends on the pH value of the solution. However, the optimum pH value of the solution cannot be precisely determined, but it depends on the xenobiotic itself that is removed from the aqueous solution. On the other hand, the concentration of the xenobiotic in the aqueous solution gradually decreases in the presence of simulated solar radiation until it is completely removed. The duration of complete removal of the xenobiotic depends not only on the type of xenobiotic but also on the pH value of the solution and, in some cases, on the concentration of hydrogen peroxide.
Acetamiprid is the only one out of the three pesticides tested whose removal depends solely on the pH value and which was only completely removed after 5 h.
The removal of thiacloprid and clothianidin, on the other hand, is influenced by the pH value of the solution and the hydrogen peroxide concentration. In some cases, the xenobiotics were completely removed after only 2 h of photolysis.
From the comparison of all the results obtained, it can be concluded that hydrogen peroxide alone is not sufficient for the complete removal of xenobiotics from aqueous solutions but that the removal must take place in the presence of solar radiation and optimal conditions for their removal to be established. For the fastest possible removal of xenobiotics from the aqueous solution, it is therefore necessary to carry out photolysis with the highest available concentration of hydrogen peroxide. It has been shown that removal is more effective in acidic solutions than in alkaline or neutral solutions. Analysis of the results obtained revealed various degradation or transformation products whose structure is unknown, so there is a risk of increased toxicity in the environment.
Supplementary Materials
The following supporting information can be downloaded at https://www.mdpi.com/article/10.3390/pr11123403/s1, Table S1: Sampling times when performing photolysis; Figure S1: Absorption spectrum of acetamiprid; Figure S2: Chromatogram of acetamiprid at pH = 4 at time t = 0 min (1) and t = 300 min (2); Figure S3: Absorption spectrum of clothianidin; Figure S4: Absorption spectrum of thiacloprid; Figure S5: Chromatogram of thiacloprid at pH = 4 at time t = 0 min and t = 300 min; Figure S6: Acetamiprid removal after five hours of mixing with H2O2, c(H2O2) = 20 mM, c(H2O2) = 50 mM, and c(H2O2) = 100 mM; Figure S7: Clothianidin removal after five hours of mixing with H2O2, c(H2O2) = 20 mM, c(H2O2) = 50 mM, and c(H2O2) = 100 mM; Figure S8: Thiacloprid removal after five hours of mixing with H2O2, c(H2O2) = 20 mM, c(H2O2) = 50 mM, and c(H2O2) = 100 mM; Figure S9: Chromatogram of acetamiprid for pH = 4 and c(H2O2) = 20 mM, t = 120 min; Figure S10: Chromatogram of acetamiprid for pH = 10 and c(H2O2) = 20 mM, t = 120 min; Figure S11: Absorption spectrum of the degradation or transformation product of acetamiprid tR = 20.963 min; Figure S12: Chromatogram of clothianidin for pH = 4 and c(H2O2) = 20 mM, t = 0 min; Figure S13: Chromatogram of clothianidin for pH = 4 and c(H2O2) = 20 mM, t = 160 min; Figure S14: Absorption spectrum of the degradation or transformation product of clothianidin tR = 16.787 min; Figure S15: Chromatogram of thiacloprid for pH = 4 and c(H2O2) = 20 mM, t = 120 min; Figure S16: Chromatogram of thiacloprid for pH = 4 and c(H2O2) = 20 mM, t = 300 min.
Author Contributions
Investigation, writing—original draft, formal analysis, validation—B.B.V.; Investigation, formal toxicity analysis—A.M.; Writing—review and editing—D.D.; Conceptualization, investigation (analytical part), validation, writing—review and editing—D.A. All authors have read and agreed to the published version of the manuscript.
Funding
This research was funded by the NATO Science for Peace and Security Programme under grant id. G6087.
Data Availability Statement
Data are contained within the article.
Conflicts of Interest
The authors declare no conflict of interest. The funders had no role in the design of the study; in the collection, analyses, or interpretation of data; in the writing of the manuscript; or in the decision to publish the results.
References
- Commoner, B.; Corr, M.; Stamler, P.J. The Causes of Pollution. Environment 1971, 13, 2–19. [Google Scholar] [CrossRef]
- Dokić, M.; Bilandžić, N.; Briški, F. Postupci Uklanjanja Pesticida Iz Okoliša. Kem. Ind. Chem. Chem. Eng. 2012, 61, 341–348. [Google Scholar]
- Fetzner, S. Biodegradation of Xenobiotics. In Encyclopedia of Life Support Systems (EOLSS) Publishers, Developed under the Auspices of the UNESCO; Biotechnology; EOLSS: Oxford, UK, 2002; Volume 10, pp. 1–8. [Google Scholar]
- Raman Suri, C.; Boro, R.; Nangia, Y.; Gandhi, S.; Sharma, P.; Wangoo, N.; Rajesh, K.; Shekhawat, G.S. Immunoanalytical Techniques for Analyzing Pesticides in the Environment. TrAC Trends Anal. Chem. 2009, 28, 29–39. [Google Scholar] [CrossRef]
- Büttner, O.; Jawitz, J.W.; Birk, S.; Borchardt, D. Why Wastewater Treatment Fails to Protect Stream Ecosystems in Europe. Water Res. 2022, 217, 118382. [Google Scholar] [CrossRef] [PubMed]
- Hakeem, K.R.; Akhtar, M.S.; Abdullah, S.N.A. Plant, Soil and Microbes: Volume 1: Implications in Crop Science; Springer: Dordrecht, The Netherlands, 2016; pp. 1–366. [Google Scholar] [CrossRef]
- Aktar, W.; Sengupta, D.; Chowdhury, A. Impact of Pesticides Use in Agriculture: Their Benefits and Hazards. Interdiscip. Toxicol. 2009, 2, 1–12. [Google Scholar] [CrossRef] [PubMed]
- Rasool, S.; Rasool, T.; Gani, K.M. A Review of Interactions of Pesticides within Various Interfaces of Intrinsic and Organic Residue Amended Soil Environment. Chem. Eng. J. Adv. 2022, 11, 100301. [Google Scholar] [CrossRef]
- Maurya, P.K.; Malik, D.S. Bioaccumulation of Xenobiotics Compound of Pesticides in Riverine System and Its Control Technique: A Critical Review. J. Ind. Pollut. Control 2016, 32, 580–594. [Google Scholar]
- Zaller, J.G.; Kruse-Plaß, M.; Schlechtriemen, U.; Gruber, E.; Peer, M.; Nadeem, I.; Formayer, H.; Hutter, H.P.; Landler, L. Pesticides in Ambient Air, Influenced by Surrounding Land Use and Weather, Pose a Potential Threat to Biodiversity and Humans. Sci. Total Environ. 2022, 838, 156012. [Google Scholar] [CrossRef]
- Acero, J.L.; Real, F.J.; Javier Benitez, F.; Matamoros, E. Degradation of Neonicotinoids by UV Irradiation: Kinetics and Effect of Real Water Constituents. Sep. Purif. Technol. 2019, 211, 218–226. [Google Scholar] [CrossRef]
- Wood, T.J.; Goulson, D. The Environmental Risks of Neonicotinoid Pesticides: A Review of the Evidence Post 2013. Environ. Sci. Pollut. Res. 2017, 24, 17285–17325. [Google Scholar] [CrossRef]
- Gibbons, D.; Morrissey, C.; Mineau, P. A Review of the Direct and Indirect Effects of Neonicotinoids and Fipronil on Vertebrate Wildlife. Environ. Sci. Pollut. Res. 2015, 22, 103–118. [Google Scholar] [CrossRef] [PubMed]
- Forrester, M.B. Neonicotinoid Insecticide Exposures Reported to Six Poison Centers in Texas. Hum. Exp. Toxicol. 2014, 33, 568–573. [Google Scholar] [CrossRef] [PubMed]
- Schaafsma, A.; Limay-Rios, V.; Baute, T.; Smith, J.; Xue, Y. Neonicotinoid Insecticide Residues in Surface Water and Soil Associated with Commercial Maize (Corn) Fields in Southwestern Ontario. PLoS ONE 2015, 10, e0118139. [Google Scholar] [CrossRef] [PubMed]
- Sadaria, A.M.; Supowit, S.D.; Halden, R.U. Mass Balance Assessment for Six Neonicotinoid Insecticides during Conventional Wastewater and Wetland Treatment: Nationwide Reconnaissance in United States Wastewater. Environ. Sci. Technol. 2016, 50, 6199–6206. [Google Scholar] [CrossRef]
- Sánchez-Bayo, F.; Hyne, R.V. Detection and Analysis of Neonicotinoids in River Waters—Development of a Passive Sampler for Three Commonly Used Insecticides. Chemosphere 2014, 99, 143–151. [Google Scholar] [CrossRef] [PubMed]
- Klarich, K.L.; Pflug, N.C.; DeWald, E.M.; Hladik, M.L.; Kolpin, D.W.; Cwiertny, D.M.; LeFevre, G.H. Occurrence of Neonicotinoid Insecticides in Finished Drinking Water and Fate during Drinking Water Treatment. Environ. Sci. Technol. Lett. 2017, 4, 168–173. [Google Scholar] [CrossRef]
- Barbosa, M.O.; Moreira, N.F.F.; Ribeiro, A.R.; Pereira, M.F.R.; Silva, A.M.T. Occurrence and Removal of Organic Micropollutants: An Overview of the Watch List of EU Decision 2015/495. Water Res. 2016, 94, 257–279. [Google Scholar] [CrossRef]
- Wols, B.A.; Hofman-Caris, C.H.M. Review of Photochemical Reaction Constants of Organic Micropollutants Required for UV Advanced Oxidation Processes in Water. Water Res. 2012, 46, 2815–2827. [Google Scholar] [CrossRef]
- De Souza, R.M.; Seibert, D.; Quesada, H.B.; de Jesus Bassetti, F.; Fagundes-Klen, M.R.; Bergamasco, R. Occurrence, Impacts and General Aspects of Pesticides in Surface Water: A Review; Elsevier: Amsterdam, The Netherlands, 2020; Volume 135, ISBN 5545337970. [Google Scholar]
- Carlson, J.C.; Stefan, M.I.; Parnis, J.M.; Metcalfe, C.D. Direct UV Photolysis of Selected Pharmaceuticals, Personal Care Products and Endocrine Disruptors in Aqueous Solution. Water Res. 2015, 84, 350–361. [Google Scholar] [CrossRef]
- Peña, A.; Rodríguez-Liébana, J.A.; Mingorance, M.D. Persistence of Two Neonicotinoid Insecticides in Wastewater, and in Aqueous Solutions of Surfactants and Dissolved Organic Matter. Chemosphere 2011, 84, 464–470. [Google Scholar] [CrossRef]
- Lu, Z.; Challis, J.K.; Wong, C.S. Quantum Yields for Direct Photolysis of Neonicotinoid Insecticides in Water: Implications for Exposure to Nontarget Aquatic Organisms. Environ. Sci. Technol. Lett. 2015, 2, 188–192. [Google Scholar] [CrossRef]
- Cano, P.A.; Jaramillo-Baquero, M.; Zúñiga-Benítez, H.; Londoño, Y.A.; Peñuela, G.A. Use of Simulated Sunlight Radiation and Hydrogen Peroxide in Azithromycin Removal from Aqueous Solutions: Optimization & Mineralization Analysis. Emerg. Contam. 2020, 6, 53–61. [Google Scholar] [CrossRef]
- Pelayo, D.; Rivero, M.J.; Santos, G.; Gómez, P.; Ortiz, I. Techno-Economic Evaluation of UV Light Technologies in Water Remediation. Sci. Total Environ. 2023, 868, 161376. [Google Scholar] [CrossRef]
- Kurwadkar, S.; Evans, A.; DeWinne, D.; White, P.; Mitchell, F. Modeling Photodegradation Kinetics of Three Systemic Neonicotinoids—Dinotefuran, Imidacloprid, and Thiamethoxam—In Aqueous and Soil Environment. Environ. Toxicol. Chem. 2016, 35, 1718–1726. [Google Scholar] [CrossRef]
- Dell’Arciprete, M.L.; Santos-Juanes, L.; Sanz, A.A.; Vicente, R.; Amat, A.M.; Furlong, J.P.; Mártire, D.O.; Gonzalez, M.C. Reactivity of Hydroxyl Radicals with Neonicotinoid Insecticides: Mechanism and Changes in Toxicity. Photochem. Photobiol. Sci. 2009, 8, 1016–1023. [Google Scholar] [CrossRef]
- Yin, K.; Deng, Y.; Liu, C.; He, Q.; Wei, Y.; Chen, S.; Liu, T.; Luo, S. Kinetics, Pathways and Toxicity Evaluation of Neonicotinoid Insecticides Degradation via UV/Chlorine Process. Chem. Eng. J. 2018, 346, 298–306. [Google Scholar] [CrossRef]
- Li, H.; Duan, L.; Wang, H.; Chen, Y.; Wang, F.; Zhang, S. Photolysis of Sulfadiazine under UV Radiation: Effects of the Initial Sulfadiazine Concentration, PH, NO3− and Cd2+. Chem. Phys. Lett. 2020, 739, 136949. [Google Scholar] [CrossRef]
- Babić, B.; Andrić, D.; Farkaš, A.; Vuk, D.; Ašperger, D.; Dolar, D. Behavior of Mebendazole during NF/RO Adsorption and Photolysis. Membranes 2022, 12, 888. [Google Scholar] [CrossRef]
- ISO 11348-1:2007; Water Quality—Determination of the Inhibitory Effect of Water Samples on the Light Emission of Vibrio Fischeri (Luminescent Bacteria Test)—Part 1: Method Using Freshly Prepared Bacteria. ISO: Geneva, Switzerland, 2007.
- DIN 38412-341; Examination of Water, Waste Water and Sluge; Bio-Assays (Group L) Determination of the Inhibitory Effect of Waste Water on the Lightemission of Photobacterium Phosphoreum (L34) Preparation of Test Suspensions (L341). Deutsches Institut Fur Normung E.V. (German National Standard): Berlin, Germany, 1994.
- Chen, L.; Cai, T.; Cheng, C.; Xiong, Z.; Ding, D. Degradation of Acetamiprid in UV/H2O2 and UV/Persulfate Systems: A Comparative Study. Chem. Eng. J. 2018, 351, 1137–1146. [Google Scholar] [CrossRef]
- Li, Y.; Su, P.; Li, Y.; Wen, K.; Bi, G.; Cox, M. Adsorption-Desorption and Degradation of Insecticides Clothianidin and Thiamethoxam in Agricultural Soils. Chemosphere 2018, 207, 708–714. [Google Scholar] [CrossRef]
- Abramović, B.F.; Banić, N.D.; Šojić, D.V. Degradation of Thiacloprid in Aqueous Solution by UV and UV/H2O2 Treatments. Chemosphere 2010, 81, 114–119. [Google Scholar] [CrossRef]
Disclaimer/Publisher’s Note: The statements, opinions and data contained in all publications are solely those of the individual author(s) and contributor(s) and not of MDPI and/or the editor(s). MDPI and/or the editor(s) disclaim responsibility for any injury to people or property resulting from any ideas, methods, instructions or products referred to in the content. |
© 2023 by the authors. Licensee MDPI, Basel, Switzerland. This article is an open access article distributed under the terms and conditions of the Creative Commons Attribution (CC BY) license (https://creativecommons.org/licenses/by/4.0/).