1. Introduction
Sesbania is a one-year-old leguminous sesbania plant. It has the characteristics of strong nitrogen fixation ability, rich plant protein, and strong tolerance. As a high-quality green manure and forage grass, it is widely cultivated and becomes a pioneer plant for soil improvement in saline–alkali land [
1,
2]. In the field of agricultural mechanization, pneumatic seeders can realize the precision seeding of small particle-size seeds. At present, the pneumatic seeder is mainly for corn, soybean, wheat, and other economic crops [
3]; however, there has been little research on the precision seeding of sesbania seeds. Vigorously promoting the process of the mechanized seeding of sesbania is of great significance for accelerating the development of agriculture and animal husbandry in China.
The discrete element method is a particulate material analysis method based on molecular dynamics characteristics [
4]. In recent years, the discrete element method based on EDEM has been widely used, and it has gradually become the development trend used when studying the dynamics of agricultural particulate materials. It is mainly used in the interaction analysis between particulate materials and agricultural machinery equipment [
5]. When the simulation analysis is carried out using EDEM discrete element software, the accuracy of the physical parameters of particulate materials is very important in maintaining the authenticity of the simulation results. The physical parameters of particulate materials are mainly divided into intrinsic parameters and contact parameters. The intrinsic parameters mainly refer to the inherent characteristic parameters of particulate materials, including Poisson’s ratio, density, shear modulus, and so on. Contact parameters mainly refer to the characteristic parameters between particulate materials and between particulate materials and agricultural machinery equipment, including collision recovery coefficient, static friction coefficient, dynamic friction coefficient, and so on [
6]. Optimizing and calibrating the physical parameters of sesbania seed particle dispersion can effectively improve the consistency between EDEM discrete element simulation analysis results and real results, as well as provide an effective basis for the design and development of pneumatic seeder and greatly improve the working performance of seeding apparatus [
7].
In recent years, scholars in different fields have conducted a lot of research on the calibration of seed particle parameters using the discrete element method [
8,
9,
10]. In EDEM software, a single filling particle is spherical. Due to the irregularity of the seed particle shape, it is necessary to fill the 3D solid configuration of the seed with a template of multi-spherical particles; moreover, a different filling particle radius has a certain influence on the simulation results. Yan Jianwei et al. [
11] used the method of multi-sphere-bonding polymerization and the EDEM automatic particle-filling module to establish a radish seed filling model. The influence of different filling particle radii on the rationality of the simulation results was studied and the optimal spherical filling particle radius was obtained. The purpose of the short simulation time and high precision was answered.
The resting angle and the stacking angle of granular particles are macroscopic parameters that reflect the discrete characteristics of particles and can characterize macroscopic characteristics such as friction performance and the flow performance of granular particles. Peng Fei et al. [
12] independently developed a resting angle measuring device based on the injection cross-section method. The resting angle is directly measured using the cross-section profile curve of the particle accumulation body, which achieves the purpose of saving materials and offers a convenient basis from which to measure; based on MATLAB image processing technology, Li Zhanpeng et al. [
13] extracted the boundary contour of the particulate material accumulation body and used the programming algorithm to fit the boundary contour line to obtain the stacking angle of the particulate material, which greatly reduced the angle error of the manual measurement; Ma Wenpeng et al. [
14] proposed using either a single angle of resting or stacking angle as the test index; moreover, the parameter calibration results are only a set of solutions, which inevitably leads to a local optimal solution. Therefore, the practical significance of establishing a multi-index parameter optimization mathematical model is emphasized. On this basis, the main contact parameters of the discrete element model of alfalfa seeds were calibrated by taking the error between the measured values and the simulated measured values of the resting angle and the stacking angle of the particulate materials as the index.
Based on the Hertz–Mindlin (non-slip) contact model, Zhang Guozhong et al. [
15] used the error between the measured value and the simulated value of the particle resting angle and the particle stacking angle as the response value and then determined the optimal discrete element parameter combination for the significant factors affecting the response value through the steepest ascent test; then, the reliability of the optimal parameter combination was verified using the hopper test. Ding Xinting et al. [
16] used the Plackett–Burman design and the steepest ascent experiment to determine whether the static friction coefficient and rolling friction coefficient between rapeseed and steel plate have a significant effect on the stacking angle of the response value. The response surface method (RSM) and machine learning were used to optimize and compare the significant parameters. The results show that the BP artificial neural network based on a genetic algorithm (GA) has better prediction ability and stability. The results avoid the influence of local optimal solution in response surface analysis and can be used for discrete element model simulation. Some scholars have also performed a lot of research on the construction of particle models and the discrete element method (DEM). Qu Tongming et al. [
17] trained a data-driven constitutive model using an RNN neural network based on triaxial test data and provided an alternative to the phenomenological model of granular materials currently used. Gao Wei et al. [
18] proposed a three-dimensional isogeometric/multi-sphere discrete element coupling method that combines the advantages of strong particle shape expression, excellent robustness, and high accuracy in multi-sphere discrete element modeling and isogeometric analysis (IGA). They also used the discrete element method (DEM) to analyze the mixing performance of particles in a ribbon mixer with a double U-shaped vessel [
19].
This paper takes sesbania seeds as the research object. A new type of seed-dropping device that can simultaneously measure the resting angle and stacking angle was designed. The discrete element model of sesbania seeds filled with multiple spherical particles was established by using EDEM software and the Hertz–Mindlin (non-slip) contact model. By importing the falling device model into EDEM software, and based on the actual physical experiment and simulation experiment, the error between the measured value and the simulated value of the resting angle and the stacking angle of the sesbania seeds was taken as the target, and the contact parameters that have a significant effect on the target value were selected using the Plackett–Burman design. RSM analysis was performed using a central composite design test, and a multiple regression mathematical model comprising significant parameters and target values was constructed. Multi-objective optimization was carried out using Design-Expert software (version 13) to obtain the optimal combination of contact parameters. The seeding test was then carried out. This paper aims to provide a theoretical basis for the establishment of the discrete element simulation model and parameter calibration of sesbania seed particles.
2. Simulation Parameter Calibration of Sesbania Discrete Element Model
The resting angle and the stacking angle are the angles between the free cone and the horizontal plane formed by the particulate material in the natural state. They can characterize the discrete properties of particulate materials, and the formation of natural resting angle and stacking angle is related to the physical properties of the particulate material itself and the contact material [
20]. Therefore, they can be used as an important index for the calibration of discrete element model simulation parameters of particulate materials.
2.1. Actual Seed Drop Test
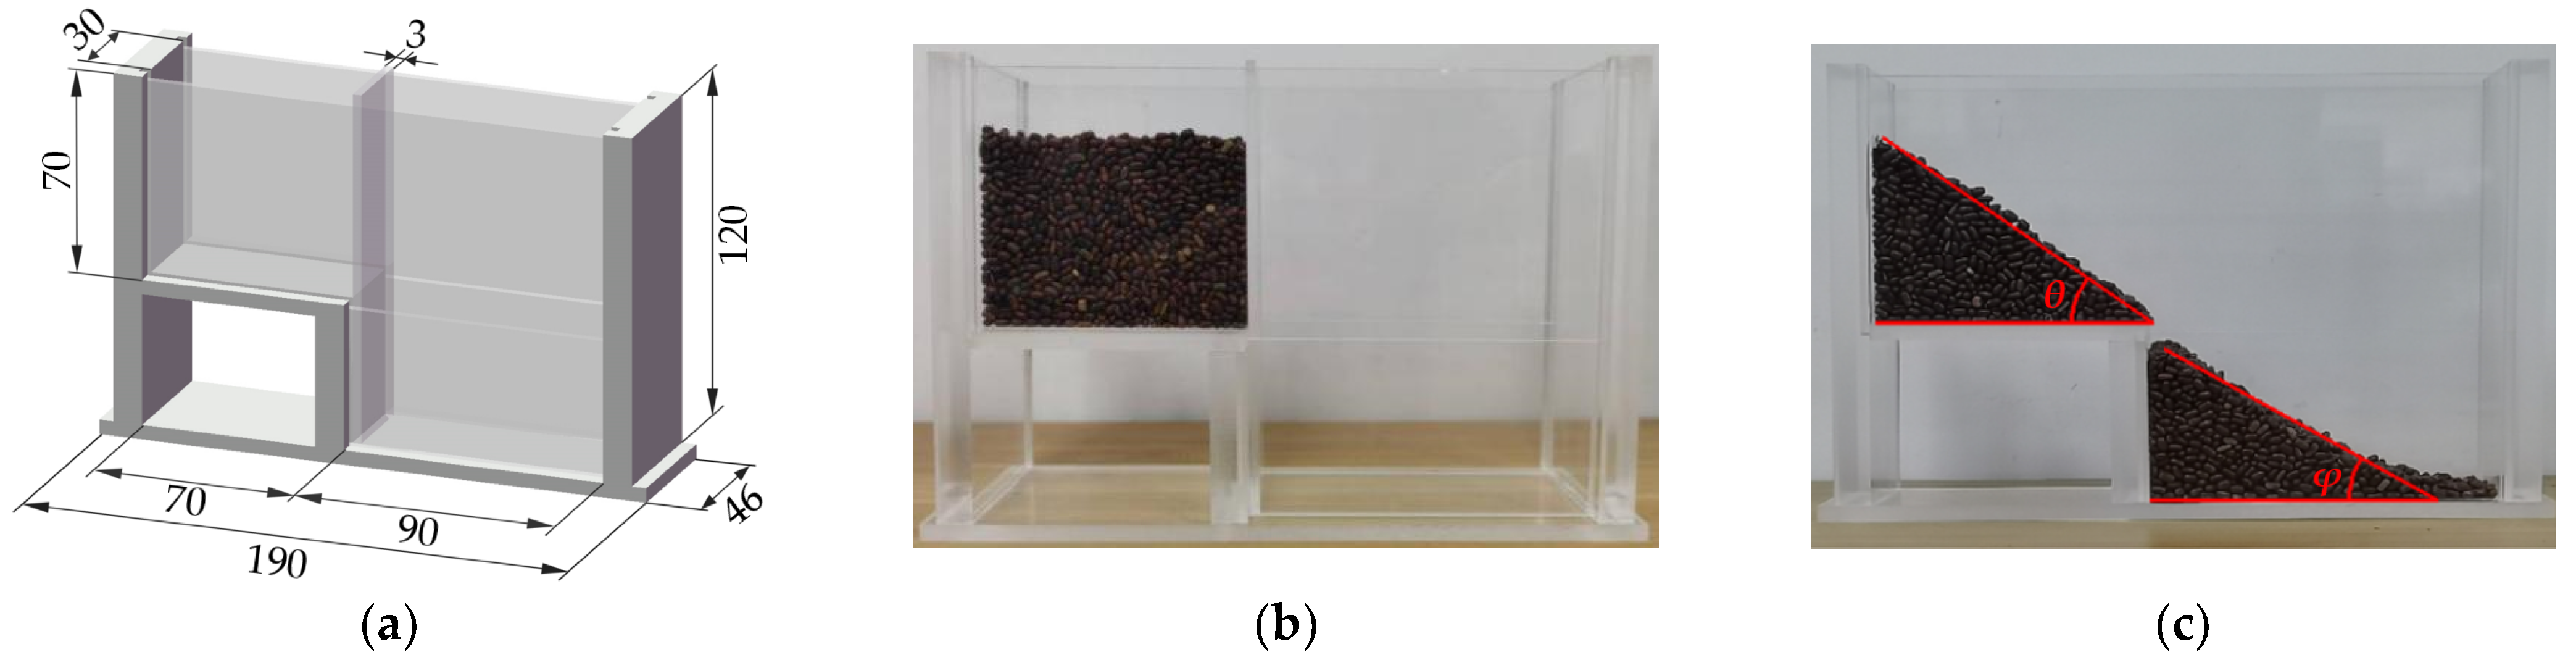
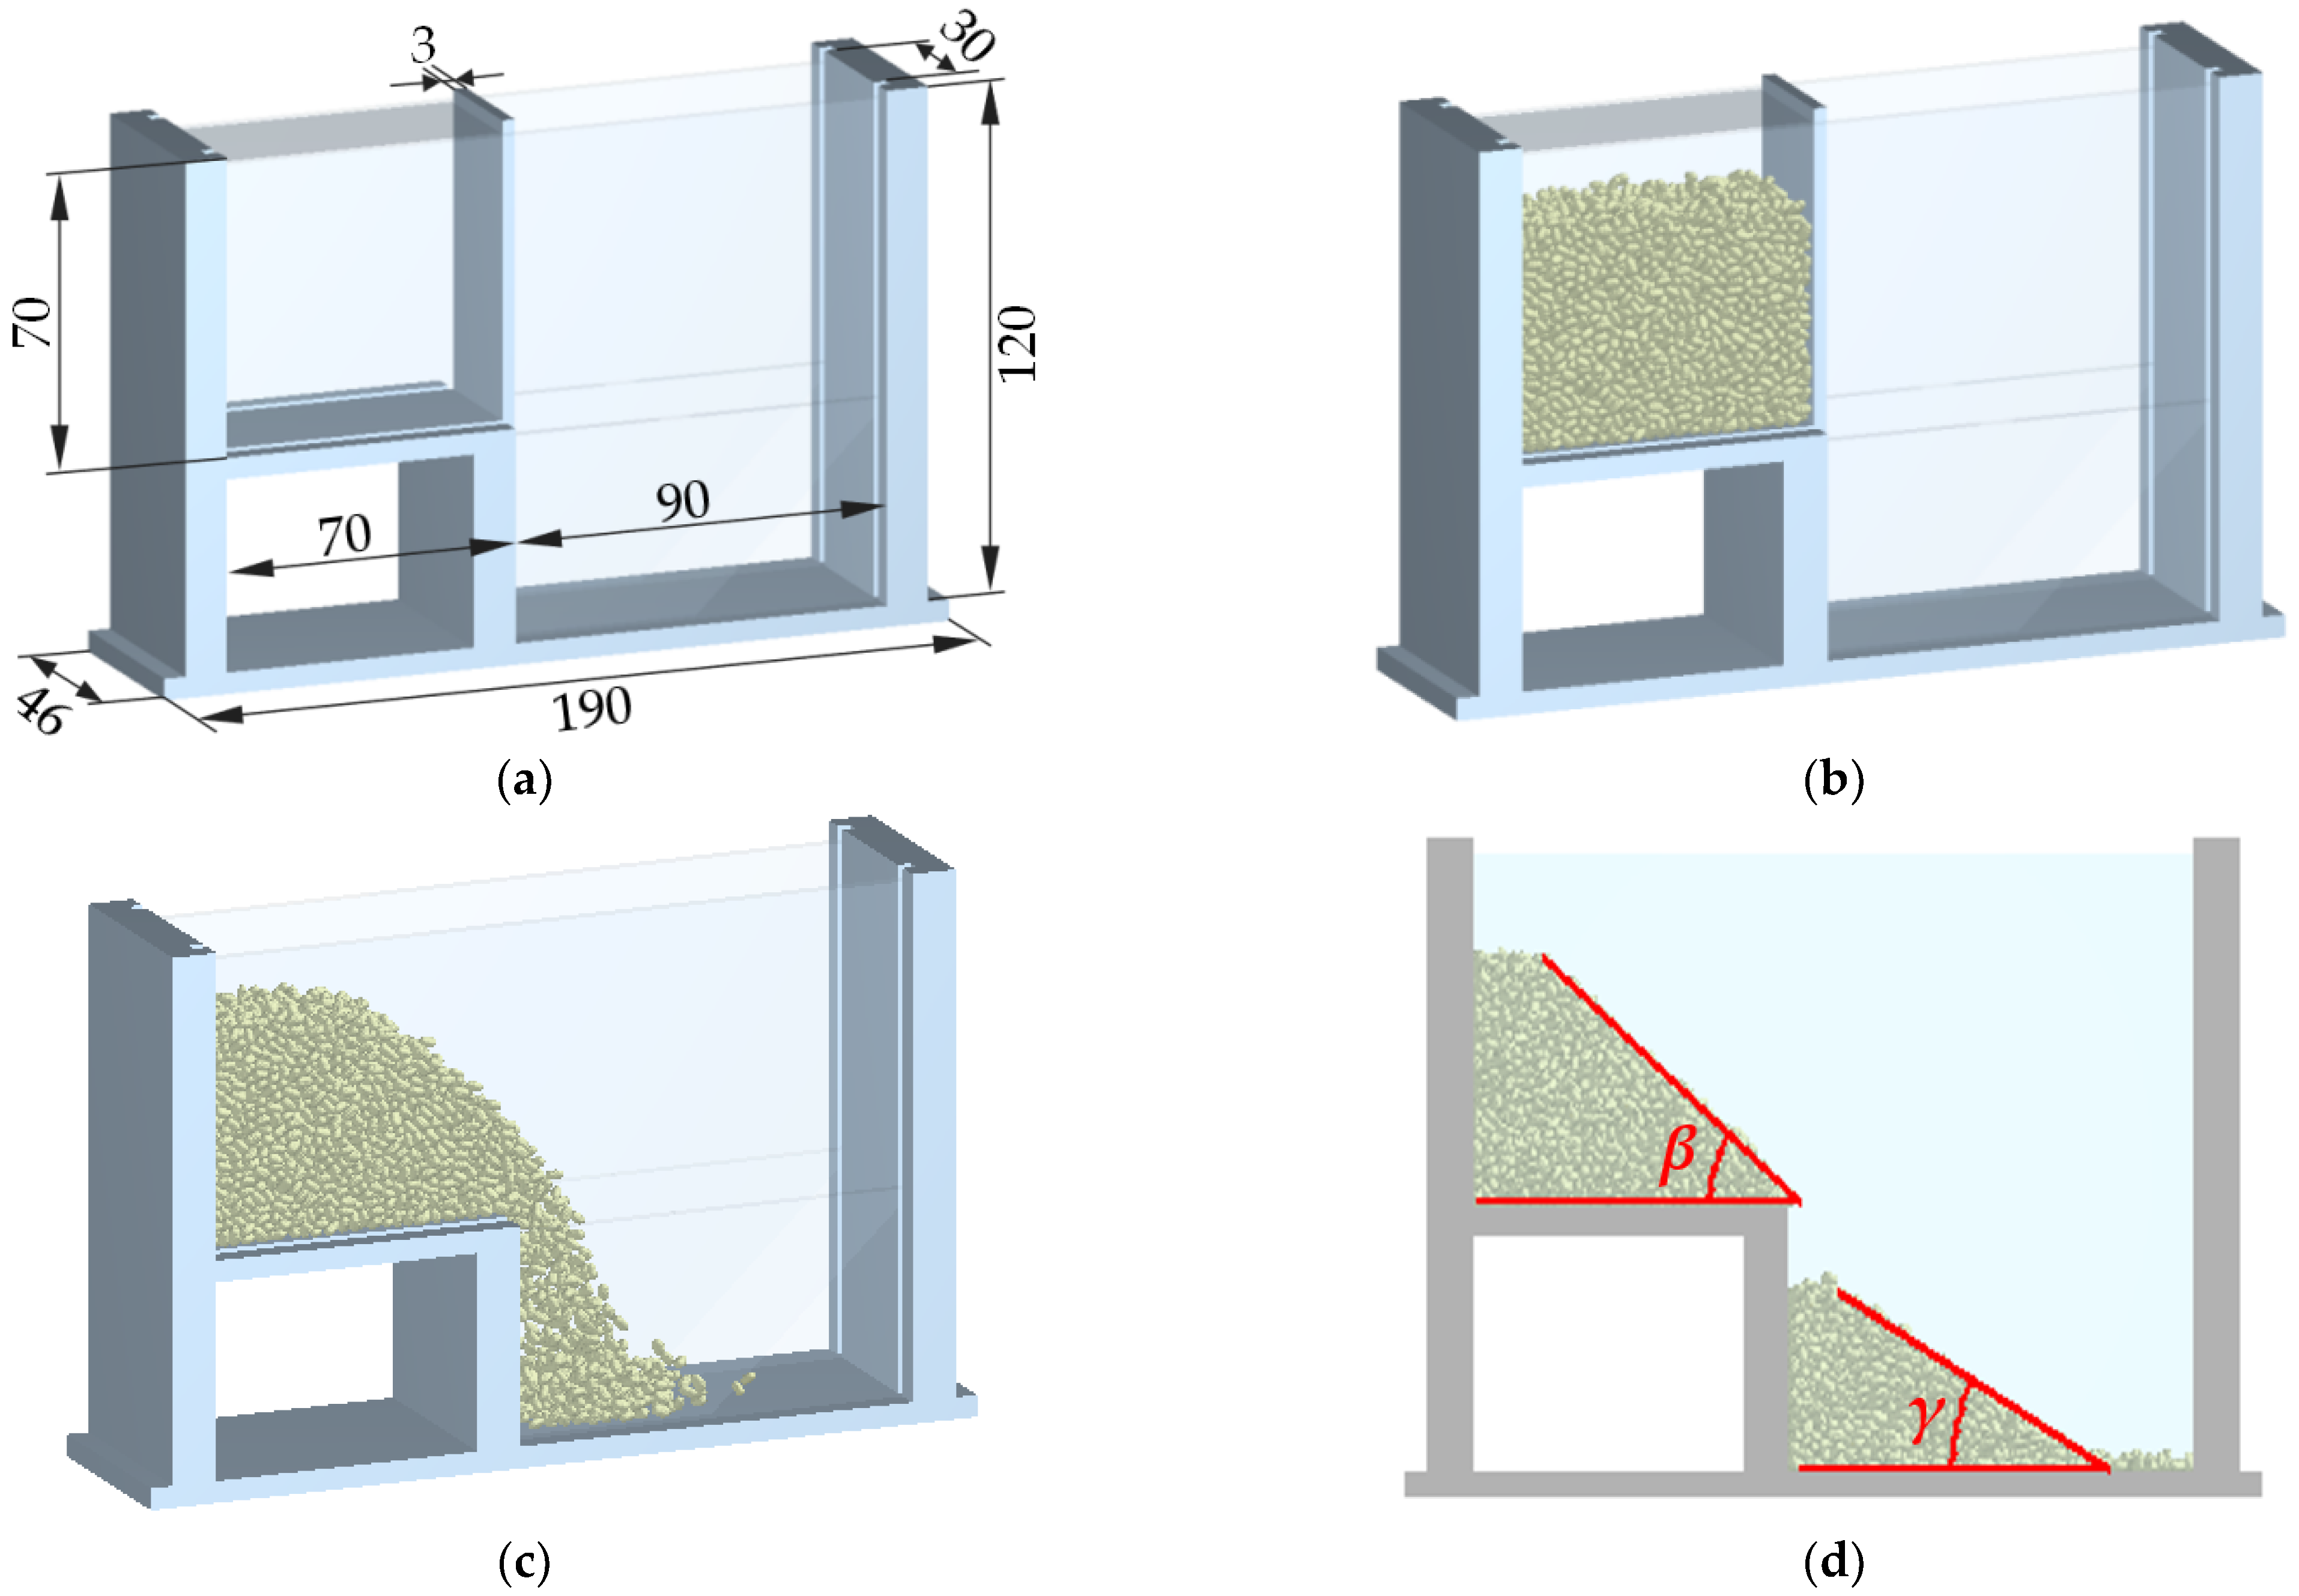
The resting angle and the stacking angle of sesbania seeds were measured simultaneously by using the self-developed measuring device for the seed drop test, as shown in
Figure 1a. The device is mainly composed of two layers of seed boxes, and the baffle and the material of the device are made of transparent resin. The test material used was the
Yan Jing No.1 sesbania seed. The test measurement method is as follows: firstly, insert the baffle into the side of the lower seed box; secondly, slowly fill the upper seed box with sesbania seeds until the seeds reach about 2/3 of the volume of the upper seed box, and try to ensure that the upper surface of the seed heap is horizontal; lastly, quickly pull the baffle upwards and the seeds in the upper seed box will flow into the lower seed box under the action of gravity; the remaining seeds form a stair-shaped seed pile in the upper seed box, and the seeds flowing into the lower seed box form another stair-shaped seed pile in the lower seed box. The acute angle between the horizontal plane and the slope of the stair-shaped seed pile in the upper seed box is the resting angle of the seed, which is recorded as
θ; the angle between the horizontal plane and the slope of the stair-shaped seed pile in the lower seed box is the stacking angle of the seed and is recorded as
φ.
In order to avoid the influence of human measurement error, the resting angle and stacking angle are measured using computer image processing technology. After the state of the seed pile is stable, use the camera to collect the image of the seed pile, and use the MATLAB software (version R2018a) to process the image of the resting angle and the stacking angle. Firstly, use the noise reduction processing tool to obtain the original image, as shown in
Figure 2a. The left side is the image of the resting angle and the right side is the image of the stacking angle. Secondly, after the processing of the original images into grayscale and binary images, as shown in
Figure 2b,c, extract the features of the edge pixel points of the seed pile; the connections of the edge pixel points comprise the boundary contour curve of the seed pile. Based on the least square method, fit the boundary contour curve of the seed pile to an optimal straight line. This optimal straight line is shown in
Figure 2d, in which the line’s slope is the tangent value of the actual physical resting angle and the actual physical stacking angle of seeds.
The resting angle and the stacking angle in the front and back directions of the upper and lower seed boxes were measured in each group of experiments, repeated 5 times, and the average value was calculated.
Table 1 shows the measurement results: the average values of the resting angle and stacking angle in the test are 34.906° and 26.975°. The measurement method of the resting angle and stacking angle in the simulated seed drop test is the same as this method.
2.2. Simulated Seed Drop Test
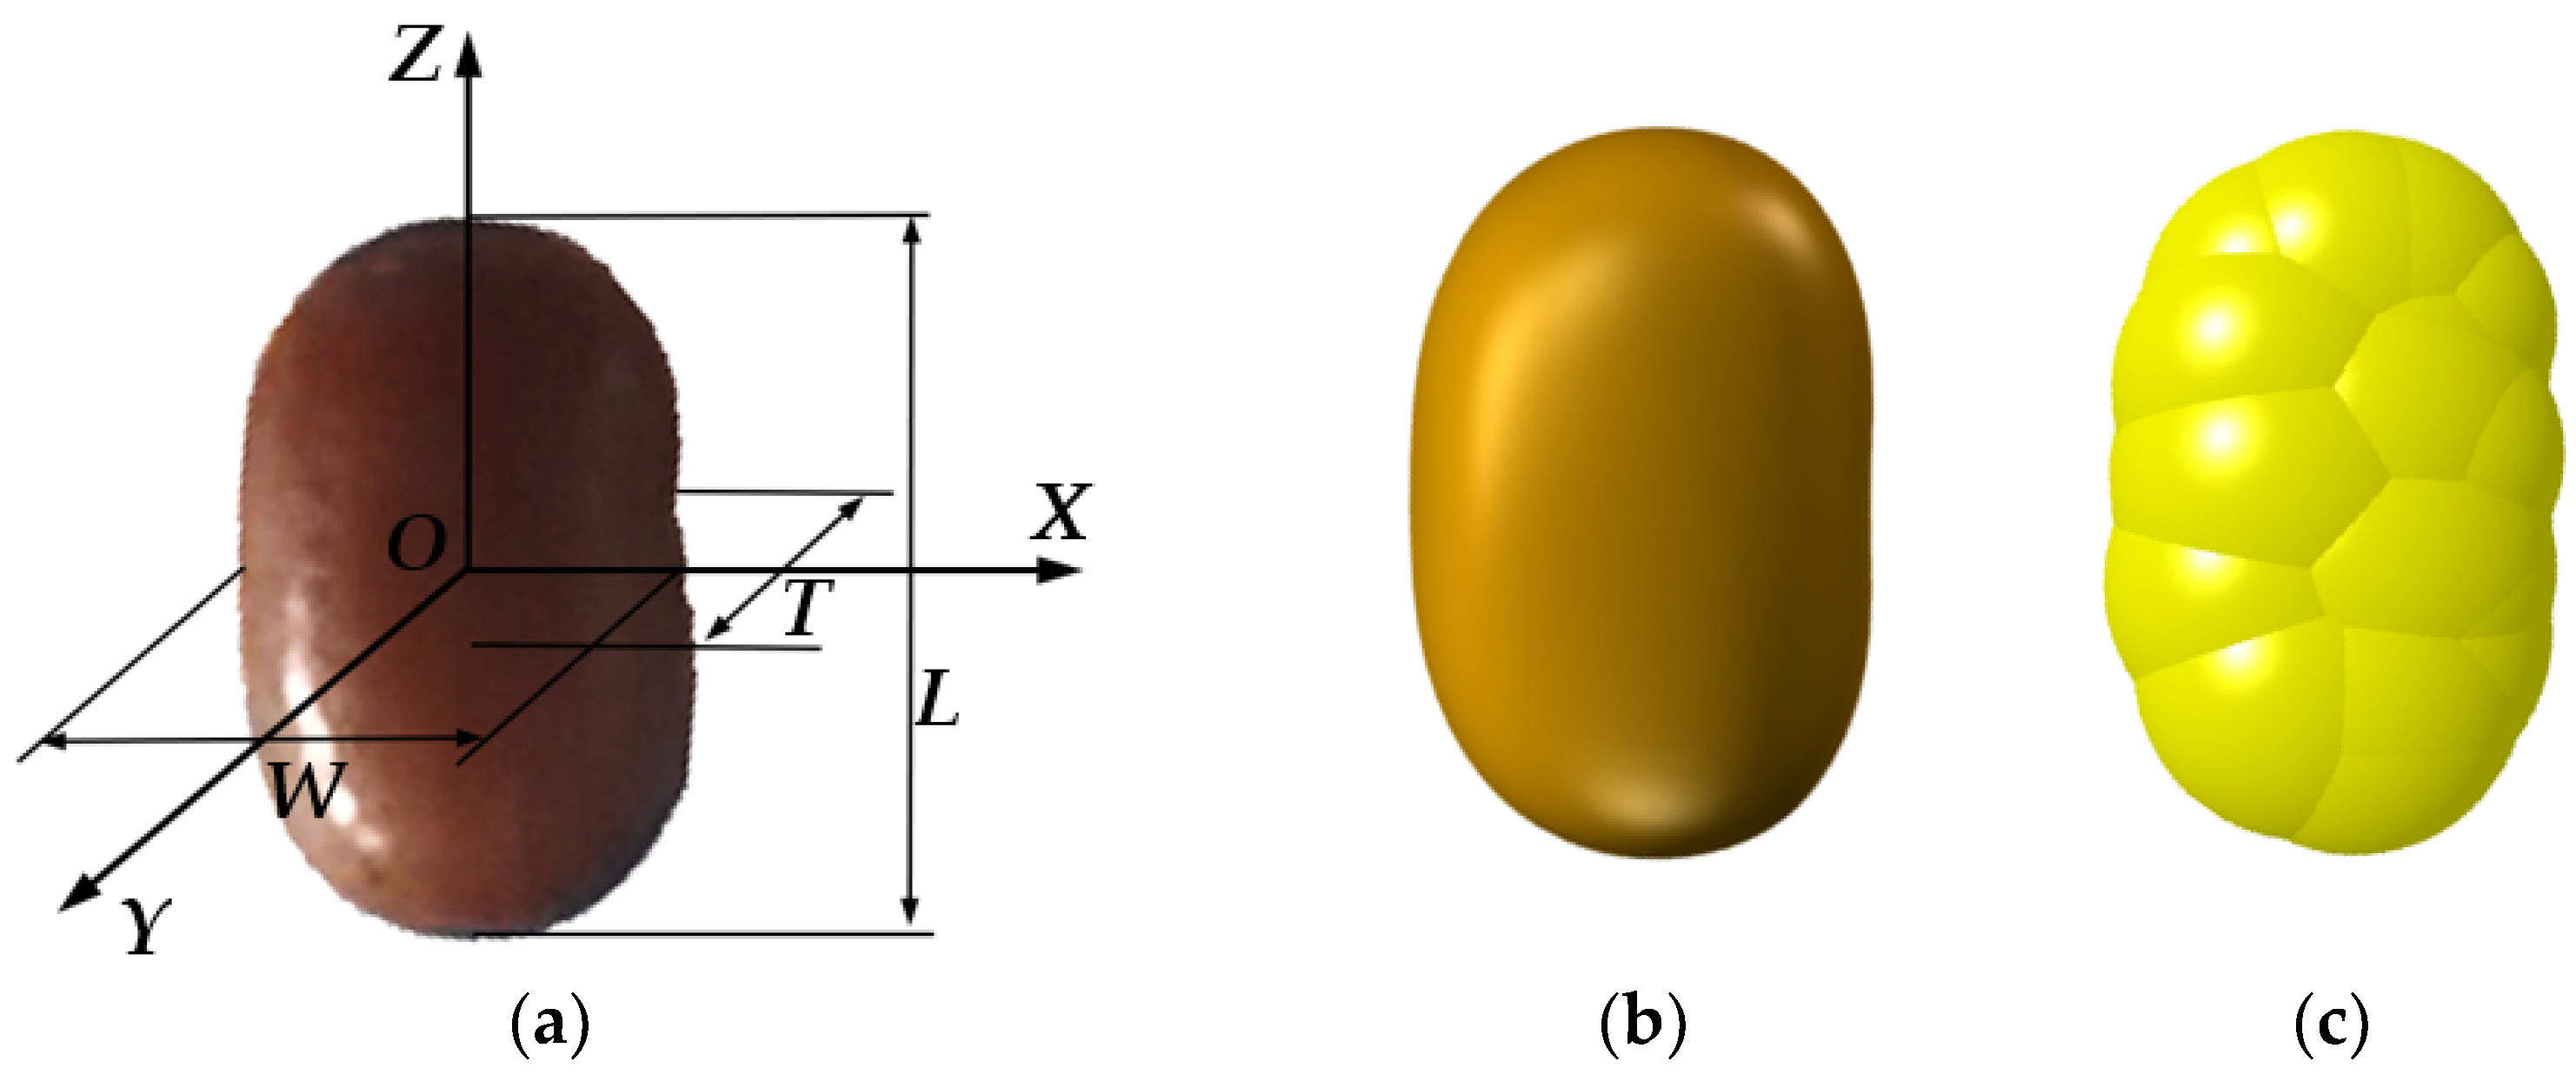
The basic physical parameters of sesbania seed measured using physical tests are shown in
Table 2. Due to the irregular shape of sesbania seeds, it is necessary to establish the discrete element simulation model of sesbania seeds accurately; therefore, 500 seeds of
Yan Jing No.1 sesbania seeds were selected randomly, the size of the three axes size was measured using a digital vernier caliper. Finally, the average length, width, and thickness of the seeds were obtained as follows: 4.07 mm, 2.52 mm, and 2.14 mm. Based on the actual measured seed triaxial size data, the sesbania seed particle that was similar to the average values of the length, width, and thickness was selected to establish the three-dimensional model. Based on the theory of reverse engineering, the contour shape of the seed surface is scanned using a 3D scanner and grating projection to obtain the point cloud image of the seed’s shape; then, SolidWorks software was used to export the point cloud data into a three-dimensional model of the seed contour, as shown in
Figure 3.
The sesbania seed model was imported using EDEM 2022 software. Due to the irregular shape of sesbania seeds, the method of multi-spherical particle filling was adopted. Therefore, the multi-sphere particle filling method and EDEM automatic particle filling module were used to establish a sesbania seed filling model. The smoothness was set to 4, the minimum spherical radius was 0.7 mm, and the grid elements in the X, Y, and Z directions were 45, 35, and 30 respectively.
Figure 3c shows the seed discrete element multi-spherical filling model.
The actual size of the seed-dropping device was measured using SolidWorks 2022 to establish its 3D model. It was then saved in IGS format, and the model was imported and opened using EDEM 2022. After consulting the literature [
21,
22,
23], Poisson’s ratio of transparent resin was set to 0.4, the density of the transparent resin was set to 1180 kg/m
3, and the shear modulus of the transparent resin was set to 0.18 GPa.
Considering the relatively smooth surface and low water content of sesbania seeds, there is almost no bonding between the seeds [
24]; therefore, the Hertz–Mindlin (no slip) contact model was selected as the contact model between the seeds and contact materials [
25,
26]. The generated number of seeds and the test process were the same as in the actual seed drop test. In the simulated seed drop test, the seed particles were dynamically generated into the seed box using the particle factory, and the total particle number of seeds was 5000. Meanwhile, the automatic particle filling module in the EDEM software used 22 discrete elements to fill a single seed particle, and the number of the discrete elements used in the simulated seed drop test was 1.1 × 10
5.
Figure 4 shows the process of the simulated seed drop test. After the simulation test was completed, the image of the resting angle and the image of the stacking angle were collected, using MATLAB software for image processing, and the simulated resting angle
β and the simulated stacking angle
γ were obtained. Then, the rest angle error and stack angle error between the actual seed drop test and simulated seed drop test were calculated, and the calculation formula is as follows:
where the actual resting angle is
θ; the actual stacking angle is
φ; the rest angle error between the actual seed drop test and simulated seed drop test is Y
1, and the stack angle error between the actual seed drop test and simulated seed drop test is Y
2.
2.3. Plackett–Burman Test
The Plackett–Burman test method is based on comparing the differences in the effects of two-level factors on the target response value and further screening out the parameters that have a significant effect on the target value [
27]. Design-Expert software was used to design the Plackett–Burman test, taking the rest angle error Y1 and the stack angle error Y2 of the seed drop test as the response value and setting 11 factors; the parameters A~G are real simulation parameters, and the parameters H~K are virtual parameters. By consulting the relevant literature and a large number of pre-tests in the early stage, the value range of each influence parameter is selected. Each influence parameter is set to high and low levels according to their selection range, and the code values are 1 and −1, as shown in
Table 3. Twelve groups of tests were set according to the coding value of the test, and each group repeated the simulated seed drop test five times and selected the average value of the angle before calculating the average of Y
1 and Y
2.
Table 4 shows the design scheme of the P-B test and the result of the simulated seed drop test. Design-Expert software was used to employ the analysis of variance (ANOVA) for the simulation test result and obtain the significance ranking of each parameter to the response value, as shown in
Table 5.
Through the P-B test results, it can be concluded that the collision recovery coefficient between seeds E, the static friction coefficient between seeds F, and the rolling friction coefficient between seeds G have a significant effect on the rest angle error Y1 and the stack angle error Y2, and the effect of other parameters on the response value is not significant. Therefore, the significant parameters E, F, and G were optimized in the steepest ascent test. In this test, the C.V. were 7.28% and 5.18%, respectively, and they were all less than 10%. This shows that the test results are highly reliable. The adjusted R2 were 0.9455 and 0.9459, respectively, and all were close to 1, showing that the regression model established in this test has better fitting superiority. Adeq Precision measures the signal-to-noise ratios, which were 16.633 and 17.449; their values were greater than four and are, thus, considered reasonable. Therefore, the data results of this test have high reliability.
2.4. Steepest Ascent Test
In order to optimize the contact parameters E, F, and G with significant influence and determine the high-level values, low-level values, and zero-level values of the three-factor quadratic rotation orthogonal combination test, based on the analysis results of the P-B test, the steepest ascent test was carried out. The parameters were set according to the insignificant effects on the middle values, that is, the collision recovery coefficient between seed and wall was 0.5, the static friction coefficient between seed and wall was 0.4, the rolling friction coefficient between seed and wall was 0.25, and Poisson’s ratio of seeds was 0.4. Because the standardized effect of the three significant parameters was positive in all, the parameter values were arranged from low to high. According to the steepest ascent test design, the simulated seed drop test was carried out using EDEM 2022 software. Each group of tests was conducted five times and the average value was selected; then, the rest angle error and the stack angle error were calculated.
Table 6 shows the design scheme and results of the steepest ascent test.
The steepest ascent test results show that, with an increase in the collision recovery coefficient between seeds E, the static friction coefficient between seeds F, and the rolling friction coefficient between seeds G, both the rest angle error Y1 and the stack angle error Y2 showed a trend of decreasing first and then increasing. Among them, the rest angle error and the stack angle error in the third group of tests were the smallest. Therefore, it can be inferred that the optimal parameter range is around the level of the third set of tests; the second, third, and fourth groups of test levels were selected as the low, middle, and high levels of the three-factor quadratic rotation orthogonal combination test, and this established the RSM analysis and regression model. The optimization ranges of the collision recovery coefficient between seeds, the static friction coefficient between seeds, and the rolling friction coefficient between seeds were 0.31~0.59, 0.39~0.63, and 0.04~0.10, respectively.
2.5. Three-Factor Quadratic Rotation Orthogonal Combination Test
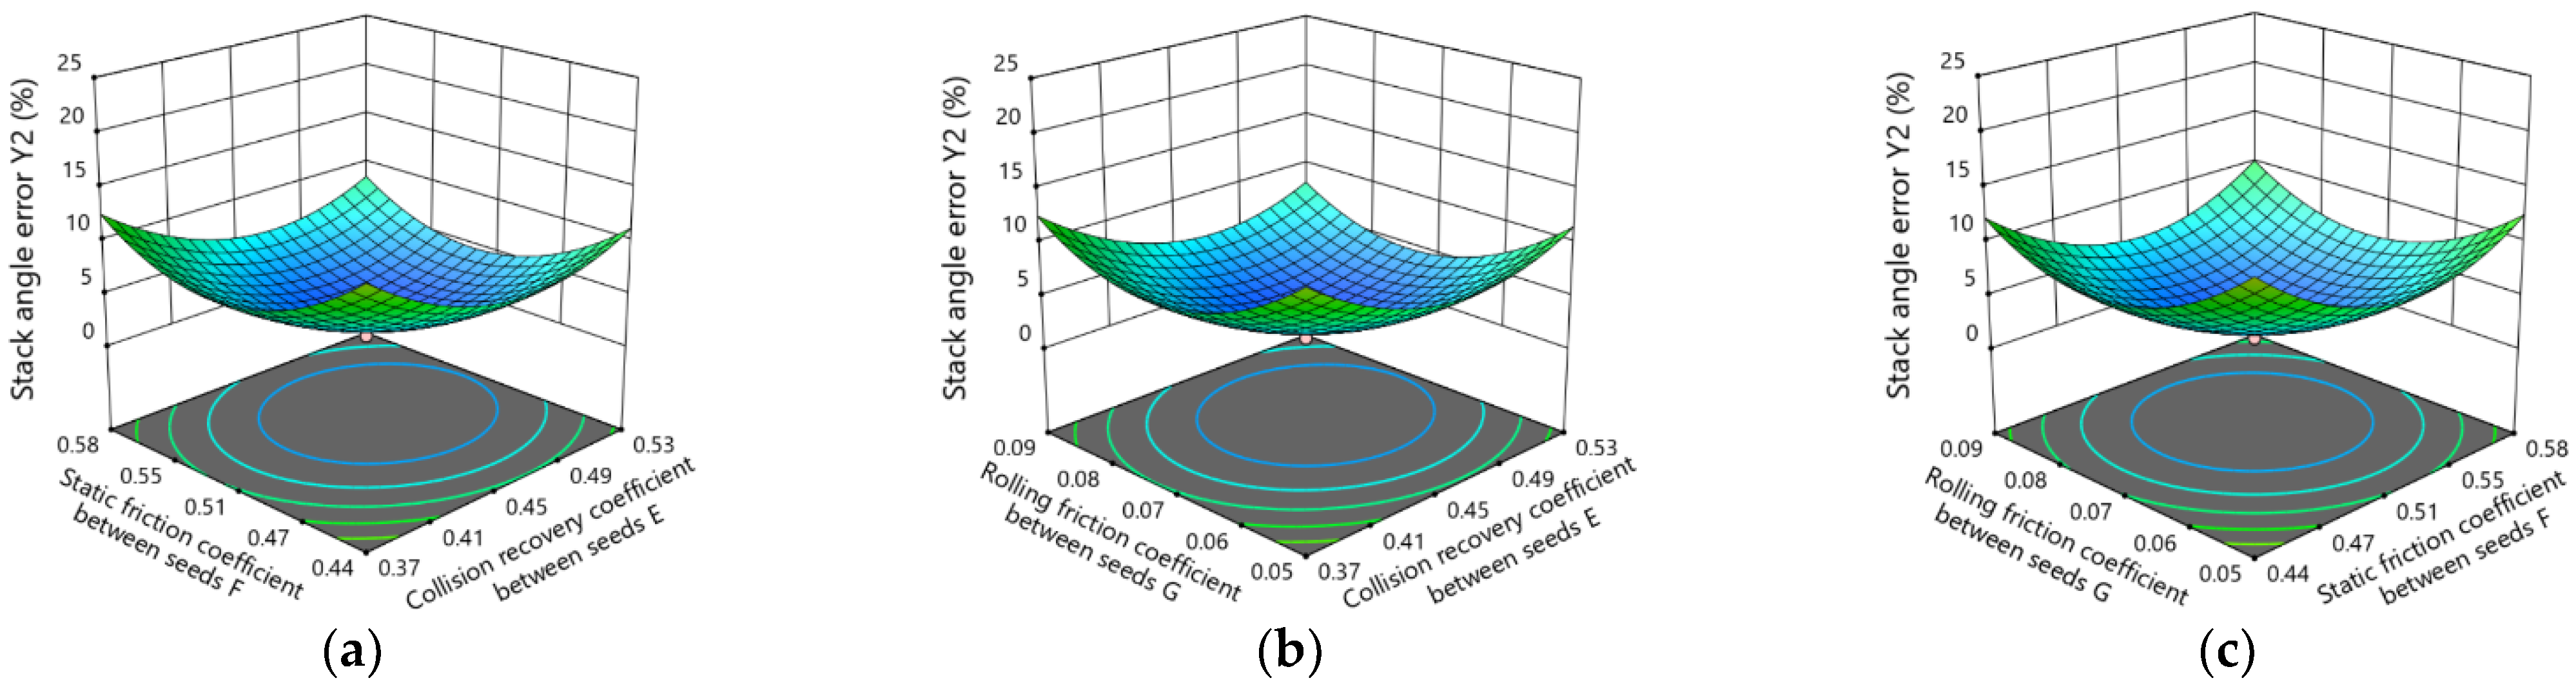
Taking the collision recovery coefficient between seeds E, the static friction coefficient between seeds F, and the rolling friction coefficient between seeds G as the test factors, according to the results of the steepest ascent test, the second, third, and fourth groups’ sets of tests are low level (−1), middle level (0), and high level (1), respectively, taking the rest angle error Y1 and the stack angle error Y2 as response value and carrying out a three-factor quadratic rotational orthogonal combination test.
The coded values of the test factors are shown in
Table 7. Twenty-three test points were set for the test scheme, and the test scheme included 14 test analysis factors and 9 zero-point estimation errors. The test design scheme and results are shown in
Table 8 (e, f, and g are the coded values of the test factors), repeating each experiment five times and taking the average value.
4. Test Verification
In order to further verify the accuracy and reliability of the discrete element model of the sesbania seeds and calibrated contact parameters, experimental verification of the seeding test using a fluted roller feed mechanism was employed. The mass flow rate of the seeds at the seeding port was used as the test index to compare the measured and simulated values of the mass flow rate under the different rotating speeds of the sheave. The fluted roller feed mechanism is 3D printed, and the material used for 3D printing is resin, as shown in
Figure 7. In this test, the seed of
Yanjing No.1 sesbania was chosen as the test material. During the test, a certain amount of sesbania seeds were used to fill the seed box. The stepping motor was then started, which drives the sheave to rotate through the drive shaft, and the population is filled into the groove of the sheave under the action of gravity. After filling, protecting, and falling, the seeds fall to the collection plate below the seed outlet under the action of gravity, and the weight of the seeds is recorded in the collection tray every 1 min. Finally, the mass flow rate of the seed is calculated. This is repeated over five tests, and the average mass flow rate is calculated. The simulation model of the fluted roller feed mechanism is imported and the contact parameters are calibrated; then, the discrete element model of the sesbania seed is imported into the EDEM software, whereby simulated tests are carried out under the same conditions as the actual test. Finally, the mass flow rate of the seeding port is outputted.
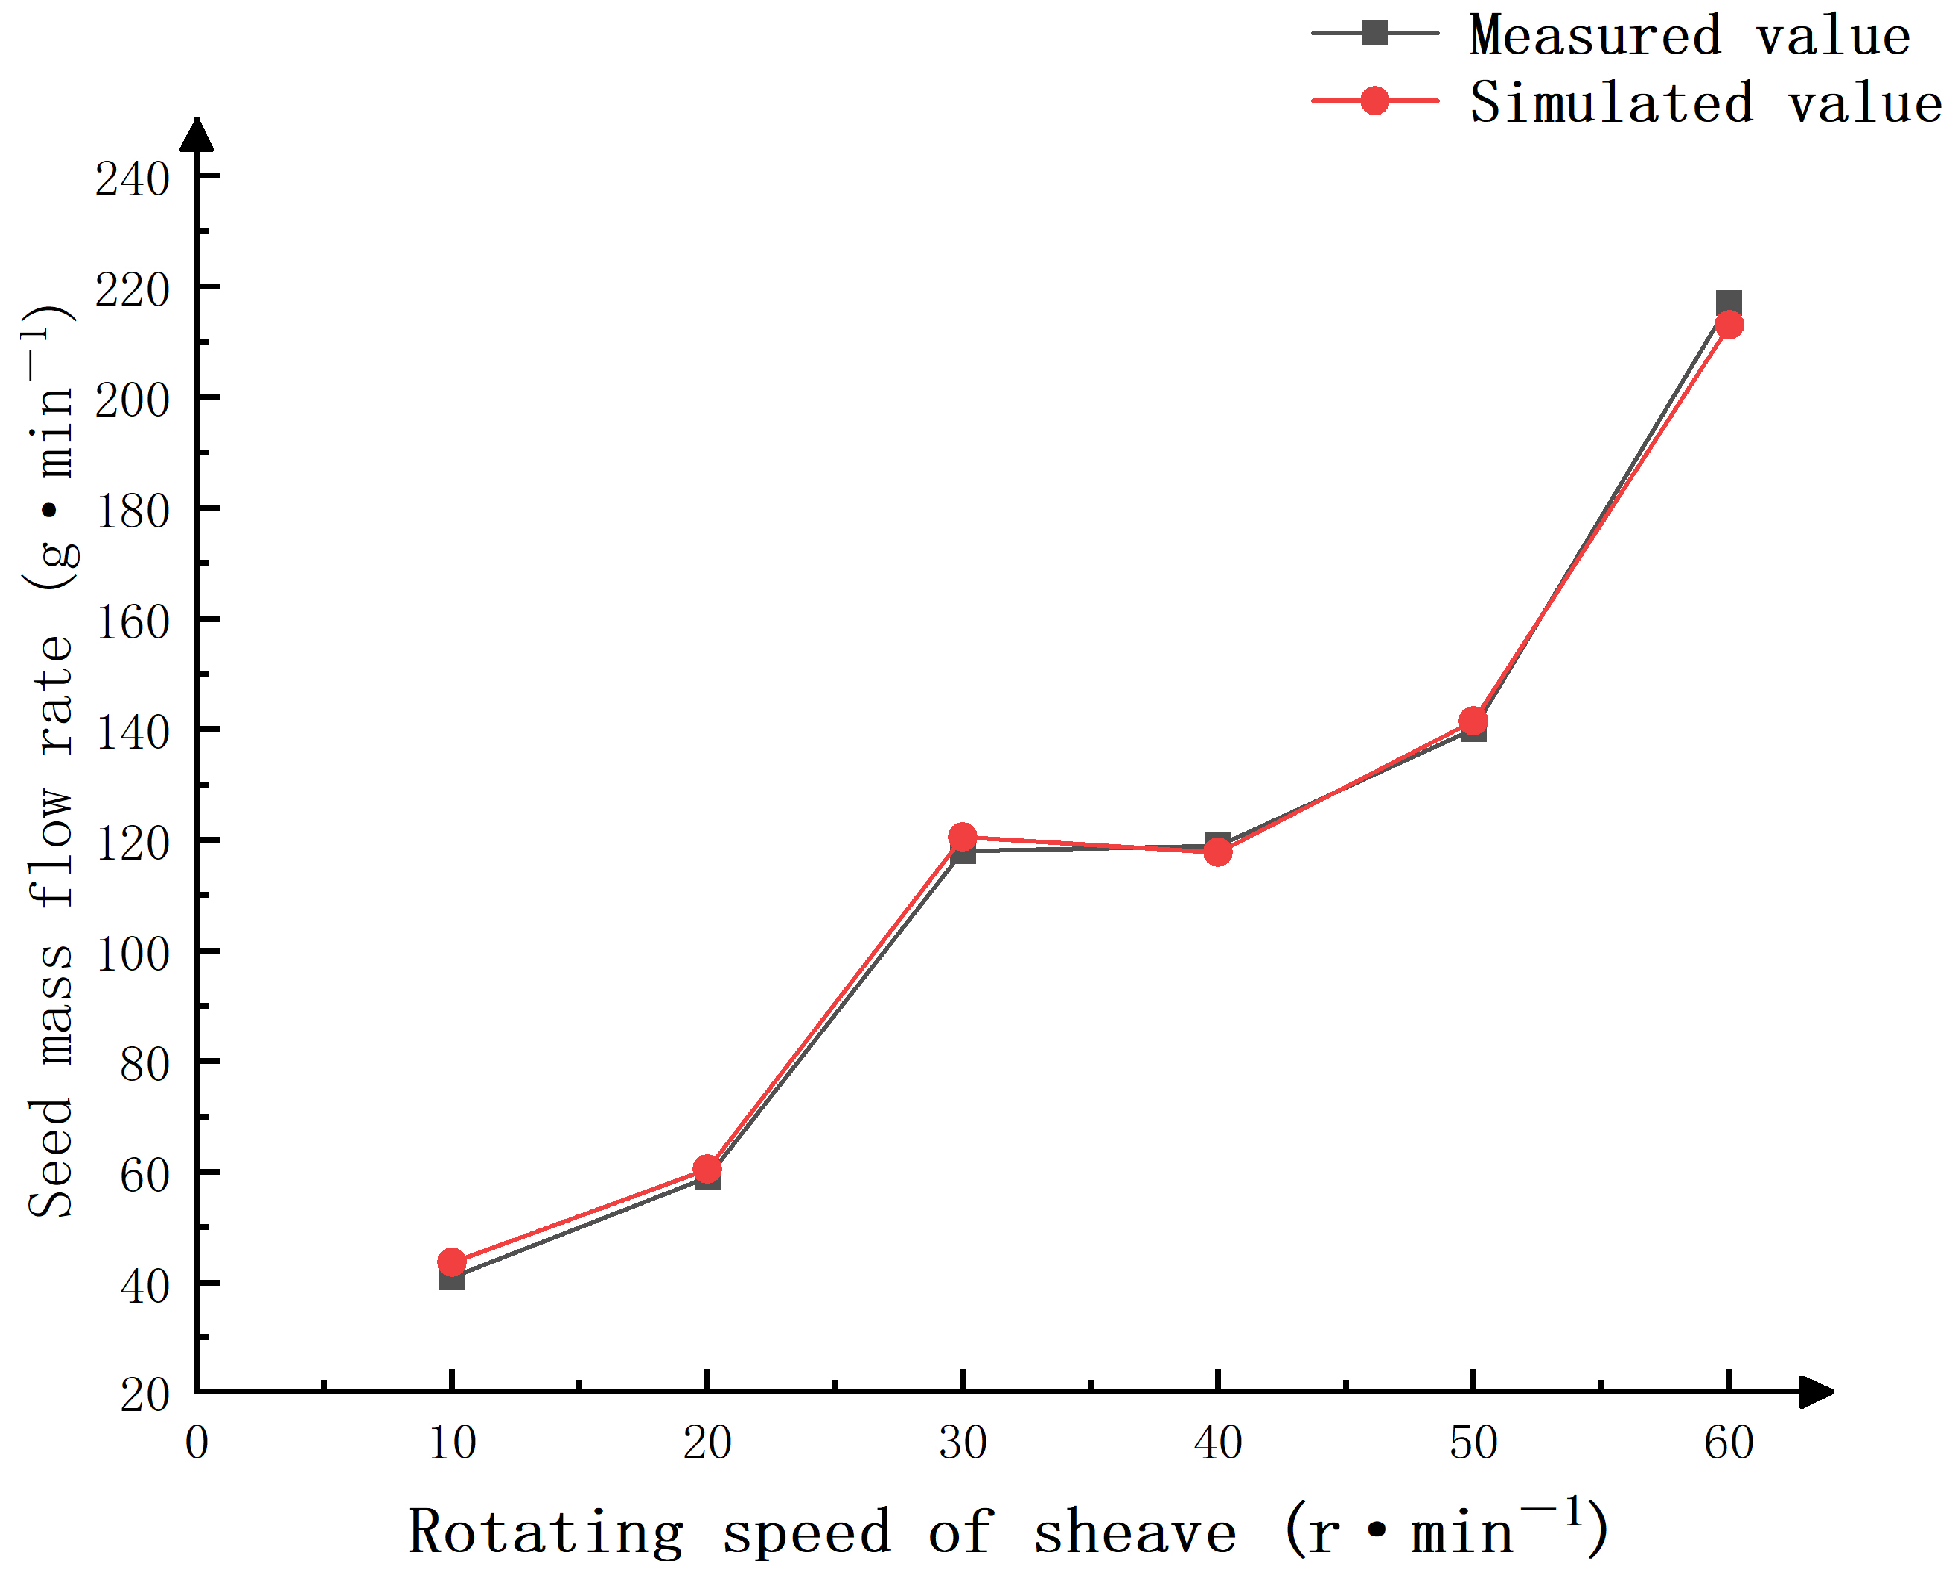
Through an analysis, the measured and simulated values of the seed mass flow rate under the different rotating speeds of the sheave are shown in
Figure 8. As shown in the figure, the trend of the measured and simulated values of the mass flow rate of the sesbania seeds is basically linear with the rotating speed of the sheave, and the average relative error is 2.74% (less than 5%); therefore, the discrete element simulation model of sesbania seeds and the calibration results of the contact parameters are in line with the actual situation. To sum up, they can be applied to discrete element simulation tests.
5. Conclusions
(1) We developed a new type of seed drop test device that can simultaneously measure the resting angle and the stacking angle and has the advantages of a simple and convenient operation. Taking sesbania seeds as the research object, through a seed dropping test, and based on the digital image processing technology of MATLAB software to fit the boundary contour curve of the seed pile to an optimal straight line, the actual resting angle and actual stacking angle of the seed pile were obtained as 34.906° and 26.975°;
(2) The three-axis size of the sesbania seeds was measured, and the selected seed particles that were similar to the average size of the three-axis were used in 3D scanning technology to obtain point cloud data on the seed surface; then, the point cloud data were exported to a three-dimensional model of the seed contour using SolidWorks software. Finally, a 3D model of a sesbania seed was imported into EDEM software. Based on the method of multi-spherical particle filling and the Hertz–Mindlin (no slip) contact model to establish a discrete element simulation model of the sesbania seed, we conducted a simulated seed drop test. Taking the rest angle error and stack angle error of the seed drop test as response values, the contact parameters with the most significant effect on the response values were screened using the Plackett–Burman test, including the collision recovery coefficient between seeds, static friction coefficient between seeds, and rolling friction coefficient between seeds; the optimal parameter range of these three contact parameters was further refined by the steepest ascent test. Taking these three contact parameters as test factors, and taking the rest angle error and stack angle error as response values, a three-factor quadratic rotation orthogonal combination test was carried out to establish a multiple mathematical regression model between test factors and response values. The ANOVA shows that the effects of the three contact parameters and their quadratic terms on the rest angle error and stack angle error are significant; using Design-Expert software to perform response surface analysis, the results showed that the interaction between each contact parameter has a significant effect on both the rest angle error and the stack angle error;
(3) Taking the minimum rest angle error and the minimum stack angle error as the optimization index, and taking the collision recovery coefficient between seeds, static friction coefficient between seeds, and rolling friction coefficient between seeds as the optimization object, we used Design-Expert software to optimize and solve the regression model, taking into account the minimum rest angle error and the minimum stack angle error. The optimal combination of contact parameters was obtained as follows: the collision recovery coefficient between seeds is 0.463; the static friction coefficient between seeds is 0.520; and the rolling friction coefficient between seeds is 0.072. At this time, the rest angle error is 1.420%, and the stack angle error is 1.991%;
(4) We conducted a seeding test through a fluted roller feed mechanism based on the discrete element simulation model of the sesbania seed and the calibrated contact parameter combination to conduct a simulated seeding test using EDEM software. The results of the validation test show that, under the condition of different speeds of the sheave, the average relative error between the measured value and the simulated value of the seed mass flow rate is 2.74%. Therefore, the discrete element model of sesbania seeds and the calibration results of the contact parameters established in this study are accurate and reliable and can be used for a discrete element simulation test.


