Article

Reliability Evaluation of DC/DC Converter in Direct Current Collection System of Wind Farm Considering the Influence of Control Strategy

College of Electrical Engineering, Xinjiang University, Urumqi 830017, China
*
Author to whom correspondence should be addressed.
Processes 2023, 11(10), 2825; https://doi.org/10.3390/pr11102825
Submission received: 18 August 2023 / Revised: 20 September 2023 / Accepted: 23 September 2023 / Published: 25 September 2023
(This article belongs to the Special Issue The Role of Renewable Energy Systems in the Modern Societies)

Abstract

:
The DC collection system of wind farms can effectively solve the problems of harmonic resonance and reactive power transmission in large-scale wind power AC collection systems, and has broad development prospects. The DC/DC converter is critical equipment in the wind farm DC collection system, and its reliability is related to the entire collection system’s safe and stable operation. The reliability of DC/DC converters is affected by factors such as system operating conditions and control strategies. Based on this, a reliability evaluation model for boost full-bridge isolated (BFBIC) DC/DC converters is proposed from the device level to the submodule level and then to the equipment level, incorporating operating conditions and control strategies into reliability analysis. Firstly, in device-level reliability modeling, the impact of DC/DC converter operating conditions and control strategies on insulated gate bipolar transistor (IGBT) module losses and junction temperature fluctuations are considered. Secondly, fault tree analysis (FTA) is used to establish the reliability model of the BFBIC submodule and DC/DC converter. In the end, we verify the effectiveness of the proposed model through a numerical example, and provide solid data support for analyzing the reliability of the wind farm DC collection system.

1. Introduction

In the wake of the vigorous development of the wind power industry, it is essential to study the efficient collection of wind power. At present, wind farms use AC technology to collect electric energy. Although this method is mature and widely used, there are problems such as harmonic resonance and reactive power compensation [1,2]. Many experts and researchers, both from within the country and abroad, have been focusing on wind farm DC collection technology as a solution to the aforementioned issues [3,4]. The wind farm DC collection system boosts the low-voltage DC output from the DC-output wind turbines through the DC/DC converter, and then integrates it into the grid through a medium-voltage DC line. This technology avoids multiple AC–DC conversions, simplifies the entire process of a wind farm from power generation to grid connection, and reduces losses and system investment, which results in certain developmental advantages [5,6,7]. As the critical equipment in the DC collection system of a wind farm, the DC/DC converter has the characteristics of a small volume, light weight, and large transmission capacity, and it has become the current research hotspot [8,9]. However, the use of DC/DC converters will also result in a decrease in DC collection system reliability. Therefore, it is of great significance to evaluate the DC/DC converter’s reliability for study of the reliability of wind farm DC collection systems.
In DC/DC converters, the IGBT module, as an important component, may fail due to the influence of the environment, operating conditions, and aging conditions during actual operation. According to reliability research statistics of power electronic equipment, equipment failures caused solely by power switch device failures account for about 34% of failures [10]. Therefore, the reliability of the IGBT module is an important guarantee for DC/DC converters to achieve energy-efficient and high-reliability conversion. It plays an important role in their reliable operation, and establishing a reliability model for IGBT modules is the basis for evaluating the reliability of DC/DC converters.
The main evaluation methods for the reliability of IGBT modules are based on the reliability manual of power electronic devices [11,12] and on failure mechanisms [13]. The former can consider the influence of different stress factors in the reliability analysis of power electronic devices, whereas the latter considers the influence of aging and combines fatigue cumulative failure theory to conduct reliability analysis, such as Bayerer, Coffin–Manson–Arrhenius, and other models [14,15]. The reliability evaluation results are more accurate, and current research is mainly based on this method. At present, scholars have further studied the reliability of power electronic equipment based on the reliability of IGBT modules. For example, for wind turbine converters, considering the effects of factors such as junction temperature fluctuation characteristics, multi-time scale characteristics [16], failure mechanisms, and wind speed [17] on the reliability of IGBT modules inside converters, a reliability evaluation model for wind turbine converters has been established. For modular multilevel converters (MMCs), the analytical solution of IGBT module power loss [18] and the impact of equipment historical operating conditions [19] on the reliability of IGBT modules have been considered to evaluate the reliability of MMCs. For inverters, the impact of the SPWM modulation method of the equipment on the duty cycle of the IGBT module has been considered, the IGBT module failure rate calculated, and the reliability of the inverter evaluated based on this [20]. However, the above research did not address the impact of power electronic equipment control strategies on the reliability of IGBT modules and the equipment they constitute. Regardless of the type of power electronic equipment, its control strategy affects the fluctuation of the duty cycle of the IGBT module control signal over time. The change in duty cycle can lead to changes in IGBT module loss and junction temperature, and further change the reliability of the IGBT module and its constituent equipment. Therefore, it is necessary to consider the influence of the control strategy to correct the reliability evaluation results of the equipment.
In addition to the core device IGBT module, the reliability of DC/DC converters is also closely related to their own topological structure. The number of components in different topological structures varies, and the series and parallel connection methods between each component are different, resulting in different reliability. The research methods for the reliability of topological structures mainly include the reliability block diagram method, fault tree method, state transition method, etc. [21,22,23]. Due to the relatively mature and large-scale application of MMC converter technology in practical engineering, there are many studies on the reliability of converter topology structure. For example, reference [22] established its reliability model based on the k/n (G) model and comprehensively considered the MMC submodule, control and protection system, valve cooling system, and other parts. References [23,24,25] further considered the correlation and redundancy between MMC submodules, and established equipment reliability models based on improved methods such as Copula theory and semi-Markov process. Reference [26] divided an MMC into device levels based on its structure. The impact of reliability models at different scales, including circuit level and system level, was studied. As a power electronic device that has not yet been widely used, the research on DC/DC converters is currently mostly focused on topology optimization design, operating principles, and control strategies. There is little literature on the reliability evaluation of DC/DC converters, and scholars have only considered the operating conditions of dual active bridge (DAB)-type DC/DC converters in DC distribution networks. Reliability modeling has been performed based on factors such as submodule redundancy and correlation [27,28,29]. However, the number of IGBT modules in DAB-type DC/DC converters is large and the cost is high, whereas the BFBIC-type DC/DC converter replaces the secondary IGBT module with a diode, which not only meets engineering requirements but also compensates for the high cost of the DAB-type structure. Therefore, it is necessary to conduct a reliability evaluation for BFBIC-type DC/DC converters.
Based on the above considerations, this article will take the BFBIC-type DC/DC transformer as the research object, and combine its topology, control strategy, and operating conditions to establish reliability models for the IGBT module, BFBIC submodule, and the entire DC/DC converter at three levels: device level, submodule level, and equipment level. The specific process is as follows:
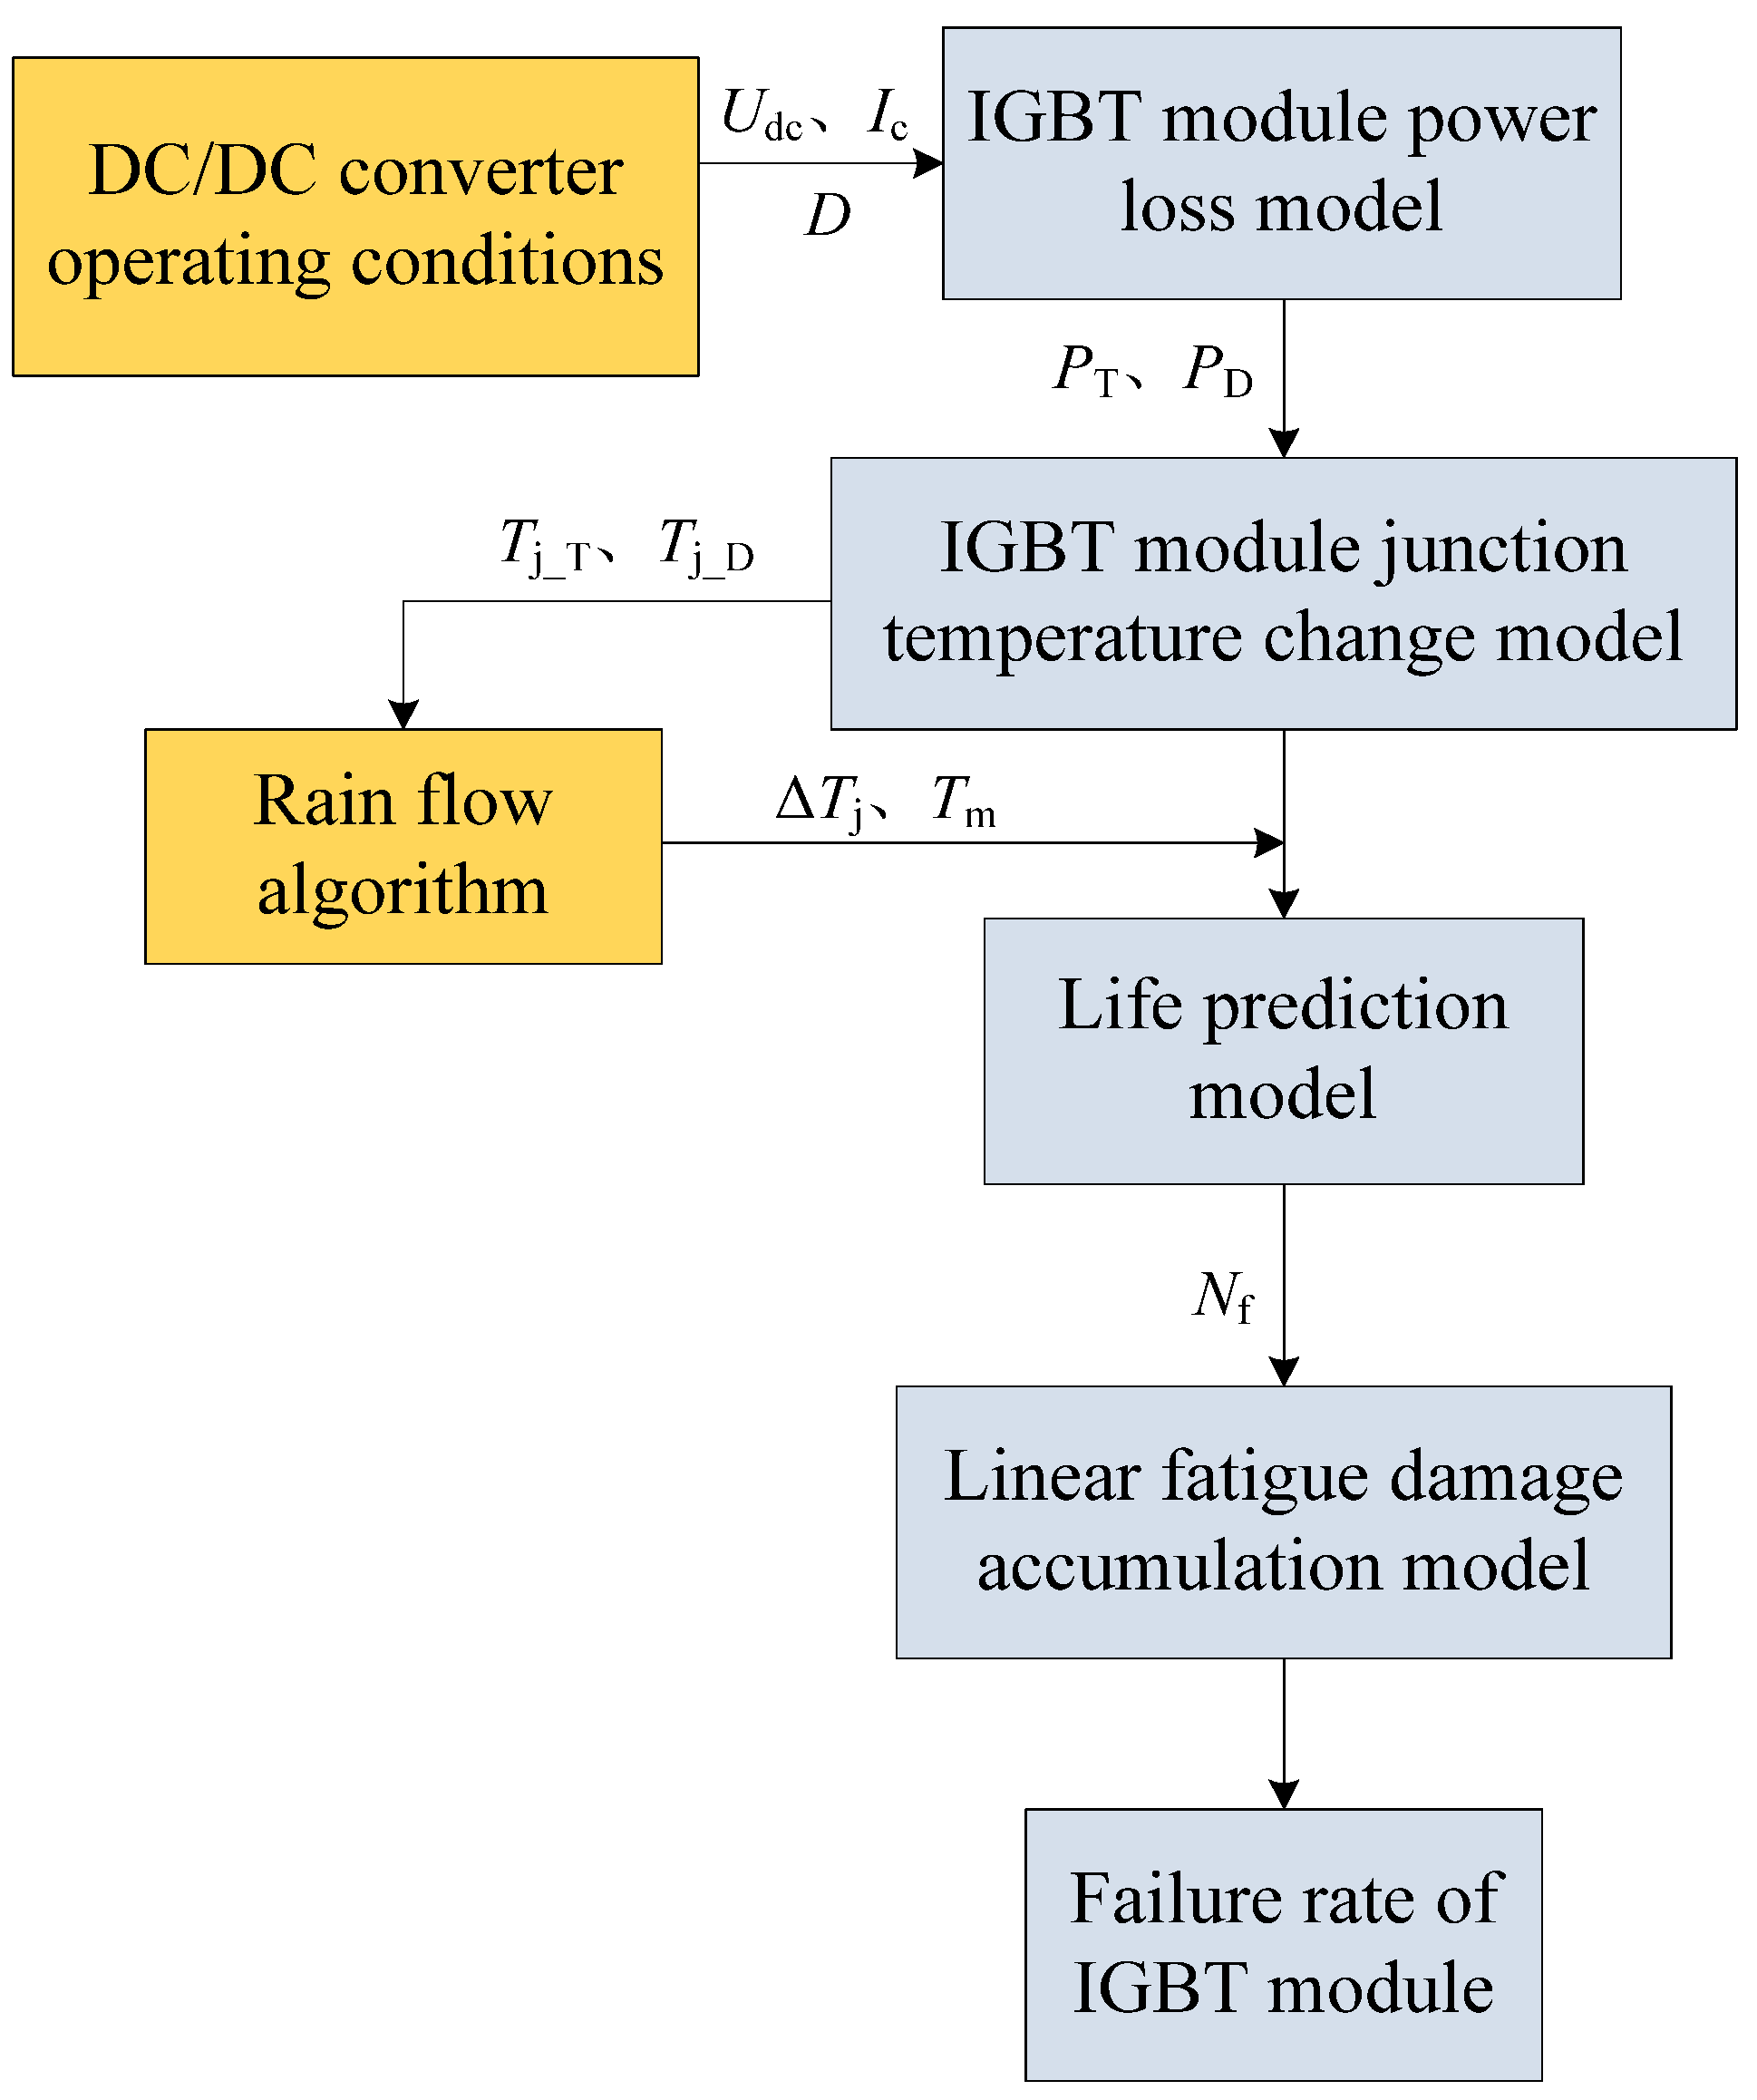
(1) Incorporate the operating conditions and control strategies of the DC/DC converter into the physical analysis model of IGBT module failure considering the influence of the aging mechanism, and analyze its failure rate by combining the device’s life prediction model and fatigue damage accumulation model. Then, based on the obtained IGBT module failure rate proceed to Step (2);
(2) Based on the IGBT module failure rate in Step (1), establish a BFBIC submodule reliability model using the FTA method;
(3) Establish a fault tree model for IPOS and IPOP hybrid two-stage modular structure DC/DC converters, and evaluate their reliability;
(4) Verify the effectiveness of the proposed method through numerical examples.
Compared with existing research in this field, the method proposed in this article can evaluate the reliability level of BFBIC-type DC/DC converters, and effectively incorporate the impact of operating conditions and control strategies of DC/DC converters in wind farm DC collection systems on the IGBT module failure rate into the reliability evaluation of DC/DC converters, improving the evaluation results and laying a foundation for subsequent reliability evaluation of wind farm DC collection systems.

2. Topological Structure and Operating Principle of DC/DC Converter

For the wind farm DC collection system, high efficiency, high-reliability topology, voltage stability control, and modular equalization control are the basic technical requirements for DC/DC converters. Therefore, this section will introduce the DC/DC converter’s topology structure, corresponding operating principle, and control strategy.

2.1. BFBIC Submodule Topology

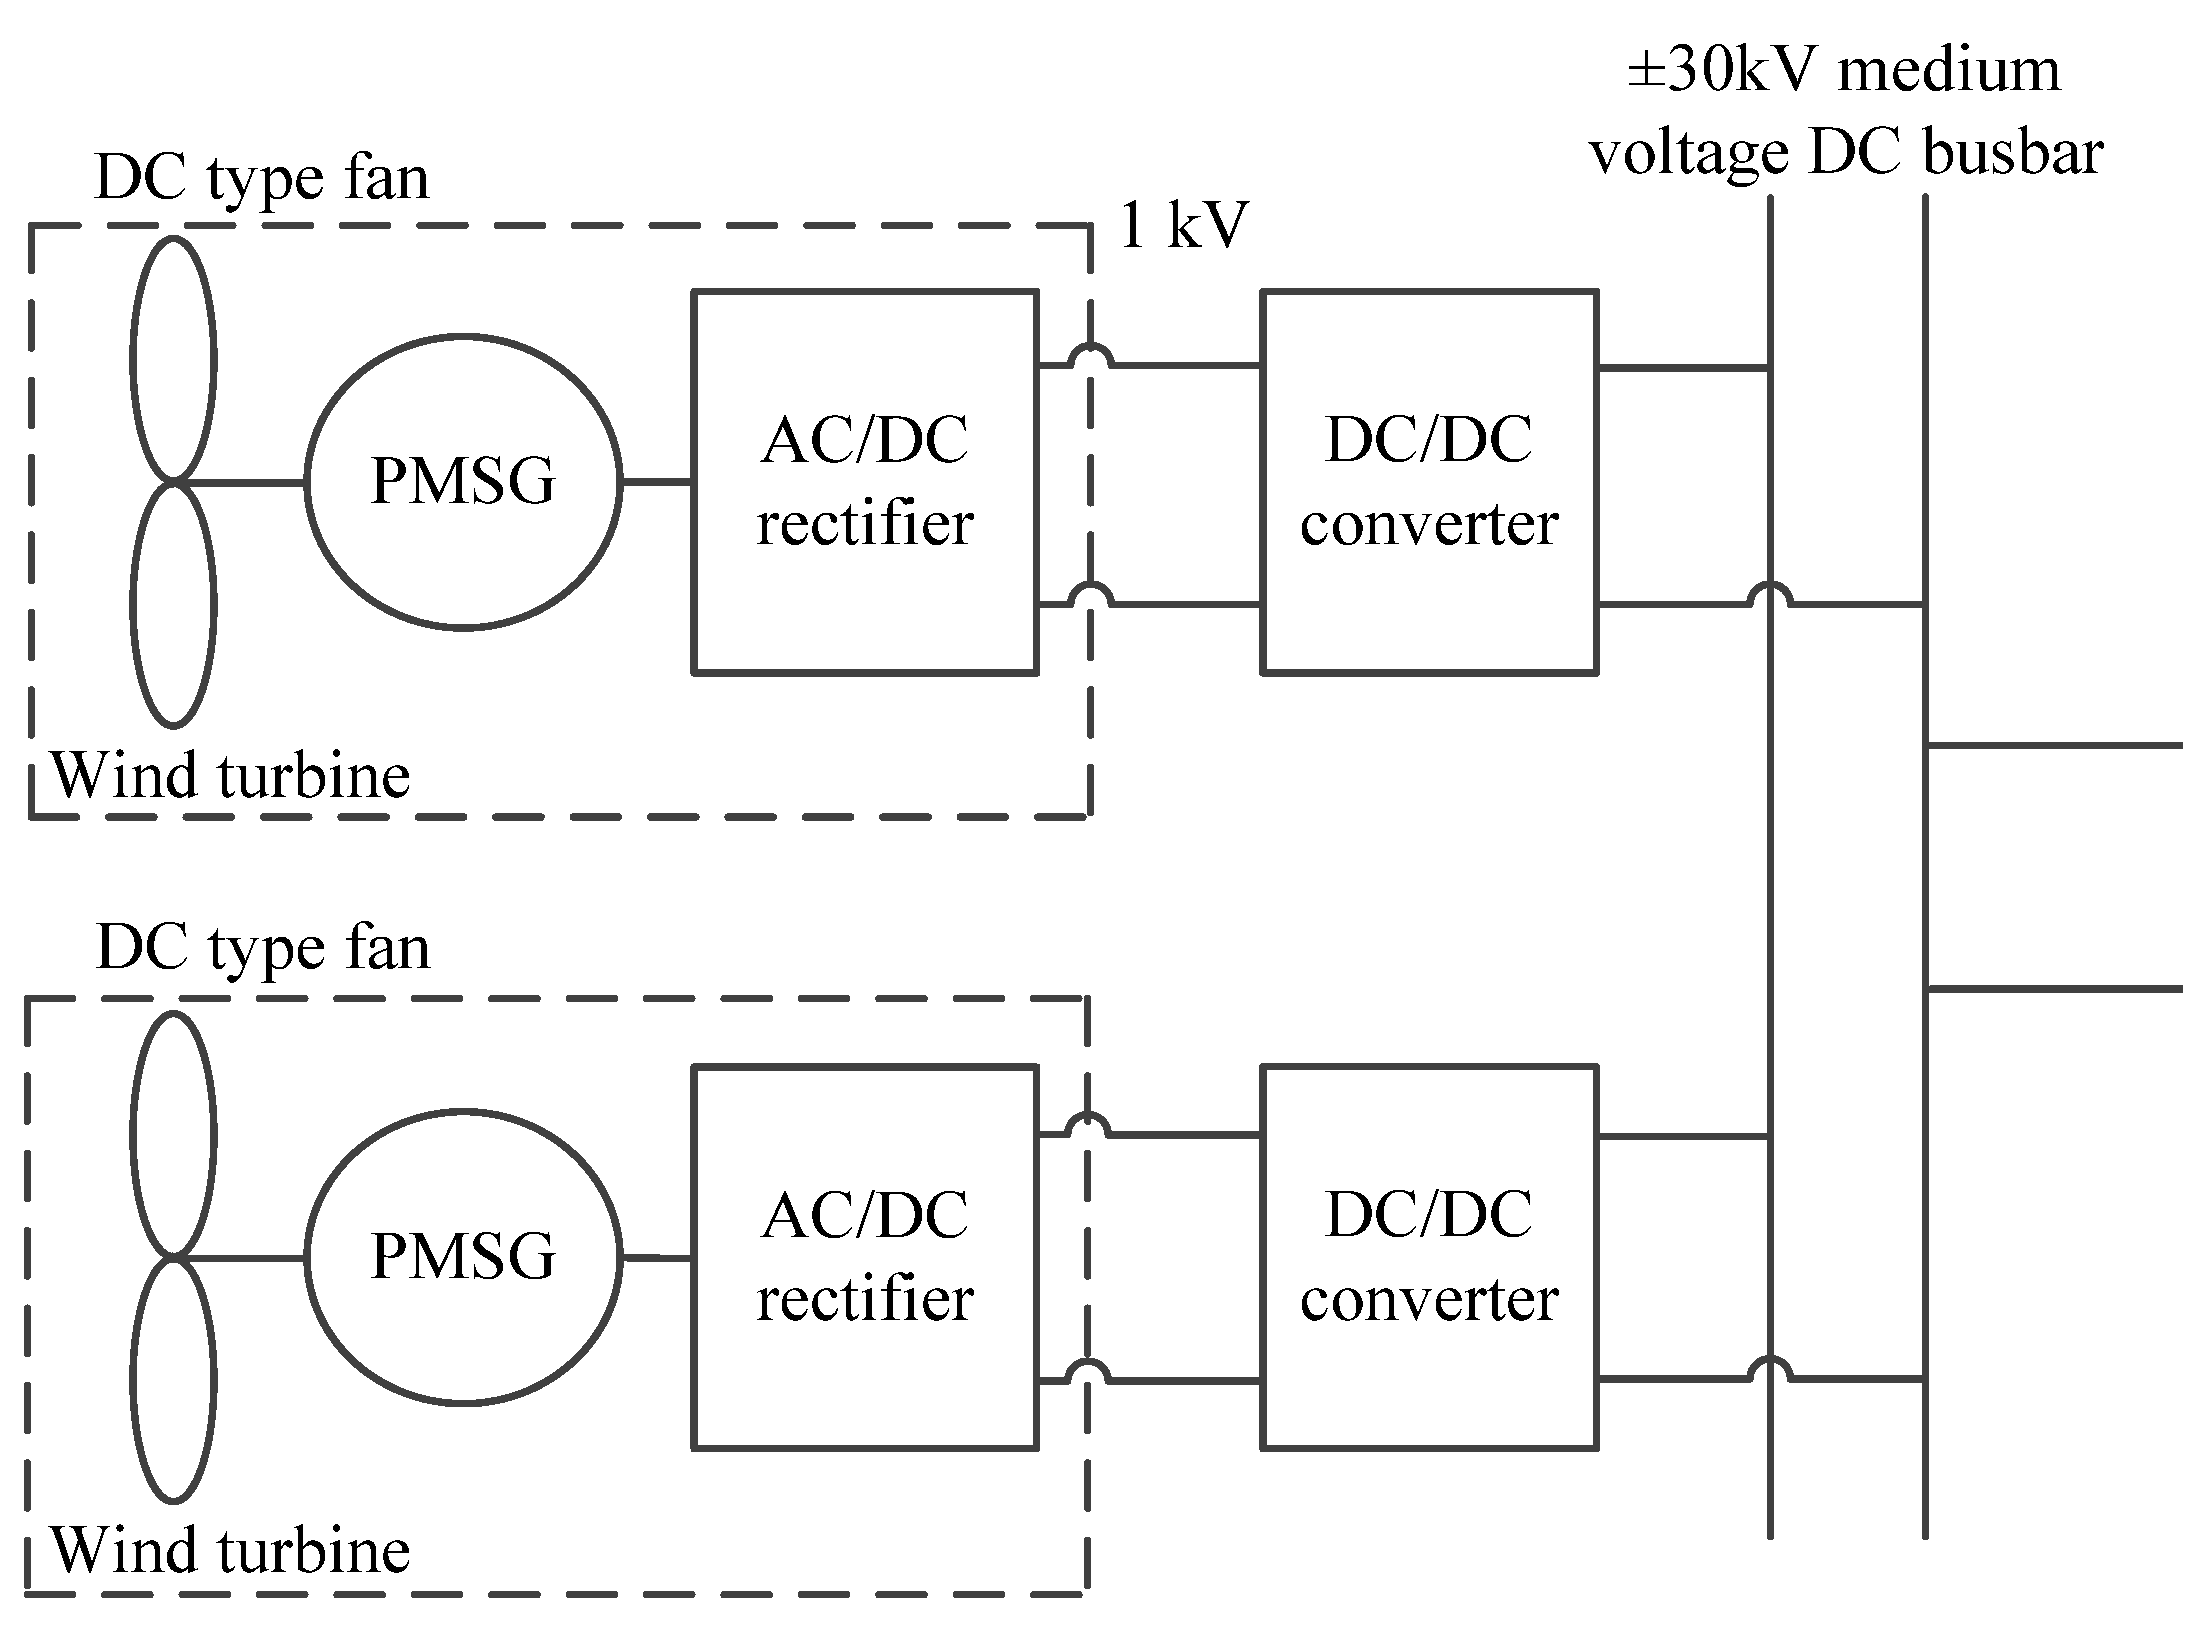
In the DC collection system of the wind farm, the outlet voltage of the DC output wind turbine is relatively low, about 1–5 kV. If DC collection and grid connection are carried out directly at this voltage, a large amount of electrical energy loss will be generated on the collection line, which is not conducive to efficient electricity transmission. Therefore, it is necessary to connect a DC/DC converter with a high conversion ratio to the outlet of DC-type wind turbines for boosting. In addition, the output power of a DC-type wind turbine is generally relatively large, so the DC/DC converter also needs to meet high power requirements.
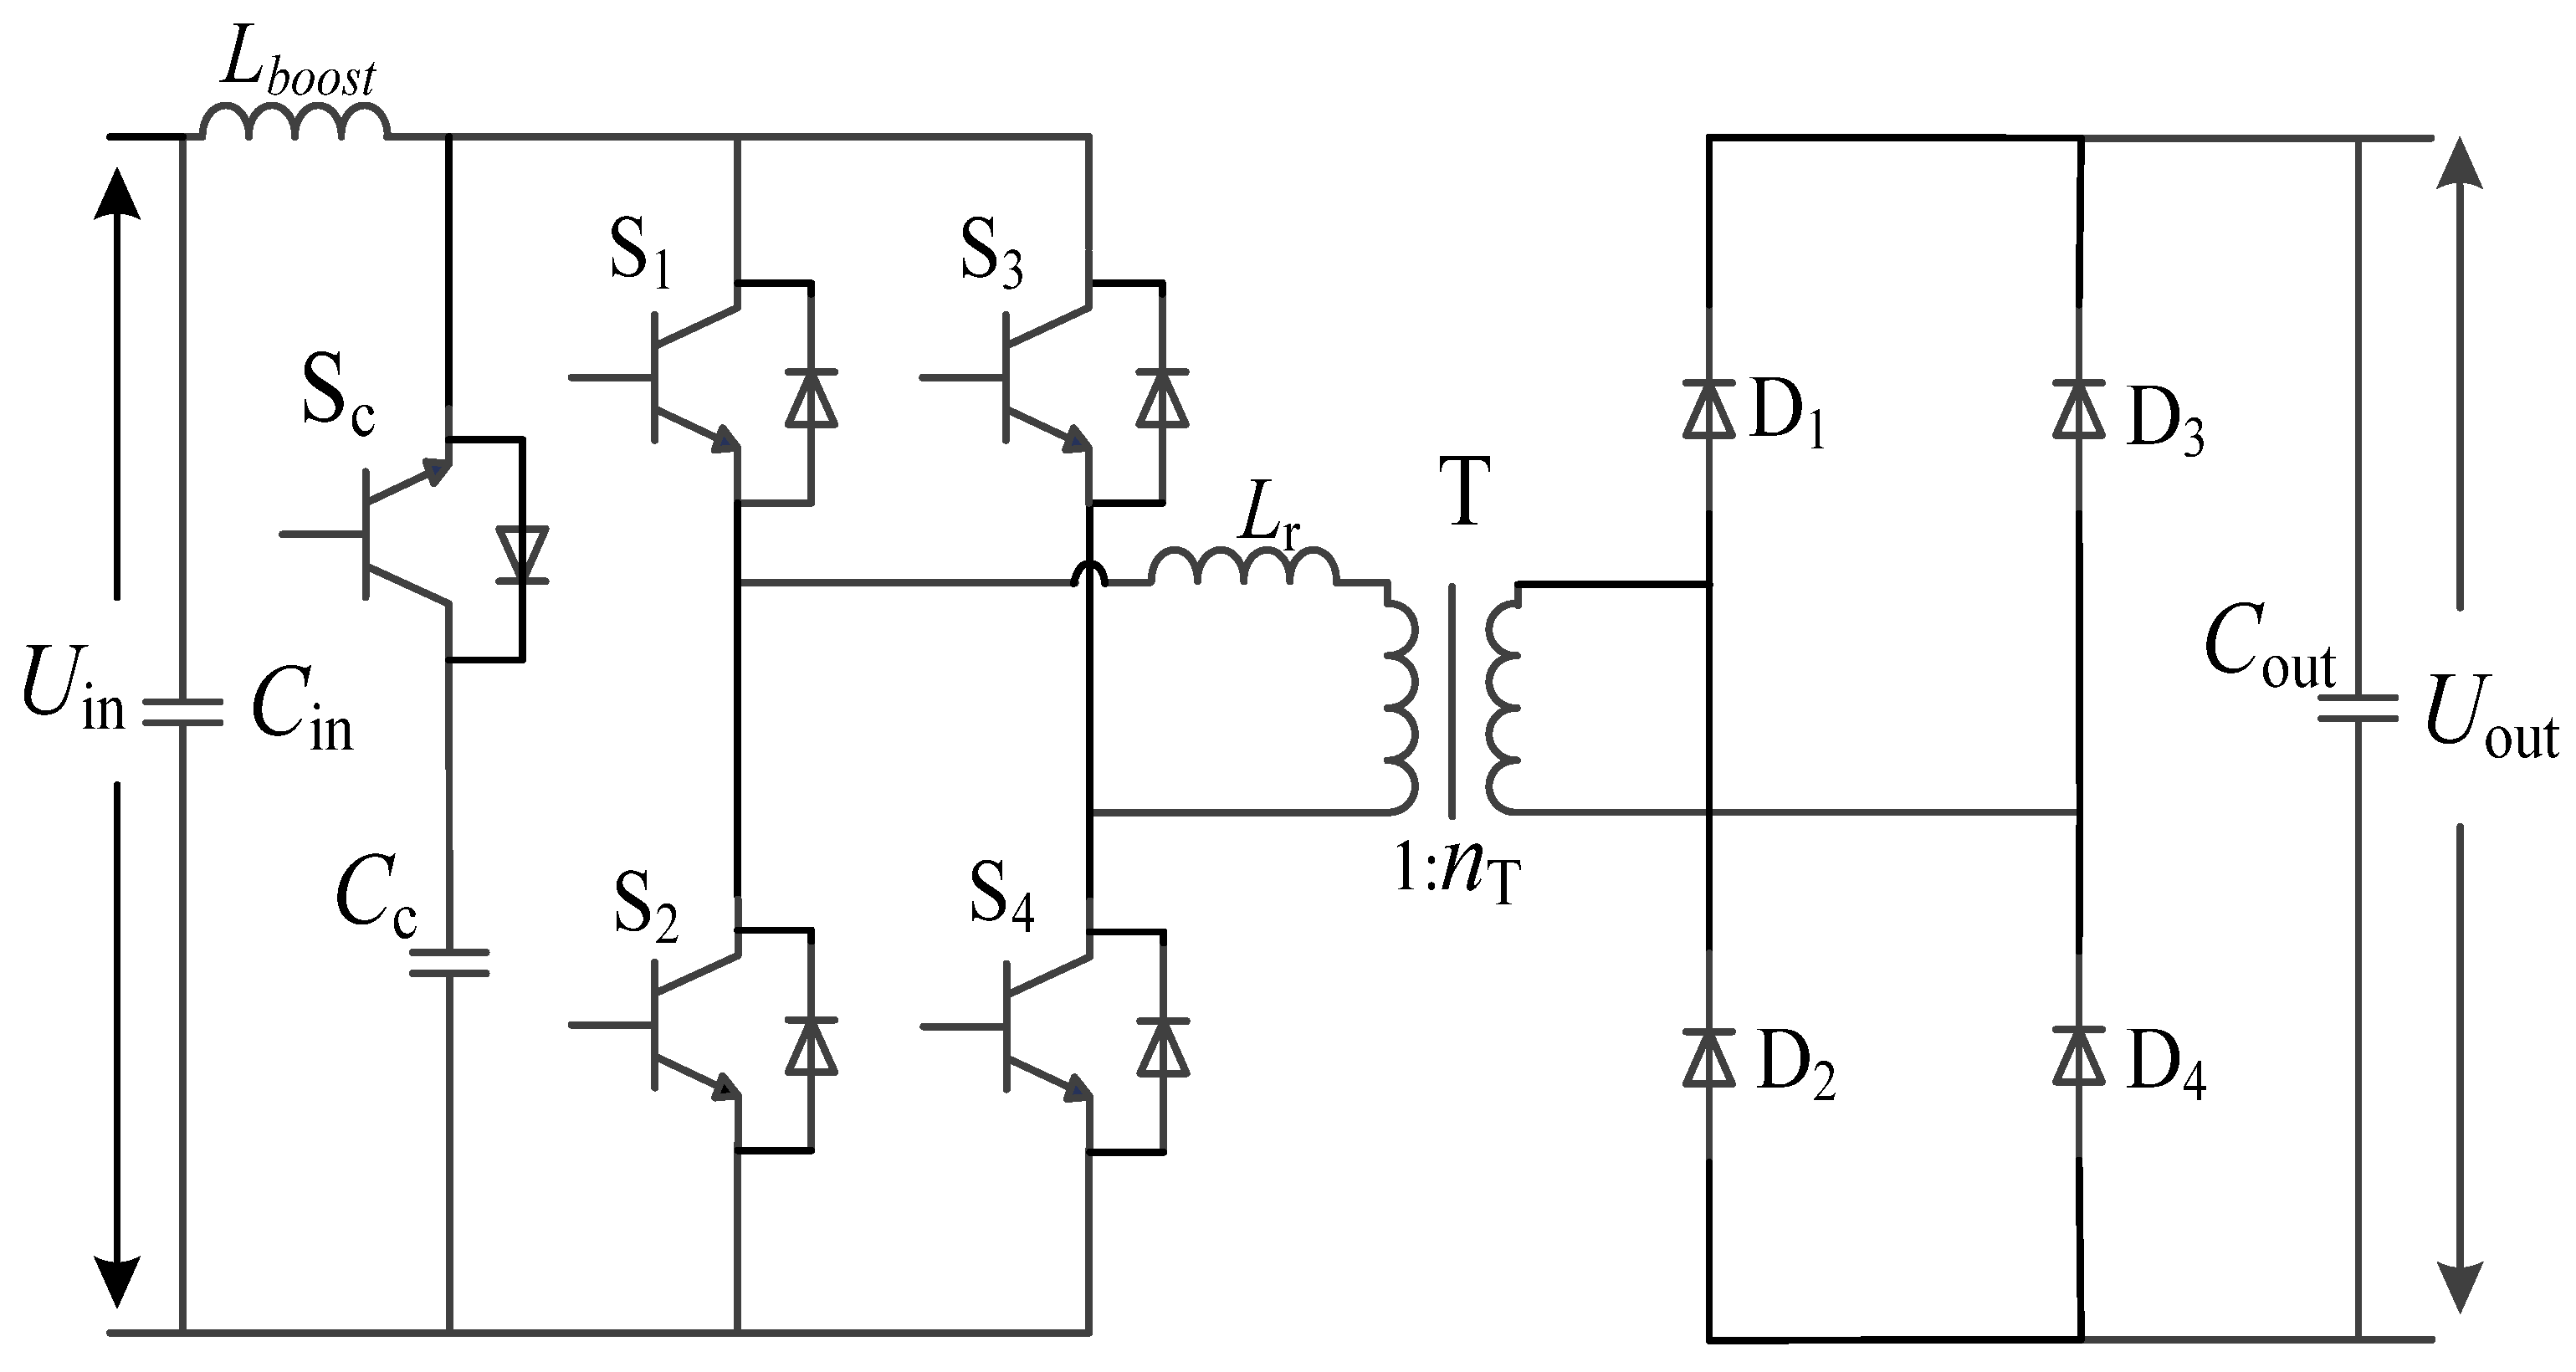
According to the above requirements, this paper adopts the DC/DC converter with a BFBIC topology structure containing source clamping. This structure can achieve high-power transmission through module cascading and can also perform a high transformation ratio through a high-frequency transformer and isolate grid-side fault currents. It is suitable for the DC collection system of a wind farm with high-voltage DC buses that require electrical isolation [5]. The specific structure is shown in Figure 1.
In this structure, the primary side is a boost full-bridge structure, which allows for a wider range of voltage regulation at the input and output ends. The clamp capacitor Cc between the primary side H-bridge arm and the boost inductor Lboost and the clamp IGBT module Sc together form an active clamp branch, which can absorb the voltage spikes formed when the switching device changes state, reduce switching losses, and extend device life. The secondary side is a full-bridge uncontrollable rectifier circuit, which saves investment costs compared to the DAB structure using more IGBT modules. The primary DC voltage Uin is converted into AC square wave voltage through four IGBT modules, S1–S4, and then boosted and electrically isolated through a high-frequency transformer with a ratio of nT. Finally, the boosted DC voltage Uout is output through diodes D1–D4.

2.2. Modular DC/DC Converter Structure

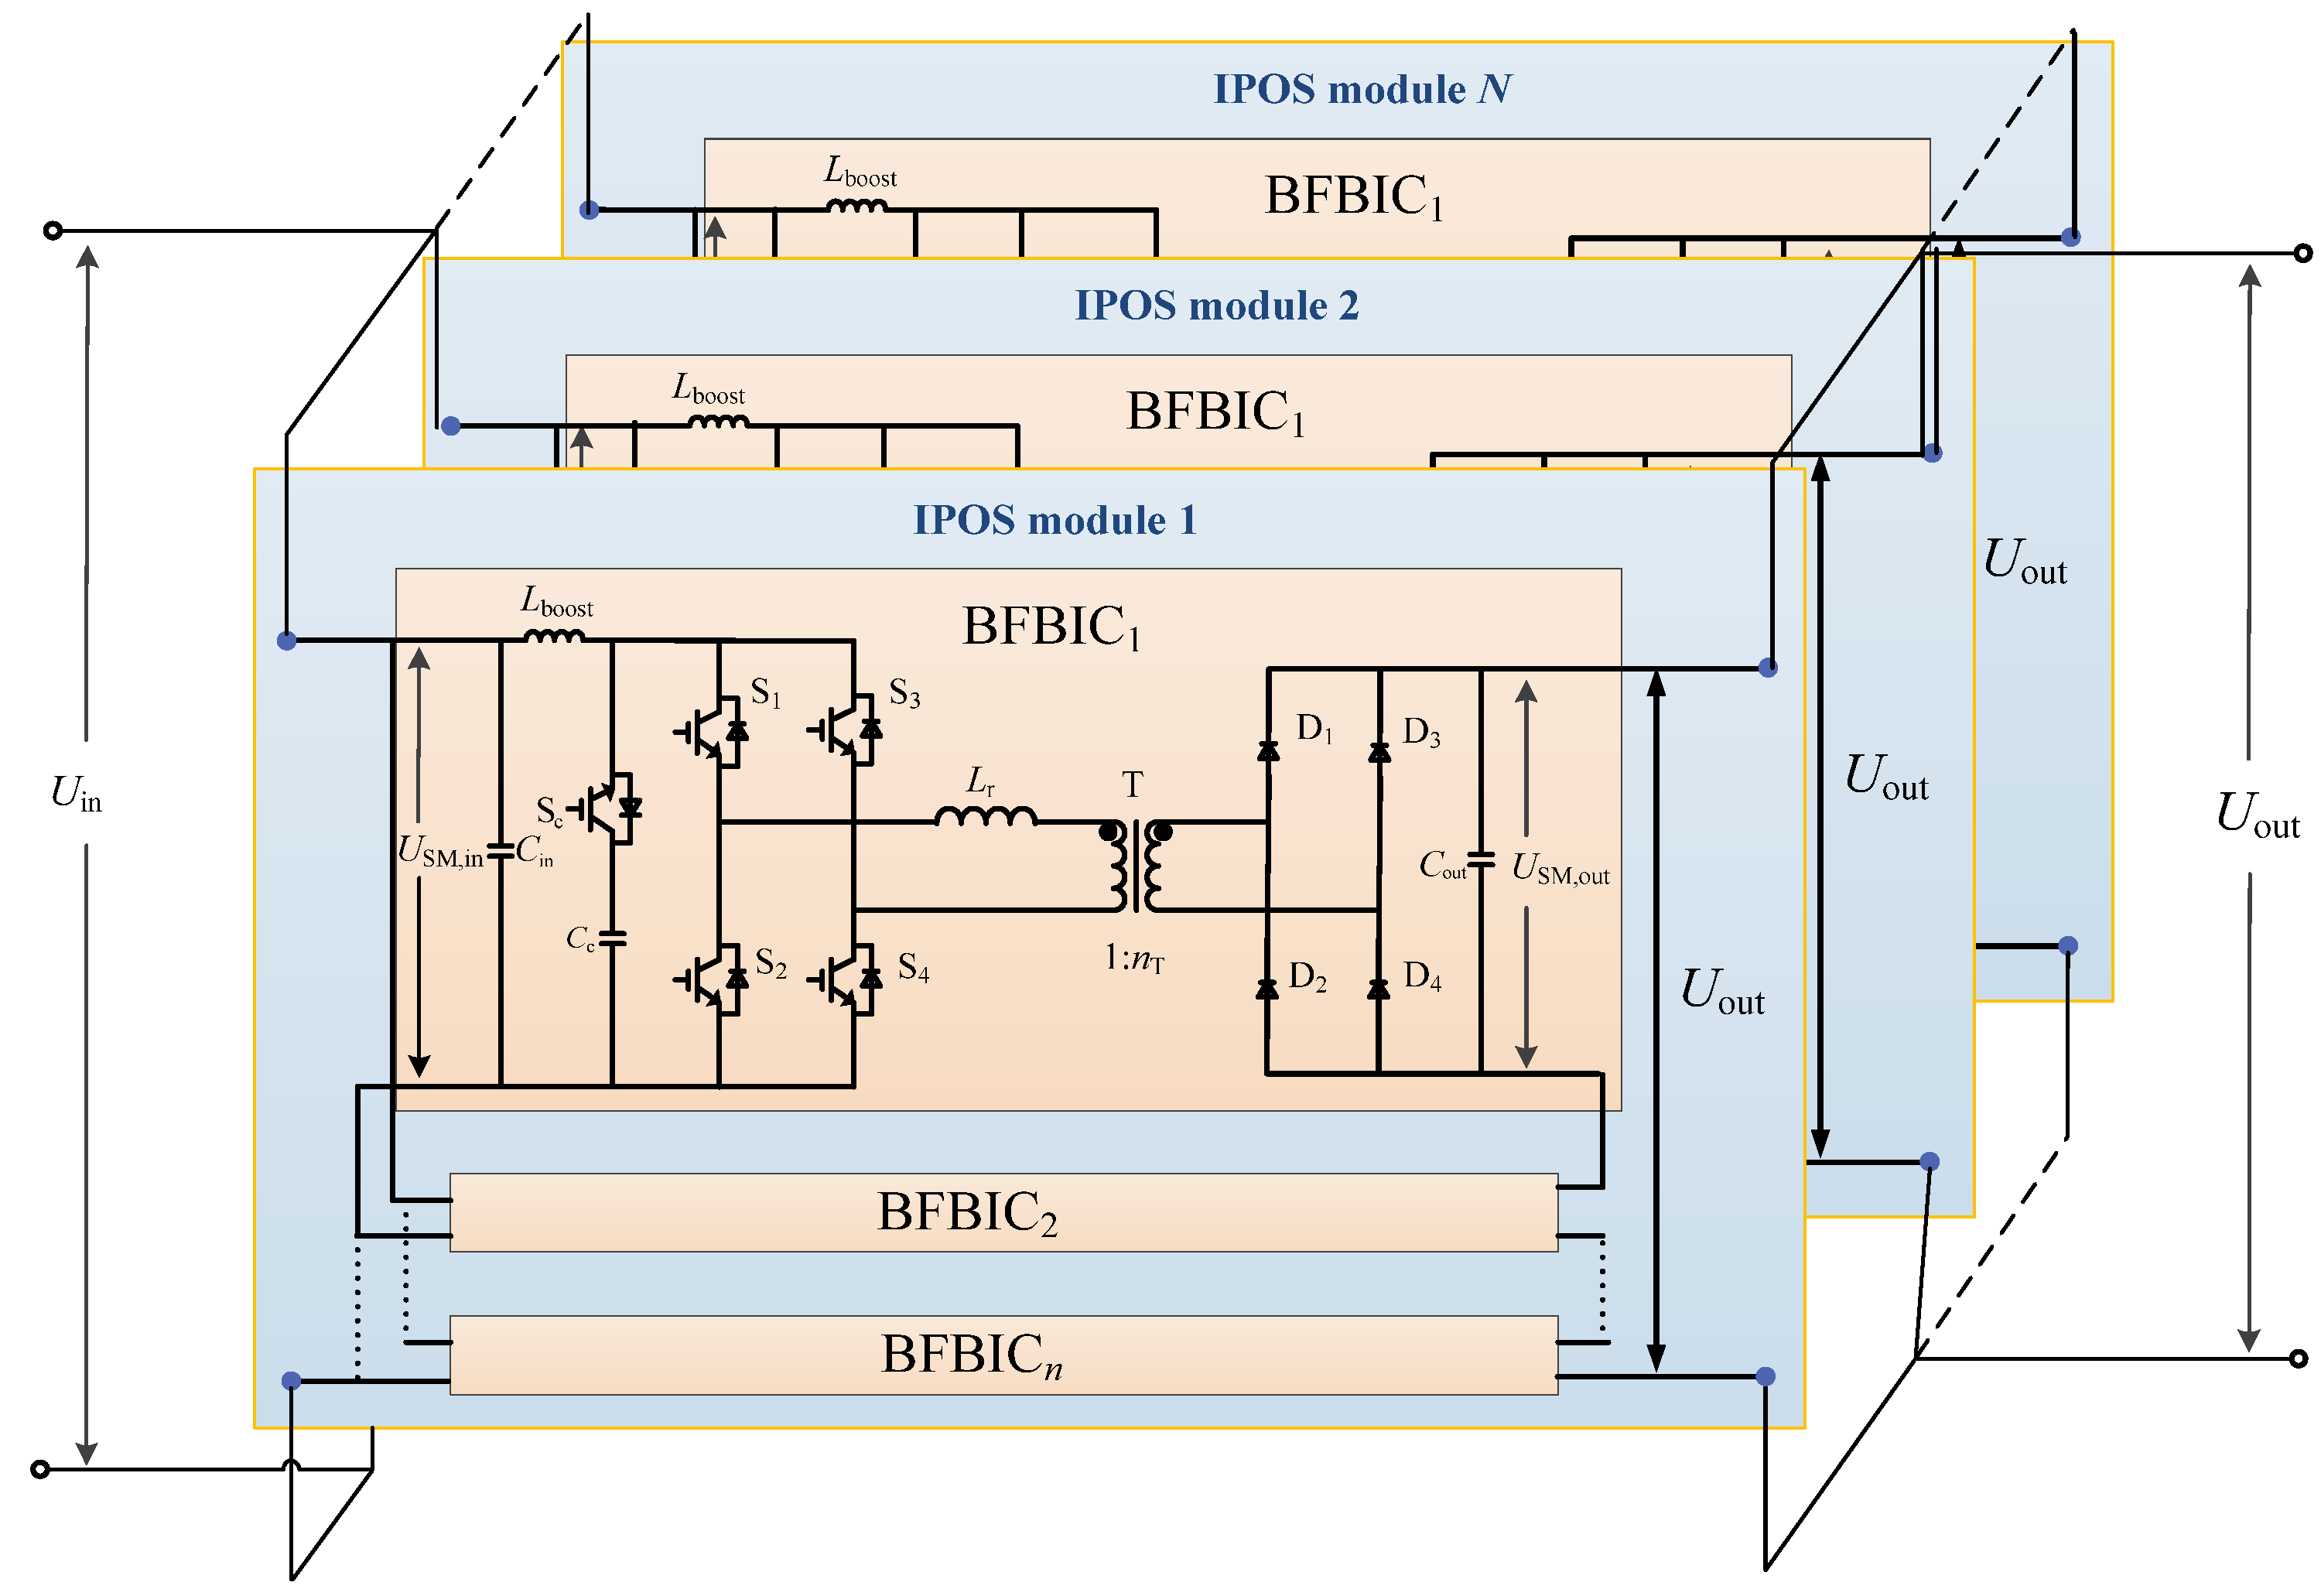
To meet the grid connection requirements of high voltage, high gain, and high-power transmission in the DC collection system of a wind farm, a DC/DC converter usually needs to adopt a modular structure with multiple submodules cascading, mainly in series and parallel. When multiple submodules are connected in series, the voltage borne by the components within each submodule decreases, which can meet high-voltage application environment needs and increase transmission power. If multiple submodules are connected in parallel, the current borne by the components within each submodule will be reduced, which can meet the requirements of high-current application environments and increase the transmission voltage. The structure of modular DC/DC converters can be divided into the following types based on the connection methods of their input and output sides: (1) input series output parallel type (ISOP); (2) input series output series type (ISOS); (3) input parallel output parallel type (IPOP); (4) input parallel output series type (IPOS). This article will adopt a hybrid two-stage modular structure of IPOS and IPOP, suitable for wind farm DC collection systems with low input voltage, high current, and a high voltage rise ratio [30]. The structure is shown in Figure 2.
In this topology, the first-level IPOS structure is connected in parallel on the input side, and can share the high current on the low-voltage side, improve power density, and connect in series on the output side, which can improve the voltage level and meet the requirements of high voltage and low current on the high-voltage side. This structure has the advantages of reducing power device stress and the turn ratio of the transformer, and is suitable for systems with large capacity. The input and output sides of the secondary IPOP structure are connected in parallel, which can further improve the power level of the equipment. The power borne by each BFBIC submodule in this structure is 1/(nN) of the total power of the DC/DC converter. At the same time, the cascade structure of IPOS and IPOP makes it easy to achieve modular redundancy design, improving system reliability. It can accommodate the design of different cascade structures or select different numbers of submodules for series–parallel connection according to different application requirements, which indicates its strong adaptability and scalability.

2.3. Operating Principle and Control Strategy of BFBIC DC/DC Converter

2.3.1. Operating Principle of BFBIC Submodule

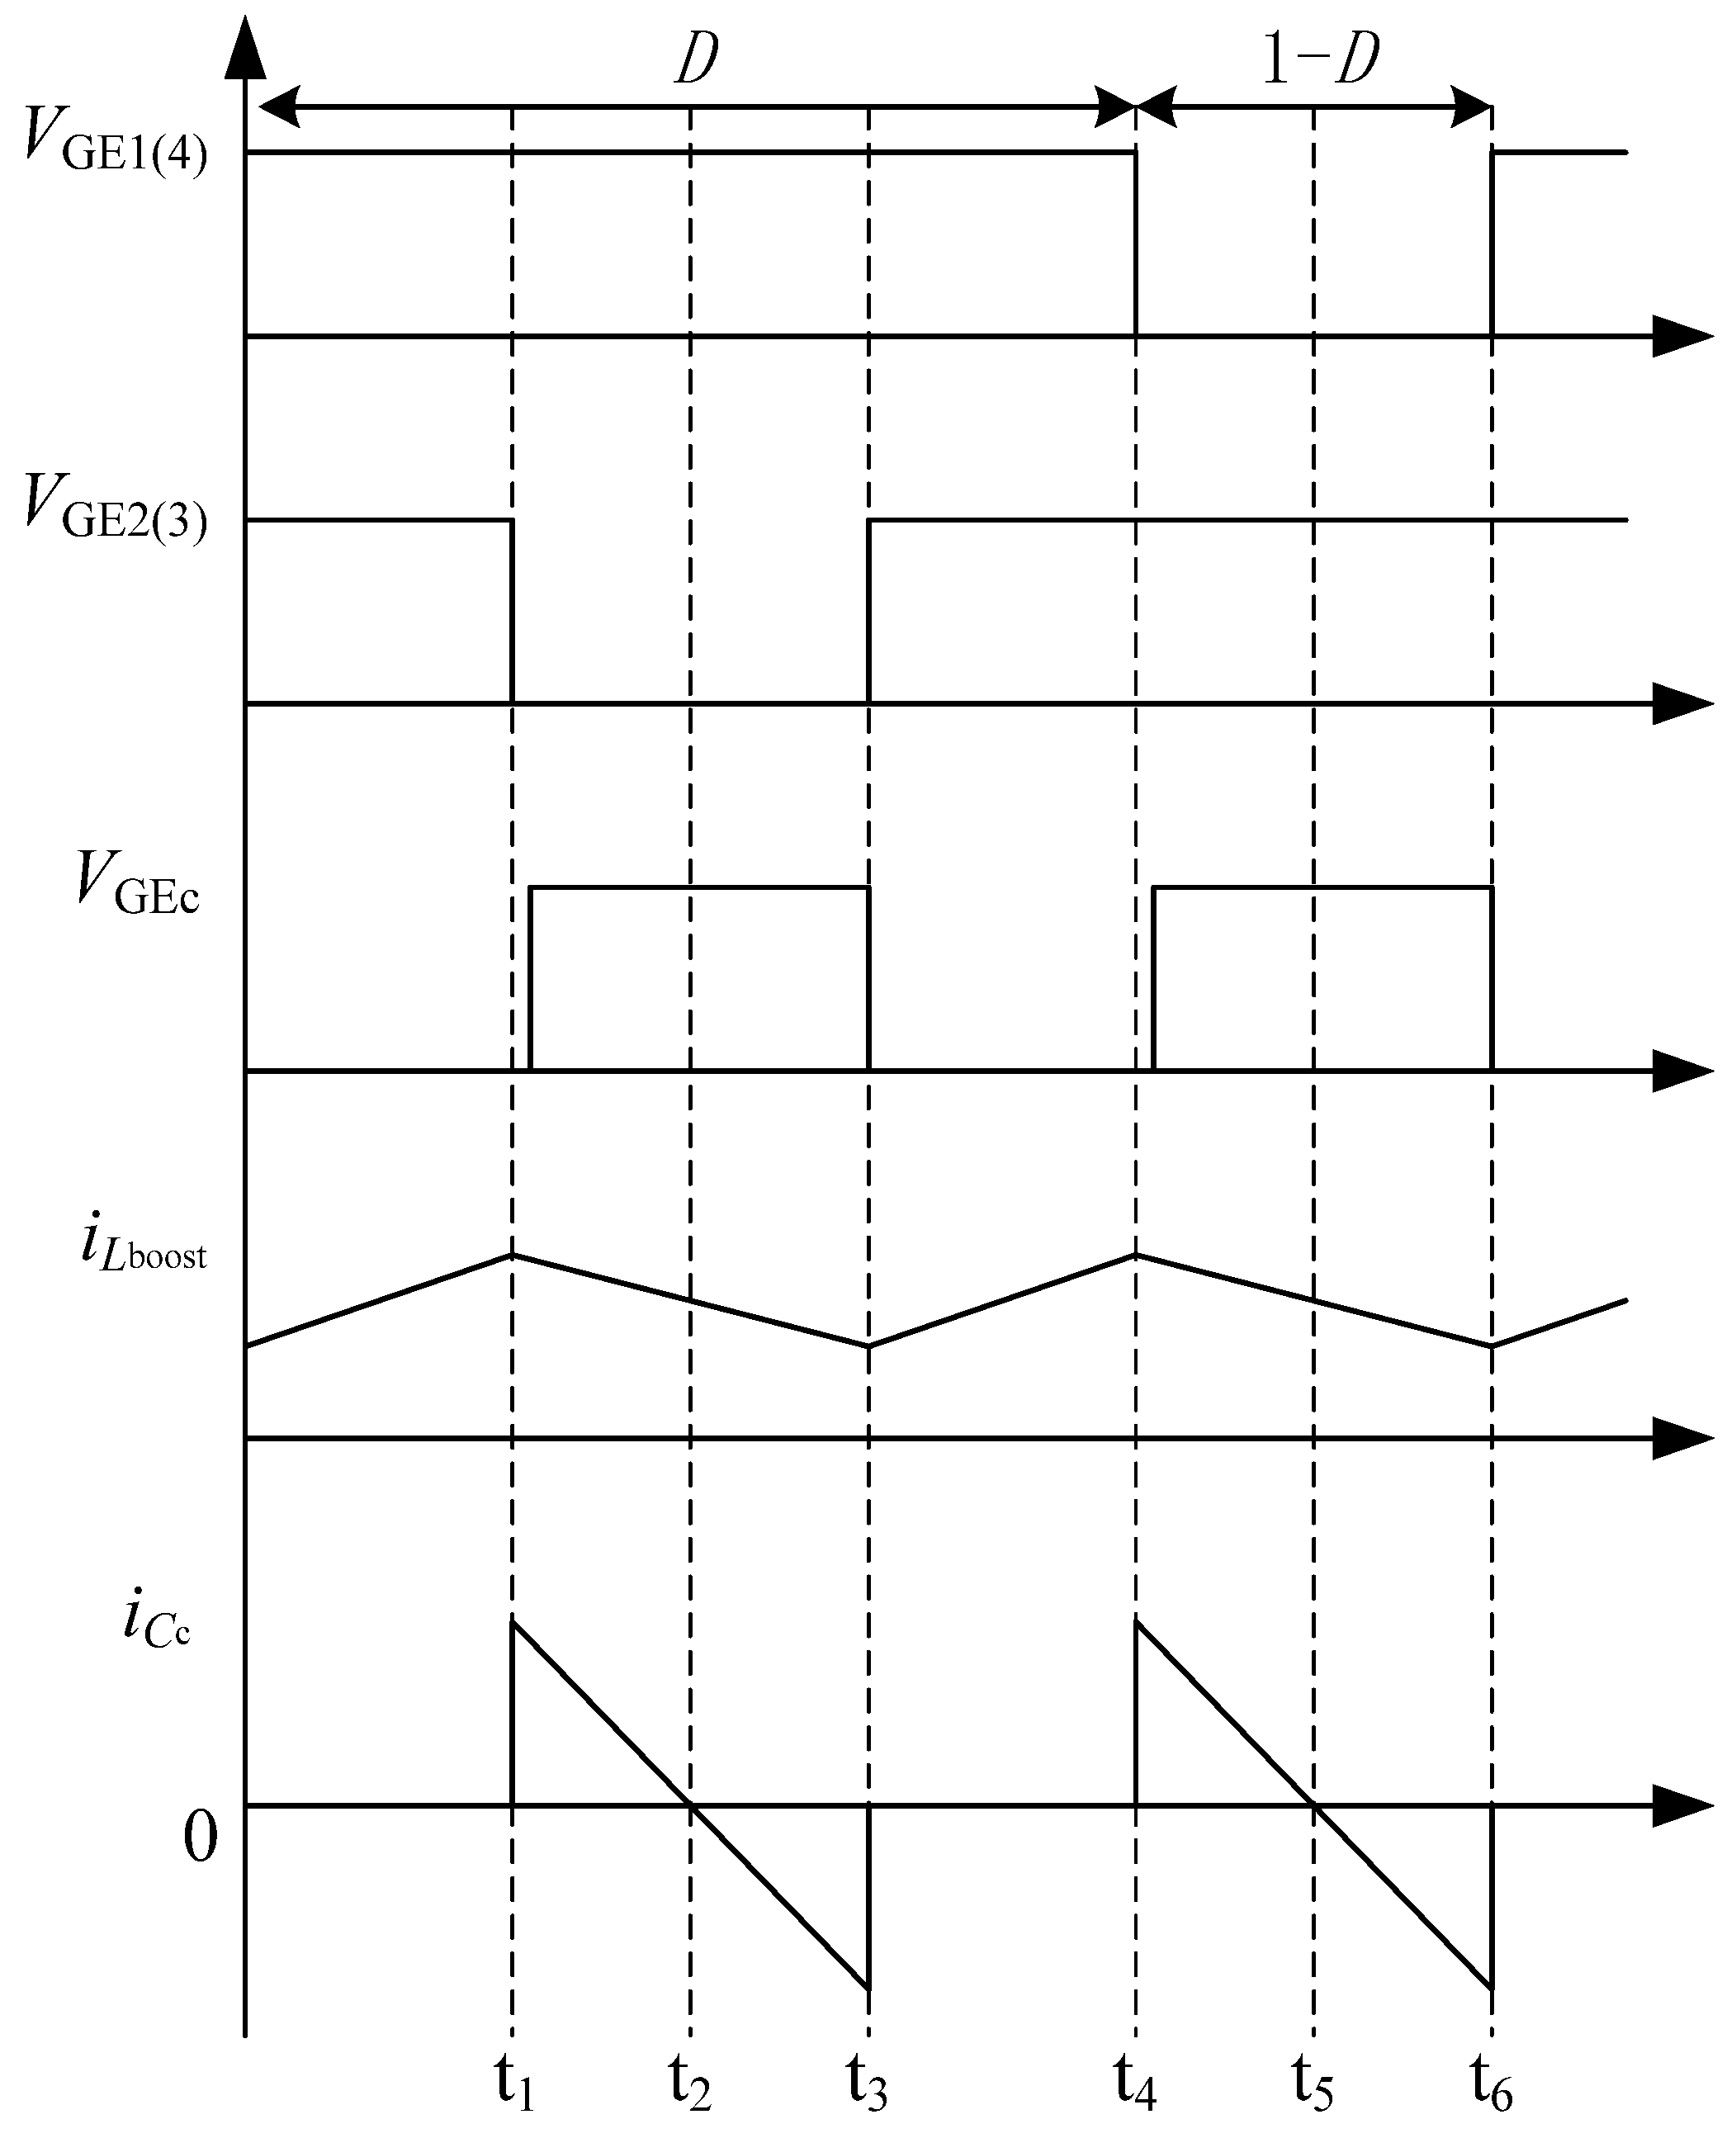
When the DC/DC converter works normally, the switch control signals and corresponding voltage and current waveforms of each IGBT in a single BFBIC submodule are as shown in Figure 3. The control signals of S1 and S4 in the IGBT are the same, while the control signals of S2 and S3 are the same. The control signals of S1 and S4 lead the control signals of S2 and S3 by half a cycle. The control signal of SC is obtained by performing an exclusive or operation (XOR) on the control signals of S1 and S4 and the control signals of S2 and S3, and then reducing them for a while. Shortening the conduction time can avoid transient overvoltage and release the energy of the inductance Lr through a circuit [31].
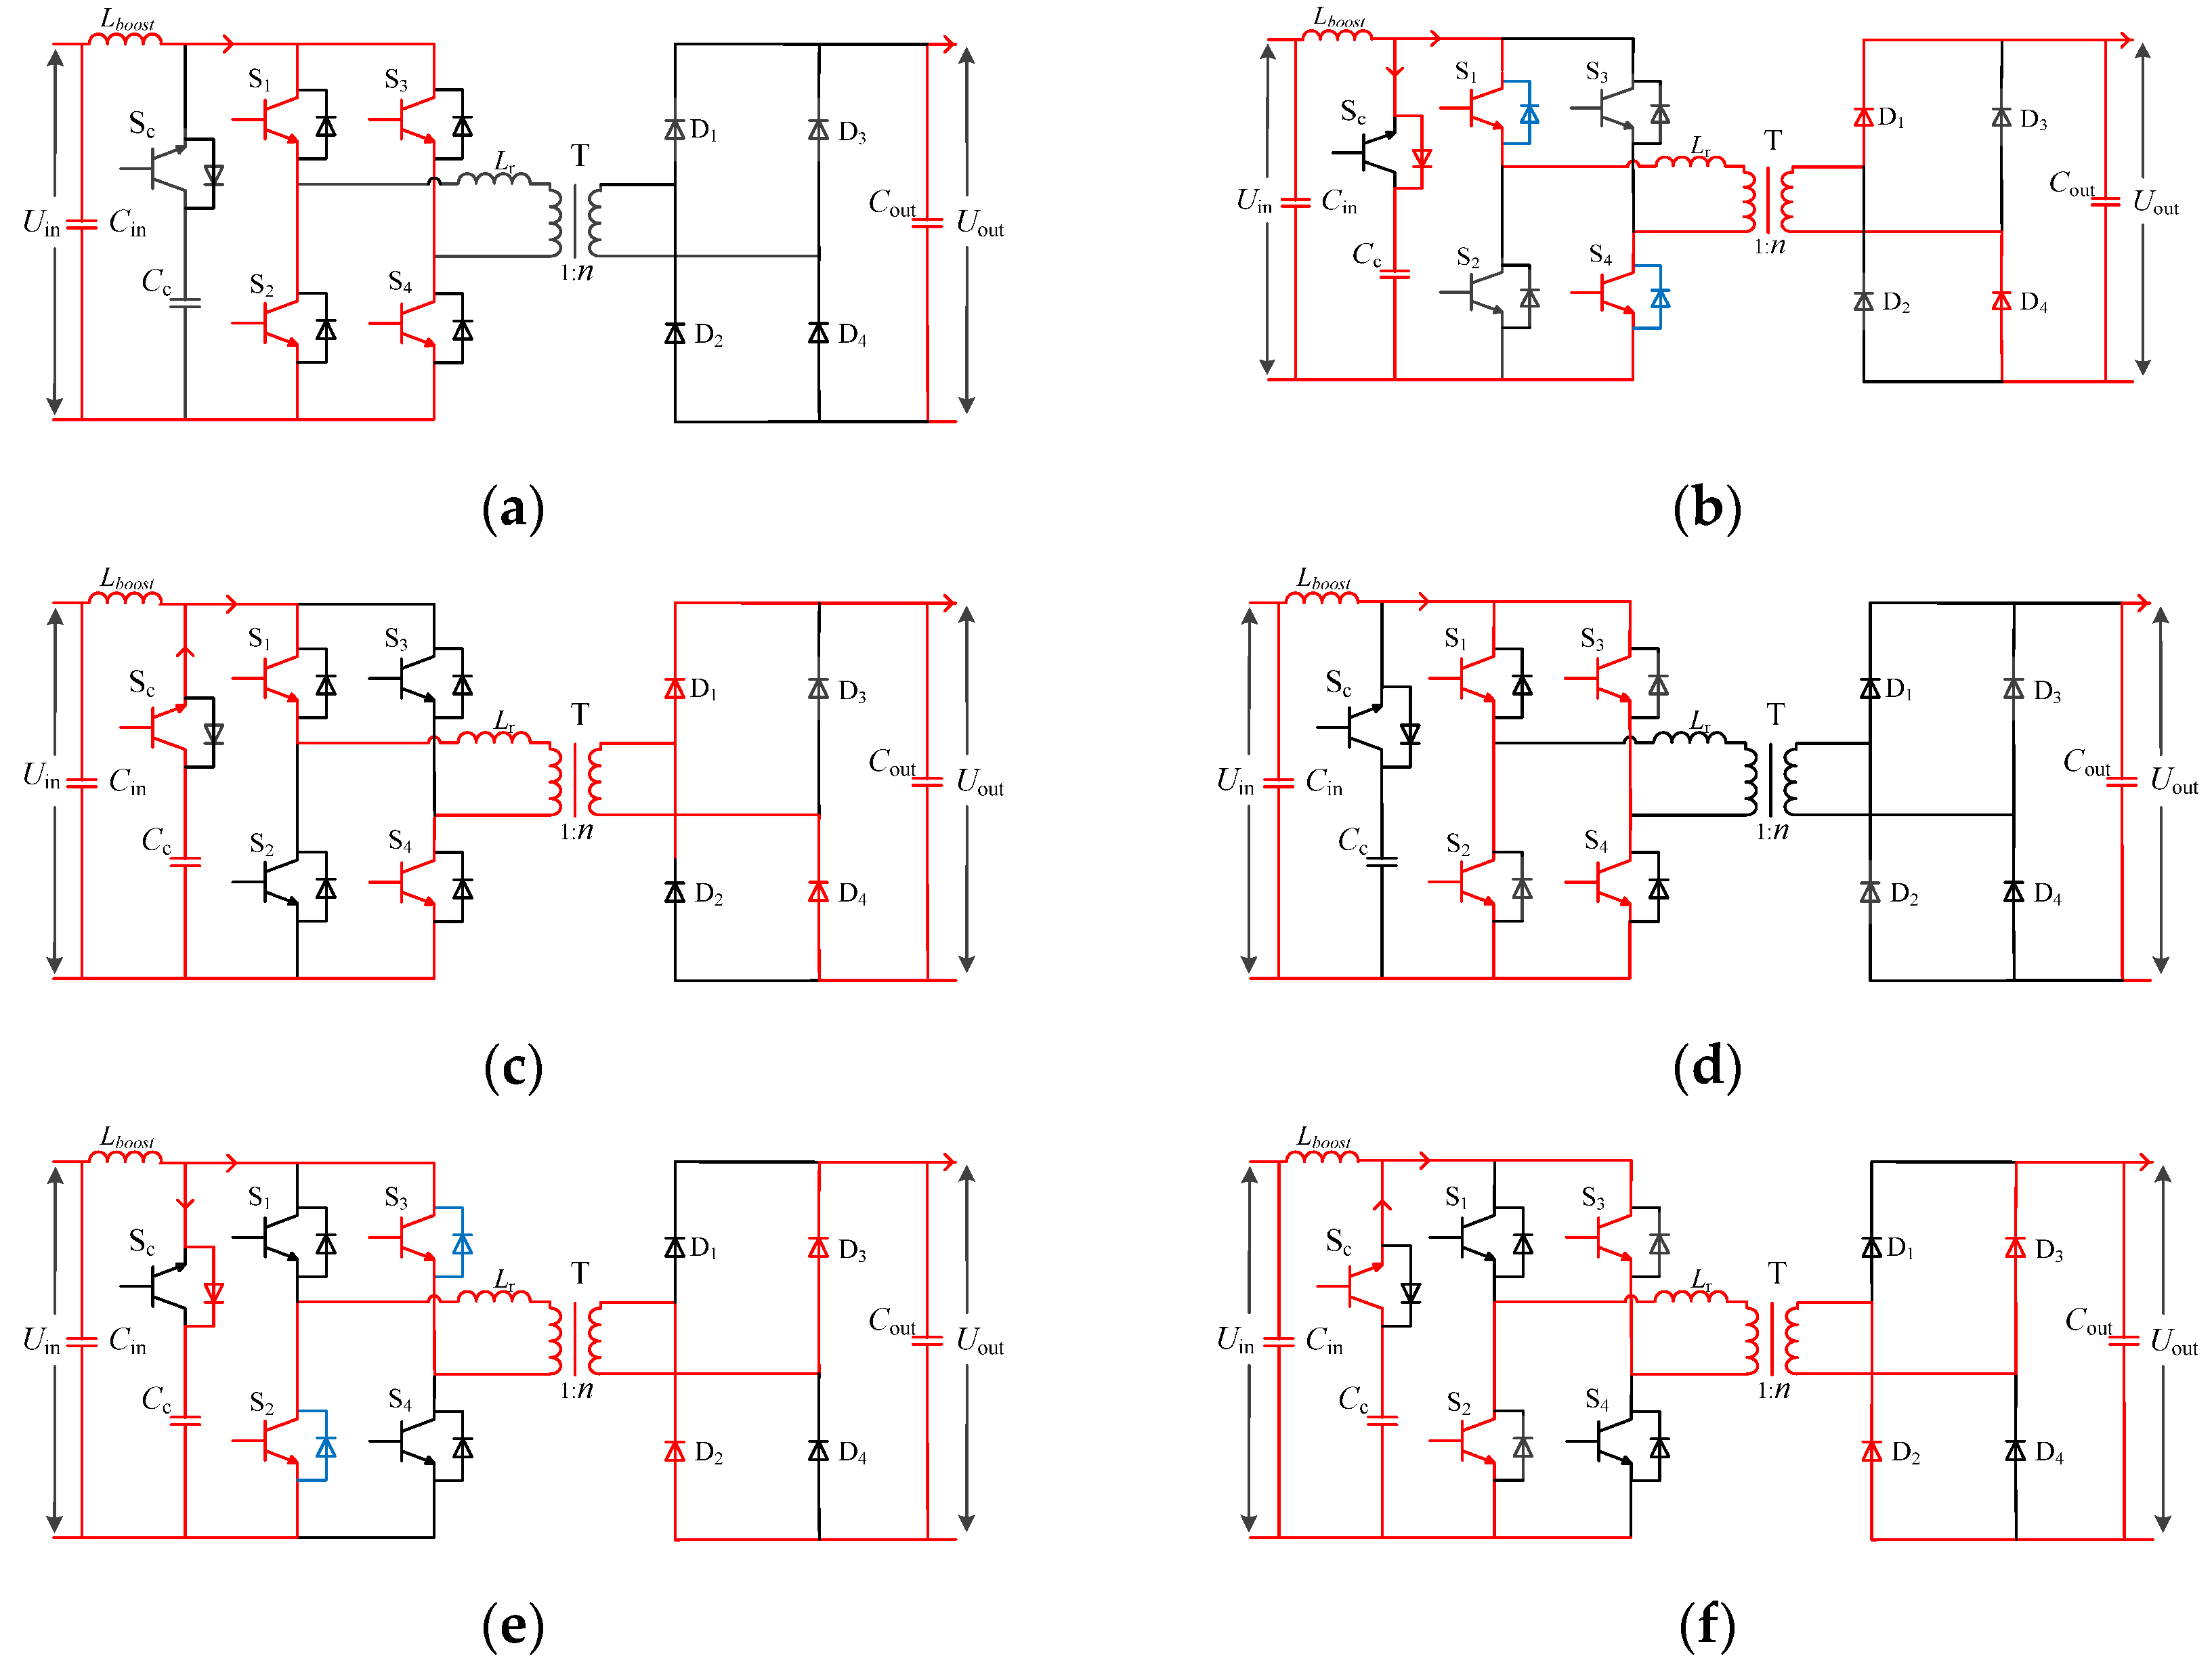
According to the IGBT control timing, the BFBIC submodule has six working states [31], as shown in Figure 4 and Table 1.

2.3.2. Control Strategy of DC/DC Converter

A wind farm DC collection system collects wind turbines’ low-voltage DC power output through DC technology before it is transmitted and connected to the grid. The function of a DC/DC converter is to boost the outlet voltage of the DC fan to medium voltage and then perform DC collection. To maintain the operation as usual of the DC/DC converter, corresponding control strategies must be adopted to limit the submodules’ output power to ensure each submodule can work safely and effectively. This paper adopts the constant voltage control method of a DC/DC converter [32]. Constant voltage control is the process of comparing the input side DC voltage Udc with the reference voltage Uref, and then adjusting it through PI to obtain the duty cycle. Finally, PWM modulation is used to receive the control signal of the IGBT. The clamping IGBT needs to suppress voltage spikes when other IGBTs are turned off, so its control signal is an XOR operation of other IGBT control signals. The control block diagram of constant voltage control is shown in Figure 5, and its transfer function is shown in Equation (1) [32].
D s / Δ U s = k p + k i / s
where ΔU(s) is the difference between the reference and input side DC voltage; kp and ki are the PI regulator parameters, with values of 0.003 and 0.6667, respectively, and these values were obtained by adjusting the PI regulator parameters multiple times during the modeling process to achieve constant voltage.

3. Reliability Prediction Model for IGBT Module Considering the Influence of Control Strategy

3.1. Steps for Reliability Modeling of IGBT Module

The IGBT module is a vital component of the DC/DC converter in the wind farm DC collection system, and its reliability prediction is the basis for analyzing the DC/DC converter’s reliability. Figure 6 illustrates the reliability modeling process of an IGBT module.
The specific steps are as follows:
  • Establish a power loss model for the IGBT module according to DC/DC converter operating states;
  • In light of the IGBT module structure and power loss model, a thermal network model is established to obtain its junction temperature fluctuation curve. The amplitude of the junction temperature and average junction temperature fluctuation of the IGBT module are obtained through the rain flow algorithm;
  • Select a suitable IGBT module life prediction model, and substitute the amplitude and mean of junction temperature fluctuations obtained in Step (2) into the selected model to calculate its life;
  • Substitute the life of the IGBT module into the linear fatigue damage accumulation model and calculate the IGBT module failure rate.

3.2. A Loss Model for IGBT Modules Considering the Influence of the Control Strategy

An IGBT module’s power loss includes the conduction loss and cut-off loss of the IGBT chip and freewheeling diode (FWD), the turn-on and turn-off losses, as well as the drive loss. The cut-off loss and drive loss of the IGBT and FWD, as well as the turn-on loss of the FWD, account for a deficient proportion of the total loss and can be ignored [32]. Therefore, when calculating the IGBT module power loss, only the conduction loss and switch loss of the IGBT, as well as the conduction loss and turn-off loss of the FWD, need to be considered. The specific calculations are as follows.

3.2.1. Power Loss of IGBT

The power loss of an IGBT consists of conduction loss and switching loss, where the conduction loss Pcond_T of an IGBT is formed by its saturation voltage drop and conduction current. The specific calculation formula for an IGBT on state loss is shown in Equation (2) [28].
P cond _ T = V ce i c D
where Vce = f (ic, Tj_T), which means that the saturation voltage drop of the IGBT is a function of ic and Tj_T, and this function expression can be obtained by fitting the output characteristic curve of the IGBT; Tj_T is the IGBT’s junction temperature; D is the duty cycle of the control signal.
From (2), it can be seen that the conduction loss of the IGBT is mainly related to its parameters, ic, D, and T.
The duty cycle D in (2) is usually a constant or is calculated based on the modulation method. However, in actual operation, the duty cycle D will continue to fluctuate due to the influence of the DC/DC converter control strategy, which needs to be further calculated through the transfer function of the corresponding control strategy. According to the DC/DC converter’s constant voltage control method, the expression for the duty cycle D can be obtained by performing an inverse Laplace transform on its transfer function (1) as follows:
D t = Δ U t k p + k i 0 t Δ U t d t
By substituting (3) into (2), the conduction loss of the IGBT, corrected according to the control strategy, can be obtained.
The voltage and current waveforms of the IGBT will briefly overlap during the opening and closing processes, resulting in certain switch losses. The calculation formula for IGBT switch loss is [28]:
P sw _ T = f sw E on + E off U dc U N i c i N 1 + K ET 125 T j _ Τ
where fsw is the switching frequency; Eon and Eoff are the turn-on and turn-off loss energies of the IGBT; Udc and ic are the working voltage and current of the IGBT module; UN and iN are the rated voltage and current; KET is the temperature correction coefficient of the switching energy loss.
Therefore, the corrected total power loss of the IGBT PT can be obtained:
P T = P cond _ T + P sw _ T

3.2.2. Power Loss of FWD

The FWD’s power loss consists of conduction loss and cut-off loss. The conduction loss of the FWD is formed by the combination of its saturation voltage drop VF and conduction current ic. Due to the alternating conduction between the FWD and IGBT, the conduction loss of the FWD, Pcond_D, is [20]:
P cond _ D = V F i c 1 D = f i c , T j _ D i c 1 D
where Tj_D is the junction temperature of the FWD. Similarly, substituting (3) into (6) can obtain the corrected conduction loss of the FWD.
During the shutdown process of the FWD in parallel with the IGBT, due to its reverse blocking ability requiring a certain recovery time, the combined action of the current flowing through the FWD and the voltage at both ends generates shutdown loss. Therefore, the shutdown loss of the FWD can be expressed as [33]:
P sw _ D = f sw E rec U dc U N i c i N 1 + K ED 125 T j _ D
where Erec is the reverse recovery loss of the FWD; KED is the temperature coefficient of the shutdown energy loss.
So, the corrected total power loss of the FWD, PD, can be obtained:
P D = P cond _ D + P sw _ D

3.2.3. Model of Junction Temperature Variation in IGBT Module

According to the IGBT module’s power loss model in Section 3.2 and its structure, an IGBT module’s junction temperature variation model is available through the thermoelectric analogy theory [34].
Figure 7 illustrates the IGBT module’s layered structure. The top chip generates a large amount of heat due to power loss, which is transferred from top to bottom to the radiator and then dissipates into the surrounding environment. The module junction temperature can be obtained by adding the ambient temperature and the temperature rise of each layer.
The Foster thermal network model is commonly used to calculate the IGBT module’s junction temperature.
The thermal parameters can be converted into electrical parameters through thermoelectric analogy theory, and then problems in the thermal network are solved through electrical network theory. The conversion relationship between thermal and electrical parameters is shown in Table 2.
In the Foster thermal network, the thermal network between the chip and the shell in the IGBT module is equivalent to a fourth-order RC electrical network. The shell-to-heat sink and the heat sink-to-the-environment transitions use a first-order RC electrical network. Equation (9) is the thermal impedance calculation formula for IGBT [20].
Z = i = 1 n R i 1 exp t τ i
where Z is the thermal impedance; τi = Ri·Ci is the time constant.
The IGBT module is shown in Figure 8 with its Foster equivalent thermal networks.
Therefore, the junction temperatures of IGBT and FWD are [20]:
T j _ T = P T Z thjc _ T + Z thch _ T + P T + P D Z thha + T a
T j _ D = P D Z thjc _ D + Z thch _ D + P T + P D Z thha + T a
where Ta is the ambient temperature.

3.2.4. Method for Obtaining Junction Temperature Features

Due to the connection between the DC/DC converter’s low-voltage side and the fan, and the fluctuation and randomness of the fan output, the current and power on the IGBT module change randomly, further leading to random changes in the average junction temperature and fluctuation amplitude. The average and fluctuation amplitude of the junction temperature can also affect the life prediction of IGBT modules, so statistical processing of junction temperature data is necessary for reasonably predicting device life. Firstly, the rain flow algorithm [27] is used to accurately calculate the number of fluctuations of the device under different junction temperature means and amplitudes during a certain period. Then, the damage degree is calculated to complete the life assessment.
The rain flow algorithm is a statistical counting method proposed by British engineers Matsuiski and Endo. Through this method, the measured junction temperature variation curve can be decomposed into multiple cycle stages, and the amplitude and average value of the junction temperature variation for each cycle can be recorded, thereby providing the necessary parameters for the life prediction of the IGBT module.
The rain flow algorithm calculates the flow of raindrops and searches for junction temperature cycles, by rotating the junction temperature change curve clockwise by 90° and representing time on the vertical axis and junction temperature on the horizontal axis. The counting rules of the rain flow algorithm are as follows:
  • Raindrops start from the peak (valley) value and flow downward along the inner side of the slope until reaching the next peak (valley) value;
  • Raindrops flow to the peak (valley) value, falling vertically until they reach the peak (valley) value below the starting point;
  • When the rain meets the rain flow on the upper inclined plane, a closed cycle curve is formed, forming a complete cycle;
  • Extract the corresponding junction temperature amplitude and average value from each complete cycle;
  • In the first stage of the rain flow algorithm mentioned above, convert the remaining divergence convergence curves into convergence divergence form and repeat the first four steps until all complete cycles are obtained. This is the second stage of rain flow counting;
  • The total number of cycles for rain flow counting is the sum of the total number of cycles in two stages.
The rain flow algorithm extracts statistical features of junction temperature from a large amount of temperature change data in the IGBT module, providing solid data support for the next step of life prediction and thus achieving effective integration between the junction temperature change model and the life model.

3.2.5. Life Prediction Model and Fault Rate Calculation of IGBT

IGBT life prediction models are mainly divided into two categories: physical modeling and analytical modeling. The former is based on the shape parameters and electrical parameters of the device, and accurately establishes the model through simulation technology. However, obtaining its parameters is relatively tricky, whereas the latter predicts the device’s lifespan through statistical methods combined with a large amount of experimental data, to obtain more realistic results. This paper will use a Coffin–Manson–Arrhenius analytical model [35] with high reliability evaluation accuracy and easy model parameter acquisition to predict the life of IGBT modules:
N f Δ T j , T m = α Δ T j β exp E a K B 273 + T m
where ΔTj is the junction temperature difference amplitude. Tm is the average junction temperature. Nf is the total number of failure cycles under working conditions ΔTj and Tm. α and β are the device-related parameters, whose values are 3.025 × 10⁵ and −5.039. Ea is the activation energy, whose values are 9.89 × 10⁻²⁰ J. KB is the Boltzmann constant, whose values are 1.382 × 10⁻²³ J/K. From (12), it can also be seen that the amplitude and mean of junction temperature changes impact the lifespan of IGBT modules. The larger the amplitude and mean of junction temperature changes, the shorter the lifespan of the IGBT module.
Based on predicting the lifespan, an IGBT module’s fault rate is calculated using a linear fatigue damage accumulation model based on the number of cycles under different operating conditions obtained from the rain flow count. The calculation formula is as follows [36]:
λ IGBT = i = 1 N N i N f
where Ni is the number of cycles under a specific working condition i. λIGBT lays the foundation for the subsequent analysis of the DC/DC converter’s reliability.

4. Reliability Model for BFBIC Submodule

After obtaining the fault rate of the IGBT module, the DC/DC converter submodule’s reliability model is established based on the BFBIC submodule structure composed of the IGBT module. This paper will use the FTA method to develop a reliability model for DC/DC converter submodules.

4.1. Steps for Reliability Modeling of IGBT Module

The FTA method starts with the fault to be analyzed (the top event), and analyzes the cause of its occurrence layer by layer until the basic fault (bottom event) that causes the fault is found. And then, representing the logical relationship between each layer of events through logic gates, such as parallel events through AND gates, series events through OR gates, and fault relationships of DC/DC converters with redundant submodules through voting gates. This method can intuitively and clearly describe the causal relationship of faults occurring in equipment or systems.
The specific steps of FTA are shown in Figure 9.
Qualitative analysis in Figure 9 can identify weak links in the system based on the minimum cut set, intuitively determine which type of fault is most dangerous, and take corresponding preventive measures. At the same time, it can also determine the impact of each basic event on the top event based on structural importance analysis, providing information for improving system safety [37]. Quantitative analysis can calculate the failure probability and other reliability characteristics of complex systems, providing quantitative data for improving and evaluating the reliability of the system. Since this paper only focuses on the DC/DC converter failure rate and reliability under the conditions of BFBIC-type topology, constant voltage control, etc., which does not involve the calculation of the importance of basic component failures or the need to optimize the topology and to optimize the control strategy through qualitative analysis, only quantitative analyses are performed on the BFBIC submodule and the DC/DC converter in order to obtain the specific values of the failure rate and to provide quantitative data for the subsequent reliability assessment.

4.2. Reliability Model of BFBIC Submodule

According to the topology structure of the active clamp BFBIC submodule shown in Figure 1, it can be seen that the primary side contains five IGBT modules, two capacitors, and two inductors. In contrast, the secondary side contains four FWDs and one capacitor. The primary and secondary sides are connected through a high-frequency transformer. The failure of any component in a submodule will lead to the failure of the entire BFBIC submodule, and all components are equivalent to a series connection relationship. Therefore, when FTA is used to establish its reliability model, “BFBIC submodule fault” is taken as the top event, “IGBT module fault,” “capacitance fault,” “inductance fault,” and “FWD fault” are taken as the intermediate events, and each component fault is taken as the bottom event. Its FTA model is established, as shown in Figure 10.
In the active clamping BFBIC submodule, due to the different working states of the primary clamp IGBT module and the bridge arm IGBT module, their operating currents, switching frequencies, and other parameters are also different. Therefore, the failure rates of SC, S1-S4 need to be calculated respectively, and then combined with the fault tree analysis shown in Figure 10, so the BFBIC submodule’s failure rate can be obtained.
λ S 1 - 4 = i = 1 I λ i
λ C = j = 1 J λ j
λ L = l = 1 L λ l
λ FWD = m = 1 M λ m
λ BFBIC = λ T + λ S C + λ S 1 4 + λ C + λ L + λ FWD
where λi, λj, λl, λm, λT, and λSc represent the fault rates of individual bridge arm IGBT modules, capacitors, inductors, FWDs, and the transformer and clamp IGBT module in the submodules; λS1-4, λC, λL, and λFWD represent the total failure rates of the bridge arm IGBT module, capacitor, inductor, and FWD, respectively; I, J, L, and M represent the number of bridge arm IGBT modules, capacitors, inductors, and FWDs in the submodules.

5. An Equipment-Level Reliability Model for DC/DC Converter

For a hybrid two-stage modular DC/DC converter, the FTA method is also used to establish its fault tree analysis and evaluate its reliability. According to the structure shown in Figure 2, it is easy to see that in the IPOS module, each BFBIC submodule is connected in a forward–parallel–backward string form. When there is no redundancy, the failure of any BFBIC submodule will cause the entire IPOS module to fail. When redundancy and the number of faulty submodules exceeds the n-k required for regular operation, the IPOS module fails. Redundancy can be divided into active redundancy and passive redundancy. Active redundancy refers to the simultaneous operation of redundant submodules during equipment operation. When a submodule fails, the faulty submodule is bypassed and the equipment can still meet normal working conditions. Passive redundancy refers to the situation where spare modules do not participate in the normal operation of the equipment, and redundant submodules only replace faulty submodules in the event of a submodule failure. For the entire DC/DC converter, multiple IPOS modules are connected in parallel through IPOP. It is believed that when all IPOS modules fail, it will cause the DC/DC converter equipment to malfunction. To sum up, “DC/DC converter fault” is taken as the top event, each IPOS module fault is taken as the intermediate event, and each BFBIC submodule fault is taken as the bottom event. The fault tree analysis model of the DC/DC converter is established, as shown in Figure 11.
The k/n gate in Figure 11 is a voting gate, indicating that for a system with n components, the system can only operate normally when the number of normal working components is not less than k, that is, the number of faulty components is not more than n-k. The failure rates of the IPOS module for devices in passive redundancy, active redundancy, and no redundancy situations are [28]:
λ IPOS , passive   redundancy = k λ BFBIC / n k + 1
λ IPOS , active   redundancy = λ BFBIC / g = k n 1 g
λ IPOS , without   redundancy = g = 1 n λ BFBIC , g
where n represents the number of BFBIC submodules in the IPOS module.
The expression for the fault rate of DC/DC converters is:
λ DC / DC = h = 1 N λ IPOS , h
where N is the number of IPOS modules in the IPOP structure.
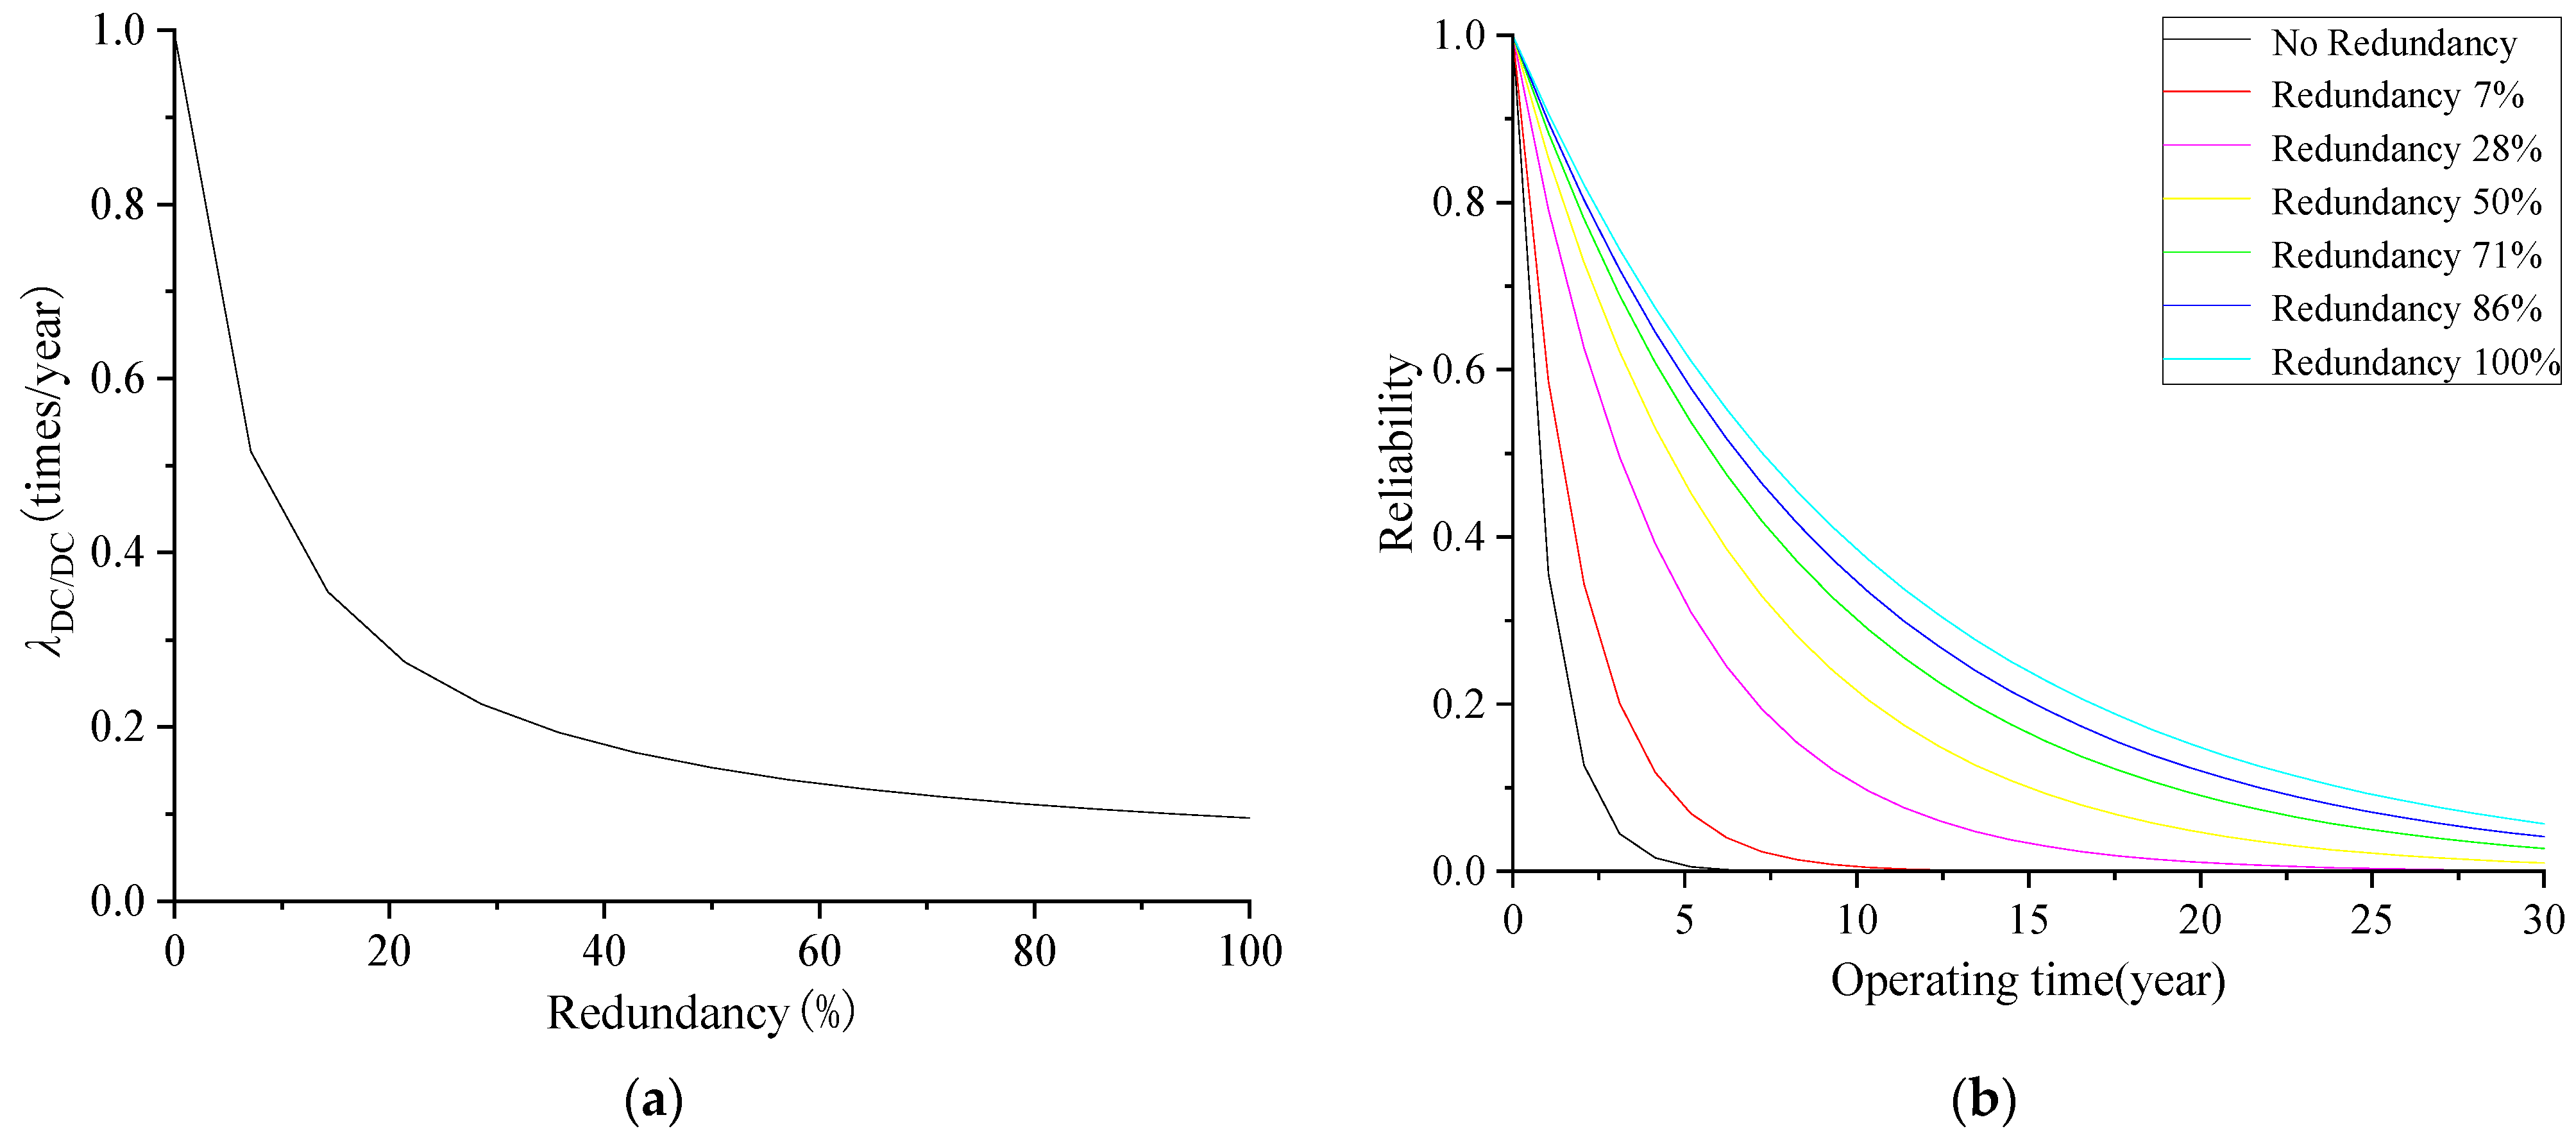
Based on the above calculation of λDC/DC, the reliability function is further used as a reliability indicator to evaluate its reliability. Reliability refers to the ability of a component or equipment to complete a predetermined function under specified conditions and within a specified time. It is a probability measure of reliability, and its expression is as shown in Equation (23) [19]:
R DC / DC t = e λ DC / DC t
where t is the operating time. The range of RDC/DC (t) is (0, 1]. The larger the R, the better the reliability of the equipment. At the same time, as time continues to increase, the reliability of the equipment gradually decreases.

6. Example Analysis and Discussion

6.1. Example Information

This section will analyze the reliability of DC/DC converters based on the demonstration project of a wind farm DC collection system in northwest China. According to the demonstration project, a wind farm DC collection system model was built in the PSCAD/EMTDC simulation software (https://www.pscad.com/) to obtain relevant data such as current and voltage of the DC/DC converter, as shown in Figure 12. The main parameters of the system and DC/DC converter are shown in Table 3; The IGBT module model used in the DC/DC converter is Infineon’s FF1400R17IP4, and its thermal impedance calculation parameters can be obtained by consulting the IGBT module manual on Infineon’s official website. The specific data are shown in Table 4. The reliability parameters of each component of the DC/DC converter are shown in Table 5, and the data mainly come from the statistical data of traditional power electronic equipment [38]. Due to the fact that this article does not consider the influence of external environmental and weather factors, assuming an ambient temperature of 40 °C and normal weather conditions without adverse weather conditions, after obtaining the operating data and related parameters of the DC/DC converter, the IGBT module, BFBIC submodule, and DC/DC converter, fault rates were gradually calculated through MATLAB software (https://ww2.mathworks.cn/products/matlab.html) programming and reliability evaluation was conducted.

6.2. Reliability of the BFBIC Submodule Model

6.2.1. Loss Analysis of the IGBT Model

Firstly, the output characteristic curves of IGBT and FWD at different temperatures in the IGBT module manual were fitted in three dimensions using MATLAB. The fitting results are shown in Figure 13, and the analytical expressions for the saturation voltage drop, current, and temperature changes of IGBT and FWD were obtained, as shown in (24) and (25).
V ce = 0.04224 i c 3 + 2.776 × 10 6 i c T j _ T + 0.0004 i c + 0.6234
V F = 0.09817 i c 3 + 3.696 × 10 7 i c T j _ D + 0.0001735 i c + 0.3929
Then, the Vce, VF, and D expressions, as well as the voltage, current, and IGBT module parameters measured in the PSCAD model, were substituted into Formulas (2) to (8) to calculate the power loss curves of the bridge arm IGBT module and the clamp IGBT module over time, as shown in Figure 14, respectively. According to Figure 14, it can be seen that in the built simulation environment, IGBT and FWD power losses vary between 0–2300 W and 0–700 W for the bridge arm IGBT module. IGBT and FWD power losses vary between 0–3500 W and 0–900 W for the clamp IGBT module. The results indicate that the power loss of the clamp IGBT module is higher than that of the bridge arm IGBT module. This is because the clamp IGBT module conducts during the diagonal conduction period of the bridge arm IGBT module, and its switching frequency is twice that of the bridge arm IGBT module [30]. Moreover, the current flowing through the clamp IGBT module differs from that of the bridge arm IGBT module, so its power loss is greater than that of the bridge arm IGBT module.

6.2.2. Analysis of Junction Temperature in IGBT Module

Substituting the IGBT module loss results obtained in Section 6.2.1 and the thermal impedance parameters of the IGBT module in Table 4 into Equations (10) and (11), the junction temperature fluctuation curves of the bridge arm IGBT module and the clamp IGBT module can be calculated as shown in Figure 15. Due to the significant changes in the primary current value of the DC/DC converter, the IGBT module’s temperature fluctuation is also relatively large. The fluctuation range of the IGBT junction temperature in the bridge arm IGBT module is 40–130 °C, and the fluctuation range of the FWD junction temperature is 40–100 °C. The fluctuation range of the IGBT junction temperature in the clamp IGBT module is 40–175 °C, and the fluctuation range of the FWD junction temperature is 40–125 °C. From the results, it can be seen that the switching frequency of the clamp IGBT module is higher than that of the bridge arm IGBT module, which leads to high power loss and further leads to a more extensive range of junction temperature changes compared to the bridge arm IGBT module.
Based on the changes in the junction temperature of the IGBT module, the rain flow algorithm is used to extract the cycle parameters of junction temperature fluctuations. The number of cycles of the IGBT or FWD at different junction temperature fluctuation amplitudes ΔTj and mean values Tm can be calculated, as shown in Figure 16. This statistical result provides data support for subsequent life prediction and fault rate calculation.

6.2.3. Life Prediction and Failure Rate Analysis of the IGBT Module

Several sets of IGBT module junction temperature fluctuation amplitudes ΔTj and average junction temperatures Tm will be obtained considering the influence of the DC/DC converter control strategy and without considering the influence of the control strategy. They are substituted into the Equation (12) Coffin–Manson–Arrhenius life prediction model to obtain the total number of failure cycles Nf corresponding to each group. Then, the Ni and Nf corresponding to each group of ΔTj and Tm are substituted into Equation (13) to calculate the actual failure rate during operation. The specific results are shown in Table 6. From the constant voltage control block diagram (Figure 5) and transfer function expression (1) of Section 2.3.2 of the DC/DC converter, it can be seen that the control strategy determines the variation of the duty cycle D of the IGBT control signal over time. From Section 3.2, it can be seen that the duty cycle D is of great significance in the calculation of IGBT module losses. The variation in the duty cycle can lead to changes in IGBT module losses and junction temperatures, resulting in different lifespans and fault rates of the IGBT module. Therefore, after considering constant voltage control, the duty cycle D is modified from a constant to a function that fluctuates over time, as shown in Equation (3). The lifespan and failure rate of the IGBT module both vary, which is consistent with the results in Table 6. Regardless of whether the influence of control strategy is considered or not, the failure rate of the clamp IGBT module is greater than that of the bridge arm IGBT module. The reason is that the switching frequency of the clamp IGBT module is twice that of the bridge arm IGBT module, resulting in a much higher loss and junction temperature than that of the bridge arm IGBT module, resulting in a higher failure rate than the bridge arm IGBT module.

6.3. Reliability of BFBIC Submodule and DC/DC Converter

6.3.1. Reliability of BFBIC Submodule and DC/DC Converter Considering Control Strategy

Based on the IGBT module fault rate obtained in Section 6.2, as well as the BFBIC submodule and DC/DC converter fault tree model, the fault rates with and without considering the influence of control strategy can be obtained, as shown in Table 7. According to the results, it is not difficult to see that as the IGBT module is the core component of the DC/DC converter, the fault rate of the IGBT module after considering the control strategy is reduced, which further leads to a decrease in the fault rate of the BFBIC submodule and the DC/DC converter compared to when the control strategy is not considered.
At the same time, the reliability curves of the DC/DC converter are plotted based on the fault rate of the DC/DC converter, taking into account the influence of control strategies, as shown in Figure 17. From the graph, it can be seen that when the DC/DC converter runs for two years, the trend of equipment reliability decline slows down, and when it runs for five years, the reliability is almost zero. Meanwhile, when considering the influence of control strategy, the reliability curve of the DC/DC converter is higher than when not considering the influence of control strategy, which also indicates that the reliability of the DC/DC converter is higher when considering the influence of control strategy than when not considering it, and the evaluation results have improved.

6.3.2. Reliability of DC/DC Converter Considering Redundancy

Based on the failure rate of BFBIC submodules considering control strategies, the reliability of DC/DC converters with different redundancy levels is evaluated. In this article, the DC/DC converter adopts a more reliable passive redundancy method [28], which means that the backup module is not involved in normal operation. Only when at least 14 submodules are working properly can the equipment ensure normal operation. The curve of the reliability index of the DC/DC converter with the variation of submodule redundancy is shown in Figure 18. From the figure, it can be seen that when the DC/DC converter contains redundant submodules, its fault rate is significantly reduced, reliability is further improved, and the operating time of the equipment is also increased. Meanwhile, with the continuous increase of redundancy, the trend of reducing the fault rate and improving the reliability of DC/DC converters decreases. The results show that when there is redundancy, the DC/DC fault rate is smaller, the reliability is higher, and the operating time is also better. This is because after setting redundancy, when a certain submodule fails, it will be replaced by redundant submodules to operate, and the DC/DC converter can still operate normally. With the continuous increase of redundancy, the trend of reducing the fault rate and improving the reliability of DC/DC converters gradually slows down, indicating that when the number of redundant submodules increases to a certain extent, the improvement effect of increasing the number of redundant submodules on the reliability of DC/DC converters becomes weaker.

6.4. Discussion

According to the results in Section 6.3, it can be seen that the reliability evaluation method for DC/DC converters in wind farm DC collection systems considering the influence of control strategies proposed in this article has a certain improvement effect on the reliability evaluation results of DC/DC converters. The reason is that in current research on the impact of IGBT module loss on the reliability of DC/DC converters, most only consider the impact of IGBT aging, operating conditions, or modulation methods on the duty cycle. However, in addition to these factors, the control strategy of DC/DC converters also has an impact on the duty cycle. In this article, the constant voltage control of DC/DC converters is introduced into the loss calculation of IGBT modules to correct the duty cycle of IGBT control signals. The duty cycle is programmed as a function of time from a fixed value, resulting in changes in the loss, junction temperature, and fault rate of the IGBT module compared to the situation where control strategy is not considered for duty cycle correction. As an important component of the DC/DC converter, the change in the fault rate of the IGBT module will inevitably lead to changes in the equipment’s fault rate, which improves the reliability evaluation results of the DC/DC converter. However, there are also some areas that need to be improved in the model built in this article, such as:
(1) This article only considers the impact of constant voltage control on the reliability of DC/DC converters, but in reality, there are other types of control strategies, such as MPPT control and constant power control [32]. Different control strategies have different control objects and transfer functions, so the time domain expression of the duty cycle is also different, and the improvement effect on the reliability of DC/DC converters is also different. In the future, multiple models of DC/DC converter control strategies can be built, and different transfer functions can be used to modify the duty cycle, evaluate the equipment’s reliability in each case, and study the control strategy that has the best effect on improving reliability.
(2) In the research process of this article, it is assumed that all subsystems, such as control and protection systems, valve cooling systems, etc., except for the submodules, are working normally. However, in reality, these subsystems may affect the reliability of DC/DC converters [22]. Therefore, the faults of these subsystems can also be considered in the reliability evaluation of DC/DC converters in the future, and the impact of different protection schemes can also be studied.
(3) In addition, like current research in the field of DC/DC reliability, this article has not yet considered the cost issue of redundancy in the study of BFBIC submodule redundancy on equipment reliability. This issue also needs to be optimized and designed separately based on the reliability and economy requirements of DC/DC converters in practical engineering.

7. Conclusions

This paper proposes a reliability evaluation method for BFBIC DC/DC converters in wind farm DC collection systems, considering the influence of control strategy. The impact of the DC/DC converter control strategy on the IGBT’s duty cycle was incorporated into the reliability modeling process of the IGBT module, and then FTA was used to further establish the reliability models of the BFBIC submodule and DC/DC converter. Taking a ±30 kV/10 MW DC collection system of the wind farm as an example, we made comparisons and analyzed whether to consider the influence of control strategies and whether to consider the fault rate of redundant DC/DC converters. The conclusion is as follows:
(1) When considering the influence of the constant voltage control strategy of the DC/DC converter, both the clamp IGBT module and the bridge arm IGBT module have lower fault rates, further reducing the fault rate and increasing the reliability level of the DC/DC converter. Compared to the reliability evaluation results without considering constant voltage control, the results are improved and more accurate.
(2) On the basis of considering control strategies, the reliability of DC/DC converters under different redundancy levels was evaluated. The results show that DC/DC converters with redundant submodules have better reliability, and the higher the redundancy, the better the reliability. However, as the number of redundant submodules increases, the effect of improving the reliability of DC/DC converters gradually weakens.
However, this article only considers the quantitative analysis of the impact of a fixed voltage control strategy on the reliability of DC/DC converters. In the future, further modeling and qualitative analysis can be conducted on the impacts of different control strategies to propose preventive measures to improve system safety. In addition, in the reliability analysis of DC/DC converters with different degrees of redundancy in this article, the impact of redundancy on economy was not considered. It is necessary to optimize the redundant configuration of DC/DC converters by comprehensively considering reliability and economy based on actual engineering needs in the future.

Author Contributions

Conceptualization, J.L. and X.B.; methodology, J.L.; software, J.L. and X.B.; validation, J.L.; formal analysis, J.L.; investigation, J.L.; resources, X.B. and J.H.; data curation, J.L.; writing—original draft preparation, J.L.; writing—review and editing, Y.F. and J.H.; visualization, J.L.; supervision, Y.F.; project administration, Y.F. and J.H.; funding acquisition, Y.F. All authors have read and agreed to the published version of the manuscript.

Funding

This research was funded by the National Key Research and Development Program of China (2021YFB1507000), in part by the Tianshan Talent Training Program in 2022 (2022TSYCLJ0019), in part by the Science and Technology Project of China Southern Power Grid Research Institute (SEPRI-K22B055), and in part by the Sponsored by Natural Science Foundation of Xinjiang Uygur Autonomous Region (2022D01C365 and 2022D01C662).

Data Availability Statement

Not applicable.

Conflicts of Interest

The authors declare no conflict of interest.

Nomenclatures

DIGBT control signal duty cycle
EaActivation energy, 9.89 × 10⁻²⁰ J
EonIGBT activation loss energy, mJ
EoffIGBT shutdown loss energy, mJ
ErecFWD reverse recovery loss, mJ
fswSwitching frequency, Hz
icIGBT on state current, kA
iNRated current of IGBT module, kA
INumber of IGBT modules for the bridge arm in the BFBIC submodule
JNumber of bridge arm capacitors in BFBIC submodule
kp, kiPI regulator parameters
KBBoltzmann constant, 1.382 × 10⁻²³ J/K
KEDTemperature coefficient of FWD shutdown energy loss
KETTemperature correction coefficient for energy loss of IGBT switches
LNumber of inductors in BFBIC submodule
MNumber of FWDs in BFBIC submodules
nNumber of BFBIC submodules
NNumber of IPOS modules
NfUnder operating conditions Δ total number of failure cycles at ΔTj and Tm
NiNumber of cycles under specific working condition i
Pcond_DFWD on state loss, W
Pcond_TIGBT On state loss, W
Psw_DFWD switch loss, W
Psw_TIGBT switch loss, W
PDFWD total power loss, W
PTIGBT total power loss, W
RDC/DCReliability of DC/DC converters
sComplex frequency domain variable
tTime domain variable
TaEnvironmental temperature, °C
Tj_DFWD junction temperature, °C
Tj_TIGBT junction temperature, °C
TmAverage junction temperature, °C
ΔTjJunction temperature difference amplitude, °C
UdcInput side DC voltage, kV
UinPrimary input voltage, kV
UoutSecondary side output voltage, kV
UrefInput side reference voltage, kV
UNRated voltage of IGBT module, kV
ΔUInput side DC voltage reference voltage difference, kV
VceIGBT saturation voltage drop, kV
VFFWD saturation voltage drop, kV
ZthhaIGBT module heat sink—environmental thermal impedance, Ω
Zthch_DFWD shell—radiator thermal impedance, Ω
Zthch_TIGBT shell heat sink thermal impedance, Ω
Zthjc_DFWD chip—shell thermal impedance, Ω
Zthjc_TIGBT chip—shell thermal impedance, Ω
λBFBICBFBIC submodule failure rate
λCTotal failure rate of capacitors
λDC/DCDC/DC converter failure rate
λFWDTotal failure rate of FWD
λIGBTIGBT module failure rate
λIPOS, active redundancyIPOS module failure rate during active redundancy
λIPOS, passive redundancyIPOS module failure rate during passive redundancy
λIPOS, without redundancyIPOS module failure rate without redundancy
λiSingle bridge arm IGBT module failure rate
λjSingle capacitor failure rate
λlSingle inductor failure rate
λLTotal fault rate of inductance
λmSingle FWD failure rate
λS1~4Total failure rate of bridge arm IGBT module
λSCClamp IGBT module failure rate
λTTransformer failure rate
BFBICBoost full-bridge isolated converter
DABDual active bridge
FTAFault tree analysis
FWDFreewheeling diode
IPOPInput parallel output parallel type
IPOSInput parallel output series type
ISOPInput series output parallel type
ISOSInput series output series type
MMCModular multilevel converter
τTime constant of thermal impedance of IGBT module
αIGBT module related parameters, 3.025 × 10⁵
βIGBT module related parameters, −5.039

References

  1. Yang, G. Review on engineering practices and future technology prospects of European offshore wind power. Autom. Electr. Power Syst. 2021, 45, 23–32. [Google Scholar]
  2. Li, Y.; Feng, J.; Lu, Y.; Pan, E. Key technologies and prospects of VSC-HVDC for large-capacity and long-distance offshore wind power transmission. High Volt. Eng. 2022, 49, 3384–3393. [Google Scholar]
  3. Guan, M. A series-connected offshore wind farm based on modular dual-active-bridge (DAB) isolated DC-DC converter. IEEE Trans. Energy Convers. 2019, 34, 1422–1431. [Google Scholar] [CrossRef]
  4. Pan, E.; Yue, B.; Li, X.; Zhao, Z.; Zhu, Q. Integration technology and practice for long-distance offshore wind power in China. Energy Convers. Econ. 2020, 1, 4–19. [Google Scholar] [CrossRef]
  5. Sun, Y.; Fan, Y.; Lu, J.; Shu, S. Optimal design method for topology of onshore wind power DC collection system. Autom. Electr. Power Syst. 2023, 47, 142–152. [Google Scholar]
  6. Cai, X.; Yang, R.; Zhou, J. Review on offshore wind power integration via DC transmission. Autom. Electr. Power Syst. 2021, 45, 2–22. [Google Scholar]
  7. Rong, F.; Wu, G.; Li, X.; Huang, S.; Zhou, B. All-DC offshore wind farm with series-connected wind turbines to overcome unequal wind speeds. IEEE Trans. Power Electr. 2019, 34, 1370–1381. [Google Scholar] [CrossRef]
  8. Yin, H.; Fan, L. Modeling and control of DFIG-based large offshore wind farm with HVDC-link integration. In Proceedings of the 41st North American Power Symposium (NAPS), Starkville, MI, USA, 4–6 October 2009. [Google Scholar]
  9. Wang, X.; Tang, G.; He, Z.; Wei, X. Topology research of DC/DC converters for offshore wind farm DC collection systems. Proc. CSEE 2017, 37, 837–848. [Google Scholar]
  10. Choi, U.; Blaabjerg, F.; Lee, K. Study and handling methods of power IGBT module failures in power electronic converter systems. IEEE Trans. Power Electr. 2015, 30, 2517–2533. [Google Scholar] [CrossRef]
  11. Li, H.; Deng, J.; Yao, R.; Zhang, X. Reliability modeling and analysis of MMC converter valve considering operation conditions. Electr. Power Autom. Equip. 2018, 38, 108–114. [Google Scholar]
  12. Zhong, W.; Wang, L.; Liu, Z.; Hou, S. Reliability evaluation and improvement of islanded microgrid considering operation failures of power electronic equipment. J. Mod. Power Syst. Clean Energy 2020, 8, 111–123. [Google Scholar] [CrossRef]
  13. Zheng, T.; Huang, M.; Zhu, L.; Zha, X. Reliability evaluation of MMC system considering working conditions. J. Eng. 2019, 2019, 1877–1881. [Google Scholar] [CrossRef]
  14. Vaccaeo, A.; Zilio, A.; Magnone, P. Lifetime prediction in power semiconductor devices: A comparative study between analytical modeling and artificial neural network. In Proceedings of the 2023 IEEE Applied Power Electronics Conference and Exposition (APEC), Long Beach, CA, USA, 19–23 March 2023. [Google Scholar]
  15. Lai, W.; Chen, M.; Ran, L.; Xu, S. IGBT lifetime model based on aging experiment. Trans. China Electrotech. Soc. 2016, 31, 173–180. [Google Scholar]
  16. Du, X.; Li, G.; Li, T.; Wang, X. Multi-time scale lifetime evaluation of IGBT modules in the wind power converter. Proc. CSEE 2015, 35, 590–602. [Google Scholar]
  17. Ma, K.; Liserre, M.; Blaabjerg, F.; Kerekes, T. Thermal loading and lifetime estimation for power device considering mission profiles in wind power converter. IEEE Trans. Power Electr. 2015, 30, 590–602. [Google Scholar] [CrossRef]
  18. Li, Q.; Pang, H.; He, Z. Analytic calculating method for loss and junction temperature of modular multilevel converter. Autom. Electr. Power Syst. 2016, 40, 85–91. [Google Scholar]
  19. Cheng, L.; Xiang, Y.; Zhou, Y.; Yang, Z. Operational reliability analysis and application of MMC power electronic transformers. Power Syst. Technol. 2022, 46, 1073–1083. [Google Scholar]
  20. Wang, P. Research on Reliability of Photovoltaic Grid Connected Inverter. Master’s Thesis, Beijing Jiaotong University, Beijing, China, 2017. [Google Scholar]
  21. Hu, S.; Zhou, H.; Cong, L.; Dai, W. Reliability analysis of distribution network with power electronic substation based on fault tree. Power Syst. Prot. Control 2018, 46, 25–31. [Google Scholar]
  22. Wang, X.; Guo, J.; Pang, H.; Xu, J.; Wang, L. Structural reliability analysis of modular multi-level converters. Proc. CSEE 2016, 36, 1908–1914. [Google Scholar]
  23. Li, L.; Shuai, S.; Xiong, W.; Wu, D.; Jing, H. Research on hybrid MMC reliability model considering submodule correlation. Electr. Autom. 2022, 44, 102–105. [Google Scholar]
  24. Xu, J.; Jing, H.; Zhao, C. Reliability modeling of MMCs considering correlations of the requisite and redundant submodules. IEEE Trans. Power Deliv. 2018, 33, 1213–1222. [Google Scholar] [CrossRef]
  25. Huang, S.; Fu, X.; Rao, H.; Zhao, C. Reliability analysis and redundant configuration strategy of MMC based on Semi-Markov. Electr. Power Autom. Equip. 2018, 38, 128–133. [Google Scholar]
  26. Xie, Y.; Qiu, D.; Xie, F. Review of reliability analysis of modular multilevel converter based on multiscale theory. Power Syst. Technol. 2020, 44, 1852–1862. [Google Scholar]
  27. Deng, S. Reliability Evaluation of Medium and Low Voltage DC Distribution Network Based on Power Electronic Devices and Equipments. Master’s Thesis, Chongqing University, Chongqing, China, 2017. [Google Scholar]
  28. Shuai, S. Research on Reliability Model of Key Equipment in DC Distribution Center. Master’s Thesis, Guizhou University, Guizhou, China, 2021. [Google Scholar]
  29. Guo, H. Study on Reliability Analysis and Optimization Measures of DC Distribution Network. Master’s Thesis, Southeast University, Nanjing, China, 2019. [Google Scholar]
  30. Li, G.; Fan, Y.; Wang, Y.; Zhang, X. Research on control strategy of IPOS type photovoltaic DC boost delivery system. Acta Energiae Solaris Sin. 2021, 42, 166–176. [Google Scholar]
  31. Ma, J.; Fan, Y.; Wang, Y.; Gao, W. Maximum power point tracking strategy for centralized photovoltaic DC/DC converter. Acta Energiae Solaris Sin. 2022, 43, 137–145. [Google Scholar]
  32. Wei, S. Coordinated Control Strategy of the DC Integration System for PV Generation. Master’s Thesis, School of North China Electric Power University, Beijing, China, 2019. [Google Scholar]
  33. Wang, X.; Li, Z.; Yao, F. Power loss calculation and junction temperature detection of IGBT devices for modular multilevel valve. Trans. China Electrotech. Soc. 2019, 34, 1636–1646. [Google Scholar]
  34. Liu, L.; Li, K.; Huang, M.; Wang, Y.; Lin, S. On-line calculation method of an IGBT on-state loss of an MMC sub-module based on a voltage and current characteristic curve. Power Syst. Prot. Control 2022, 50, 19–27. [Google Scholar]
  35. Li, L.; He, Y.; Wang, L.; Wang, C.; Liu, X. IGBT lifetime model considering composite failure modes. Mater. Sci. Semiconductor Proc. 2022, 143. [Google Scholar] [CrossRef]
  36. Zhang, B.; Gao, Y.; Li, T.; Hu, X.; Yang, E. Optimal PV system capacity ratio and power limit value selection based on a novel fast calculation method of IGBT junction temperature and IGBT annual damage analysis. Energy Rep. 2022, 8, 348–355. [Google Scholar] [CrossRef]
  37. Kuo, W.; Zhu, X. Importance Measures in Reliability, Risk, and Optimization: Principles and Applications, 1st ed.; Wiley: Hoboken, NJ, USA, 2012. [Google Scholar]
  38. Ding, M.; Bi, R.; Wang, J. FD method and combined model for reliability assessment of HVDC flexible. Power Syst. Prot. Control 2008, 36, 33–37. [Google Scholar]
Figure 1. Topological structure of BFBIC submodule.
Processes 11 02825 g001
Figure 2. Hybrid two-stage modular structure of DC/DC converter.
Processes 11 02825 g002
Figure 3. Timing diagram of IGBT control signal of BFBIC submodule.
Processes 11 02825 g003
Figure 4. Operation state with active clamp BFBIC submodule: (a) Working State 1; (b) Working State 2; (c) Working State 3; (d) Working State 4; (e) Working State 5; (f) Working State 6.
Processes 11 02825 g004
Figure 5. Constant voltage control of active clamp BFBIC submodule.
Processes 11 02825 g005
Figure 6. Reliability modeling process for IGBT module.
Processes 11 02825 g006
Figure 7. Layered structure of IGBT modules.
Processes 11 02825 g007
Figure 8. Foster thermal network model for IGBT module.
Processes 11 02825 g008
Figure 9. Steps for FTA.
Processes 11 02825 g009
Figure 10. Fault tree model for BFBIC submodule.
Processes 11 02825 g010
Figure 11. Fault tree model for DC/DC converter.
Processes 11 02825 g011
Figure 12. Topology structure of wind farm DC collection system.
Processes 11 02825 g012
Figure 13. Fitting in 3D of IGBT and FWD characteristic curves: (a) three-dimensional characteristic curve of IGBT; (b) three-dimensional characteristic curve of FWD.
Processes 11 02825 g013
Figure 14. Power loss change curves of IGBT module: (a) power loss variation curve of bridge arm IGBT; (b) power loss variation curve of bridge arm FWD; (c) power loss variation curve of clamp IGBT; (d) power loss variation curve of clamp FWD.
Processes 11 02825 g014
Figure 15. Junction temperature fluctuation curves of IGBT module: (a) junction temperature fluctuation curve of bridge arm IGBT; (b) junction temperature fluctuation curve of bridge arm FWD; (c) junction temperature fluctuation curve of clamp IGBT; (d) junction temperature fluctuation curve of clamp FWD.
Processes 11 02825 g015
Figure 16. Temperature cycle histograms of IGBT module: (a) temperature cycle histogram of bridge arm IGBT; (b) temperature cycle histogram of bridge arm FWD; (c) temperature cycle histogram of clamp IGBT; (d) temperature cycle histogram of clamp FWD.
Processes 11 02825 g016
Figure 17. Reliability curve of DC/DC converter considering the influence of control strategy and not considering the influence of control strategy.
Processes 11 02825 g017
Figure 18. Reliability curve of DC/DC converter considering the influence of control strategy and not considering the influence of control strategy: (a) fault rate variation curve of DC/DC converter considering redundancy; (b) reliability curves of DC/DC converters under different redundancy conditions.
Processes 11 02825 g018
Table 1. IGBT module working state and conduction state.
Working StateConduction DeviceLboostCc
0~t1S1~S4charge\
t1~t2S1, S4, Sc, D1, D4dischargecharge
t2~t3S1, S4, Sc, D1, D4dischargedischarge
t3~t4S1~S4charge\
t4~t5S2, S3, Sc, D2, D3dischargecharge
t5~t6S2, S3, Sc, D2, D3dischargedischarge
Table 2. Conversion relationship of thermal–electrical parameters.
Thermal ParametersUnitsElectrical ParametersUnits
Thermal resistance°C/WResistanceR/Ω
Heat capacityJ/°CCapacitanceC/F
Temperature differenceΔT/KVoltageU/V
Heat flowP/WCurrentI/A
HeatQ/JChargeQ/C
Table 3. Wind farm DC collection system and DC/DC converter parameters.
Physical QuantityNumerical ValuePhysical QuantityNumerical Value
Number of DC-type fans2Number of BFBIC submodules14
Rated power of fan (MW)5Input filtering capacitor Cin (mF)50
Rated wind speed (m/s)14.4Boost inductance Lboost (mH)0.1
DC/DC converter input side DC voltage (kV)1Clamp capacitor Cc (uF)600
DC/DC converter output side DC voltage (kV)±30Isolation transformer T ratio1/4
DC/DC converter ratio1/60Isolation transformer T leakage inductance Lr (mH)0.004
Converter switching frequency ƒs (kHz)2Output filter capacitor Cout (mF)0.6
Table 4. Thermal resistance calculation parameters of IGBT module.
Chip to Shell Thermal Resistance ParametersShell to Radiator Thermal Resistance ParametersRadiator to Environmental Thermal Resistance Parameters
IGBTiRi (K/kW)τi (s)R (K/kW)τ (s)R (K/kW)τ (s)
110.00190.073030
211.30.03
32.20.1
411
FWD12.1680.000661170.073030
22.7630.00685
325.890.0417
41.7742.07
Table 5. Reliability parameters of components of DC/DC converter.
Componentλ (Times/Year)
IGBT moduleProposed method
Inductance0.004
Capacitance0.001752
Transformer0.013
Secondary side FWD0.001
Table 6. Lifetime and failure rate of IGBT module.
Type of IGBT ModuleIGBT/FWDLife (Year)Failure Rate (Times/Year)Failure Rate of IGBT Module (Times/Year)
Considering the impact of control strategybridge arm IGBT moduleIGBT101.06550.00990.0122
FWD443.88330.0023
clamp IGBT moduleIGBT152.88940.00650.0078
FWD755.28780.0013
Not considering the impact of control strategybridge arm IGBT moduleIGBT94.16500.01060.0133
FWD376.59000.0027
clamp IGBT moduleIGBT144.81920.00690.0084
FWD665.99540.0015
Table 7. Failure rate of BFBIC submodule and DC/DC converter.
λBFBIC (Times/Year)λDC/DC (Times/Year)
Considering the impact of control strategy0.07130.4041
Not considering the impact of control strategy0.07450.4185
Disclaimer/Publisher’s Note: The statements, opinions and data contained in all publications are solely those of the individual author(s) and contributor(s) and not of MDPI and/or the editor(s). MDPI and/or the editor(s) disclaim responsibility for any injury to people or property resulting from any ideas, methods, instructions or products referred to in the content.

