Review

Research Progress in the Analysis of Chemical Forms of Mercury in Traditional Chinese Medicine

1
Biochemical Engineering College, Beijing Union University, Beijing 100023, China
2
State Key Laboratory for Quality Ensurance and Sustainable Use of Dao-di Herbs, National Resource Center for Chinese Materia Medica, China Academy of Chinese Medical Sciences, Beijing 100700, China
*
Authors to whom correspondence should be addressed.
Processes 2023, 11(10), 2821; https://doi.org/10.3390/pr11102821
Submission received: 23 August 2023 / Revised: 19 September 2023 / Accepted: 22 September 2023 / Published: 24 September 2023
(This article belongs to the Special Issue Advances in Environmental Pollution and Control Processes)

Abstract

:
A comprehensive evaluation of the chemical forms of heavy metals, rather than their total amount of elements, is the basis of the scientific and objective evaluation of safety in heavy metals. As mercury, the most toxic heavy metal in the environment (such as in water, soil, and air), accumulates in medicinal plants, chemical forms of mercury in medicinal plants and their preparation need to be clearly understood. This study aims to summarize the chemical status of mercury in bulk Chinese medicinal herbs and traditional Chinese medicine preparations and to discuss research methods for their analysis. Further, widespread high-performance liquid chromatography–inductively coupled plasma mass spectrometry, advanced synchrotron X-ray absorption fine structure spectroscopy, and X-ray fluorescence were used for the in situ analysis of the chemical state of mercury. The results were then analyzed to improve the analytical methods and evaluation standards for the chemical state of mercury in Chinese herbal medicines.

1. Introduction

Traditional medicine is an excellent carrier of traditional Chinese culture and has promoted mutual learning among civilizations, improving human health, and so forth. Traditional Chinese medicine (TCM) is an outstanding representative of alternative and complementary medicine and has been widely accepted in many countries for its unique functions in disease prevention, treatment, rehabilitation, and other problems. TCM has embodied the health and wellness concepts and practical experiences of the Chinese nation for thousands of years. It is a treasure of Chinese civilization and symbolizes the vast wisdom of the Chinese people and the Chinese nation. According to the third national survey of TCM resources, 12,807 types of TCM resources are available in China, including 11,146 medicinal plant species, 1581 medicinal animal species, and 80 medicinal minerals [1]. China has various abundant TCM resources, occupying a certain share of the international market, though it has encountered many challenges. According to the “China Manufacturing Strength Ranking—Industry International Competitiveness Index” issued by the magazine “China Customs” in recent years, the export of TCM only accounts for about 2% of pharmaceutical exports, reflecting the lack of competitiveness of TCM in the global standing [2]. The reasons for this are not only the external factors related to the TCM industry but also the quality and safety issues of TCM itself, especially the problem of heavy metal residues in TCM. These obstacles have become a major challenge in obtaining permission for international markets access to TCM.
Heavy metals pollute TCMs in China to a certain degree. Based on the “Green Industry Standards for the Import and Export of Medicinal Plants and Preparations”, the degree of heavy metal pollution in the TCM of China was evaluated. The results show that the ratios of samples polluted by excessive lead (Pb), cadmium (Cd), mercury (Hg), arsenic (As), and copper (Cu) reached 9.66%, 26.35%, 13.0%, 9.32%, and 16.09%, respectively [3]. Among these, the ratio of samples polluted by Hg has increased to a large extent, which could be because of the extensive combustion of fossil fuels and improper disposal of Hg-containing waste in recent years [4]. On the one hand, in the process of TCM preparation, heavy metals can enter medicinal materials through their growth environment, such as the soil, water, and air. On the other hand, TCM formulations contain heavy metal drug components, such as cinnabar (mercury sulfide, HgS) and white As (arsenic trioxide, As2O3). Of all the aforementioned heavy metals, Hg-containing TCM is widely applied. Among the drugs manufactured by the Tongrentang Pharmaceutical Group, a century-old TCM enterprise, 86 preparations are derived from cinnabar. Cinnabar has sedative, hypnotic, detoxification, and anti-corrosion effects, and its external use can inhibit or kill skin bacteria and parasites. Cinnabar is a compound of Hg and is a common and relatively safe drug in traditional medicine. Cinnabar is different from free Hg in nature. For example, the Sedative Bolus of Cinnabar is a blood-nourishing and tranquilizing medicine that treats neurasthenia and mental depression. The prescription consists of the following ingredients: 15 g of cinnabar, 8 g of Coptis chinensis, 16 g of roasted licorice, 8 g of dried Rehmannia root, and 8 g of Angelica sinensis. Western medicine has a single and clear ingredient, while TCM has extremely complex ingredients. Therefore, the morphology, structure, valence, and coordination state of Hgs in TCM are worthy of research.
Hg is a highly volatile and highly toxic heavy metal element. It is transported and diffused through the air into water and soil via settling. It is a persistent pollutant that is widely distributed in the environment. Hg in the environment (such as water, soil, and air) is accumulated in Chinese herbal medicine. It has different chemical forms, such as simple Hg (Hg0), inorganic Hg (Hg22+ and Hg2+), and organic Hg (methylmercury CH3Hg+ and ethylmercury CH3CH2Hg+) substances, and so on. The toxicity of Hg varies along with its form. Under the action of microorganisms, the inorganic Hg (Hg2+) in the environment can be converted into more toxic organic Hg [5]. Among all forms of Hg, CH3Hg+ has the highest toxicity and can be accumulated in the body and concentrated in the food chain. If the content of CH3Hg+ in human blood exceeds 0.2 μg·g−1, symptoms of poisoning occur. The toxicity of CH3CH2Hg+ is lower than that of CH3Hg+ yet higher than that of inorganic Hg. Both CH3Hg+ and CH3CH2Hg+ are fats that are soluble and easily assimilated by organisms, followed by enrichment through the food chain and access to the human body [6]. The pathways of heavy metal pollution in medicinal plants include the following: (1) Environmental factors, such as soil, water, and atmosphere, significantly affecting the cultivation of medicinal plants in the production area; (2) active uptake and enrichment characteristics during the growth process of medicinal herbs; (3) pollution during harvesting, processing, auxiliary materials, packaging, storage, and transportation; the application of pesticides, fertilizers, and other substances containing heavy metals during the planting process [7]. Clear regulations on the total amount of Hg have been listed in the quality standards of TCM, but the toxicity of Hg depends not only on the total amount but also on its chemical form. Therefore, to comprehend the risks posed by heavy metals in TCM to human health, we need to understand both the accumulation of Hg as well as the form and distribution of Hg in TCM.

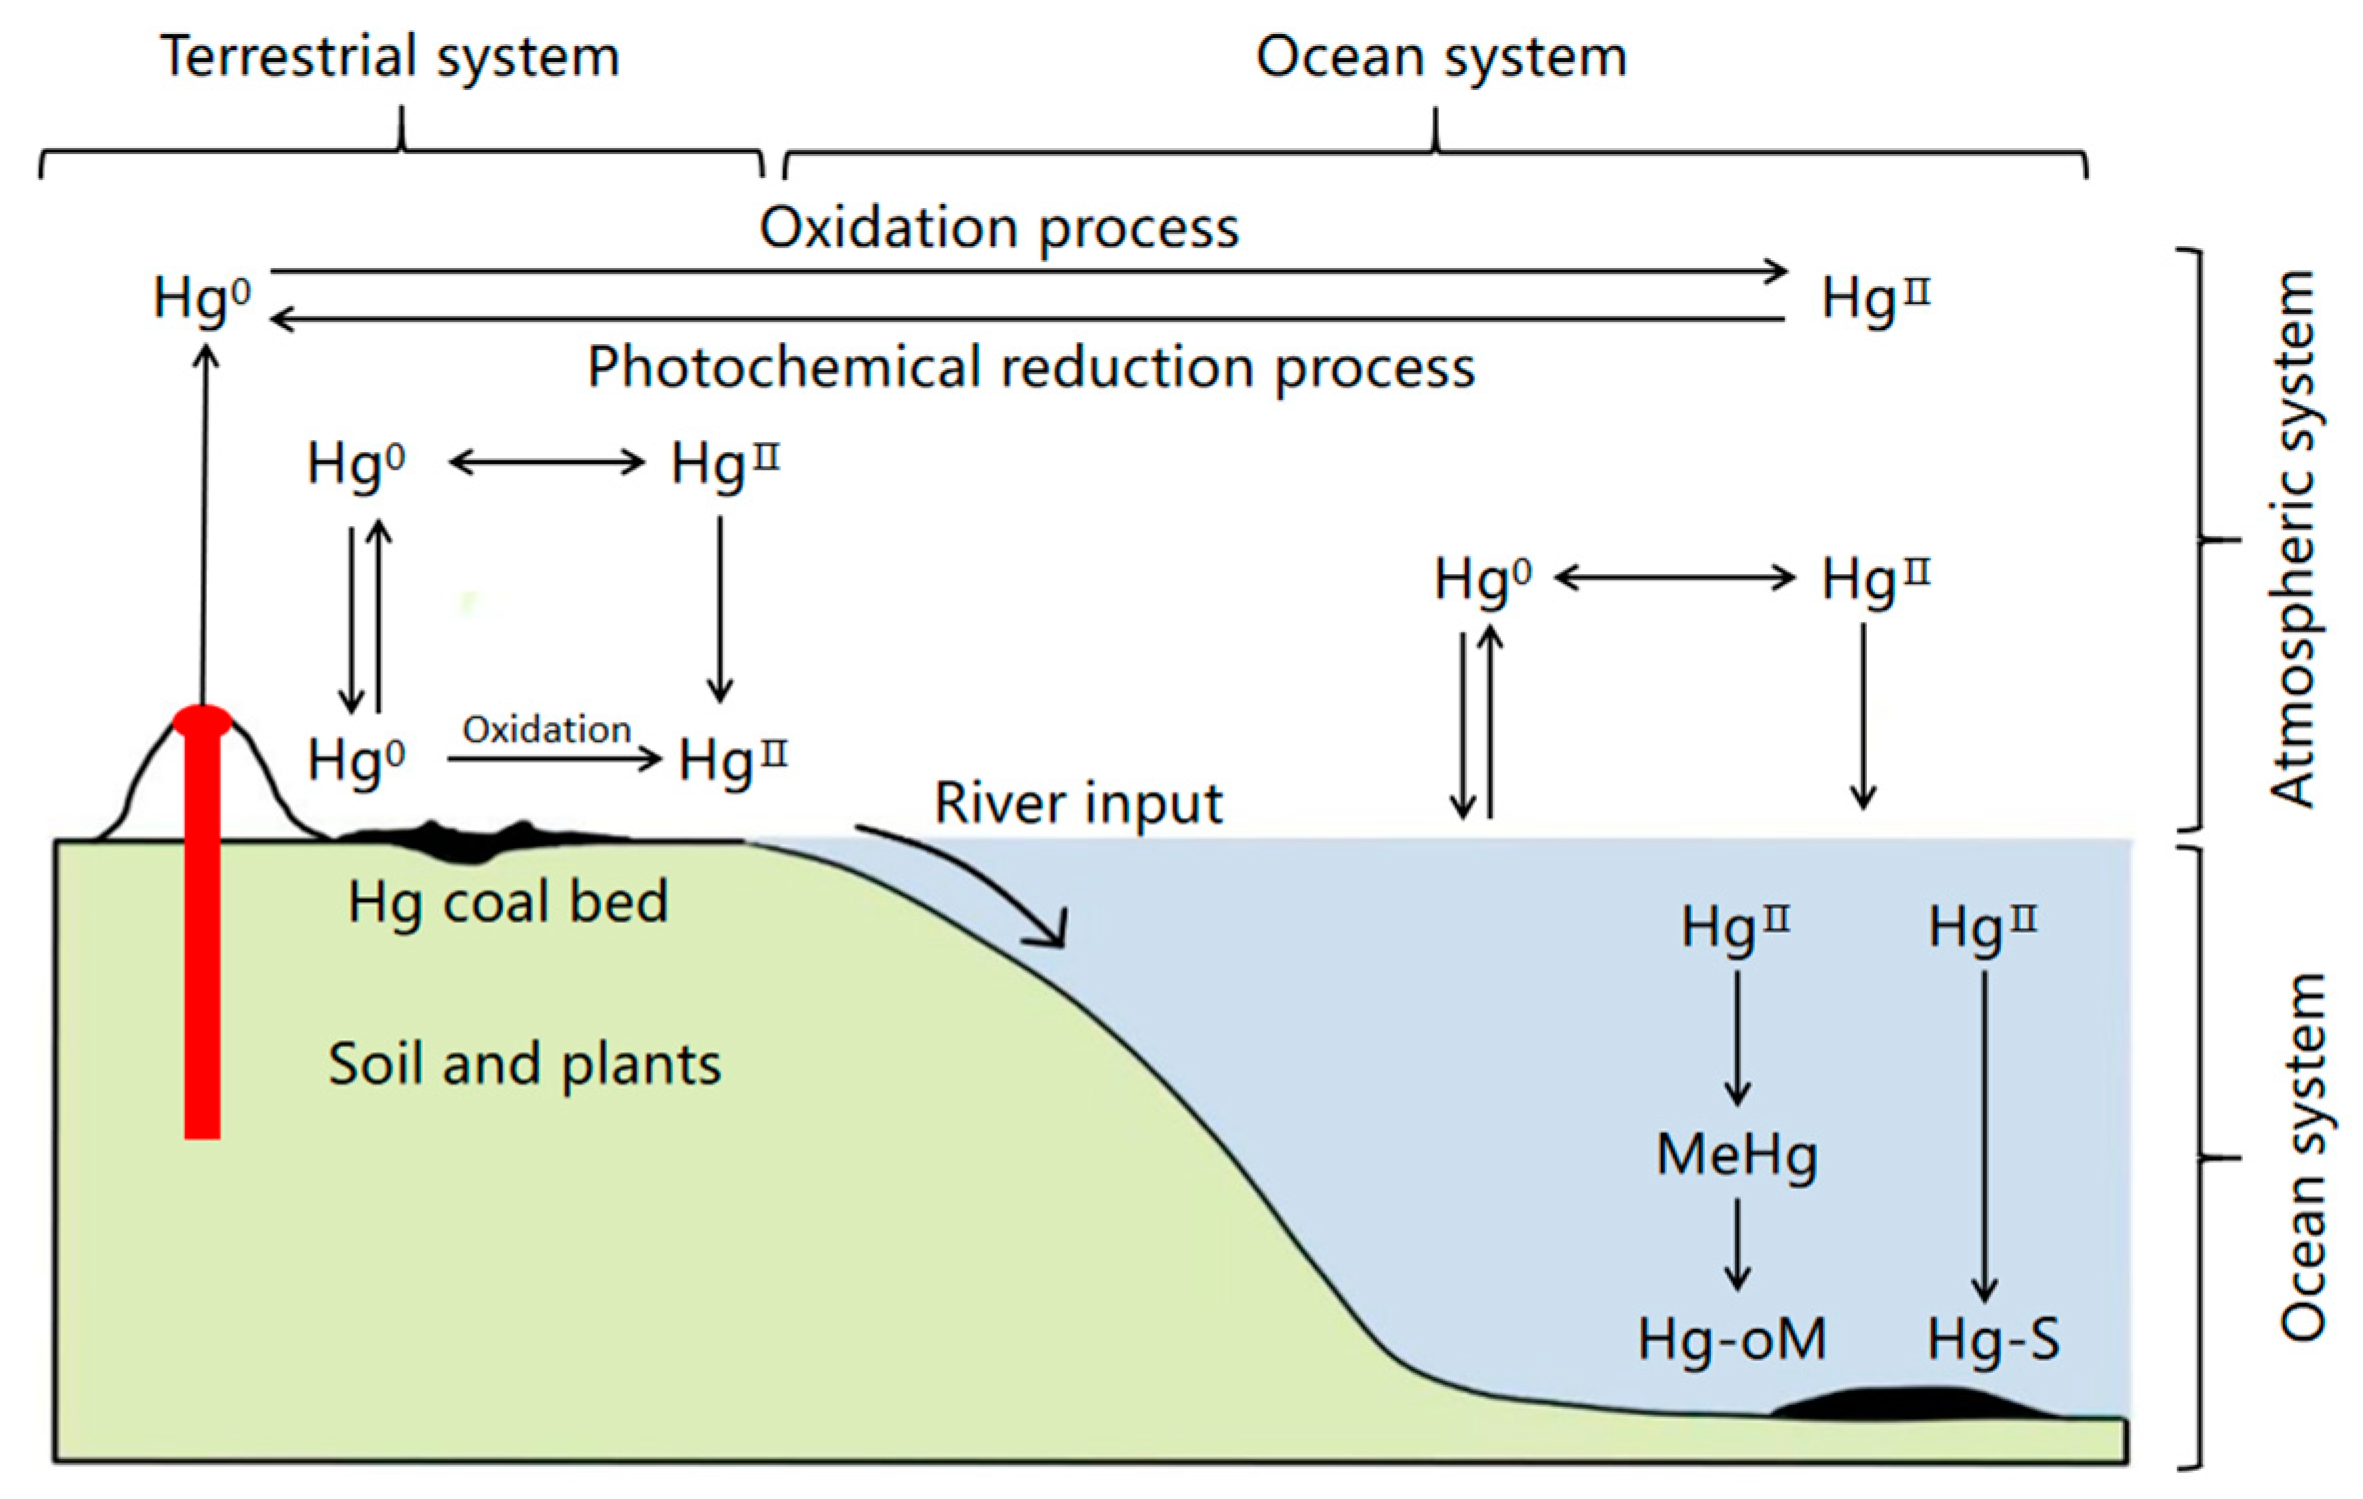
2. Sources of Mercury

East and Southeast Asia are the regions with the highest atmospheric Hg emissions in the world, and their emissions account for approximately 39.7% of total emissions. Asia is the region with the highest Hg emissions globally, and its emissions account for 31.8% of total emissions [8]. China is a major producer, consumer, and emitter of Hg. Currently, the total quantity of Hg mine resources in China is about 81,400 tons, and China is the third largest Hg-producing country in the world. Therefore, one of the top two countries is still engaged in industrial Hg mining in the world (the other country is Kyrgyzstan). Moreover, China is also a major producer and consumer of coal globally [9]. The annual Hg consumption in China exceeds 1000 tons, accounting for around 50% of that in the world [10]. Therefore, soil, water, and air in some regions of China suffer from serious Hg pollution. Hg pollution is principally caused by humans, mainly originating from the use of Hg and Hg-containing wastewater, exhaust gas, and waste residue discharged from factories of Hg and its compounds. The wastewater discharged from the chlor–alkali industry, plastic industry, electronics industry, gold-refining with amalgam, and Hg fulminate production is the main source of Hg pollution in water bodies. The application of Hg-containing pesticides and sludge fertilizers is the main source of Hg pollution in soil, whereas Hg-containing smelting waste gas is the main source of atmospheric Hg pollution. Moreover, during the combustion process of coal and oil, Hg-containing waste gas and particulate Hg dust are also emitted, which is a major source of pollution. Pollutants from these sources are transported by wind and continuously fall into the ground, which are finally transferred to the water body through rainfall runoff. The biogeochemical recycling process of Hg in the atmosphere and soil is illustrated in Figure 1 [11]. In Hg pollution regions in China, such as the Wanshan area in Guizhou, some water bodies, soil, and crops are severely polluted by Hg. The total Hg content in the surrounding soil of the working area for the Hg-involving industry is as high as 0.33–790 mg·kg−1, and the CH3Hg+ content is in the range of 0.19–20 μg·kg−1 [12].

3. Hg in TCM

3.1. Heavy Metal Hg Pollution in Different Medicinal Parts of TCM

Chinese medicinal herbs can be categorized into 10 groups based on their medicinal parts, including roots, rhizomes, flowers, leaves, whole herbs, and so on. Based on previous studies, the distribution of heavy metals varies in different parts of plants. Specific distribution data are presented in Table 1 [13].
Table 1 shows that the ratio of animal medicinal materials polluted by Hg is the highest, followed by leaf and flower medicinal materials. The root and rhizome, whole grass, fruit and seed, and stem and tree medicinal materials are also polluted by Hg to a certain degree. These different ratios can be explained as follows: animals are more susceptible to the accumulation of heavy metals due to their higher positions in the food chain, resulting in a higher pollution ratio. The leaves of plants, as uptake organs, are exposed for a longer time, which is an important reason for their excessive levels of heavy metals.

3.2. Chemical Forms of Hg in Medicinal Herbs

During the growth of TCM, Hg in nature accumulates in plants. Some recent studies have shown that heavy metals have increasingly polluted TCM, and pollution in roots and rhizomes, as well as whole grass, is relatively higher [14,15].
Shan Meng et al. established a method to determine inorganic Hg, CH3Hg+, and CH3CH2Hg+ in TCM using high-performance liquid chromatography–inductively coupled plasma mass spectrometry (HPLC-ICP-MS). The contents of three forms of Hg compounds in 6 types and 106 batches of roots and rhizomes used in Chinese medicine were measured. No CH3Hg+ or CH3CH2Hg+ was detected in all these samples. The contents of these three forms of Hg compounds in TCM could be accurately and efficiently determined by this approach. Data on the chemical state of Hg in these six types of Chinese herbal medicine are presented in Table 2 [16].
Hao Liu from Jilin Agricultural University established an HPLC-ICP-MS-based analysis method to determine residual Hg with different forms in 31 animal drugs, of which 87 batches contained 2.39–6567 μg·kg−1 inorganic Hg. Among these, the contents of inorganic Hg in geckos, cicada slough, earthworms, zombie silkworms, and deer antlers were the highest and exceeded 1000 μg·kg−1. Moreover, 2.83–319.7 μg·kg−1 CH3Hg+ was detected in 33 batches of 12 animal drugs. The content of CH3Hg+ was relatively high in Agkistrodon acutus, little multibanded krait, centipede, and Zaocys dhumnades. CH3CH2Hg+ was not detected in any of the samples. Among the 12 animal medicinal herbs, buffalo horn has heat-clearing and detoxifying effects. It can be used to treat dry mouth, thirst, rashes, sore throats, and other diseases caused by epidemic febrile disease. Scorpio is used to treat spasms, convulsions, stroke, mouth and eye deviation, and hemiplegia. Pheretima is used to clean the main and collateral channels and to treat symptoms such as numbness, pain, and poor flexion and extension of limbs and joints. Earthworms are also used to clean the lungs, relieve asthma, and treat urinary obstruction. The giant gecko is used to enhance immunity. It has anti-inflammatory, anti-aging, anti-allergic, hypoglycemic, spasmolytic, and asthma-relieving effects. The therapeutic effect of reptile phrynosoma on chronic cough is also excellent. Chilopoda is used to treat the spasms and convulsions caused by facial paralysis, acute infantile and chronic convulsions, tetanus, epilepsy, and other diseases. It is used to treat venomous snake bites. In clinical practice, it is also used to treat cervical headaches, shoulder periarthritis, lumbar disc herniation, knee osteoarthritis, and other diseases. Hirudo, as a medicine, promotes blood circulation and also stops bleeding. It promotes the regeneration of bone, reduces swelling, prevents blood clots, and has a detoxification effect. In addition, it has a significant anesthetic effect and can reduce the sensitivity of the human body to pain. Therefore, Hirudo is used for anesthesia in clinical local trauma treatment. Z. dhumnades has wind-expelling and convulsion-relieving effects and is used to treat convulsions, spasms, and other symptoms in children. The hippocampus has kidney-tonifying, Yang-nourishing, and nerve-protecting effects. The extract of the hippocampus has a strong blocking effect on calcium-ion channels. Therefore, it is generally used in clinical practice to block the influx of calcium ions and to protect neurons. Gecko has heat-clearing and detoxifying effects and is used to treat high fever, thirst, throat pain, and so on. It also promotes blood circulation and removes blood stasis to mitigate symptoms caused by stasis. A. acutus has wind-expelling, channel-cleaning, and convulsion-relieving effects. Syngnathus has kidney-tonifying, Yang-nourishing, mass-eliminating, and swelling-reducing functions. Bungarus parvus, as a medicine, has muscle-strengthening, anti-fatigue, stomach-nourishing, saliva-secretion-promoting, Qi-tonifying, blood-nourishing, hypoxia-resisting, immunity-enhancing, and protein-synthesis-promoting effects [17]. Data on the chemical state of Hg in 31 animal drugs are presented in Table 3 [18].

3.3. Chemical Forms of Hg in Chinese Patent Drugs

Cinnabaris is a common mineral in TCM, with HgS as its principal component. According to the 2010 edition of the Chinese Pharmacopoeia, about 10% of Chinese patent drugs contain Cinnabaris. Its principal component, HgS, occasionally causes poisoning events. The toxicity of Hg compounds depends on their chemical forms and concentrations, and the toxicity of organic Hg is greater than that of inorganic Hg. Data on the chemical state of Hg in common Chinese patent drugs are listed in Table 4.

4. Analysis Methods for the Chemical Forms of Hg

Common techniques for determining the Hg element include atomic absorption spectroscopy (AAS), atomic fluorescence spectroscopy (AFS), inductively coupled plasma atomic emission spectrometry (ICP-AES), and inductively coupled plasma mass spectrometry (ICP-MS). ICP-MS, equipped with a mass spectrometer and an extremely low detection limit, can determine isotopes and multiple ultra-trace elements simultaneously compared with ICP-AES [23]. The methods for determining heavy metals recorded in the Chinese Pharmacopoeia include atomic absorption spectrophotometry and ICP-MS. In the 2020 edition of the Chinese Pharmacopoeia, the general rule “2322. Determination of the Forms and Valence States of Mercury and Arsenic Elements” has been upgraded. The determination method for the chemical state of As and Hg in this general rule is HPLC-ICP-MS with high selectivity, good identification ability, and high maturity.

4.1. Sample Pretreatment Techniques

Traditional Hg extraction methods substantially include extraction with acid, digestion with alkali, distillation, microwave-assisted extraction, ultrasound-assisted extraction, and other pretreatment methods. The various pretreatment techniques for the analysis of the chemical state of Hg are depicted in Table 5.

4.2. Determination Methods

4.2.1. Atomic Absorption Spectroscopy

AAS has the merits of high sensitivity, high selectivity, high accuracy, widespread application, and so on, with a lower detection limit of 1 ng·mL−1. Therefore, it is particularly suitable for analyzing a small amount or trace number of elements. AAS cannot be used to determine multiple elements at the same time, and the pretreatment of samples is a stringent requirement. In addition, only the total quantity of an element can be measured without analyzing the elemental state. Yamin Ma et al. measured the content of Hg in licorice using AAS. A certain amount of standard Hg solution was accurately withdrawn, and 0.1 mol·L−1 of sulfuric acid was added to derive 1 μL·mL−1 of the dilute Hg solution. Then, 0.00, 0.25, 0.50, 0.75, and 1.00 mL of the dilute Hg solution were separately withdrawn and placed in 25 mL volumetric flasks. Subsequently, 10 mL of 0.1 mol·L−1 sulfuric acid solution and 5 mL of 5% potassium permanganate solution were added to these flasks. After maintaining its purple color for 20 min, 20% hydroxylamine hydrochloride solution was added until the purple color disappeared. Then, 0.5 mL of nitric acid and deionized water was added until the volume reached its set value. After thorough mixing, standard Hg solutions with concentrations of 0.00, 0.01, 0.02, 0.03, and 0.04 μg·mL−1 were obtained. Under the aforementioned measurement conditions, the absorbance was correlated with the concentration of Hg to obtain the regression equation: y = −5.772 + 292.67x; r = 0.9992. The fit line exhibited good linearity in the range of 0–0.04 μg·g−1, with a recovery rate of 95.4% from a spiked sample [30].

4.2.2. Inductively Coupled Plasma Atomic Emission Spectrometry

ICP-AES has advantages in terms of high sensitivity and rapid measurement procedures, while small and trace amounts of elements can be simultaneously determined. ICP-AES has a wide linear range, low detection limit, high analysis precision, and rapid measurement procedures. These exceptional comprehensive advantages make ICP-AES a useful tool when analyzing small amounts of elements in TCM. The application of ICP-AES in the analysis of chemical forms of Hg in TCM is depicted in Table 6.

4.2.3. High-Performance Liquid Chromatography–Inductively Coupled Plasma Mass Spectrometry

ICP-MS has been selected as the detector for chromatographic separation by many scholars due to its virtues, such as the specific detection of elements, high resistance to the complex matrix of real samples, extremely low detection limits, and a wide linear ranges. HPLC is an effective tool for the analysis of the chemical forms of elements. The coupling of HPLC and ICP-MS combines characteristics for the efficient separation of HPLC with the advantages of ICP-MS, such as element specificity, a low detection limit, and wide linear range. It has the characteristics of high sensitivity and high precision. However, because the flow rate of the HPLC mobile phase matches with the sample-injecting flow rate of common ICP atomizers and because both the post-column outflow of HPLC and sample injection of ICP-MS is carried out at an ambient pressure, the interface between HPLC and ICP-MS is easy to match. Moreover, the HPLC effluent can be easily introduced in various modes, promoting the rapid development of determining the chemical state of metals/nonmetals. The applications of HPLC-ICP-MS in the analysis of the chemical state of Hg in TCM are tabulated in Table 7.

4.2.4. Liquid Chromatography-Coupled AFS

Liquid chromatography-coupled AFS (LC-AFS) has the advantages of fast analysis, high separation efficiency, low sample consumption, fast simultaneous analysis of multiple elements, a low detection limit, wide dynamic range, the suitability for large-scale repetitive work, simple supporting equipment, and high reliability. Nevertheless, LC-AFS has its drawbacks. Its application scope is relatively narrow. The elemental forms of nonvolatile substances can alter, making it difficult to confirm the chemical state and composition of the original substance. Liping Lai et al. determined the content of divalent Hg in Cinnabaris using LC-AFS. Hg compounds were extracted with an ultrasound, and an LC-AFS6500 was employed. The chromatographic conditions were as follows: Angel C18 chromatographic column (5 μm, 150 × 4.6 mm2); mobile phase: methanol–0.04 mol·L−1 ammonium acetate (containing 0.1% L-cysteine) (3:97); flow rate: 1.0 mL·min−1; column temperature: 40 °C; carrier gas: argon; carrier gas flow rate: 500 mL·min−1; shielding gas flow rate: 1000 mL·min−1; carrier solution: hydrochloric acid solution (1 + 9); reducing agent: 2 g·L−1 potassium borohydride solution; detector: Hg lamp (main current = 30 mA); negative high voltage = 340 V; injection volume: 100 μL; lower detection limit: 0.5 ng·mL−1; and average spiked recovery rate: 90.89% [38]. Linlin Hu et al. determined the Hg contents in eight Chinese medicinal herbs using LC-AFS. The samples were pretreated using four different methods: electric-plate digestion, microwave digestion, Kjeldahl digestion, and water-bath digestion. A C18 column (150 × 4.6 mm2, 5 μm) was taken as the chromatography column for Hg analysis. The instrument conditions for determining the Hg element were as follows: total lamp current: 30 mA; auxiliary lamp current: 0 mA; negative high voltage: 300 V; carrier gas flow rate: 400 mL·min−1; and atomizer height: 10 mm. Gradient elution was conducted using a solution containing 5% methanol, 0.06 mol·L−1 ammonium acetate, and 0.1% L-cysteine with a flow rate of 1.0 mL·min−1. The lower detection limit of Hg was 0.001 mg·kg−1, and the recovery rates of Hg in different Chinese medicinal materials reached 84.7–95.5% [39].

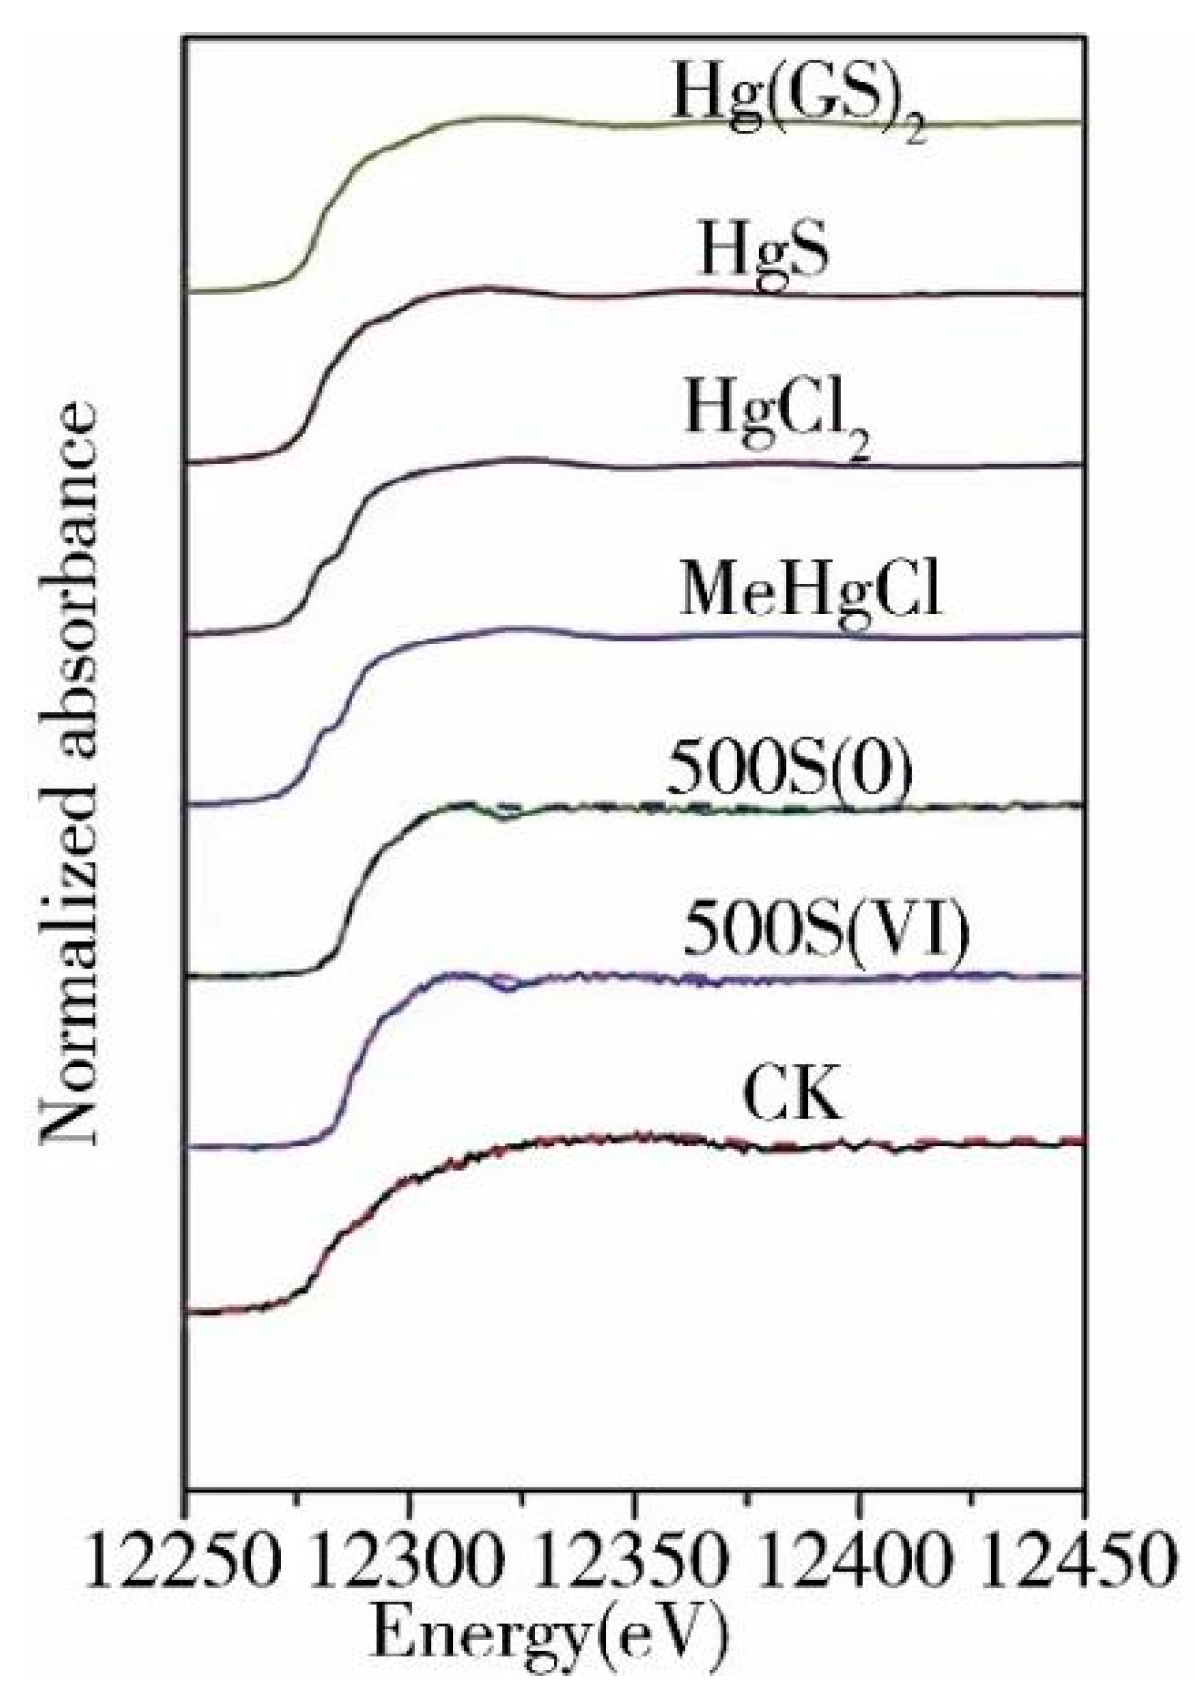
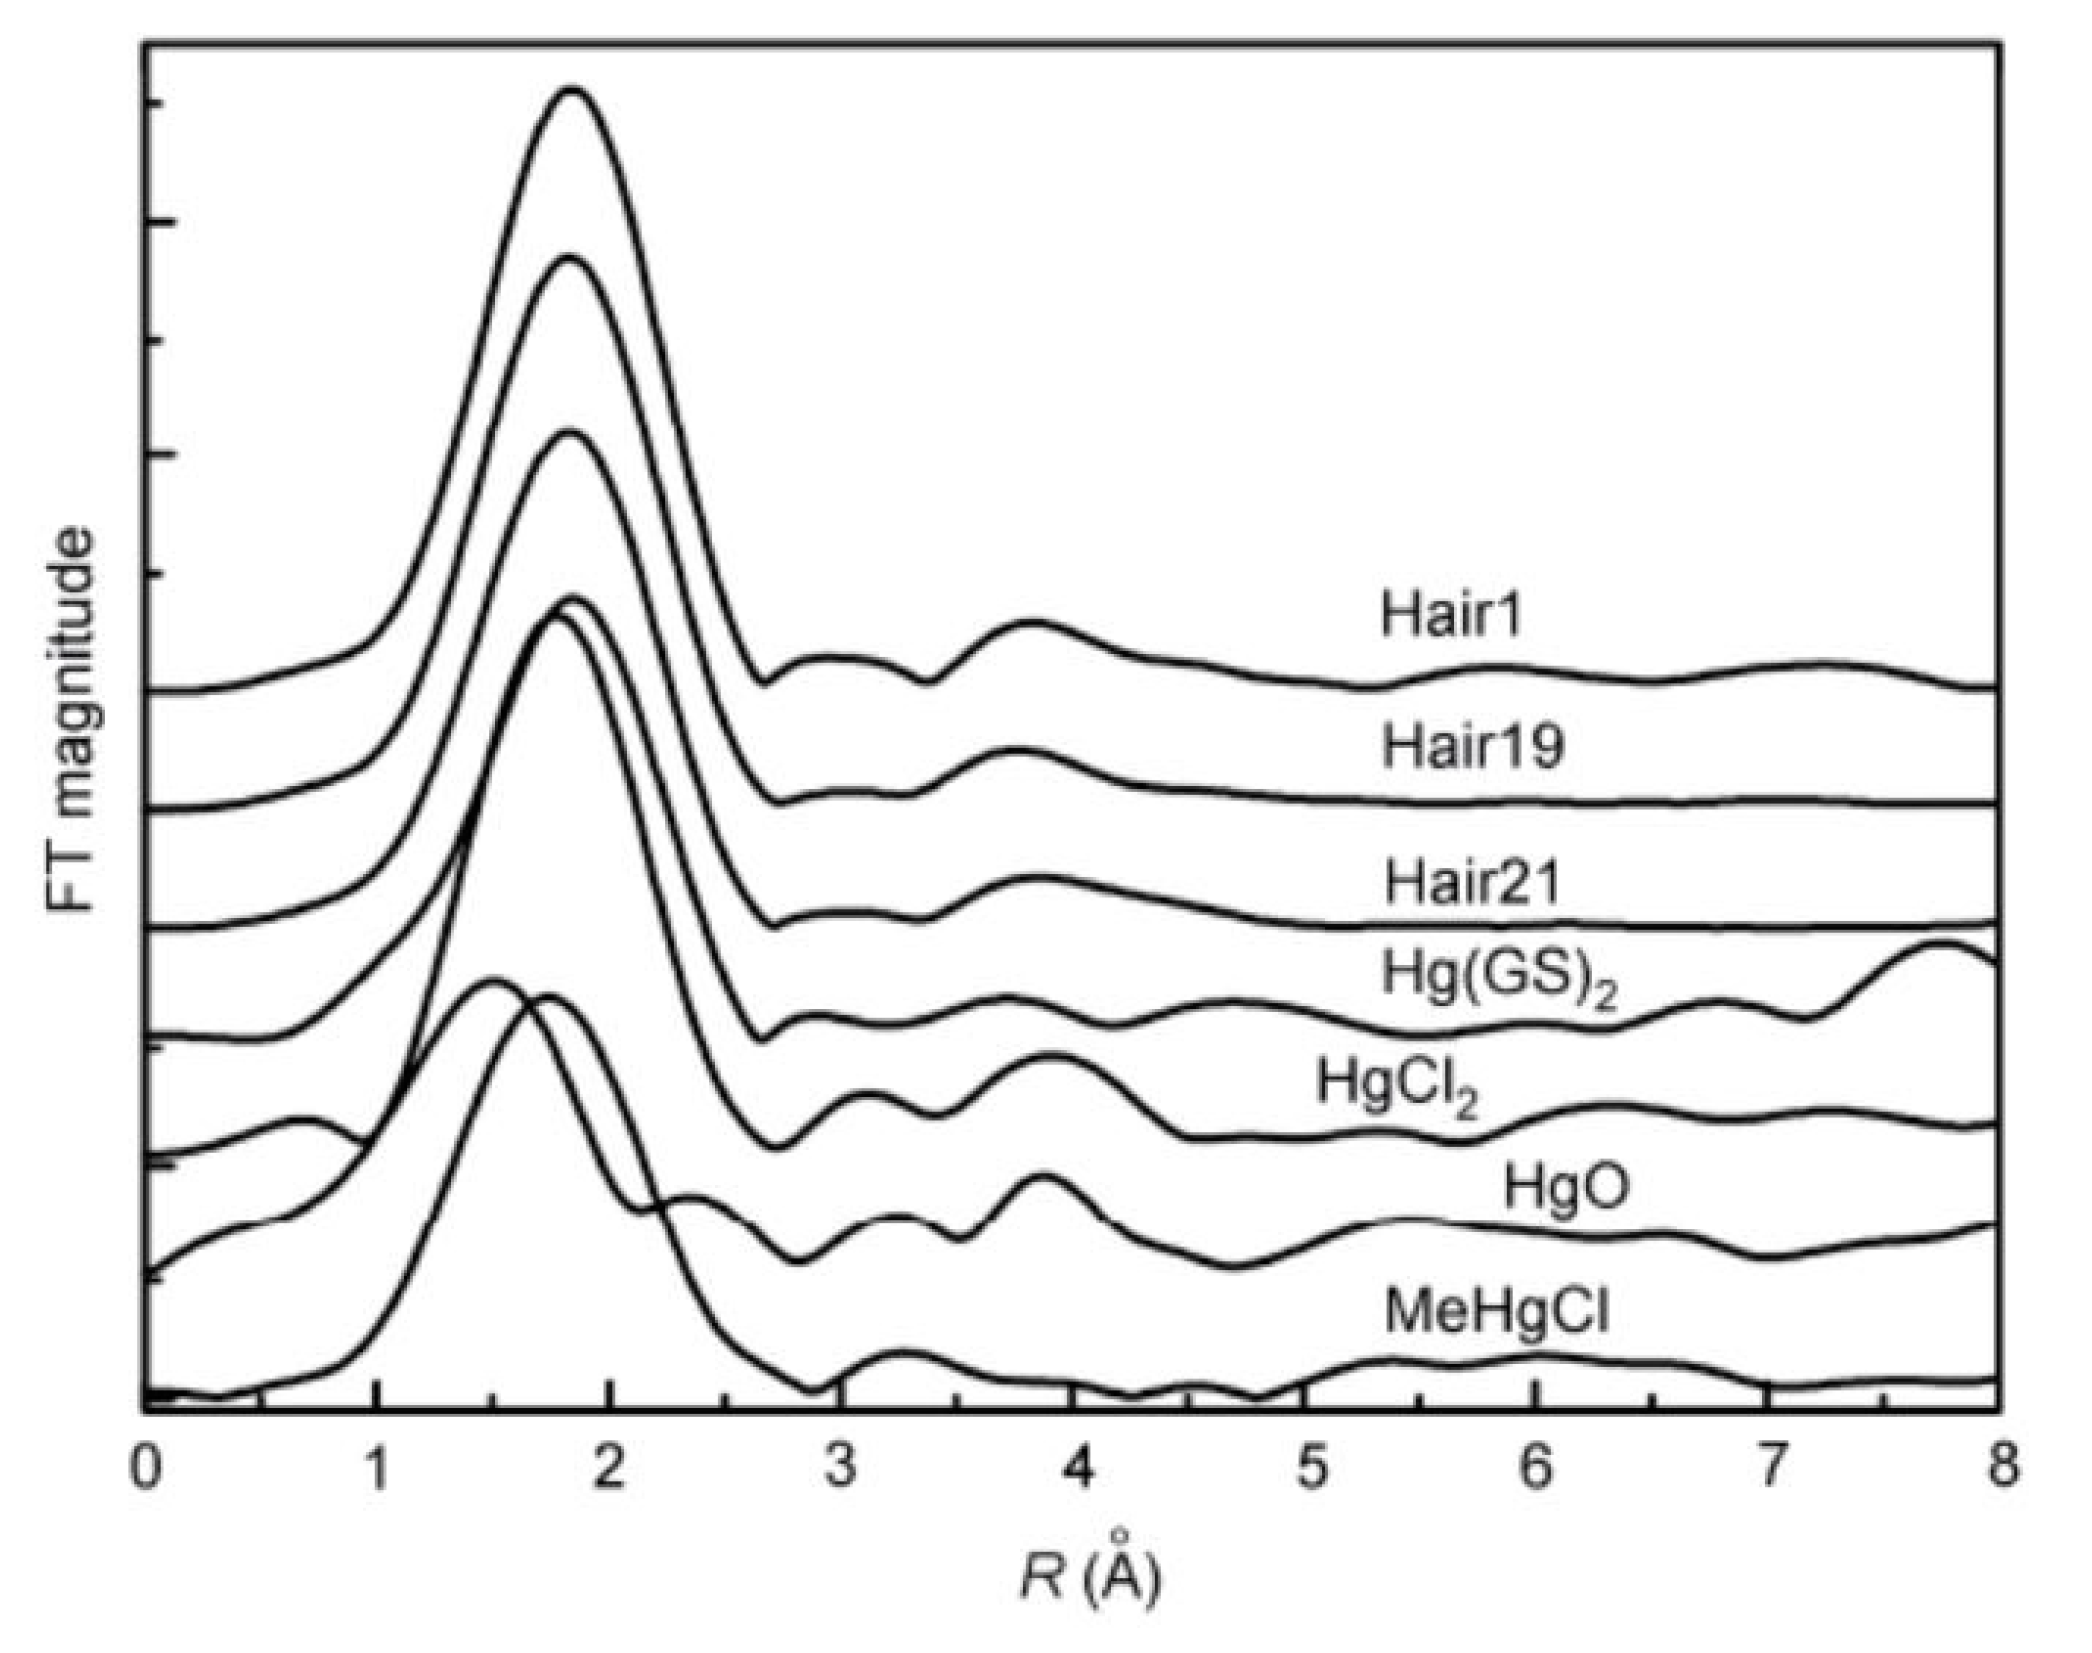
4.3. Study on the Chemical Forms of Hg Using Synchrotron Radiation Techniques

After years of development, synchrotron radiation (SR) technology has become an ideal tool for studying the species, composition characteristics, and transformation processes of metal elements [40].
Energy-tunable X-rays are used by X-ray absorption fine structure spectroscopy (XAFS) to excite inner-layer electrons bound by a target atom to obtain a relevant spectrum. This technique requires SR equipment to generate intense and energy-tunable X-rays. The in situ analysis of the chemical form of Hg in samples can be realized by XAFS, thereby preventing a few issues, such as the transformation of the Hg form and loss of Hg during the pretreatment of a sample. An XAFS spectrum is divided into an X-ray near-edge absorption spectrum (XANES) and an X-ray-extended fine structure spectrum (EXAFS). XANES has been frequently used in studies on Hg pollution. Information on Hg’s metabolic product structure can be determined by probing the atomic redox state, local microenvironment, ligand electronegativity, and other information [41,42]. Using EXAFS, structural information, such as the bond length and coordination number, can be obtained without the preparation of crystal samples [43]. Therefore, both technologies are very suitable for the analysis of the chemical state of Hg in environmental samples. The energy needed to excite the K-layer electrons of the Hg element is up to 83.10 keV, and only a few third-generation SR light sources meet this requirement. Therefore, the L-layer electrons (L1, L2, and L3 absorbing edge energies = 14.84, 14.21, and 12.28 keV, respectively) of the Hg element are usually excited for analysis. Combining the advantages of SR X-ray technology and the comprehensive application of other analytical methods, the trace amount of Hg in the environmental media and animal and plant tissues can be effectively determined. Michael et al. investigated the methylation of Hg in the water hyacinth using XANES. They found that 5% Hg existed in the form of CH3Hg+, similar to CH3Hg+ cysteine, in living aerobic plants [44]. Laura et al. determined the form of Hg in the bark of Pinus nigra in Monte Amita using XANES [45]. Carrascogil et al. conducted SR-XRF imaging analysis on the roots of wild alfalfa plants exposed to Hg. They reported that Hg was substantially distributed in the root tips and vessel tissues of alfalfa. Their study using EXAFS indicates that Hg exists in plant tissues substantially in the form of mercaptides or protein complexes [46].
The basic principle of XAFS is to measure the absorption coefficients of a sample at different characteristic wavelengths with varied X-ray energies to obtain the corresponding absorption spectrum, which is related to the chemical form of an element. In light of the significant difference in the XANES spectra for different forms of Hg, the in situ analysis of forms of Hg in complex environmental media is implemented with the absorption spectrum, and the proportions of various forms of compounds in the sample can be quantified. As shown in Figure 2, Li et al. conducted SR-XAS analysis on Hg-contaminated soil and sulfur-added Hg-contaminated soil and reported that Hg in the control group (sulfur-free) was substantially present in the form of glutathione mercury [Hg(GS)2] (77%), followed by HgS (around 12%) and Hg2+ (around 10%). After the addition of sulfate and elemental sulfur, the Hg(GS)2 content in the soil decreased by about 10% and 23%, respectively, while the HgS content increased by about 11% and 23%, respectively [47]. Yufeng Li et al. adopted XAS technology to study the chemical state of Hg in the hair of people exposed to Hg for a long time in the Wanshan Hg mining region (Figure 3). Based on the comparison of the spectra of the hair sample and standard as well as the fit result of the compound with the least squares method, inorganic Hg was found to be the dominant compound in the hair and accounted for approximately 91.7% of total Hg [48].
The SR-XRF technique involves an SR X-ray source as the excitation source. It is developed into a comprehensive multielement simultaneous analysis technique by which in situ, nondestructive, micro-zone, and trace analysis can be realized. After scanning the sample, the spatial distribution information of elements in tissue or organ slices at the micrometer scale is obtained. An SR X-ray has the characteristics of high intensity, high collimation, a wide energy range, and so on [49]. The diameter of the incident X-ray spot is narrowed to a nanometer scale using modern X-ray optical technology, and the photon flux at this spot exceeds 1012 phs·s−1. These characteristics significantly improve the spatial resolution (nanometer scale) and analytical sensitivity (10−18 g) of SR analysis technology, endowing SR-XRF with a unique micro-zone scanning ability. Based on this ability, the two-dimensional distribution information of trace elements can be obtained to study the micro-zone distribution of trace elements in biological samples, such as tissues, using this technology. Zhao et al. explored the regulation mechanism of selenium, a Hg antagonist, for the uptake and accumulation of inorganic Hg and CH3Hg+ in Oryza sativa L. They studied the effects of selenium on the content and transport of Hg in Oryza sativa L. when cultured both in water and soil. Researchers have used micro-SR-XRF technology to understand how the presence of selenium affects the distribution of Hg within rice plants in Hg-polluted soil. They conducted a study to investigate the distribution of two elements, selenium and Hg, in different parts of rice plants, such as the roots, leaves, and seeds. Figure 4 visually represents the distribution and accumulation of Hg and selenium in rice plants. The color scale in the figure, ranging from blue to red, corresponds to the normalized X-ray fluorescence spectrum intensity, with blue indicating the lowest content and red indicating the highest [50]. Korbas et al. studied the distribution of Hg and Se in the occipital lobe of the brain in humans exposed to CH3Hg+ using XRF. The X-ray fluorescence imaging results are shown in Figure 5. The majority of Hg and Se are collocated in the gray matter, with lower levels of Se and almost negligible Hg in the white matter. The accumulation of Hg in the gray matter suggests that Hg might directly interact with neuronal cells and cause nerve damage because neuronal cell bodies and dendrites in the brain and spinal cord are concentrated in the gray matter [51].

4.3.1. Chemical Forms of Hg in Environmental Samples

Soil is both a sink and a source of Hg, and it plays an essential role in the biogeochemical cycle of Hg. Hg in the soil is subject to adsorption, complexation, and precipitation reactions with soil components to generate different chemical forms of Hg with varied stability. Currently, the extraction methods for the different forms of Hg in the soil include continuous extraction and pyrolysis [52]. Zhengduo Bao et al. analyzed the forms of Hg in the paddy soil of the Wanshan Hg mining region in Guizhou via a continuous chemical extraction method. They found that Hg was principally in a residual form in the soil (79.65%), followed by an organic form (19.97%). The other forms of Hg only accounted for 0.38%, indicating that the ratio of biologically available forms of Hg in the paddy soil was low. However, the chemical continuous extraction method has the disadvantage of possible state transformation during the chemical extraction process, including an inability to distinguish non-specific-binding Hg forms, the poor comparability of results between different extraction methods, an inability to learn the chemical form of Hg, and so on [53]. Bernaus et al. studied the slag acquired from the Almaden Hg mining area in Spain using XAS and reported that cinnabar (HgS) was the dominant chemical form of Hg. The slag also contained other Hg compounds with greater solubility than that of cinnabar, such as schuetteite [Hg3(SO4)O2] and mercury oxide (HgO). In addition, they adopted μ-XRF to analyze the correlations between different elements in the sample. The findings revealed that Hg was linearly correlated with Cu and Ni, while Hg was not linearly correlated with Fe, Mn, Ti, Ca, Zn, and other elements, indicating that Hg compounds do not bind to the hydroxides of Fe and Mn [54,55]. Yin et al. analyzed Hg forms in the slag of the Hg mining area in Guizhou of Wanshan using XAS. They reported that black cinnabar, cinnabar, and mercury chloride in the slag accounted for 52%, 42%, and 6% of the total Hg, respectively. Based on the comparison results to the state of Hg in Hg ore, they documented that a crystal form transition phenomenon from cinnabar to black cinnabar occurred during the smelting process of Hg ore [56].
The forms of Hg in contaminated soil are much more complex than those in Hg-contaminated slag. Terzano et al. attempted to analyze the forms of Hg in soil near a chlor-alkali plant using XAS but failed to obtain satisfactory results. Then, they adopted the micro-zone SR analysis technology. They measured the distribution of Hg in soil slices using μ-XRF (spot size = 20 μm2), and then the Hg-abundant area was analyzed using μ-XAS. According to the fit result of the X-ray absorption spectrum, the primary forms of Hg in the soil were black cinnabar, cinnabar, chlorothiomercurite (Hg3S2Cl2), and amorphous Hg (Hg-S/Cl). The latter two, Hg3S2Cl2 and Hg-S/Cl, could be more environmentally hazardous due to their relatively high solubility [57].

4.3.2. Chemical Forms of Hg in Biological Samples

In recent years, SR technology has been applied to analyze not only Hg pollution in environmental media but also Hg pollution and toxicity characteristics in organisms. The distribution and accumulation of forms of Hg in the micro-regions of biological tissue and chemical forms of Hg in micro-regions can be analyzed simultaneously using different SR X-ray techniques. The combination of this analysis technology with conventional chromatography and mass spectrometry analysis methods has significantly improved the correctness and accuracy of the biotoxicity evaluation of Hg. Jar McNear et al. found that Hg was substantially distributed in the root epidermis of onions exposed to Hg and selenium using SR-XRF and XANES techniques, while selenium was distributed in the entire root tissue. The selenium and Hg interacted mutually, and stable selenium–Hg complexes were generated in the roots [58]. Rajan et al. studied the methylation of Hg in Eichhornia crassipes under aerobic and anaerobic conditions using SR-XAS technology. The results showed that CH3Hg+ accounted for about 5% of the total Hg under aerobic conditions, but the content of CH3Hg+ increased by about 11% under anaerobic conditions, indicating that the methylation of Hg took place in E. crassipes under anaerobic conditions [41].
Hg pollution has also been detected in fish in certain regions without obvious Hg pollution points and nonpoint sources due to the long-distance migration characteristics of Hg [59,60]. Research results have indicated that CH3Hg+ accounts for >90% of the Hg accumulated in fish, especially carnivorous fish at the top of the aquatic food chain [61]. However, the structure of CH3Hg+ in fish is still unclear. For the first time, Harris et al. studied the forms of Hg in the muscles of commercially available sea fish (swordfish) using XAS [62]. According to the XANES spectra of Hg compounds in the muscle and various artificial CH3Hg+ compounds, they suggested that Hg compounds were mainly composed of the CH3Hg+–cysteine complex [CH3HgS(Cys)]. George et al. [63] studied the primary chemical forms of Hg in the flesh of pygmy sperm whales and swordfish. They found that their XANES spectra were consistent, indicating that the dominant chemical form of Hg in the flesh of pygmy sperm whales was also CH3HgS(Cys).

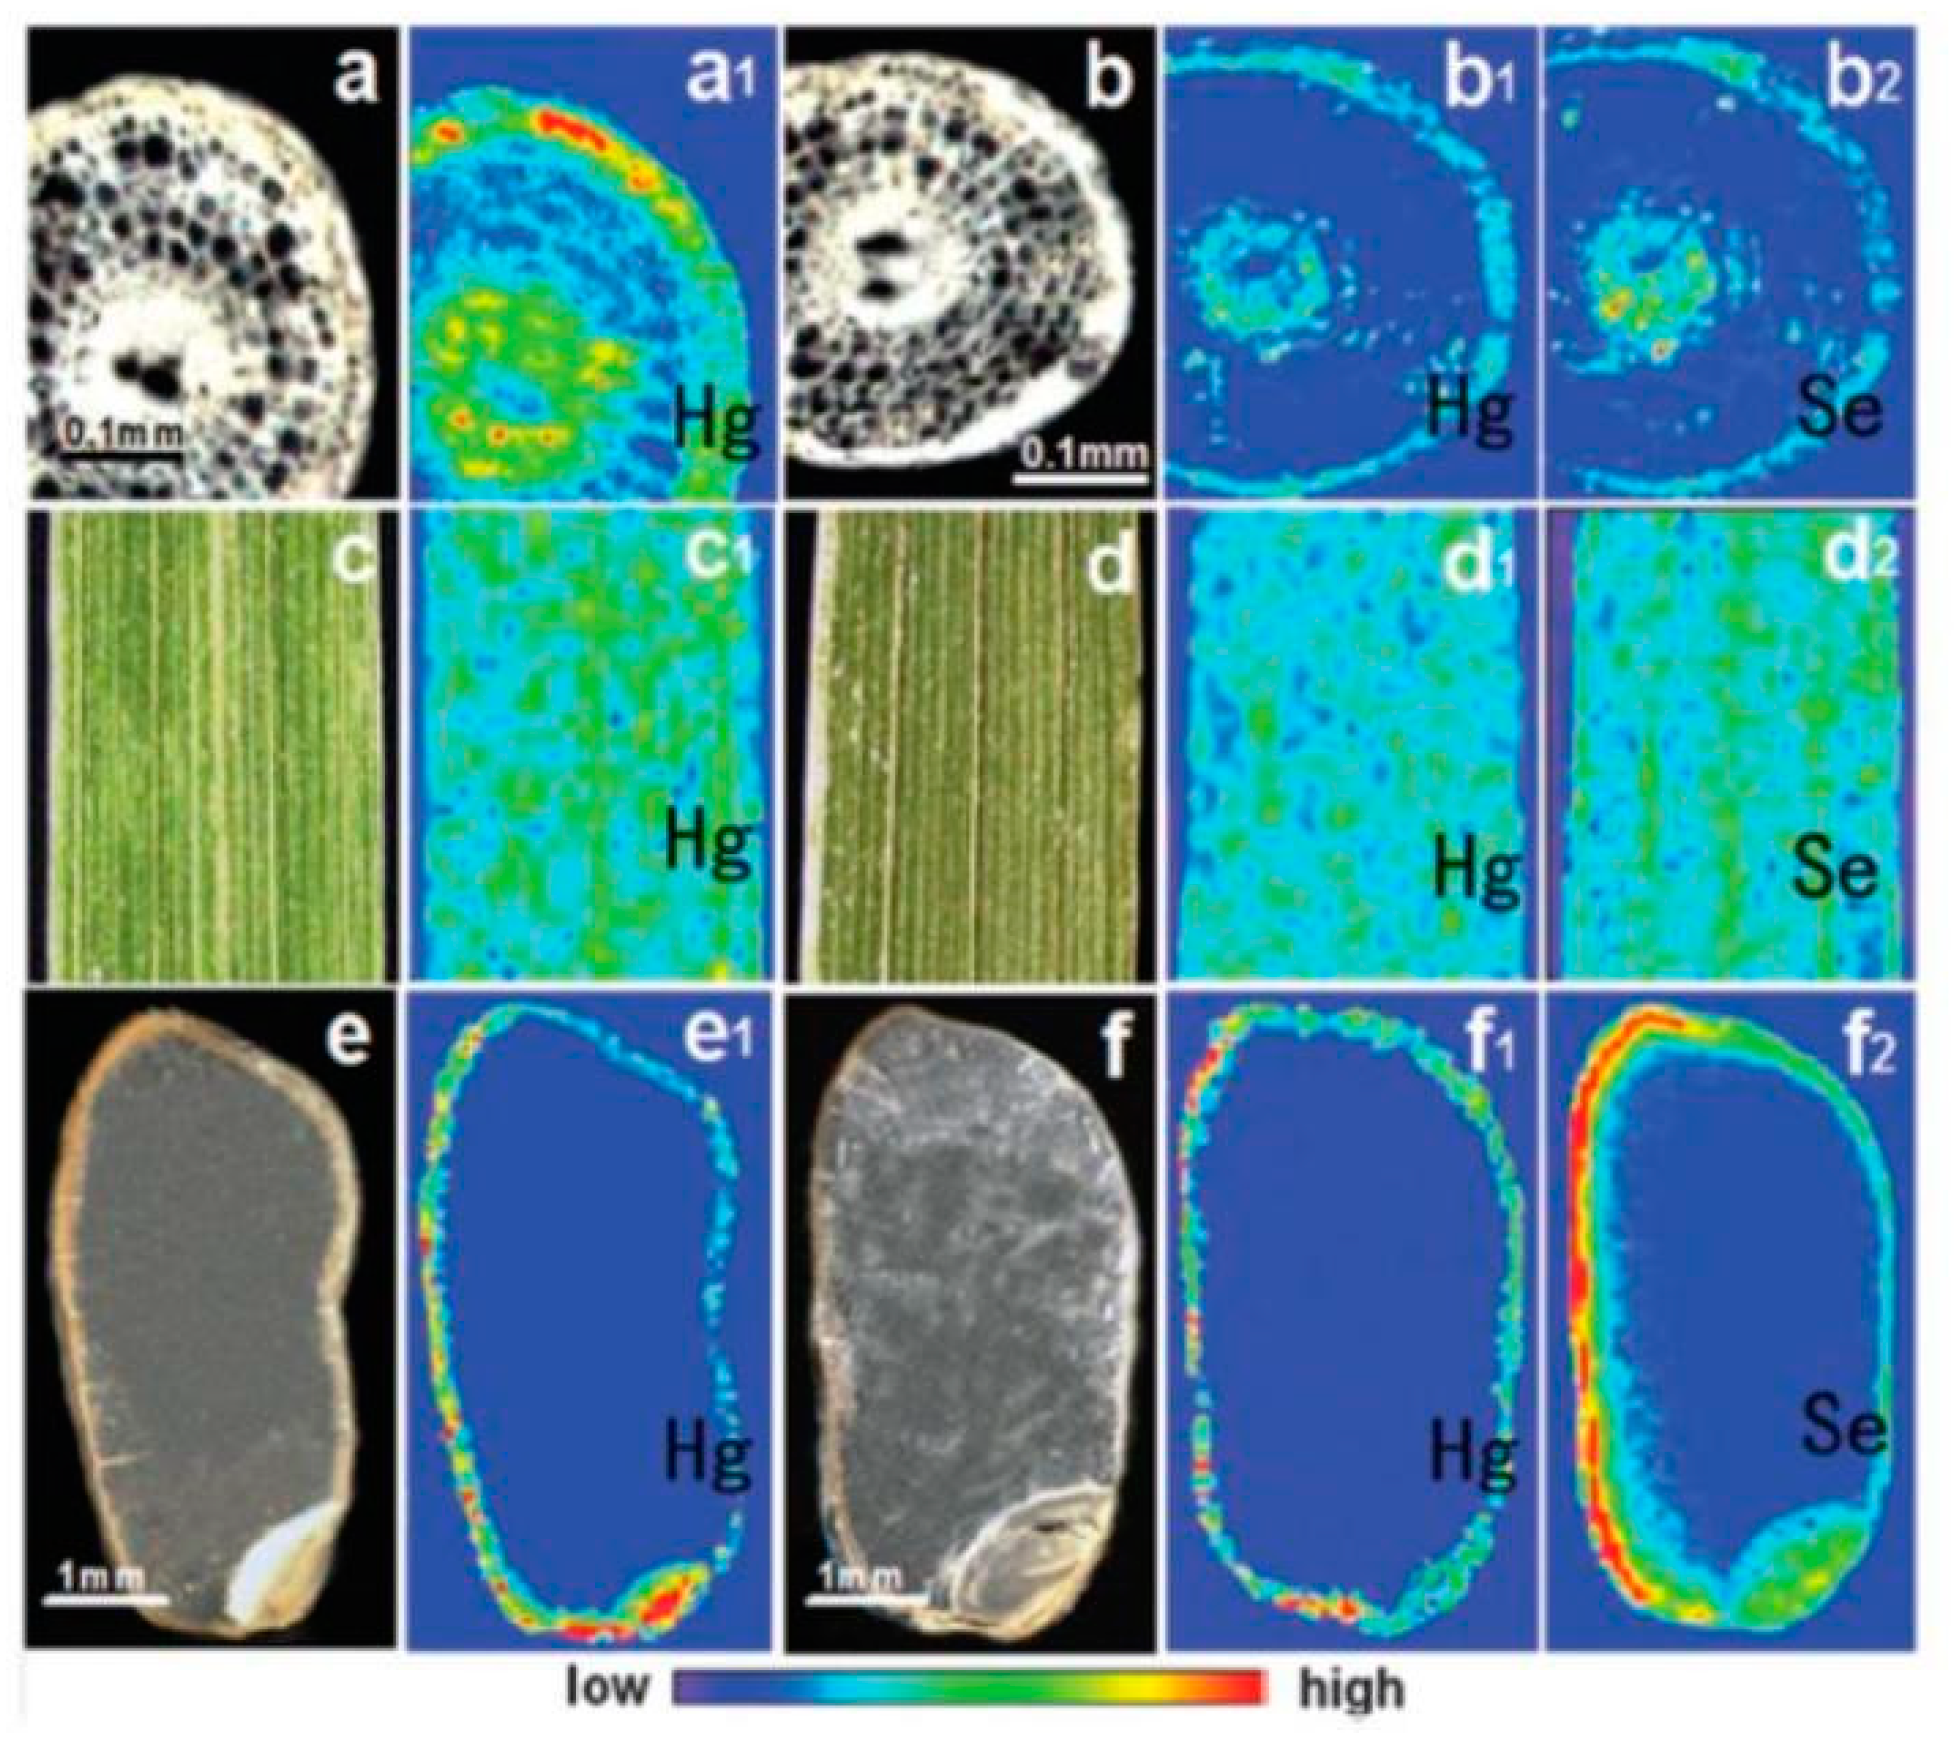
4.3.3. Research on the Distribution and Transformation of Hg Using the SR Technology

Different Hg compounds in organisms are variedly distributed. The distributions of Hg in animals can be clarified by determining the Hg content in different organs after experimental animals are euthanized [64,65]. The distributions of Hg in a plant can be clarified by determining the Hg contents in different tissues after the isolation of tissues [66].
Korbas et al. studied the distribution of Hg in zebrafish juveniles exposed to CH3Hg+ using SR-XRF. The distribution of Hg in zebrafish can be directly analyzed in situ using this technique without the euthanasia and isolation of various organs. Hg was found to be distributed mainly in the brain, gastrointestinal tract, and especially the lens of zebrafish. Furthermore, the distributions of different forms of Hg in fish were studied. Organic Hg was principally distributed in the epithelial cells of the lens, while inorganic Hg was principally distributed in the epithelial cells of the olfactory bulb and kidneys, further proving that different forms of Hg target different organs [67,68].
Different forms of Hg undergo a transformation. For example, CH3Hg+ is principally generated from inorganic Hg by sulfate-reducing bacteria (SRB) under anaerobic conditions [69]. The demethylation of CH3Hg+ also frequently occurs in nature, and the demethylation is mainly related to Hg-resistant microbial reductase, organic-Hg lyase [70,71], and SRB [72]. Hg pollution problems have emerged in San Francisco Bay due to the influence of gold mining and industrial emissions. Two types of rice grass, Spartina foliosa, and Spartina alterniflora-hybrid, are dominant plants in San Francisco Bay, indicating that both plants have special mechanisms for the uptake and transformation of Hg. Patty et al. [73] reported that the forms of Hg in the roots of rice grass cultured with HgCl2 included HgS, Hg(Cys)2, CH3HgAc, and so on, using the combination of micro-zone XAS with the least squares approach, indicating that Hg underwent a state transformation in the roots of rice grass. This confirmation of HgS in the roots indicates that the biological fixation of Hg takes place in the roots of rice grass and that this biological fixation effect can reduce the toxicity of Hg to plants.

5. Summary and Outlook

TCM is widely used in clinical practice due to its unique therapeutic effect; however, it is commonly contaminated due to environmental factors. An excess of heavy metals in TCM not only affects its effectiveness but also threatens human health when the accumulation of heavy metals is severe. Heavy metal contamination hinders the development of TCM. Therefore, the supervision of TCM needs to be strengthened, and the heavy metal content in TCM needs to be controlled so as to ensure the quality and safety of TCM. The most effective measure to reduce heavy metal pollution is the reasonable screening of planting bases. The monitoring and analysis of the soil environment and water quality of genuine TCM planting bases, research on the characteristics of TCM, and biology and enzymology studies on TCM and its growth environment can offer a better understanding of the characteristics of different TCMs. These are beneficial for the scientific management of the soil environment of TCM bases and the quality control of production. The analysis of the chemical state of Hg has attracted attention. Hg is one of the typical heavy metal pollutants in soil and TCM. The analysis of the chemical state of Hg sheds light on the modes in which Hg is transported from the environment to the TCM and the nature of migration and transformation processes. The current mainstream analysis methods in the laboratory are the combinations of separation and detection. Among these, HPLC-ICP-MS and LC-AFS are the prevalent techniques. Both techniques have high sensitivity and belong to the methodology of apparent morphology research. The indirect analysis of the chemical state of Hg can be implemented by these techniques, but the maintenance of the chemical state of Hg in pretreatment procedures has been a challenge. Novel pretreatment methods with a high extraction efficiency and stable chemical forms of Hg are expected. With advanced SR light sources as the research platform, the chemical forms of Hg can be directly analyzed in situ using microscopic analysis techniques, including X-ray near-edge XAFS and micro-zone X-ray fluorescence analysis. The exploration of the pathways of Hg pollutants reaching medicinal plants, the transformation mechanisms of the chemical state of elements, and their influencing factors at a molecular level comprise the most promising chemical-form analysis method.

Author Contributions

C.P. and L.K.: writing of the original draft; J.Q. and L.Y.: investigation; X.Y., Y.F. and K.Q.: validation; Y.S. and X.D.: conceptualization; C.P. and L.K.: writing, review, and editing; and Y.Z. and Q.H.: project management. All authors have read and agreed to the published version of the manuscript.

Funding

This study was financially supported by the National Natural Science Foundation of China (Grant No. 11975048).

Data Availability Statement

Not applicable.

Acknowledgments

The authors thank Yuxi Gao, Institute of High Energy Physics, Chinese Academy of Sciences, for his guidance.

Conflicts of Interest

The authors declare no conflict of interest.

References

  1. Lin, Y.H. Brief research on patent protection of traditional chinese medicinal materials. Chin. Invent. Pat. 2012, 7, 24–25. [Google Scholar] [CrossRef]
  2. Lin, C.H. Research and discussion on the current situation and countermeasures of traditional Chinese medicine in the international market. J. Qiqihar Med. Coll. 2013, 34, 567–568. [Google Scholar]
  3. Zhao, L.H.; Yang, Y.H.; Hu, Y.C.; Yang, S.H.; Jin, H.Y.; Wei, J.; Yang, M.H. Analysis and research on the current situation of heavy metal pollution in traditional Chinese medicinal materials in China and countermeasures. Chin. Herb. Med. 2014, 45, 1199–1206. [Google Scholar]
  4. Sun, Y.Z.; Chen, Y.; Lan, H.; Liu, L.Y.; Fang, L. Analysis of the sources, causes, and control technology pathways for mercury pollution in China. Environ. Chem. 2013, 32, 937–942. [Google Scholar]
  5. Qian, J.F.; Jiang, W.Y.; Niu, Y.F. Geochemical studies of heavy metal pollution in mine-river systems. Bull. Mineral. Petrol. Geochem. 2010, 29, 74–82. [Google Scholar]
  6. Wang, Z.; You, F.M.; Qiu, X.Y.; Huang, H.X. HPLC-ICP-MS method for the determination of methylmercury, ethylmercury and inorganic mercury in water samples. Fujian Anal. Test 2009, 18, 28–31. [Google Scholar]
  7. Rahman, M.A.; Hasegawa, H. Arsenic in freshwater systems: Influence of eutrophication on occurrence, distribution, speciation and bioaccumulation. Appl. Geochem. 2012, 27, 304–314. [Google Scholar] [CrossRef]
  8. Liu, S.M.; Zhu, Y.; Hao, R. Status of mercury pollution at home and abroad and its management measures. J. Environ. Sci. Technol. 2014, S2, 290–294. [Google Scholar]
  9. Yu, J.G. Status quo of China mercury emission control and development trend. Chem. Ind. 2010, 28, 40–42. [Google Scholar]
  10. Chai, Z.; Stemshorn, B.; Hao, J.; Jiang, G.; Hu, J.; Feng, X.; Lan, H.; Sun, Y.; Larssen, T.; Lahl, U.; et al. Special policy study on mercury management in China. In The China Council for International Cooperation on Environment and Development; China Council for International Cooperation on Environment and Development: Beijing, China, 2011. [Google Scholar]
  11. Lin, Y.H.; Li, Q. Morphological model study of heavy metals in river water. Environ. Chem. 1992, 6, 35–42. [Google Scholar]
  12. Li, P.; Feng, X.B.; Qiu, G.L.; Shang, L.H.; Li, Z.G. Mercury pollution in Asia: A Review of the Contaminated Sites. J. Hazard. Mater. 2009, 168, 591–601. [Google Scholar] [CrossRef] [PubMed]
  13. Guo, L.P. Status quo and analysis of heavy metal pollution of Chinese medicinal materials under ISO international standard “Traditional Chinese Medicine—Heavy Metal Limits of Chinese Materia Medica”. Sci. Technol. Rev. 2017, 35, 91–98. [Google Scholar]
  14. Gao, S.; Li, X.H.; Gao, Y.B.; Yu, L.G. Determination and analysis of heavy metal content in fruits and seeds of chinese medicinal materials. Fujian Anal. Test 2020, 29, 23–30. [Google Scholar]
  15. Zuo, T.T. Discussion on the formulation of limits of heavy metals and harmful elements in Chinese medicinal materials and drinking tablets. J. Pharm. Anal. 2020, 40, 688–692. [Google Scholar]
  16. Meng, S.; Liu, X.M.; Ping, H.J.; Duan, Q.; Feng, S.H.; Liu, Y.L. High performance liquid chromatography-inductively coupled plasma mass spectrometry (ICP-MS) for the determination of inorganic mercury, methylmercury and ethylmercury in Chinese medicinal materials. Chin. Inorg. Anal. Chem. 2023, 13, 414–419. [Google Scholar]
  17. Huang, L.Q. Research on Animal Medicinal Materials in the Chinese Pharmacopoeia; Fujian Science and Technology Press: Fujian, China, 2021. [Google Scholar]
  18. Liu, H. Speciation Analysis and Safety Study of Mercury and Arsenic in Mineral and Animal Drugs; Jilin Agricultural University: Jilin, China, 2019. [Google Scholar]
  19. Liu, H.X.; Wu, W.X.; Wang, D.H.; Deng, S.S.; Ma, Z.J.; Zhang, T. HPC-ICP-MS detection of methylmercury and ethylmercury content in proprietary Chinese medicine containing cinnabar. Shizhen Chin. Med. Chin. Med. 2012, 23, 873–874. [Google Scholar]
  20. Yang, L.L.; Li, N.; Zhang, D.Q.; Gao, L.R.; Kang, H.Y. Determination of different forms of mercury in Chinese herbal medicine by vapor generation-atomic fluorescence spectrometry. Spectrosc. Spectr. Anal. 2005, 25, 286–289. [Google Scholar]
  21. Hai, L.Y.B.; Qun, P.; Lu, J.R.; Jiang, M.T.; Wen, Y.; Ma, Q.; Gai, R.Y.; Li, L.B.; Liu, Y. Analysis and safety evaluation of the morphology, valence state and safety evaluation of zota mercury and arsenic in Tibetan medicine based on HPLC-ICP-MS. Chin. Herb. Med. 2022, 53, 2985–2990. [Google Scholar]
  22. Xu, L.Z.; Xie, Q.; Yan, L.L.; Chen, Y.H.; Wang, J.Y. Morphological analysis method of soluble mercury in proprietary Chinese medicines and determination of sample results. Exp. Technol. Manag. 2011, 28, 40–43. [Google Scholar]
  23. Lv, H.L.; Zhao, W.; Li, H.; Chen, C.; Ji, Q.L.; Lin, L.N.; Zhao, L.S. Microwave Digestion-ICP-MS method detected the content of 8 heavy metals in 8 medicinal herbs. J. Shenyang Pharm. Univ. 2020, 37, 618–623. [Google Scholar]
  24. Sun, J.; Chen, C.Y.; Li, Y.F.; Li, B.; Gao, Y.X.; Chai, Z.F. Determination of total mercury and methylmercury in biological samples by ultrasound-assisted solvent extraction-inductively coupled plasma mass spectrometry. Spectrosc. Spectr. Anal. 2007, 27, 173–176. [Google Scholar]
  25. Song, Q.Q.; Xie, X.X.; Ye, M.D. Ultrasonic extraction-high performance Liquid phase-atomic fluorescence for the determination of different forms of mercury in Wenzhou Seafood. Spectrosc. Lab. 2013, 30, 1335–1339. [Google Scholar]
  26. Yin, Y.G.; Chen, M.; Peng, J.F.; Liu, J.F.; Jiang, G.B. Dithizone-functionalized solid phase extraction-displacement elution-high performance liquid chromatography-inductively coupled plasma mass spectrometry for mercury speciation in water samples. Talanta 2010, 81, 1788–1792. [Google Scholar] [CrossRef] [PubMed]
  27. He, B.; Jiang, G.B. Determination of methylmercury and ethylmercury in farmland soils by solid phase microextraction capillary gas chromatography-atomic absorption spectrometry. Rock Miner. Test. 1999, 18, 259–262. [Google Scholar]
  28. Shi, J.B.; Liao, C.Y.; Wang, Y.W.; Jiang, G.B. Gas chromatography and atomic fluorescence for methylmercury in biological and sediment samples. Spectrosc. Spectr. Anal. 2006, 26, 336–339. [Google Scholar]
  29. Ni, X.Y.; Wang, Y.Z.; Chen, Q.L.; Liu, R.; Huang, W. High-pressure digestion-determination of mercury in rice by atomic fluorescence spectroscopy. Mod. Food Technol. 2008, 24, 1188–1190. [Google Scholar]
  30. Ma, Y.M.; Cao, L.L.; Cao, A.L. Determination of mercury content in licorice by atomic absorption spectrometry. Res. Pract. Mod. Chin. Med. 2003, 23. [Google Scholar]
  31. Zhou, Q.; Wen, J.L.; Huang, Q.H. Determination of arsenic, lead, cadmium and mercury in cinnamon and cumin. Spectrosc. Lab. 2007, 35, 692–694. [Google Scholar]
  32. Shi, Y.; Xiao, X.Y.; Wei, F.; Xiong, Q.; Ma, S.C.; Lin, R.C. Determination of harmful elements in deer antler gum based on microwave digestion and ICP-AES technology. Chin. J. Exp. Formulae 2013, 19, 151–153. [Google Scholar]
  33. Liu, K.Z.; Lu, Y.M.; Feng, G.Z.; Zheng, X.Y.; Luo, R.C. Wet digestion of ICP-AES method to determine Cd, Cr, Hg and Pb in codonopsis. Food Ind. 2014, 35, 265–267. [Google Scholar]
  34. Li, C.X.; Wang, L.L.; Xing, J.J.; Jiang, X.H.; Yan, Y.S. Microwave digestion/ICP-AES method simultaneously determined the contents of Cd, Hg and Pb in traditional Chinese medicines. J. Pharm. Anal. 2009, 29, 433–436. [Google Scholar]
  35. Su, X.D. Establishment of ICP-AES assay for microwave digestion of mercury and arsenic in Xiaoqinjiao. J. Qinghai Med. Coll. 2009, 30, 205–206. [Google Scholar]
  36. Hang, Y.G.; Feng, X.Q.; Hu, X.S. Determination of inorganic mercury and methylmercury in Chinese Medicinal Materials of animal origin by high performance liquid chromatography-Inductively coupled plasma mass spectrometry. Anal. Instrum. 2016, 208, 89–94. [Google Scholar]
  37. Liu, F.; Lai, B.W. Biomimetic extraction-high performance liquid chromatography-inductively coupled plasma mass spectrometry for the determination of soluble mercury content in amber dragon pills and einnabar medicinal materials. Guangdong Chem. Ind. 2021, 48, 177–179+186. [Google Scholar]
  38. Lai, L.P.; Yang, Y.L. LC-AFS method to determine the content of divalent mercury in cinnabar. Her. Tradit. Chin. Med. 2023, 29, 58–60+75. [Google Scholar]
  39. Hu, L.L.; Liu, K. Liquid chromatography-atomic fluorescence spectrometry was used to determine the contents of arsenic and mercury in eight Chinese medicinal materials. J. Food Saf. Qual. Test. 2021, 12, 2957–2962. [Google Scholar]
  40. Yang, C.Z.; Cheng, G.F.; Huang, Y.H. Basic knowledge of synchrotron radiation lecture 1 The principle, structure and characteristics of synchrotron radiation light source. Phys. Chem. Test. 2008, 60, 103–106. [Google Scholar]
  41. Smith, P.G.; Koch, I.; Gordon, R.A.; Mandoli, D.F.; Chapman, B.D.; Reimer, K.J. X-ray absorption near-edge structure analysis of arsenic species for application to biological environmental samples. Environ. Sci. Technol. 2005, 39, 248–254. [Google Scholar] [CrossRef]
  42. Manceau, A.; Lemouchi, C.; Rovezzi, M.; Lanson, M.; Glatzel, P.; Nagy, K.L.; Gautier-Luneau, I.; Joly, Y.; Enescu, M. Structure, bonding, and stability of mercury complexes with thiolate and thioether ligands from high-resolution XANES spectroscopy and first-principles calculations. Inorg. Chem. 2015, 54, 11776. [Google Scholar] [CrossRef]
  43. Koningsberger, D.C.; Prins, R. X-ray Absorption: Principles, Applications, Techniques of EXAFS, SEXAFS and XANES; JohnWiley and Sons Inc.: New York, NY, USA, 1988. [Google Scholar]
  44. Michael, R.; Jeannine, D.; Michael, H.; Brandy, B.; Miguel, M.; Ben, K.G.; Joy, C.A. Hg L3 XANES Study of Mercury Methylation in Shredded Eichhornia crassipes. Environ. Sci. Technol. 2008, 42, 5568–5573. [Google Scholar]
  45. Laura, C.; Valentina, R.; Fabrizio, B.; Marco, B.; Claudia, C.; Pilario, C.; Francesco, D.B.; Pierfranco, L.; Géraldine, S. Mercury speciation in Pinus nigra barks from Monte Amiata (Italy): An X-ray absorption spectroscopy study. Environ. Pollut. 2017, 227, 83–88. [Google Scholar]
  46. Carrascogil, S.; Siebner, H.; Leduc, D.L.; Webb, S.M.; Millan, R.; Andrews, J.C.; Hernandez, L.E. Mercury localization and speciation in plants grown hydroponically or in a natural environment. Environ. Sci. Technol. 2013, 47, 3082–3090. [Google Scholar] [CrossRef] [PubMed]
  47. Li, Y.Y.; Zhao, J.X.; Guo, J.X.; Liu, M.J.; Xu, Q.L.; Li, H.; Li, Y.F.; Zheng, L.; Zhang, Z.Y.; Gao, Y.X. Influence of sulfur on the accumulation of mercury in rice plant (Oryza sativa L.) growing in mercury contaminated soils. Chemosphere 2017, 182, 293–300. [Google Scholar] [CrossRef]
  48. Li, Y.F.; Chen, C.Y.; Xing, L.; Liu, T.; Xie, Y.N.; Gao, Y.X.; Li, B.; Sui, L.Y.; Chai, Z.F. In situ study of mercury content and its presence state in human hair in Wanshan mercury mine area of Guizhou. Nucl. Technol. 2004, 27, 899–903. [Google Scholar]
  49. Warner, R.R. X-Ray Microanalysis in Biology. M. A. Hayat. Q. Rev. Biol. 1981, 56, 332. [Google Scholar]
  50. Zhao, J.T.; Li, Y.F.; Li, Y.Y.; Gao, Y.X.; Li, B.; Hu, L.; Zhao, Y.L.; Chai, Z.F. Selenium modulates mercury uptake and distribution in rice (Oryza sativa L.), in correlation with mercury species and exposure level. Met. Integr. Biometal Sci. 2014, 6, 1951–1957. [Google Scholar] [CrossRef]
  51. Korbas, M.; O’Donoghue, J.L.; Watson, G.E.; Pickering, I.J.; Singh, S.P.; Myers, G.J.; Clarkson, T.W.; George, G.N. The chemical nature of mercury in human brain following poisoning or environmental exposure. ACS Chem. Neurosci. 2010, 1, 810–818. [Google Scholar] [CrossRef]
  52. Fang, F.M. Progress in the Soil Mercury Pollution Research Division. Soil Environ. 2000, 9, 326–329. [Google Scholar]
  53. Bao, Z.D. Morphological distribution of mercury in contaminated soil in Wanshan mercury mining area of Guizhou. J. Ecol. 2011, 30, 907–913. [Google Scholar]
  54. Bernaus, A.; Gaona, X.; Esbri, J.M.; Higueras, P.; Falkenberg, G.; Valiente, M. Microprobe techniques for speciation analysis and geochemical characterization of mine environments: The mercury district of Almaden in Spain. Environ. Sci. Technol. 2006, 40, 4090–4095. [Google Scholar] [CrossRef] [PubMed]
  55. Anna, B.; Xivier, G.; Manuel, V.; Derk, V.R. Determination of mercury in polluted soils surrounding a chlor-alkali plant: Direct speciation by X-ray absorption spectroscopy techniques and preliminary geochemical characterisation of the area. Anal. Chim. Acta 2006, 565, 73–80. [Google Scholar]
  56. Yin, R.S.; Feng, X.B.; Wang, J.X.; Li, P.; Liu, J.L.; Zhang, Y.; Chen, J.B.; Zheng, L.R.; Hu, T.D. Mercury speciation and mercury isotope fractionation during ore roasting process and their implication to source identification of downstream sediment in the Wanshan mercury mining area, SW China. Chem. Geol. 2013, 336, 72–79. [Google Scholar] [CrossRef]
  57. Terzano, R.; Santoro, A.; Spagnuolo, M.; Vekemans, B.; Medici, L.; Janssens, K.; Göttlicher, J.; Denecke, M.A.; Mangold, S.; Ruggiero, P. Solving mercury (Hg) speciation in soil samples by synchrotron X-ray microspectroscopic techniques. Environ. Poll. 2010, 158, 2702–2709. [Google Scholar] [CrossRef]
  58. McNear, D.H.; Afton, S.E.; Caruso, J.A. Exploring the structural basis for selenium/mercury antagonism in Allium fistulosum. Met. Integr. Biometal Sci. 2012, 4, 267–276. [Google Scholar] [CrossRef]
  59. Edward, B.S.; Daniel, R.E.; Mark, E.B.; Thomas, A.H.; Patrick, L.B. Increasing rates of atmospheric mercury deposition in midcontinental. Science 1992, 257, 784–787. [Google Scholar]
  60. Zhang, Q.G.; Pan, K.; Kang, S.C.; Zhu, A.J.; Wang, W.X. Mercury in wild fish from high-altitude aquatic ecosystems in the Tibetan Plateau. Environ. Sci. Technol. 2014, 48, 5220–5228. [Google Scholar] [CrossRef]
  61. Nicolas, S.B. On the chemical form of mercury in edible fish and marine invertebrate tissue. Can. J. Fish. Aquat. Sci. 1992, 49, 1010–1017. [Google Scholar]
  62. Hugh, H.H.; Ingrid, J.P.; Graham, N.G. The chemical form of mercury in fish. Science 2003, 301, 1203. [Google Scholar]
  63. George, G.N.; MacDonald, T.C.; Korbas, M.; Singh, S.P.; Myers, G.J.; Watson, G.E.; O’Donoghue, J.L.; Pickering, I.J. The chemical forms of mercury and selenium in whale skeletal muscle. Met. Integr. Biometal Sci. 2011, 3, 1232–1237. [Google Scholar] [CrossRef]
  64. Clarkson, T.W. The biological properties and distribution of mercury. Biochem. J. 1972, 130, 61–63. [Google Scholar] [CrossRef] [PubMed]
  65. Rodrigues, J.L.; Serpeloni, J.M.; Batista, B.L.; Souza, S.S.; Barbosa, F. Identification and distribution of mercury species in rat tissues following administration of thimerosal or methylmercury. Arch. Toxicol. 2010, 84, 891–896. [Google Scholar] [CrossRef]
  66. Zhao, J.T.; Hu, Y.; Gao, Y.X.; Li, Y.F.; Li, B.; Dong, Y.X.; Chai, Z.F. Mercury modulates selenium activity via altering its accumulation and speciation in garlic (Allium sativum). Metallomics 2013, 5, 896–903. [Google Scholar] [CrossRef] [PubMed]
  67. Korbas, M.; Blechinger, S.R.; Krone, P.H.; Pickering, I.J.; George, G.N. Localizing organomercury uptake and accumulation in zebrafish larvae at the tissue and cellular level. Proc. Natl. Acad. Sci. USA 2008, 105, 12108–12112. [Google Scholar] [CrossRef] [PubMed]
  68. Korbas, M.; Macdonald, T.C.; Pickering, I.J.; George, G.N.; Krone, P.H. Chemical form matters: Differential accumulation of mercury following inorganic and organic mercury exposures in zebrafish larvae. ACS Chem. Biol. 2011, 7, 411–420. [Google Scholar] [CrossRef] [PubMed]
  69. Snapp, K.R. The contribution of dental amalgam to mercury in blood. J. Dental. Res. 1989, 68, 780–785. [Google Scholar] [CrossRef] [PubMed]
  70. Mark, M.; Jennifer, A.; Chad, M.; Ronald, S.O.; Martha, T.; David, K.; Cynthia, C.G. Methyl-mercury degradation pathways: A comparison among three mercury-impacted ecosystems. Environ. Sci. Technol. 2000, 34, 4908–4916. [Google Scholar]
  71. Bizily, S.P.; Rugh, C.L.; Summers, A.O.; Meagher, R.B. Phytoremediation of methylmercury pollution: MerB expression in Arabidopsis thaliana confers resistance to organomercurials. Proc. Natl. Acad. Sci. USA 1999, 96, 6808–6813. [Google Scholar] [CrossRef]
  72. Oremland, R.S.; Culbertson, C.W.; Winfrey, M.R. Methylmercury decomposition in sediments and bacterial cultures: Involvement of methanogens and sulfate reducers in oxidative demethylation. Appl. Environ. Microbiol. 1991, 57, 130–137. [Google Scholar] [CrossRef]
  73. Patty, C.; Barnett, B.; Mooney, B.; Kahn, A.; Levy, S.; Liu, Y.J.; Pianetta, P.; Andrews, J.C. Using X-ray microscopy and Hg L3 XANES to study Hg binding in the rhizosphere of Spartina Cordgrass. Environ. Sci. Technol. 2009, 43, 7397–7402. [Google Scholar] [CrossRef] [PubMed]
Figure 1. Biogeochemical cycle of Hg in the soil and atmosphere.
Processes 11 02821 g001
Figure 2. Hg L3 XANES spectra of the Hg standard compounds and the soil samples treated by different S species. The dotted line represents the fitting results. Treatments of pot experiments 500S(0): Elemental sulfur, 500 mg·kg−1; Treatments of pot experiments 500S(VI): Sulfate, 500 mg·kg−1; Ref. [47] Reproduced with permission from the author, Chemosphere, 2017.
Processes 11 02821 g002
Figure 3. Radial structural function of the Hg L3 edge in human hair and the standard. Ref. [48] Reproduced with permission from the author, Nuclear technology, 2004.
Processes 11 02821 g003
Figure 4. Distribution of Hg and Se in different tissues of paddy soil-cultured rice measured using m-SR-XRF. Ref. [50] Reproduced with permission from the author, Metallomics Integrated Biometal Science, 2014. (a) The cross section of the root tip from rice under Hg exposure; (a1) Hg XRF image; (b) the cross section of the root tip from rice under Hg and Se exposure; (b1) Hg XRF image; (b2) Se XRF image; (c) the leaf from Hg exposed rice; (c1) Hg XRF image; (d) the leaf from Hg and Se co-exposed rice; (d1) Hg XRF image; (d2) Se XRF image (e) the rice grain from Hg exposed rice; (e1) Hg XRF image; (f) the rice grain from Hg and Se co-exposed rice; (f1) Hg XRF image; (f2) Se XRF image.
Processes 11 02821 g004
Figure 5. X-ray fluorescence images of cerebral cortex. Ref. [51] Reproduced with permission from the author, ACS CHEM Neurosci, 2010.
Processes 11 02821 g005
Table 1. Statistics on Hg contamination in TCMs from different parts of medicinal plants.
Classification of Chinese Medicinal MaterialsTotal Amount of Hg
Sample Numberx ± s (mg·kg−1)Over Standard Rate (%)
Roots and rhizomes9880.11 ± 0.430.71
Flowers980.45 ± 1.185.10
Leaves191.68 ± 6.1710.53
Holothurian1340.17 ± 0.602.24
Fruits and seeds2700.19 ± 1.531.11
Animals251.82 ± 4.4912.00
Stems and trees340.31 ± 1.142.94
Algae, fungi, and lichens260.06 ± 0.100
Cortex1010.07 ± 0.100
Table 2. Morphological data on Hg in six herbal medicines.
Type of Herbal MedicineHg(II) (μg·kg−1)Met-HgEt-Hg
Indigowoad root8.777
Chinese Thorowax root9.958
Thinleaf Milkwort root8.990
Common Anemarrhena rhizome10.830
Alisma orientale13.231
Saposhnikovia divaricata root12.250
Table 3. Content of Hg forms in 31 animal medicines.
Animal MedicinesIno-Hg (mg·kg−1)Met-Hg (mg·kg−1)
Batch 1Batch 2Batch 3Batch 1Batch 2Batch 3
Bombyx batryticatus15951601144.3NDNDND
Buffalo horn2.392.763.462.833.233.33
Margarita5.077.5659.25NDNDND
Faeces Trogopterori529.11 56242.58NDNDND
Scorpio38.0429.6621.5353.9747.3139.91
Pheretima2888412043.7410.07ND16.56
Testudinis Carapax et Plastrum10.197.9422.08NDNDND
Eupolyphaga Steleophaga728.2738.121.18NDNDND
Cervi Cornu Pantotrichum8.5810.7419.66NDNDND
Asini Corii Colla4.446.343.65NDNDND
Cervi Cornu1604778.29.90NDNDND
Ostreae Concha12.9133.2110.50NDNDND
Cicadae Periostracum30363406127.6NDNDND
Margaritifera Concha146.0119.29.51NDNDND
Trionycis Carapax15.9332.0910.59NDNDND
Giant gecko7.6324.1311.9621.5991.9730.22
Chilopoda9.8714.2519.22131.4186.6156.6
Hirudo12.5614.7315.12NDND17.12
Zaocys dhumnades5.258.234.5097.49104.547.80
Hippocampus7.5923.828.4837.9217.4514.53
Gecko6567397.322.7341.1150.9345.15
Agkistrodon4.088.117.38313.1319.76.99
Syngnathus8.328.527.057.759.3711.82
Vespae Nidus145.566.00128.0NDNDND
Aspongopus52.3967.8049.05NDNDND
Sepiae Endoconcha56.3620.5610.15NDNDND
Dried Toads Venom33.2254.5514.37NDNDND
Bungarus Parvus48.8772.7115.74158.1225.4137.8
Bovis Calculus229.9NDNDND
Moschus54.63NDNDND
Cordyceps240.6NDNDND
ND, Not detected.
Table 4. Morphological data on Hg in commonly used Chinese medicines.
Chinese Patent MedicineHg(II) (μg·kg−1)Met-Hg (mg·kg−1)Et-Hg (mg·kg−1)References
Niuhuang Qianjin powder0.00656[19]
Wanshi Niuhuang Qingxin prescription0.03724Total 0.00218[20]
Tibetan medicine Zota285.60[21]
Yixian pill4.1[22]
Rendan pill23.1
Baiziyangxin pills5.1
Bushen Yinao capsules23.7
Zixue18.2
Suhexiang pill17.8
Bingpeng San30.7
Bingpeng Buccal tablet11.2
Xiangsu Zhengwei pill7.7
Children’s Jindan pills3.1
Children’s Qizhen pills3.7
Niuhuang Qingre capsules9.7
JiuJi powder11.7
Qili San45.0
Niuhuang Baolong pills1.3
Qingre Huadu pills18.6
Children’s Zhibao pills6.6
Renshen Zaizao pills12.9
Jiuzhi Qingxin pill2.8
Niuhuang Qinggong pill1.4
Tianwang Buxin pill10.2
Tongren Anshen pill11.8
Table 5. Pretreatment methods for morphological analyses of Hg.
SampleExtraction MethodSolventExtraction Efficiency (%)
Biological sample [24]Ultrasonic extraction6 mol·L−1 HCl80–97
Marine products [25]Ultrasonic extraction5 mol·L−1 HCl90.1–107.3
Water [26]Solid-phase extractionElution of Hg substances with Na2S2O371.2–94.2
Soil [27]Solid-phase microextractionConcentrated nitric acid93.8–94.7
Biological and sediment samples [28]Acid extraction5 mL Milli-Q water and 4 mL KBr/CuSO4 (3:1)70–77
Rice [29]High-pressure digestion15 g·L−1 KBH4 solution95–102
KBH4, Potassium borohydride.
Table 6. Applications of ICP-AES in the analysis of Hg in TCM.
Tested DrugPretreatment MethodICP-AES Operating ConditionsDetection LimitLinear RelationshipRecovery (%)
Cinnamon, cumin [31]After baking at 80 °C for 4 h, grinding, and digestion with concentrated nitric acid, the solution becomes colorless and transparent and is transferred to a 50 mL volume bottle with 5% nitric acidIRIS Advantage ICP-AES (TJA, Boston, MA, USA); power: 1150 W; plasma gas (argon) flow rate: 12 L·min−1; auxiliary gas (argon) flow rate: 1 L·min−1; carrier gas (argon) flow rate: 2 L·min−1; sample lifting capacity: 1.5 mL·min−1; and Hg determination wavelength: 184.9 nm0.08 μg· L−1R > 0.999; linear range: 0–10 μg·L−193.5
Antler glue [32]Microwave digestion: concentrated to 2–3 mL, diluted with water to 25 mL, shaken well, and then obtainedMARS-5 microwave digestion instrument (CEM, Matthews, NC, USA); ARCOS full-spectrum direct reading plasma emission spectrometer (SPECTRO, Kleve, Germany), the atomizer is a standard cross-flow pneumatic atomizer); incident power: 1.4 kW; cooling gas argon, cooling gas flow rate: 12 L·min−1; carrier gas flow rate: 1 L·min−1; auxiliary gas flow rate: 0.8 L·min−1; and sample lifting capacity: 1 mL·min−1Detection limit of Pb, Cd, As, Hg, Cu, and Cr: 0.15, 0.01, 0.27, 0.08, 0.03, and 0.03 mg· kg−1, respectivelyStandard curves of Pb, Cd, As, Hg, Cu, and Cr were prepared; R of each element: >0.995Recovery of Pb, Cd, As, Hg, Cu, and Cr: 90–112
Codonopsis [33]Codon ginseng was crushed through a 100-mesh sieve and dissolved into a 50 mL volumetric bottle with concentrated nitric acid; the digestion tube was rinsed with 5% nitric acid, which determined the volume before being mixed and measurediCAP6300 ICP-AES (Thermoelectric, Boston, MA, USA); high-frequency transmission power: 1350 W; auxiliary gas flow: 0.5 L·min−1; atomizer flow: 0.18 MPa; flushing pump speed: 50 rpm; analysis pump speed: 50 rpm; vertical observation height: 15.0 mm; integration time low wave: 15 s; high wave: 5 s0.065 mg·kg−1Linear regression equation: y = 329.929x + 0.487; R = 0.99917597.10–107.75
Wild chrysanthemum, chrysanthemum, dandelion, loquat leaf, and cicada [34]Five kinds of samples were ground, screened with 100 mesh, digested with concentrated nitric acid, and filtered via microwave-assisted digestion into a 50 mL measuring bottle with 2% nitric acidVISTA MPX ICP-AES (OES, Varian, Palo Alto, CA, USA); plasma gas flow rate: 15.0 L·min−1; auxiliary gas flow rate: 1.50 L·min−1; atomizing gas pressure: 200 kPa; instrument stability time: 15 s; 1 reading time: 5 s; number of readings: 2 times; cleaning time: 10 s; injection delay: 30 s; pump speed: 15 r·min−1; power: 1.00 kW0.25 ng·mL−1Linear regression equation: y = 3.467 × 10²x − 7.72; R = 0.9999; linear range 0.002–9.5 μg· mL−1Wild chrysanthemum: recovery rate = 100.1; chrysanthemum: recovery rate = 97.7; dandelion: recovery rate = 98.2; loquat leaf: recovery rate = 93.4; recovery rate: 95.4
Gentiana xiaoqinensis [35]Samples were digested by adding 5 mL of HNO3 and 1 mL of H2O2 into the microwave digestion tankIRIS Interpid II ICP-AES (USA Thermoelectric, Boston, MA, USA); transmit power: 1.2 KW; high frequency: 27 MHZ; plasma flow rate: 1.5 L·min−1; carrier gas flow rate: 1.2 L·min−1; cooling gas flow rate: 10.5 L·min−1; atomizing gas pressure: 172.64 KPa; instrument stabilization time delay: 15 s; reading time: 3 s0.004 μg· mL−1Linear regression equation: y = 14.80x + 0.29; R = 0.9997; linear range: 0.0–150.2 mg·mL−183.33
Table 7. Application of HPLC-ICP-MS in Hg morphology analysis of TCM.
Tested DrugsHg SpeciesOperating Parameters of HPLCOperating Parameters of ICP-MSDetection LimitRecovery (%)Proportion of Different Species
Radix isatidis (root), Bupleurum (root), Polygala (root), rhizome (rhizome), Purpurea (tuber), Parsnip (root) [16]Hg2+, CH3Hg, C2H5HgAgilent ZORBAX SB-C18 (5 μm, 4.6 mm × 150 mm) was prepared at a column temperature of 25 °C with a sample size of 20 μL and a flow rate of 1.0 mL·min−1
Mobile phase: 1 g L of cysteine, 1.6 g of ammonium acetate, dissolved with water, and 50 mL of methanol were added, diluted with water to make a volume of 1 L, and shaken well
Plasma power: 1550 W; cooling gas flow rate: 14 L·min−1; auxiliary gas flow rate: 0.8 L·min−1; carrier gas flow rate: 1.07 L·min−1; sampling depth: 5 mm; atomization chamber temperature: 2.7 °C; Ni sampling cone, interception cone, collision pool technology (KED), full quantitative analysis mode; oxide CeO/Ce: <3.0%; collection mass number: 202 Hg; integration time: 0.2 s; collection time: 600 sHg2+, CH3Hg, C2H5Hg: 0.003 mg·kg−175–118106 batches of 6 kinds of Chinese medicinal materials were determined; no CH3Hg+ and CH3CH2Hg+ were detected; inorganic Hg was detected in 94 batches; detection rate: 88.7%; qualified rate: 100%
Chinese medicinal materials of animal origin [36]CH3Hg, Hg2+Chromatographic column: Agilent Zorbax Plus C18, 4.6 mm × 150 mm × 5 μm; column greenhouse temperature; sample size: 50 μL; velocity of flow: 1.0 mL·min−1
Mobile phase: 0.1 w/v L-cysteine + 0.1% w/v L-cysteine·HCl·H2O
RF power: 1550 W; argon plasma flow rate: 15 L·min−1; argon auxiliary gas flow rate: 0.9 L·min−1; argon atomizer flow rate: 1.17 L·min−1; sampling depth: 8 mm; atomization chamber type: dual channel; atomization chamber temperature: 2 °C; mass–charge ratio (M/Z): 202; and chromatograph integration time: 1.5 s·point−1Detection limit of CH3Hg and Hg2+: when the detection limit of the methods was 0.007 mg·kg−1 and 0.005 mg·kg−1CH3Hg: 78.0–98.8
Hg2+: 87.3–94.5
Not mentioned
Amber Baolong pill (composed of yam, cinnabar, licorice, amber, Apogon, sandalwood, Fructus aurantii, Poria, bile south star, Poncirus aurantia, and red ginseng) [37]Hg2+, CH3Hg, C2H5HgAgilent ZORBAX SB: C18 (4.6 × 150 mm2, 5 μm); methanol: 0.01 mol·L−1; ammonium acetate solution (containing 0.12% L-cysteine) (8:92) was used as the mobile phase; flow rate: 0.4 mL·min−1; and sample size: 20 μLNot mentionedContent of divalent Hg in cinnabar in Chinese Pharmacopoeia was taken as the limitAverage recovery of Hg2+, CH3Hg, and C2H5Hg: 101.8%, 101.2%, and 95.3%, respectivelyConcentration of Hg2+, CH3Hg, C2H5Hg, CH3Hg+, and CH3CH2Hg+: all in 0.1–5 μg· mL−1
Content of CH3Hg+ and CH3CH2Hg+ in cinnabar medicinal materials: about twice that of amber Baolong pills
Tibetan medicine Zota [21]Hg2+, CH3Hg, C2H5HgShim-pack GlST C18 (150 × 4.6 mm2, 5 μm); mobile phase: methanol–0.01 mol·L−1 ammonium acetate solution (containing 0.12% L-cysteine; pH adjusted to 7.5 by ammonia) (8:92); volume flow rate: 0.8 mL·min−1; column temperature: 30 °CHigh-frequency power: 1.20 kW; high frequency: 27.12 MHz; auxiliary gas volume flow: 1.10 L·min−1; torch tube type: mini torch tube; atomization chamber swirl; plasma gas volume flow: 9.0 L·min−1; carrier gas volume flow: 0.70 L ·min−1; impact gas type: He gas; sampling depth: 5.0 mm; atomizing chamber temperature: 0 °C; energy filter voltage: 5.0 V0.5–20 µg·L−188.2–95.74Hg2+ concentration: 11.25–725.13 μg·g−1; no CH3Hg or C2H5Hg detected
Disclaimer/Publisher’s Note: The statements, opinions and data contained in all publications are solely those of the individual author(s) and contributor(s) and not of MDPI and/or the editor(s). MDPI and/or the editor(s) disclaim responsibility for any injury to people or property resulting from any ideas, methods, instructions or products referred to in the content.

