Article

Study on Purging Strategy of Polymer Electrolyte Membrane Fuel Cell under Different Operation Conditions

1
College of Emergency Management, Nanjing Tech University, Nanjing 211816, China
2
Nanjing Canatal Data-Centre Enviromentol Tech Co., Ltd., Nanjing 211111, China
3
Hubei Key Laboratory for High-Efficiency Utilization of Solar Energy and Operation Control of Energy Storage System, Hubei University of Technology, Wuhan 430068, China
*
Author to whom correspondence should be addressed.
These authors contributed equally to this work.
Processes 2023, 11(1), 290; https://doi.org/10.3390/pr11010290
Submission received: 12 December 2022 / Revised: 8 January 2023 / Accepted: 11 January 2023 / Published: 16 January 2023

Abstract

:
The commercial proton exchange membrane fuel cell (PEMFC) system needs to be equipped with the capacity to survive a harsh environment, including sub-freezing temperatures. The cold start of PEMFC brings about great technical challenges, mainly due to the ice blockage in the components, which seriously hinders the multi physical transmission process. A multiscale, two-dimensional model was established to explore the gas purging in PEMFC under different electrochemical reaction intensities. The results indicate that the optimal case is obtained by B3-1 with a power density of 0.796 W cm−2, and the power density increases first and then decreases, followed by stoichiometric flow ratio (ξ) changes. It is worth noting that the water mole fraction in the PEM is closely related to the water concentration gradient. However, the differences in the initial water distribution in porous media have little bearing on the condensed water in the gas channel, and the liquid water in the gas diffusion layer (GDL) is preferably carried away ahead of other porous parts. The results also show that the increase in the purge speed and temperature can remove the excess water on GDL and the catalytic layer in a short time. For a nitrogen-based purge, the operating condition in case B3-1 is shown as the best strategy based on the output performance and economic analysis during the shutdown and purge process.

1. Introduction

High energy conversion and environmental protection power supply devices have attracted extensive attention over the world due to the global energy crisis and the aggravation of environmental pollution caused by traditional fossil fuels. Renewable energies such as wind and solar energy are unstable and intermittent during generation, and fuel cell techniques based on hydrogen are much too simple since there is no need to employ additional energy storage systems to improve the utilization rate and stability. At the same time, green hydrogen can be prepared by electrolysis of the water through renewable energy access, without considering the intermittent problem [1]. Compared with other types of fuel cells, the proton exchange membrane fuel cell (PEMFC) has advantages, such as a low operating temperature [2,3], fast start-up speed [4,5,6], and modular installation [7]. It is considered to be the best alternative power supply for electric vehicles, submarines, and various movable devices [8,9,10,11,12].
Nevertheless, it has great challenge for PEMFC to start and operate at subzero ambient temperature [13]. The water generated by electrochemical reactions in the system is susceptible to freezing inside the stack [14], preventing the gas reaction medium from reaching the catalytic layer [15] and even causing irreversible performance degradation of the membrane [16,17,18,19]. It is recognized that proper purging after the shutdown of PEMFC in a low temperature environment can significantly reduce water content on the porous media of PEMFC [20,21,22], which is heavily instrumental in the cold start process [23]. Therefore, a detailed understanding of water transport in the gas diffusion layer (GDL), catalyst layer (CL) and membrane is essential to establishing effective gas purge protocols to aid the successful cold start of PEMFC.
Through comprehensive study in the cold start process of PEMFC, reaching an agreement on the distribution of water is the most important factor in affecting the cold start performance. Meanwhile, the frozen process is the direct cause of the cold start failure and has a significant effect on the change of water in the PEMFC system, including the initial humidity, initial temperature, starting current density, and the existence of super cooled water [24]. However, the distribution of final liquid water caused by different initial conditions gradually changes along the direction of the reaction gas velocity [25,26,27,28,29], and the corresponding purge strategy optimization is not systematically discussed.
In this study, a multiscale two-dimensional model is developed to investigate the water distribution in the steady state of the PEMFC under different boundary conditions, and the transient state of water fraction changes by purging the gas channel based on different initial conditions. The output power and water mole fraction characteristics are obtained to predict the energy efficiency and the regularity of water distribution. Coherently, the purge strategy optimization of PEMFC under different initial distributions is systematically analyzed through the distribution of liquid water in gas channels, porous media, and the proton exchange membrane. Furthermore, energy consumption criteria are applied to evaluate the economy’s performance and the optimal purge strategy of PEMFC.

2. Materials and Methods

As shown in Figure 1a, a multiscale, two-phase model of a PEMFC, including a water transport process, is employed by means of COMSOL Multiphysics 5.6, which encompasses all the main elements of a PEMFC. The flow medium inside cathode and anode gas channels (GC) is a reaction gas that combines with humidified water. The gas diffusion layer (GDL) and catalytic layer (CL) of the cathode and anode are conductive mediums with a porous structure, which is conducive to the flow field of reaction gas and water. Importantly, there are four kinds of water transport approaches in proton exchange membrane (PEM), electro-osmotic drag (EOD), back diffusion (BD) and hydraulic permeation (HP), respectively [30]. In addition, the phase transition and water production reaction are considered in the mathematical model to better describe the distribution of water. All models analyzed in this study have the same common dimensions of 20 mm × 2.96 mm (the geometric parameters of PEMFC are chosen and listed in Table 1), and the boundary heat transfer conditions are provided in Figure 1b.
The complete electrochemical model is formulated based on the conservation principles of mass, momentum, and energy, as well as electrochemical reactions, to simulate the multi-physical transport and electrochemical processes occurring in the interior of a fuel cell. However, some reasonable assumptions [31] are given before the calculation:
(1)
Ideal gas law is assumed for gas mixtures in low pressure environment.
(2)
Laminar and incompressible flow was considered for the gaseous phase.
(3)
Ignoring the influence of gravity in micro-channels.
(4)
The performance of electrode materials remains stable.
Then, all the conservation equations [32] during electrochemical reactions are briefly described as follows:
Mass conservation equation:
ε ρ t + · ε ρ u = S m  
Momentum conservation equation:
ε ρ u t + · ε ρ u u = ε p + · ε μ u + S u
Energy conservation equation:
ε ρ c p T t + · ε ρ c p u T = · k e f f T + S q
Component conservation equation:
ε c i t + · ε u c i = · D i e f f c i + S i
Electrochemical equations:
The Butler-Volmer equation is used to describe dynamic reaction on CL surface [33]. The equation based on over-potential and exchange current density is as follows:
S a = j a , r e f c H 2 c H 2 , r e f γ a e α a F η a R T e α c F η c R T
S c = j c , r e f c O 2 c O 2 , r e f γ c e α a F η c R T + e α c F η a R T
The potential of PEMFC can be artificially defined by form of existence as a solid- phase potential and a membrane-phase potential. Interface conditions involving the inlet and outlet of GC and Walla and Wallc of the PEMFC. The inlet boundary is given by molar fraction of the reaction gas and temperature [32,34,35]:
u i n = ξ x I 0 A 1 n F A 2 R T 0 p
X i n = X 0   T i n = T 0
The outlet boundary is set as back pressure:
P 0 = 0
Except for convective heat exchange between Walla and Wallc of the PEMFC and the environment, the remaining boundaries are set as adiabatic.
q 0 = h T e x t T
where h is the convective heat transfer coefficient. T e x t is the environmental air temperature, which set as T e x t = 243 K to study PEMFC performance under extreme cold conditions. Moreover, the detailed description of operating parameters in the equation is shown in Table 2.
Water vapor transport in porous media plays a critical role in the gas purging of a PEMFC. During the purging process, a large amount of water vapor in the porous medium diffuses to the interface between GDL and GC under different concentration gradients. The purging gas in GC and water vapor converge and diffuse to the interface of the porous medium by convective movement. The dynamic equation of water vapor in GDL is as follows:
δ g d l ε g d l d c g d l d t = J c l g d l J g d l g c
J g d l g c = c g d l c g c 0.5 δ g d l D e f f  
For the governing equation of water vapor purging, the convective term is discretized by a fast scheme, and the diffusion term is discretized by a central difference scheme [37].

3. Results and Discussion

3.1. Grid Independency

To evaluate the water distribution of a PEMFC in a severe cold environment under different initial conditions, the most critical factors affecting water distribution, namely inlet moisture content, stoichiometry flow ratio, and heat transfer coefficient (as shown in Table 3), are selected as variables for this work. However, grid independence verification is required before calculation. It can be seen from Table 4 that the corresponding current density at each operating voltage remains constant after the grid number reaches 57,944. Therefore, the model with 57,944 grids is selected for subsequent calculation and analysis.

3.2. Output Characteristics of PEMFC under Subzero Temperatures Conditions

The polarization curve is an important parameter for describing the performance of the fuel cell system. The experimental and simulated values of case C4 are shown in Figure 2. It can be seen that the simulated value is consistent with the experimental value from the literature [38]. Therefore, it is reasonable to conclude that the distribution of reactants and products obtained by subsequent calculation is accurate.

3.2.1. Electrochemical Characteristics of PEMFC under Different Initial Conditions

The simulated polarization curves under different boundary heat transfer coefficients or ξ are compared in Figure 3. Seen from Figure 3a–c, the wake heat transfer conditions on the boundary are not conducive to the output performance of the PEMFC, even in extremely low temperature environments. It can be shown that obvious polarization of the concentration occurred, particularly in cases with low levels of heat transfer coefficients. However, there is little increase in the maximum output power density at a cell voltage of 0.5 V as the heat transfer coefficient exceeds 50 Wm−2 K−1 for each moisture content case. Through quantitative analysis, the optimal output power density of case B3 is 0.748 W cm−2, which is only 2.74% higher than that of case A3 (0.728 W cm−2), and 8.56% higher than that of case C3 (0.689 W cm−2). Therefore, the high inlet humidity in a cold environment can ameliorate the performance of PEMFC. Similarly, the increase in ξ contributes to increasing the inlet velocity. As described in Figure 3d, it easily falls into an obvious concentration polarization under a heat transfer coefficient of 50 Wm−2 K−1, and power density increases first and then decreases with ξ changes. The optimal value appears in case B3-1 with a power density of 0.796 Wcm−2, which is 6.42% higher than case B3 and 15.53% higher than case C3. For case B3-2, the maximum output power density of 0.748 W cm−2 is similarly obtained when the operating voltage is 0.5 V, which is also slightly higher than case B3. However, the output performance gradually decreases when the inlet velocity is further increased in GC.

3.2.2. Water Distribution under Different Initial Conditions

The liquid water in the porous area of the PEMFC is easily frozen in a severe cold environment, blocking the transport of reaction gas and ultimately resulting in a rapid decline in cell performance in the start-up stage. Therefore, the porous electrode and liquid water distribution in the gas diffusion layer are extremely important to the purging process after shutdown. The water mole fractions of different interfaces in GDL and PEM for cell voltage = 0.5 V are depicted in Figure 4. Critically, the water mole fraction in PEM is closely related to the water concentration gradient between the two domains. As shown in Figure 4a, the liquid water concentration at the inlet and outlet ends of PEM is 0.26 and 0.50 in case A3, respectively. The water distribution in the membrane has an inflection point at a position of x = 0.003 m, after which the concentration change rate sharply decreases due to a reduction in the water concentration difference on both sides. For case B3, as shown in Figure 4b, the liquid water concentration at the inlet and outlet sides increased to 0.44 and 0.55, respectively, and there was no increase after the point of x = 0.012 m. With a further increase in moisture content at the inlet, as shown in Figure 4c, the water mole fraction at the outlet remains almost unchanged, while the water mole fraction at the inlet increases to 0.49. Meanwhile, the water mole fraction in the PEM shows no further increase after x = 0.009 m.
The influence of inlet velocity on the concentration difference of the water mole fraction between the cathode and anode is opposite to that of the moisture content. Figure 5b displays water mole fraction curves for ξ = 2, which increase along the flow direction, and the absolute difference between the inlet and outlet side of the water mole fraction in the membrane is less than that in other cases. It can be found that the water mole fraction in PEM at the outlet end (0.51) is 7.84% lower than that at the ξ of 1 (In Figure 5a). Continuing the increase in the inlet velocity can further reduce the water mole fraction at both components, as depicted in Figure 5c. Since the increase in velocity in the flow channel can cause water in the porous medium to be discharged outward under a greater capillary driving effect, the water mole fraction in the inlet section is significantly reduced. Nevertheless, the water mole fraction increases only by 0.03 in the region of x from 0.007 m to 0.02 m, which is extremely small compared with the previous region, which increased by 0.21 from 0 m to 0.007 m. The results indicated that the influence of back diffusion on the water distribution is dominant compared with other mechanisms of water transport in membranes.

3.3. Purging Strategy under Different Initial Distribution Conditions

3.3.1. Model Validation

In order to verify this model, the volume average high frequency resistance (HFR) is usually used as an indicator for monitoring the water content of the membrane in PEM in the experiment, which can be calculated by the following formula:
t p e m H F R = 1 V p e m 1 σ p e m e f f d V p e m
where t pem and V pem refer to the thickness and volume of PEM, respectively. The HFR evolution predicted by this mathematical model is compared with an experiment conducted by Tajiri et al. [39]. The verification results are presented in Figure 6, and it can be observed from the figure that the predicted evolution characteristics of HFR are highly consistent with those in literature, which including slow rise, rapid rise, and membrane equilibrium periods [39].

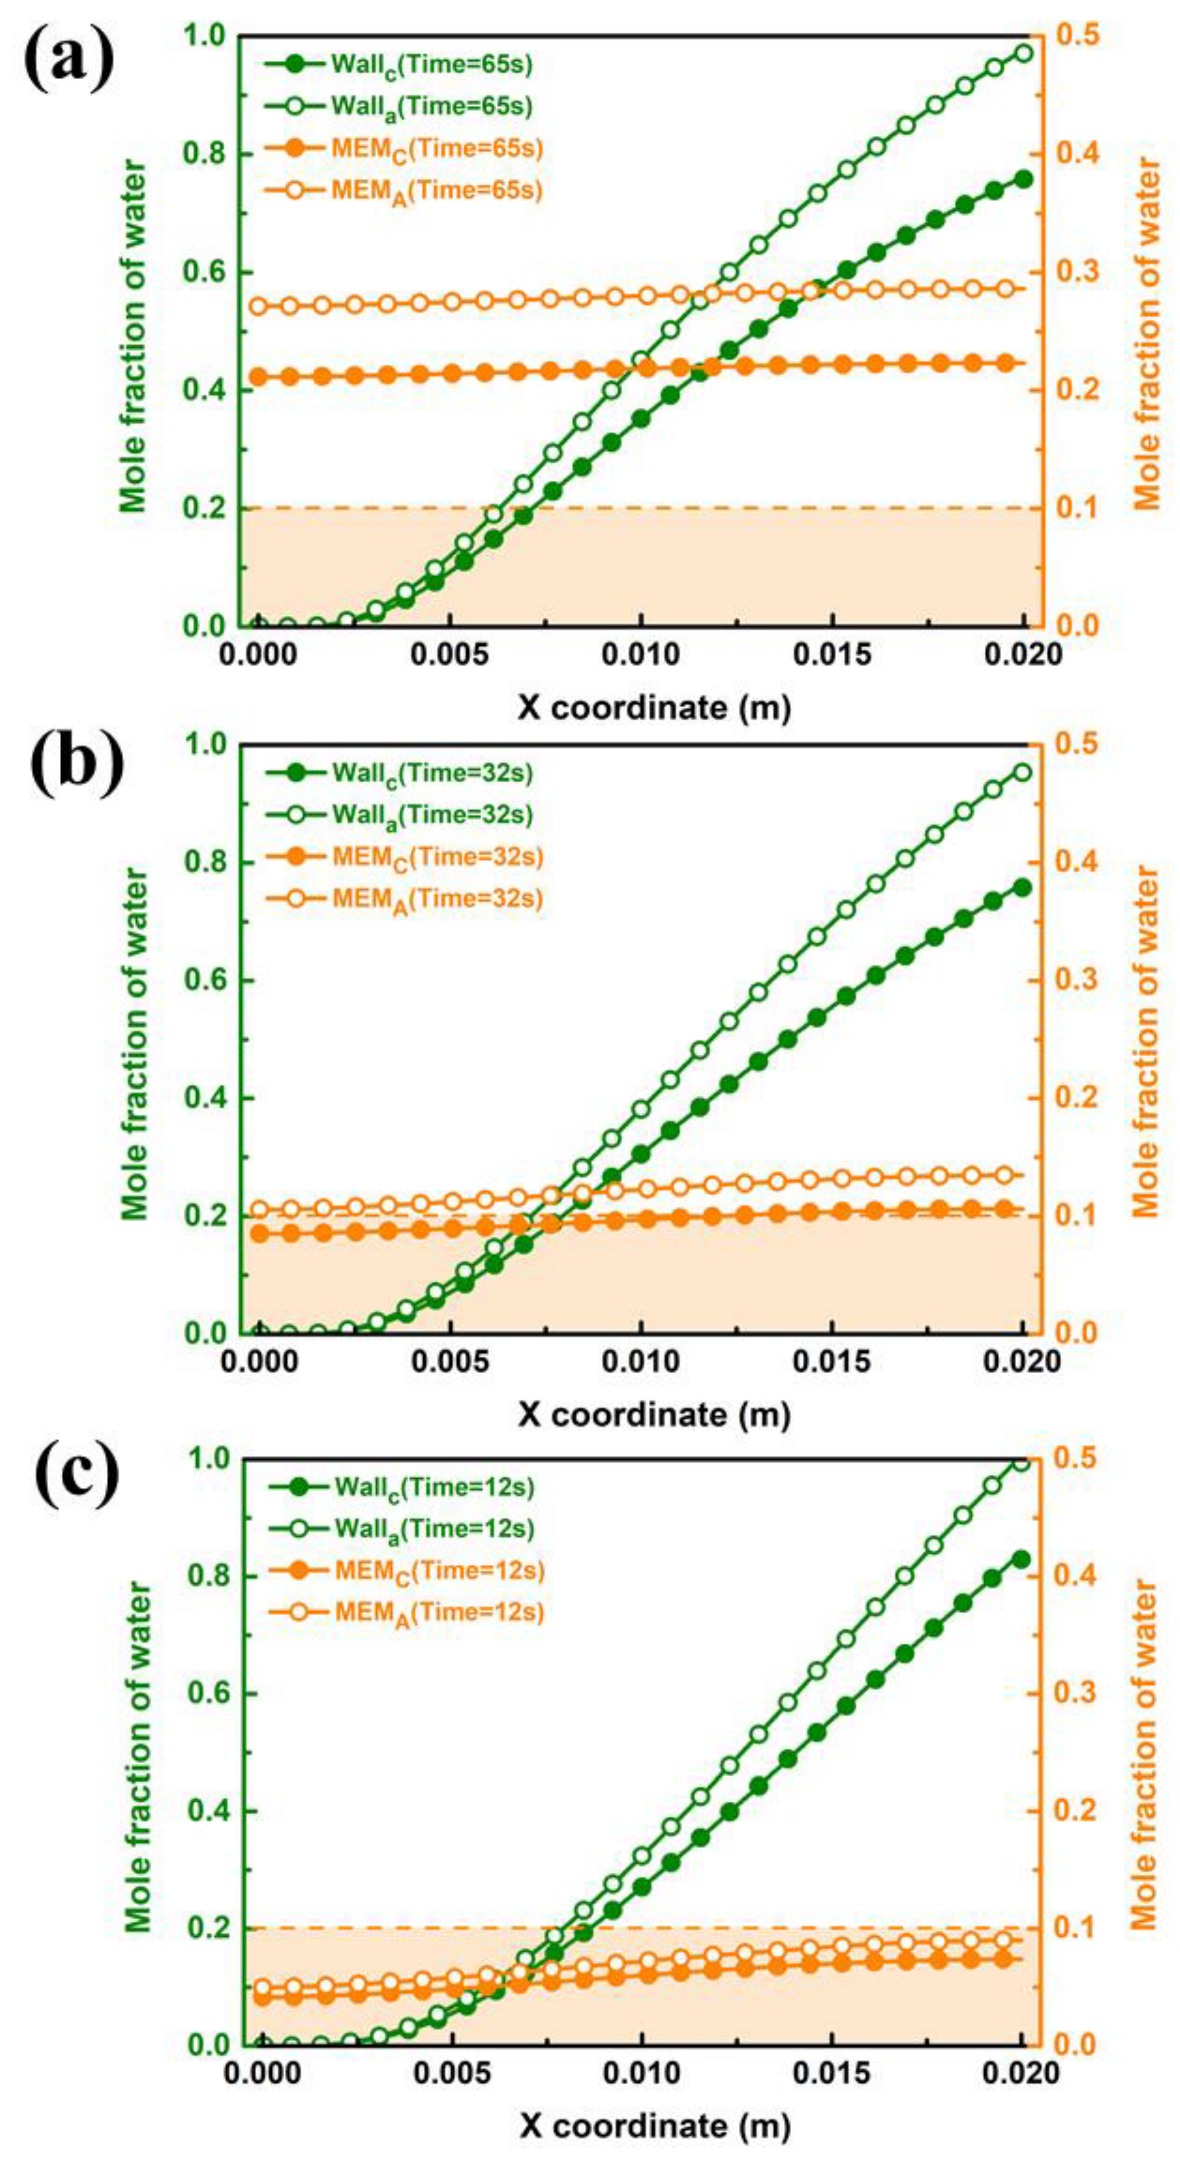
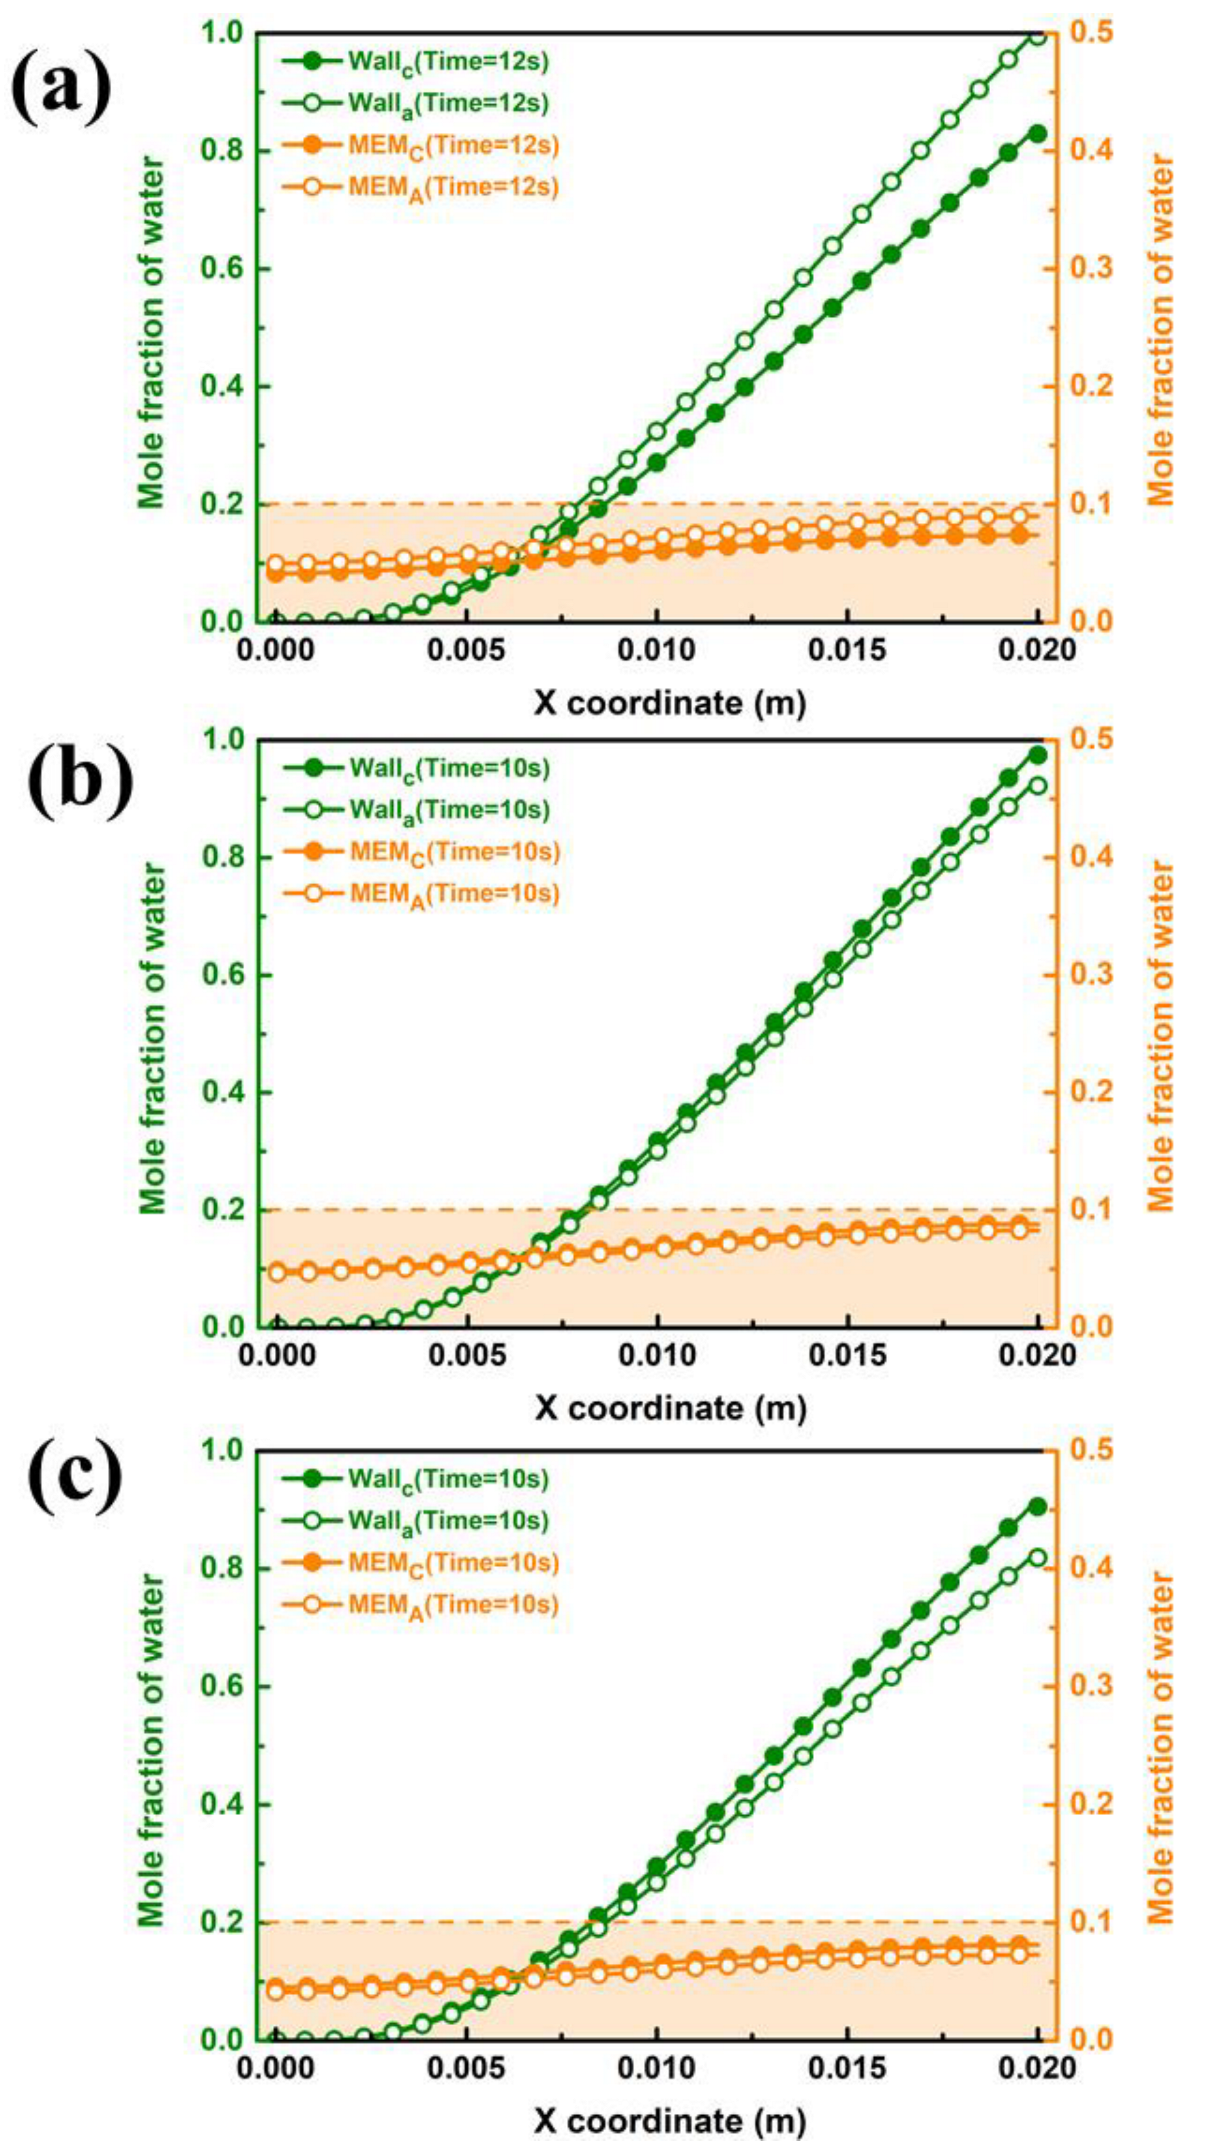
3.3.2. Characteristics of the Dryness Process in GC of Different Cases

It can be concluded from the previous analysis of electrochemical characteristics that the output power has a heat transfer coefficient of 50 W m−2 K−1, so the subsequent analysis is based on case B3, case B3-1, and case B3-2. In addition, nitrogen with a humidity of 40% is selected as the purging gas to ensure humidification in the membrane. Proton conductivity is influenced by water content in the proton exchange membrane because hydrophilic groups absorb water and the membrane has a certain water uptake value. Furthermore, the sulfonic acid groups can dissociate and produce protons only when the membrane is hydrated [40]. As is well known, the shorter the time required for shutdown and purging in a cold environment, the less likely a freezing procedure will occur in the PEMFC. Thus, the unsteady distribution of liquid water under different purge speeds is firstly analyzed in GC. Figure 7 plots the liquid water saturation distribution in the entire 2D model (as shown in Figure 1b) under different initial conditions with a purging speed and temperature of 0.5 ms−1 and 343 K, respectively. The results show that the water vapor of the purge gas contacting the inner wall surface tends towards condensation because the temperature of the channel is low after shutdown at the initial stage of the purge process. As the purging process continues, the liquid water is gradually taken away by the unsaturated gas and finally remains stable. However, it can be drawn from the analysis of stable liquid water saturation at every moment that the different initial water distribution in porous media has little effect on the condensed water in the channel. Therefore, the liquid water distribution on the wall of the GC in various cases is only related to the initial conditions of purge gas. It is noteworthy that regardless of the humidity of the inlet gas, the liquid water in GDL is carried away earlier than that in CL and PEM, which is consistent with previous research results [36].

3.3.3. Characteristics of the Dryness Process in GC of Different Cases

During the purging process of the PEMFC, the water in the GC and the porous media, such as GDL and CL, must be strictly removed to satisfy the request to eliminate ice blockage at low temperatures. Therefore, it is necessary to conduct a contrastive study on the liquid water distribution of both components. Figure 8 gives the end purge times for the inner wall of GC under case B3 for different purge temperatures. As shown in Figure 8a, it gradually condenses into liquid water and adheres to the wall surface along the flow direction at a purge temperature of 283 K because the inner wall surface of GC contains saturated water vapor. The liquid water on the wall surface of the outlet section accumulates the most seriously, which corresponds to the previous water distribution analysis. Owing to permeation under the effect of water concentration differences from the cathode to anode side after shutdown, the mole fraction of water in the anode during the purging is higher than that at the cathode side. It can be seen that after 65 s, the molar fraction of liquid water on the wall surface of the outlet part is lower than 1, which indicates that the considered water in GC is been drained up. Since there is no literature to specify the minimum value of water fraction in the porous medium during the purging process, the water proportion below 0.1 is taken as the maximum allowable value in this study. Notwithstanding, the mole fraction of water on the surface of the membrane is still at a high level for a purge time of 65 s. Figure 8b shows water distribution at a purge temperature of 313 K. The increasing purge temperature can significantly reduce drainage time in GC, and the molar concentration of water on the membrane surface decreases to below 0.1 at the cathode side. When the purge temperature is further increased to 343 K, as shown in Figure 8c, the drainage time in GC is shortened to 12 s, and the water fraction on the membrane surface by the cathode and anode sides is both less than 0.1. It can be concluded that the drainage process in GC is easier than that in porous medium. It is difficult to remove water in GDL and CL in a short period of time in a low-temperature environment. However, the increasing purge temperature can efficiently remove both the excess water on GC and the membrane surface in a short time.
The purge performance in different cases is shown in Figure 9. It can be illustrated from Figure 9b,c that the purge time of case B3-1 and case B3-2 is the same for 10 s, which is shorter than that of case B3, and the maximum mole water fraction of the inner wall surface of the GC and both sides of the membrane at the completion time is lower. Some difference from case B3 is be found that the water fraction on cathode side of case B3-1 and case B3-2 are higher than that on anode side. The reason can be found in Figure 7, which states that the water fractions in GDL and CL between the cathode and anode sides in case B3-1 and case B3-2 have little apparent difference. Therefore, less liquid water permeates from the cathode to the anode side during the shutdown purge process, and the water fraction on the cathode side is still higher than that on the anode side.

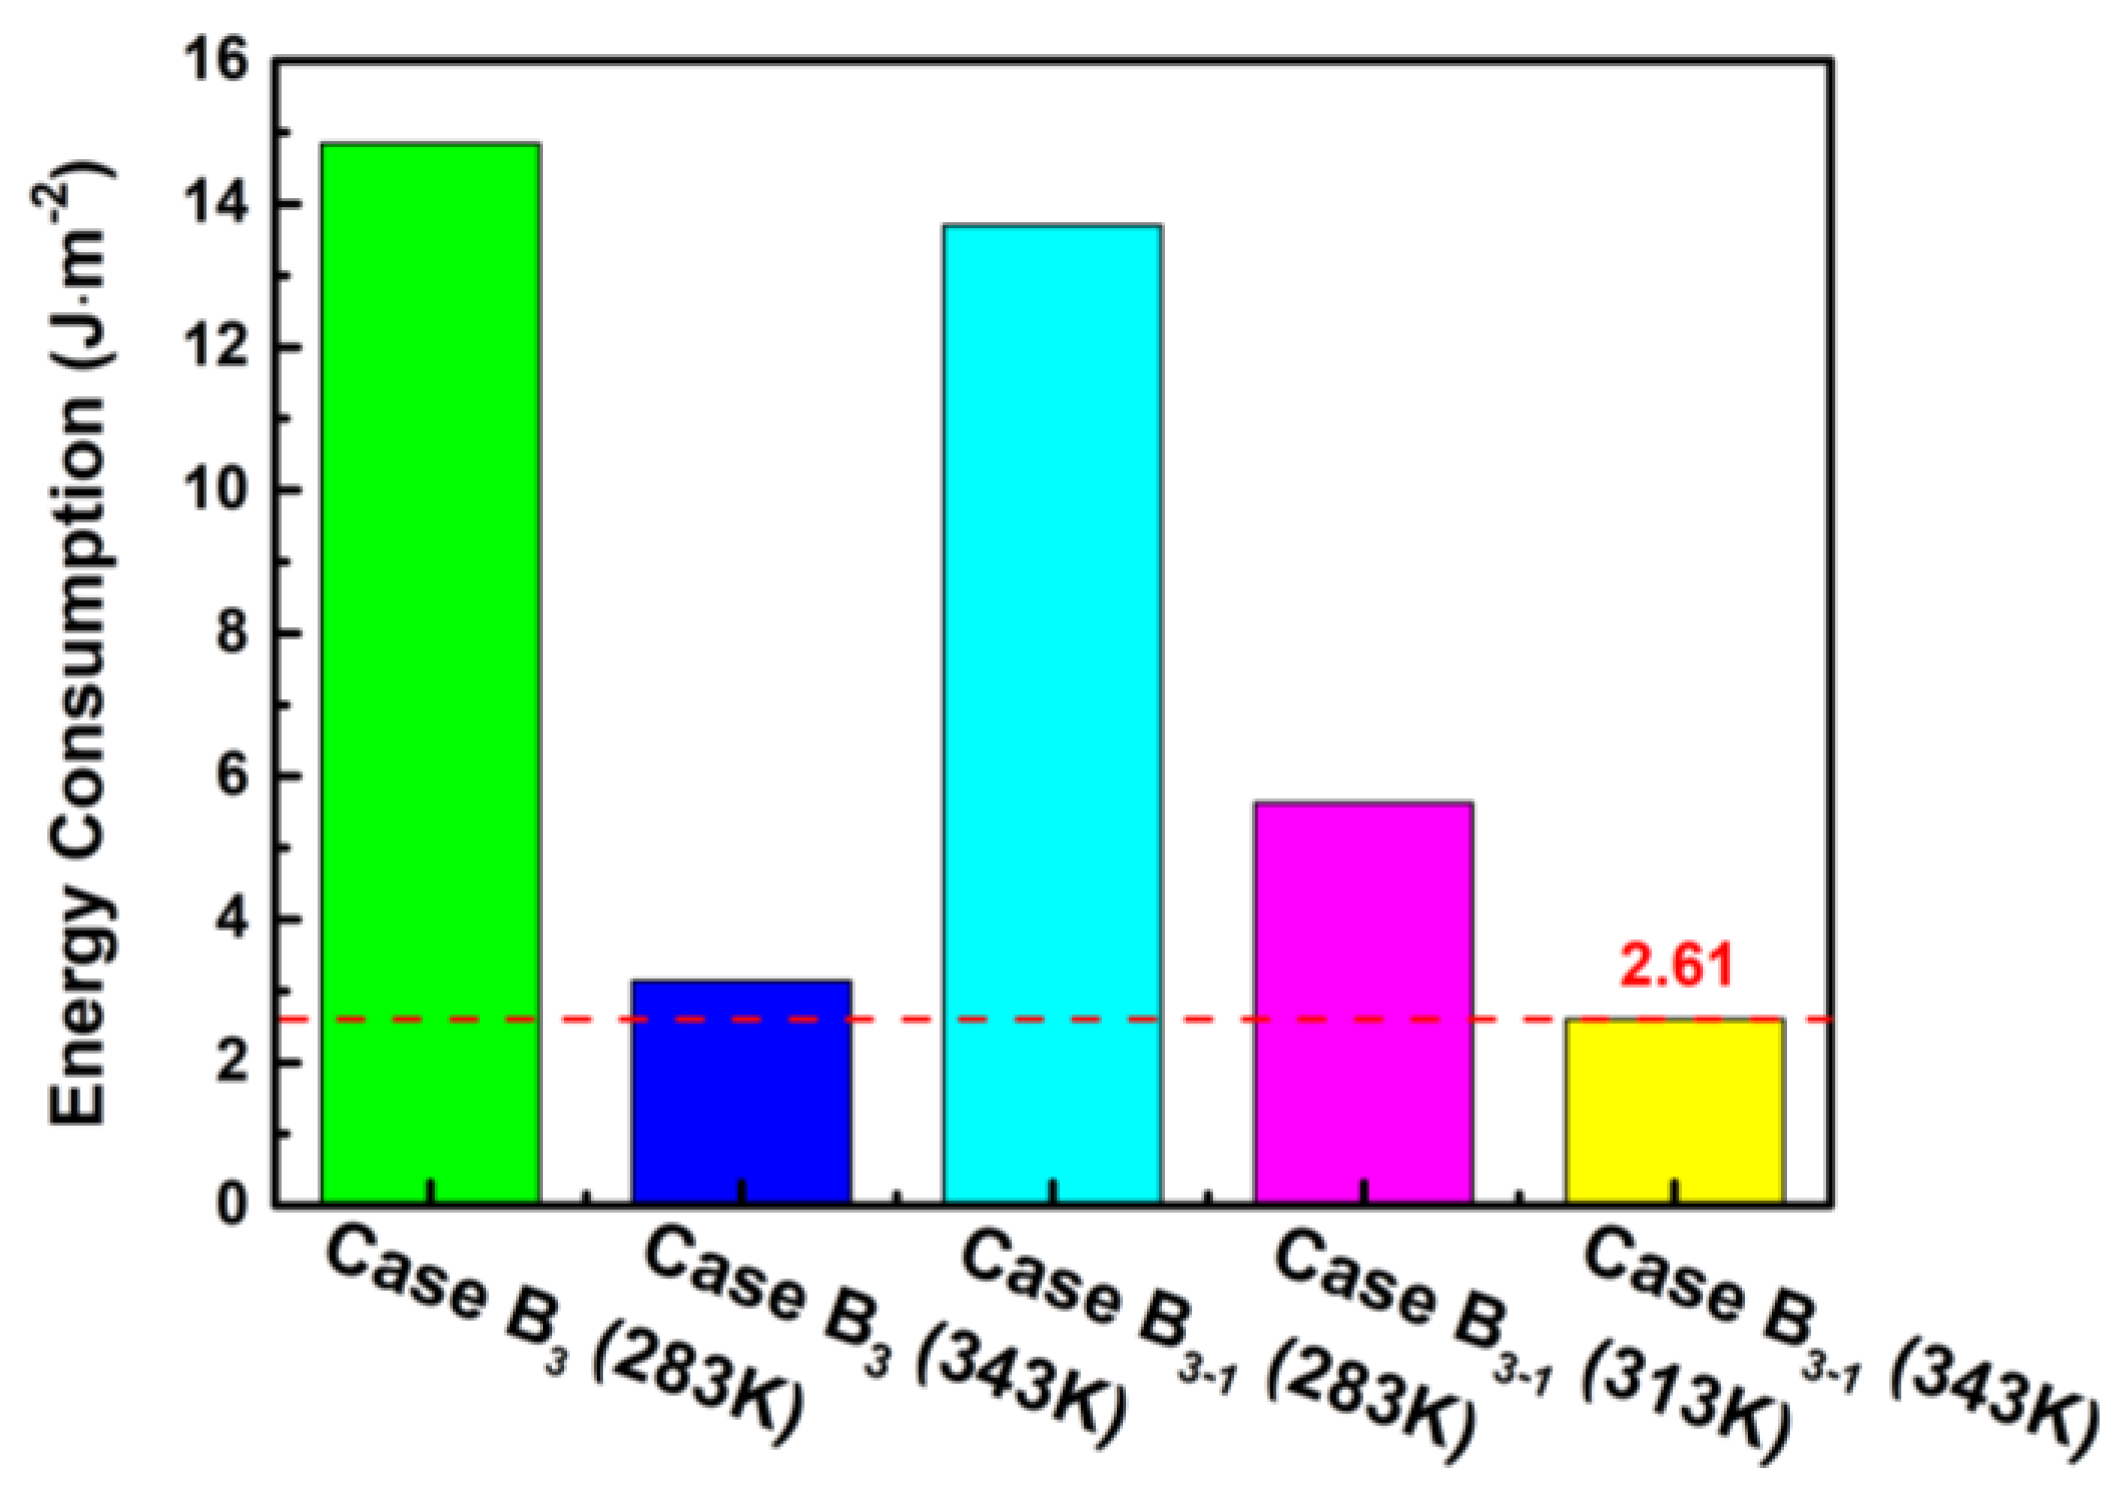
3.4. Analysis of Energy Consumption under Different Purge Conditions

Shutdown purging in cold environments is more energy consuming compared with room temperature environments. Therefore, it is crucially important to analyze the power consumption during gas purges in different cases. Based on the above analysis, the effective purge time in case B3 is summarized by 143 s for a temperature of 283 K and 12 s for a temperature of 343 K. Likewise, the effective purge time in case B3-1 is obtained in 132 s, 31 s, and 10 s for the temperatures of 283 K, 313 K, and 343 K, respectively. Due to a small pressure drop in GC, the compression power and pumping power are ignored, and only energy from the purge gas heating from the ambient temperature is considered. The energy consumption for purging gas is calculated as follows:
W E C = 2 ρ p u r g e u p u r g e A C p T i n T e x t t p u r g e
where C p is the specific heat capacity purging gas. ρ p u r g e and u p u r g e are density and purge speed of the purging gas. t p u r g e denotes to the purging time. A is the cross-sectional area of GC.
From Figure 10, it can be observed that the energy consumption gradually decreases with the increase in the purge temperature, especially in the stage where the purge temperature rises from 283 K to 313 K for the case B3-1. Moreover, the energy consumption of case B3-1 is lower under the same purge temperature compared with other cases, and the lowest value of 2.61 J m−2 is observed at the purge temperature of 343 K by a lower limit time of 10 s. It can be concluded that although the raising purge temperature can increase the temperature difference from the ambient, it can greatly shorten the purge time and therefore decrease the total energy consumption. Thus, operating conditions by case B3-1 in a subzero environment can not only achieve the best output power performance but can also improve the drainage effectiveness during the shutdown and purge process.

4. Conclusions

The steady electrochemical model, which also includes the heat transfer and phase change and transient purge model, is built to examine gas purging in PEMFC under different distributions of initial water. The sensitivities of parameters such as gas flow rate, relative humidity, heat transfer coefficient, and inlet temperature are comprehensively considered to study the output power efficiency and water removal performance. The characteristics of the water mole fraction and content change have been predicted. The limited purge time and energy consumption are adopted to investigate the purging performance on various cases. The main conclusions are as follows:
1. The poor heat transfer conditions on the boundary are not conducive to improving the output performance of the PEMFC, even in the severely cold environment. Furthermore, the high humidity of the inlet gas is an impediment to ameliorating the performance of a PEMFC in a sub-zero temperature environment with the obvious polarization of concentration. After comprehensive comparison, it is concluded that the optimal case is obtained by B3-1 with power density of 0.796 W cm−2, and the power density increases first and then decreases with ξ changes.
2. The steady-state water distribution is different under different electrochemical reaction intensities, and the overall water mole fraction gradually decreases with the rise of ξ. Importantly, the water mole fraction in the PEM is closely related to the water concentration gradient between the two domains. However, the increase in the inlet velocity can further reduce the water mole fraction at both cathode and anode, especially in the inlet section.
3. It can be concluded from the analysis that the different initial water distributions in porous media have little effect on the condensed water in the channel, and the liquid water in GDL is carried away earlier than that in CL and PEM. Furthermore, the water can be purged out of the GC more effectively by increasing the inlet speed and temperature of the purge gas.
4. The accumulation of liquid water on the wall surface of the outlet section is the most significant, but the drainage process in the GC is smoother than that in the porous medium. Interestingly, the mole fraction of water in the anode during purging is higher than that at the cathode side in B3 but lower in B3-1 and B3-2. Moreover, increasing the purge temperature can also efficiently remove the excess water on GDL and CL in a short time.
5. The purge time of each component is shortened with the increase in purge temperature. It is noteworthy that the lower limit time in GDL and CL is shorter than the superior limit time of PEM, and it is impossible to purge effectively for the components under the enough water content of proton conduction in case B3-2. Correspondingly, the operating condition in case B3-1 is evaluated as the best strategy based on the output performance and economic analysis during the shutdown and purge processes.

Author Contributions

Methodology, S.C.; software, A.T.; writing—review and editing, C.H. All authors have read and agreed to the published version of the manuscript.

Funding

This research was funded by Open Foundation of Hubei Key Laboratory for High-efficiency Utilization of Solar Energy and Operation Control of Energy Storage System, grant number HBSEES202216 and HBSKF202105 (Chaoling Han and Aina Tian), Open Foundation of Hubei Key Laboratory for High-efficiency Utilization of Solar Energy and Operation Control of Energy Storage System, grant number HBSEES202004 and HBSEES202105 (Aina Tian).

Data Availability Statement

Not applicable.

Conflicts of Interest

The authors declare no conflict of interest.

Nomenclature

Aarea, m2
cmolar concentration, mol m−3
Ddiffusion coefficient, m2 s−1
FFaraday’s constant, C mol−1
hheat transfer coefficient, W m−2 K−1
jreference exchange current density, A m−2
Icell current density, A m−2
kthermal conductivity, W m−1 K−1
Mmolar mass, kg mol−1
ppressure, Pa
Runiversal gas constant, 8.314 J mol−1 K−1
sliquid water saturation
Ssource term of governing equations
ttime, s
Ttemperature, K
Jmolar flow, mol m−2 s−1
uvelocity vector, m s−1
x, y, zcoordinate, m
ispecies
Abbreviations
satsaturated
refreference
effeffective
eqequilibrium
clcatalytic layer
gcgas channel
gdlgas diffusion layer
pemproton exchange membrane
ohmohmic heat
EWequivalent weight, kg mol−1
l−vliquid to vapour
cl→gdlcatalytic layer to gas diffusion layer
PEMFCproton exchange membrane fuel cell
Greek Symbols
α transfer coefficient
ε porosity
ξ stoichiometric flow ratio
η overpotential, V
λ membrane water content
γ concentration index
μ viscosity, kg m−1 s−1
ρ density, kg m−3
σ electrical conductivity, S m−1
δ thickness, m
β resistance coefficient, kg−1 m4
φ volume fraction of polymer
ϕ potential, V
Superscripts
aanode
ccathode
ininlet
extexternal

References

  1. Sun, C.Y.; Zhang, H. Review of the development of first-generation redox flow batteries: Iron-chromium system. ChemSusChem 2022, 15, e202101798. [Google Scholar] [CrossRef] [PubMed]
  2. Priya, K.; Sathishkumar, K.; Rajasekar, N. A comprehensive review on parameter estimation techniques for Proton Exchange Membrane fuel cell modeling. Renew. Sustain. Energ. Rev. 2018, 93, 121–144. [Google Scholar] [CrossRef]
  3. Lu, X.Q.; Qu, Y.; Wang, Y.D.; Qin, C.; Liu, G. A comprehensive review on hybrid power system for PEMFC-HEV: Issues and strategies. Energy Convers. Manag. 2018, 171, 1273–1291. [Google Scholar] [CrossRef]
  4. Lei, L.; He, P.; He, P.; Tao, W.Q. A comparative study: The effect of current loading modes on the cold start-up process of PEMFC stack. Energy Convers. Manag. 2022, 251, 114991. [Google Scholar] [CrossRef]
  5. Wang, Y.; Sauer, D.U.; Koehne, S.; Ersoez, A. Dynamic modeling of high temperature PEM fuel cell start-up process. Int. J. Hydrogen Energy 2022, 251, 114991. [Google Scholar] [CrossRef]
  6. Kamal, R.; Chan, S.H. Sensitivity analysis of anode overpotential during start-up process of a high temperature proton exchange membrane fuel cell. Electrochim. Acta 2015, 176, 965–975. [Google Scholar] [CrossRef]
  7. Rajalakshmi, N.; Pandiyan, S.; Dhathathreyan, K.S. Design and development of modular fuel cell stacks for various applications. Int. J. Hydrogen Energy 2008, 33, 449–454. [Google Scholar] [CrossRef]
  8. Zhao, D.D.; Xia, L.; Dang, H.B.; Wu, Z.Z.; Li, H.Y. Design and control of air supply system for PEMFC UAV based on dynamic decoupling strategy. Energy Convers. Manag. 2022, 253, 115159. [Google Scholar] [CrossRef]
  9. Hu, D.H.; Wang, Y.T.; Li, J.W.; Yang, Q.Q.; Wang, J. Investigation of optimal operating temperature for the PEMFC and its tracking control for energy saving in vehicle applications. Energy Convers. Manag. 2021, 249, 114842. [Google Scholar] [CrossRef]
  10. Lee, K.; Han, G.; Cho, S.; Bae, J. Pressurized diesel fuel processing using hydrogen peroxide for the fuel cell power unit in low-oxygen environments. J. Power Sources 2018, 380, 37–45. [Google Scholar] [CrossRef]
  11. Han, G.; Kwon, Y.; Kim, J.B.; Lee, S.; Bae, J.; Cho, E.; Lee, B.J.; Cho, S.; Park, J. Development of a high-energy-density portable/mobile hydrogen energy storage system incorporating an electrolyzer, a metal hydride and a fuel cell. Appl. Energy 2020, 259, 114175. [Google Scholar] [CrossRef]
  12. Chaparro, A.M.; Ferreira-Aparicio, P.; Folgado, M.A.; Hubscher, R.; Lange, C.; Weber, N. Thermal neutron radiography of a passive proton exchange membrane fuel cell for portable hydrogen energy systems. J. Power Sources 2020, 480, 228668. [Google Scholar] [CrossRef]
  13. Lin, R.; Weng, Y.M.; Lin, X.W.; Xiong, F. Rapid cold start of proton exchange membrane fuel cells by the printed circuit board technology. Int. J. Hydrogen Energy 2014, 39, 18369–18378. [Google Scholar] [CrossRef]
  14. Jiao, K.; Li, X.G. Water transport in polymer electrolyte membrane fuel cells. Prog. Energy Combust. 2011, 37, 221–291. [Google Scholar] [CrossRef]
  15. Liao, Z.H.; Wei, L.; Dafalla, A.M.; Suo, Z.B.; Jiang, F.M. Numerical study of subfreezing temperature cold start of proton exchange membrane fuel cells with zigzag-channeled flow field. Int. J. Heat. Mass. Tran. 2021, 165, 120733. [Google Scholar] [CrossRef]
  16. Niu, H.P.; Ji, C.W.; Wang, S.F.; Shi, M.Y.; Zhang, H.L.; Liang, C. Analysis of the cold start behavior of a polymer electrolyte membrane fuel cell in constant power start-up mode. Int. J. Energy Res. 2021, 45, 19245–19264. [Google Scholar] [CrossRef]
  17. Lin, R.; Zhong, D.; Lan, S.B.; Guo, R.; Ma, Y.Y.; Cai, X. Experimental validation for enhancement of PEMFC cold start performance: Based on the optimization of micro porous layer. Appl. Energy 2021, 300, 117306. [Google Scholar] [CrossRef]
  18. Huo, S.; Li, L.C.; Shi, W.Y.; Wang, R.F.; Lu, B.B.; Yin, Y.; Zhu, C.Y.; Wang, Y.; Jiao, K.; Hou, Z.J. Characteristics of cold start behavior of PEM fuel cell with metal foam as cathode flow field under subfreezing temperature. Int. J. Green Energy 2021, 18, 1129–1146. [Google Scholar] [CrossRef]
  19. Rios, G.M.; Schirmer, J.; Gentner, C.; Kallo, J. Efficient thermal management strategies for cold starts of a proton exchange membrane fuel cell system. Appl. Energy 2020, 279, 115813. [Google Scholar] [CrossRef]
  20. Himanen, O.; Hottinen, T.; Tuurala, S. Operation of a planar free-breathing PEMFC in a dead-end mode. Electorchem. Commun. 2007, 9, 891–894. [Google Scholar] [CrossRef]
  21. Liu, Z.Y.; Chen, J.; Liu, H.; Yan, C.Z.; Hou, Y.; He, Q.G.; Zhang, J.J.; Hissel, D. Anode purge management for hydrogen utilization and stack durability improvement of PEM fuel cell systems. Appl. Energy 2020, 275, 115110. [Google Scholar] [CrossRef]
  22. Lin, Y.F.; Chen, Y.S. Experimental study on the optimal purge duration of a proton exchange membrane fuel cell with a dead-ended anode. J. Power Sources 2017, 340, 176–182. [Google Scholar] [CrossRef]
  23. Cannio, M.; Righi, S.; Santangelo, P.E.; Romagnoli, M.; Pedicini, R.; Carbone, A.; Gatto, I. Smart catalyst deposition by 3D printing for Polymer Electrolyte Membrane Fuel Cell manufacturing. Renew. Energy 2021, 163, 414–422. [Google Scholar] [CrossRef]
  24. Luo, Y.; Jiao, K. Cold start of proton exchange membrane fuel cell. Prog. Energy Combust. Sci. 2018, 64, 29–61. [Google Scholar] [CrossRef]
  25. Yang, W.W.; Zhao, T.S.; Chen, R.; Xu, C. An approach for determining the liquid water distribution in a liquid-feed direct methanol fuel cell. J. Power Sources 2009, 190, 216–222. [Google Scholar] [CrossRef]
  26. He, Y.L.; Miao, Z.; Zhao, T.S.; Yang, W.W. Numerical study of the effect of the GDL structure on water crossover in a direct methanol fuel cell. Int. J. Hydrogen Energy 2012, 37, 4422–4438. [Google Scholar] [CrossRef]
  27. Kang, S. Quasi-three dimensional dynamic modeling of a proton exchange membrane fuel cell with consideration of two-phase water transport through a gas diffusion layer. Energy 2015, 90, 1388–1400. [Google Scholar] [CrossRef]
  28. Chen, X.; Xu, J.H.; Liu, Q.; Chen, Y.; Wang, X.D.; Li, W.B.; Ding, Y.J.; Wan, Z.M. Active disturbance rejection control strategy applied to cathode humidity control in PEMFC system. Energy Convers. Manag. 2021, 224, 113389. [Google Scholar] [CrossRef]
  29. Liu, S.H.; Chen, T.; Zhang, C.; Xie, Y. Study on the performance of proton exchange membrane fuel cell (PEMFC) with dead-ended anode in gravity environment. Appl. Energy 2020, 261, 114454. [Google Scholar] [CrossRef]
  30. Xie, Q.Z.; Zheng, M.G. CFD Simulation and Performance Investigation on a Novel Bionic Spider-Web-Type Flow Field for PEM Fuel Cells. Processes 2021, 9, 1526. [Google Scholar] [CrossRef]
  31. Yoo, B.; Lim, K.; Salihi, H.; Ju, H. A parametric study on the performance requirements of key fuel cell components for the realization of high-power automotive fuel cells. Int. J. Heat. Mass. Tran. 2022, 186, 122477. [Google Scholar] [CrossRef]
  32. Han, C.L.; Jiang, T.; Shang, K.; Xu, B.; Chen, Z.Q. Heat and mass transfer performance of proton exchange membrane fuel cells with electrode of anisotropic thermal conductivity. Int. J. Heat. Mass. Tran. 2022, 182, 121957. [Google Scholar] [CrossRef]
  33. Han, C.L.; Chen, Z.Q. Study on electrochemical and mass transfer coupling characteristics of proton exchange membrane (PEM) fuel cell based on a fin-like electrode surface. Int. J. Hydrogen Energy 2018, 43, 8026–8039. [Google Scholar] [CrossRef]
  34. Son, L.D.; Um, S.; Kim, Y.B. Effect of stacking pressure on the performance of polymer electrolyte membrane fuel cell with various channel types. Energy Convers. Manag. 2021, 232, 113803. [Google Scholar] [CrossRef]
  35. Yang, C.; Wan, Z.M.; Chen, X.; Kong, X.Z.; Zhang, J.; Huang, T.M.; Wang, X.D. Geometry optimization of a novel M-like flow field in a proton exchange membrane fuel cell. Energy Convers. Manag. 2021, 228, 113651. [Google Scholar] [CrossRef]
  36. Mu, Y.T.; He, P.; Ding, J.; Tao, W.Q. Modeling of the operation conditions on the gas purging performance of polymer electrolyte membrane fuel cells. Int. J. Hydrogen Energy 2017, 42, 11788–11802. [Google Scholar] [CrossRef]
  37. Wang, B.W.; Deng, H.; Jiao, K. Purge strategy optimization of proton exchange membrane fuel cell with anode recirculation. Appl. Energy 2018, 225, 1–13. [Google Scholar] [CrossRef]
  38. Shen, J.; Zeng, L.; Liu, Z.; Liu, W. Performance investigation of PEMFC with rectangle blockages in Gas Channel based on field synergy principle. Heat. Mass. Transfer. 2019, 55, 811–822. [Google Scholar] [CrossRef]
  39. Tajiri, K.; Wang, C.Y.; Tabuchi, Y. Water removal from a PEFC during gas purge. Electrochim. Acta 2008, 53, 6337–6343. [Google Scholar] [CrossRef]
  40. Sun, C.Y.; Negro, E.; Nale, A.; Pagot, G.; Vezzu, K.; Zawodzinski, T.A.; Meda, L.; Gambaro, C.; Di Noto, V. An efficient barrier toward vanadium crossover in redox flow batteries: The bilayer [Nafion/(WO3)(x)] hybrid inorganic-organic membrane. Electrochim. Acta 2021, 378, 138133. [Google Scholar] [CrossRef]
Figure 1. Schematic diagram of (a) water transport process in PEMFC during electrochemical reaction and (b) mesh system of computational domain.
Processes 11 00290 g001
Figure 2. Validation of the electrochemical model by comparing with the experimental results.
Processes 11 00290 g002
Figure 3. Effects of heat transfer coefficients or ξ on polarization curves under different moisture content of (a) 20%, (b,d) 60% and (c) 100%.
Processes 11 00290 g003
Figure 4. Variation of interface of membrane water mole fraction for cell voltage = 0.5 V by: (a) case A3, (b) case B3 (c) and case C3.
Processes 11 00290 g004
Figure 5. Variation of interface of membrane water mole fraction for cell voltage = 0.5 V by: (a) case B3 (b) case B3-1, (c) and case B3-2.
Processes 11 00290 g005
Figure 6. Verification of HFR in the membrane with time at 343 K.
Processes 11 00290 g006
Figure 7. Liquid water saturation distribution under different cases when the purge speed is 0.5 ms−1 and the temperature is 343 K: (a) case B3, (b) case B3-1 (c) and case B3-2.
Processes 11 00290 g007
Figure 8. Water distribution on the wall of GC and both sides of the membrane under case B3 by different purge temperatures: (a) 283 K, (b) 313 K and (c) 343 K.
Processes 11 00290 g008
Figure 9. Water distribution on the wall of GC and both sides of the membrane under purge temperature of 343 K by different Cases: (a) Case B3, (b) Case B3-1 and (c) Case B3-2.
Processes 11 00290 g009
Figure 10. Influence of the different cases on the energy consumption.
Processes 11 00290 g010
Table 1. Geometric parameters of the PEMFC.
ComponentH (mm)L (mm)
GC120
GDL0.3820
CL0.0520
PEM0.120
Table 2. Operation conditions and physical properties.
ParameterValueRef.
Inlet   mass   fraction   of   Hydrogen   w H 2 0.743[32]
Inlet   mass   fraction   of   Anode   water w H 2 0 0.257[32]
Inlet   mass   fraction   of   Oxygen   w O 2 0.228[32]
Inlet   mass   fraction   of   Nitrogen   w N 2 0.749[32]
Inlet   mass   fraction   of   Cathode   water   w H 2 0 0.023[32]
Reference   pressure   P P a 101,325[32]
GDL / CL   porosity   ε c l 0.5[35]
Thermal   conductivity   of   GDL   k g d l   Wm 1   K 1 1[36]
Thermal   conductivity   of   k p e m   Wm 1   K 1 0.95[36]
Conductivity   of   GDL   σ g d l S   m 1 222[32]
Conductivity   of   CL σ c l S   m 1 10,000[32]
Reference   hydrogen   and   oxygen   concentration   c H 2 r e f ; c O 2 r e f mol   m 3 41; 41[37]
Reference   exchange   current   density   of   anode   and   cathode   i 0 , a r e f ; i 0 , c r e f A   m 2 2000; 0.00001[37]
Table 3. Cases under different initial conditions for the electrochemical model.
h (W m−2K−1)103050100
Moisture   Content   ( % ) / ξ
20/1Case A1Case A2Case A3Case A4
60/1Case B1Case B2Case B3Case B4
100/1Case C1Case C2Case C3Case C4
60/2--Case B3-1-
60/5--Case B3-2-
60/10--Case B3-3-
Table 4. Variation of current density of Case B3 for different grid numbers.
Operating VoltageCurrent Density under Different Grid Numbers (A cm−2)
38,45648,30657,94465,342
0.8 V0.130.140.140.14
0.6 V0.960.991.011.01
0.4 V1.651.671.681.68
Disclaimer/Publisher’s Note: The statements, opinions and data contained in all publications are solely those of the individual author(s) and contributor(s) and not of MDPI and/or the editor(s). MDPI and/or the editor(s) disclaim responsibility for any injury to people or property resulting from any ideas, methods, instructions or products referred to in the content.

