
Study on Dynamic Failure Characteristics of Coal and Rock in Stope Induced by Dynamic Load of Steep Horizontal Sublevel Mining


Abstract
:1. Introduction
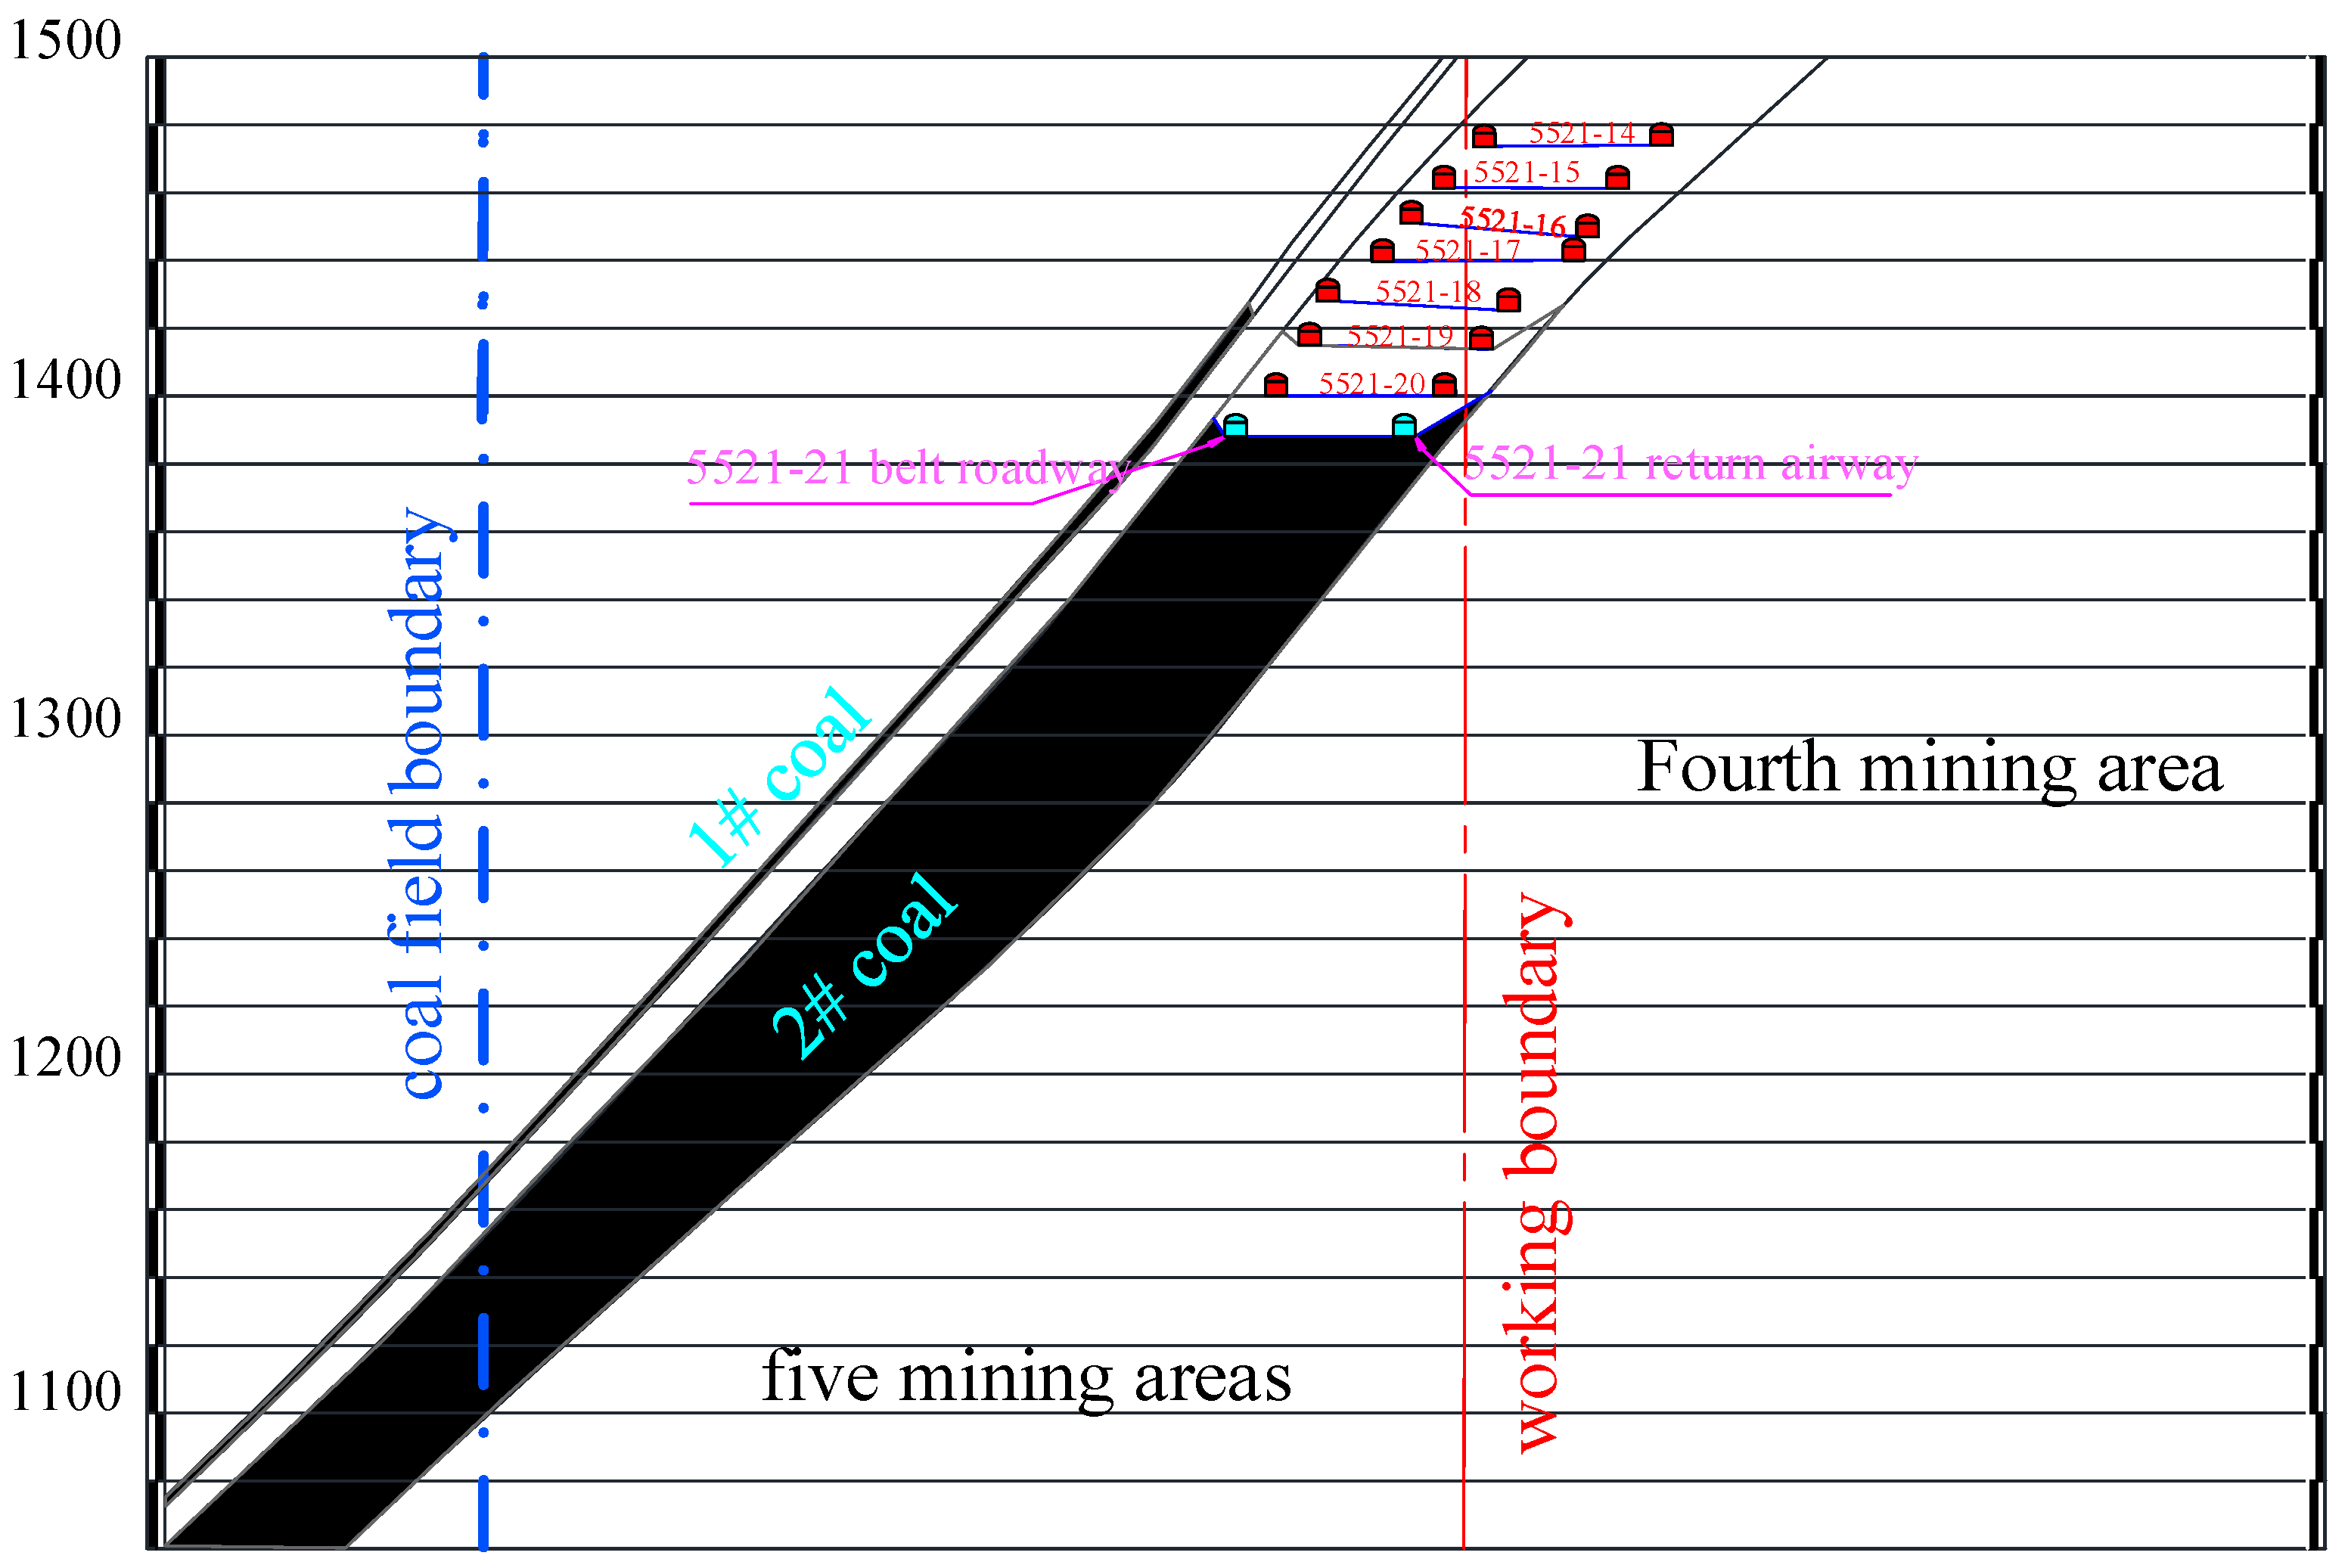
2. Mine Overview
3. Design of Similar Simulation Experiment Scheme for Dynamic Loading
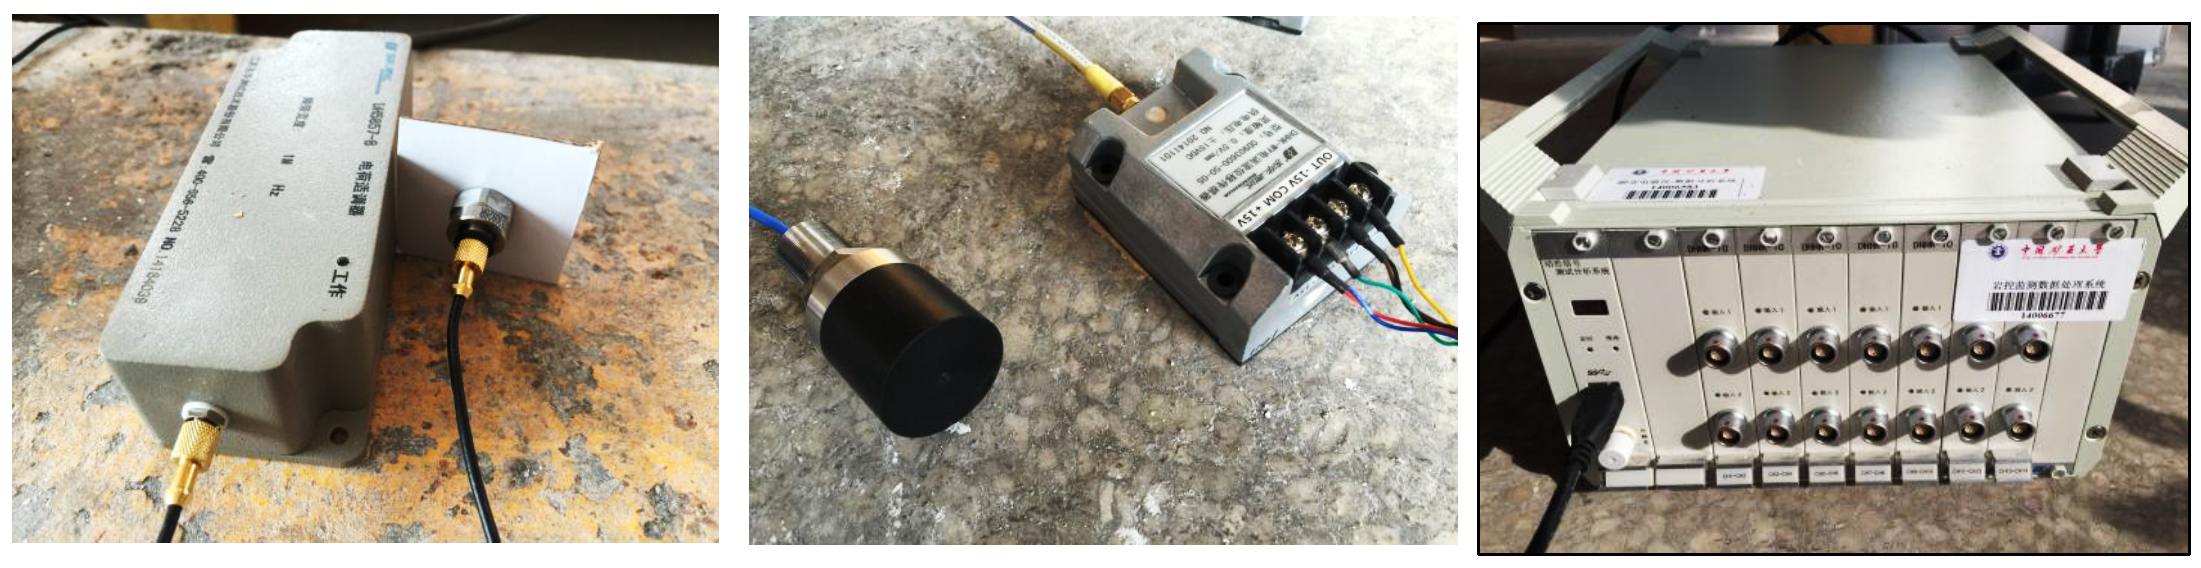
3.1. Test Set
3.2. Test Monitoring System
3.3. Test Dynamic Load Stress Wave Simulation
4. Analysis of Simulation Results of Dynamic Loading in Horizontal Sublevel Mining
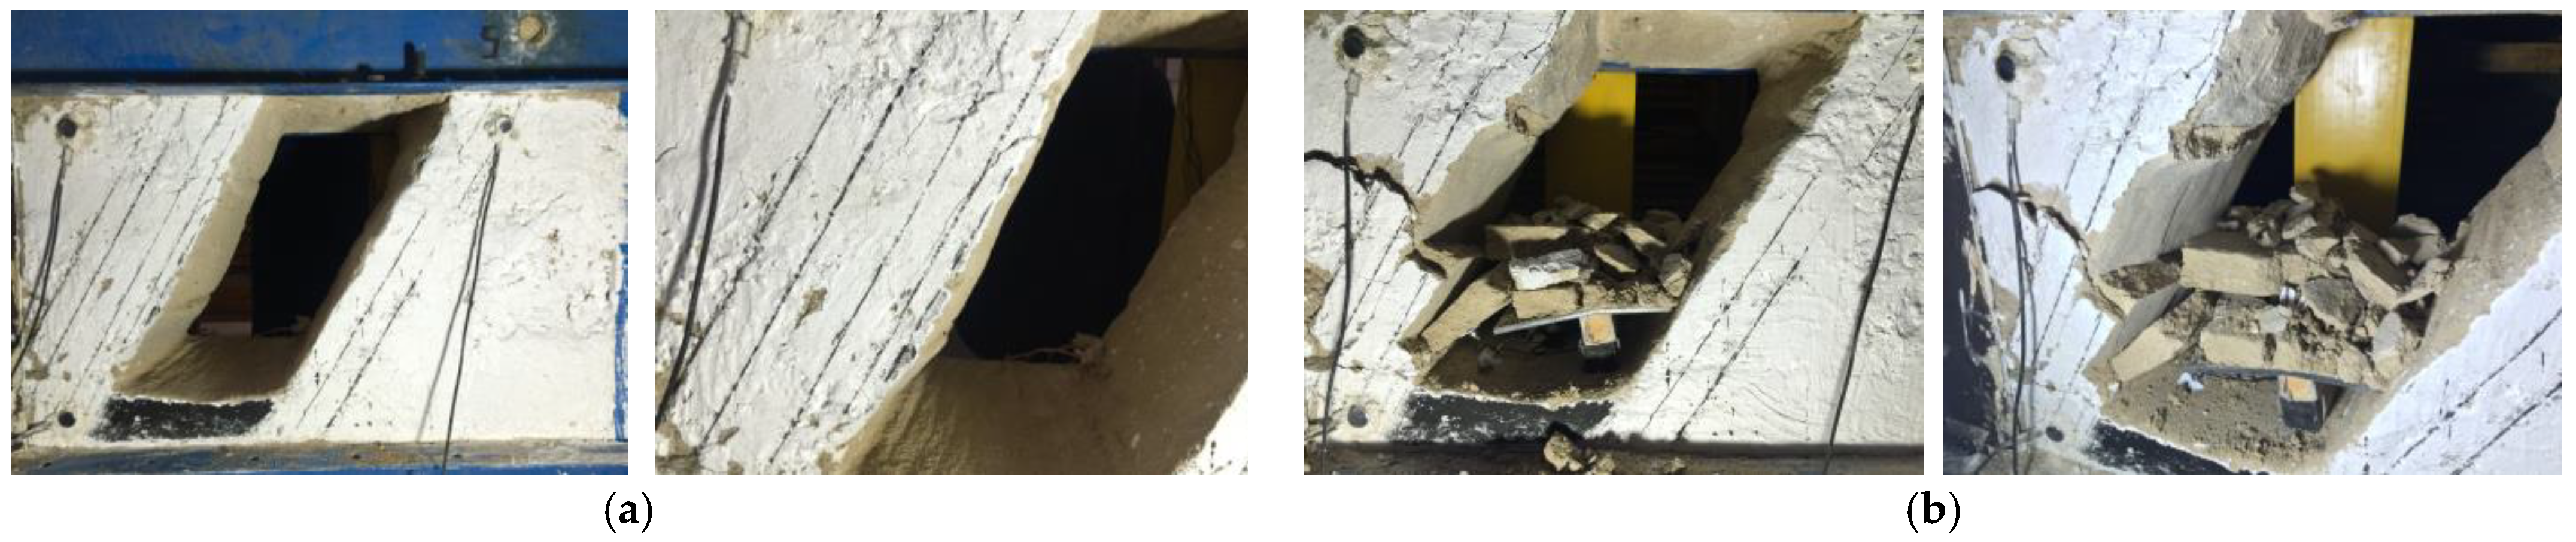
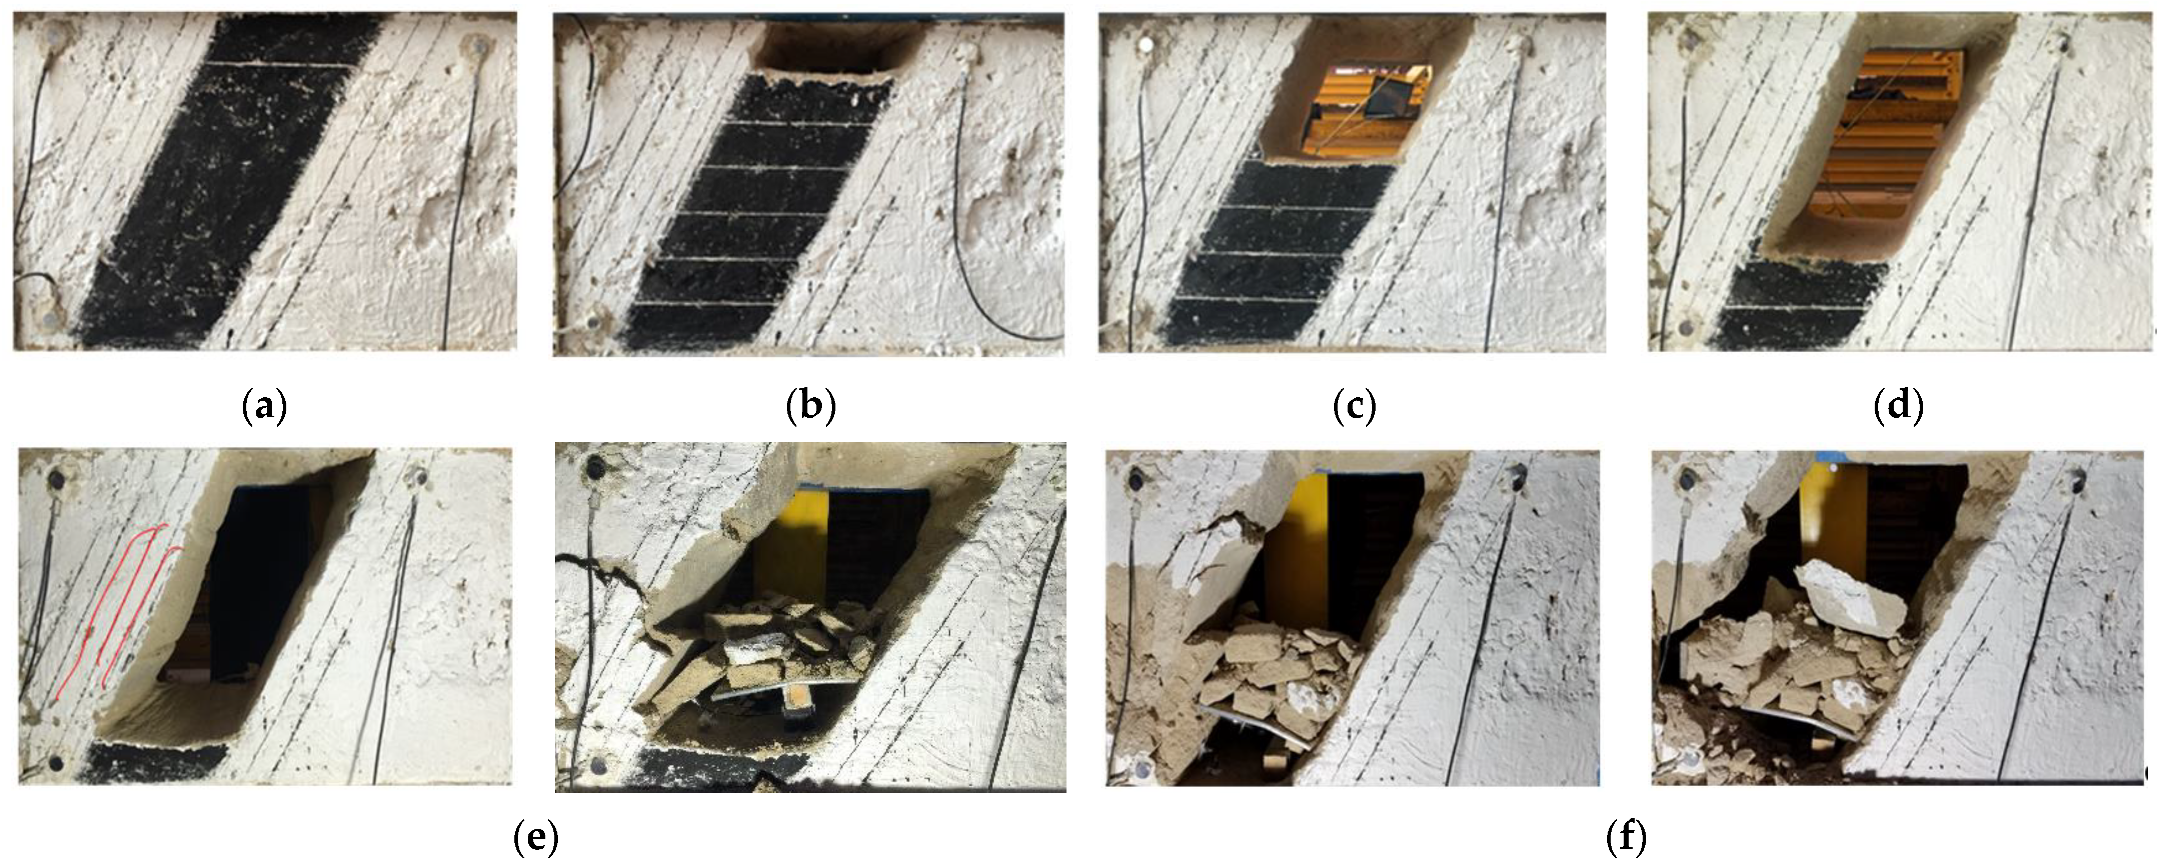
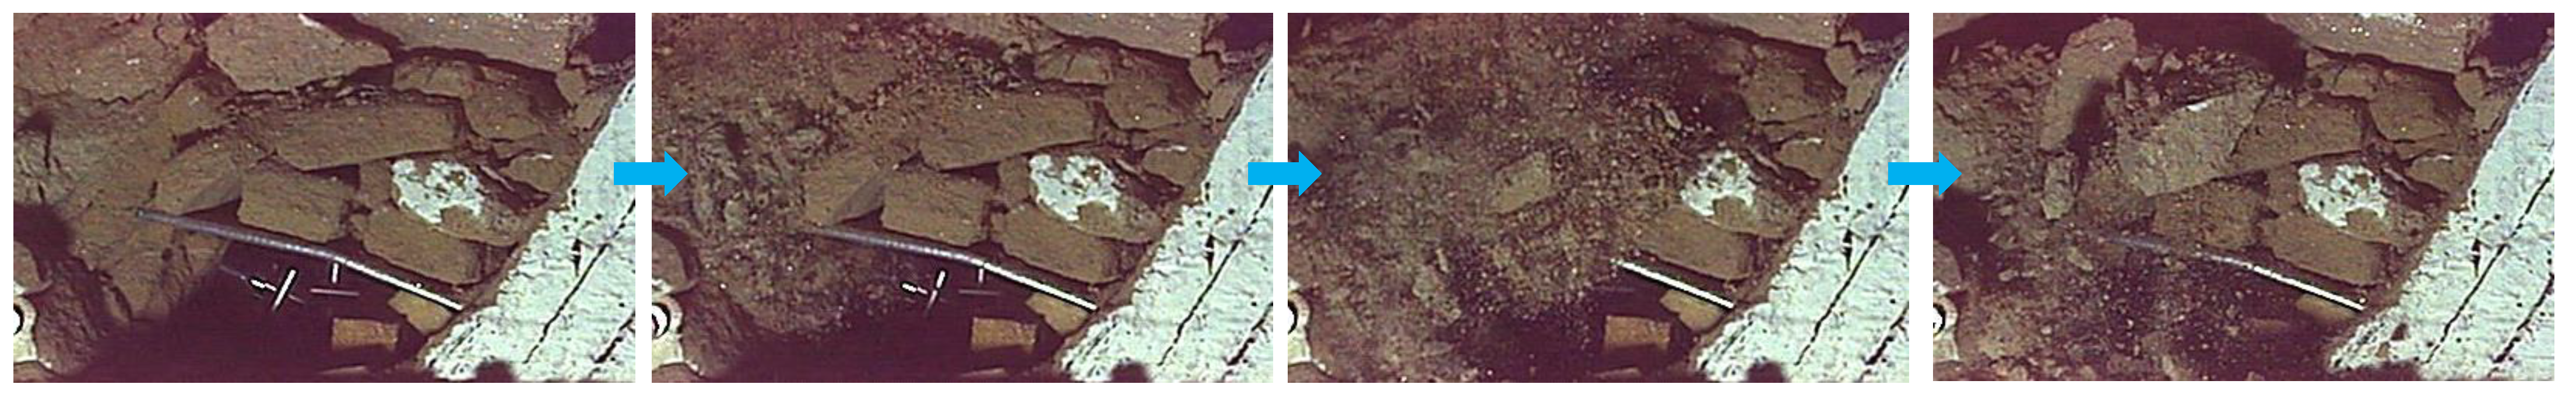
4.1. Analysis of Shock Manifestation Characteristics
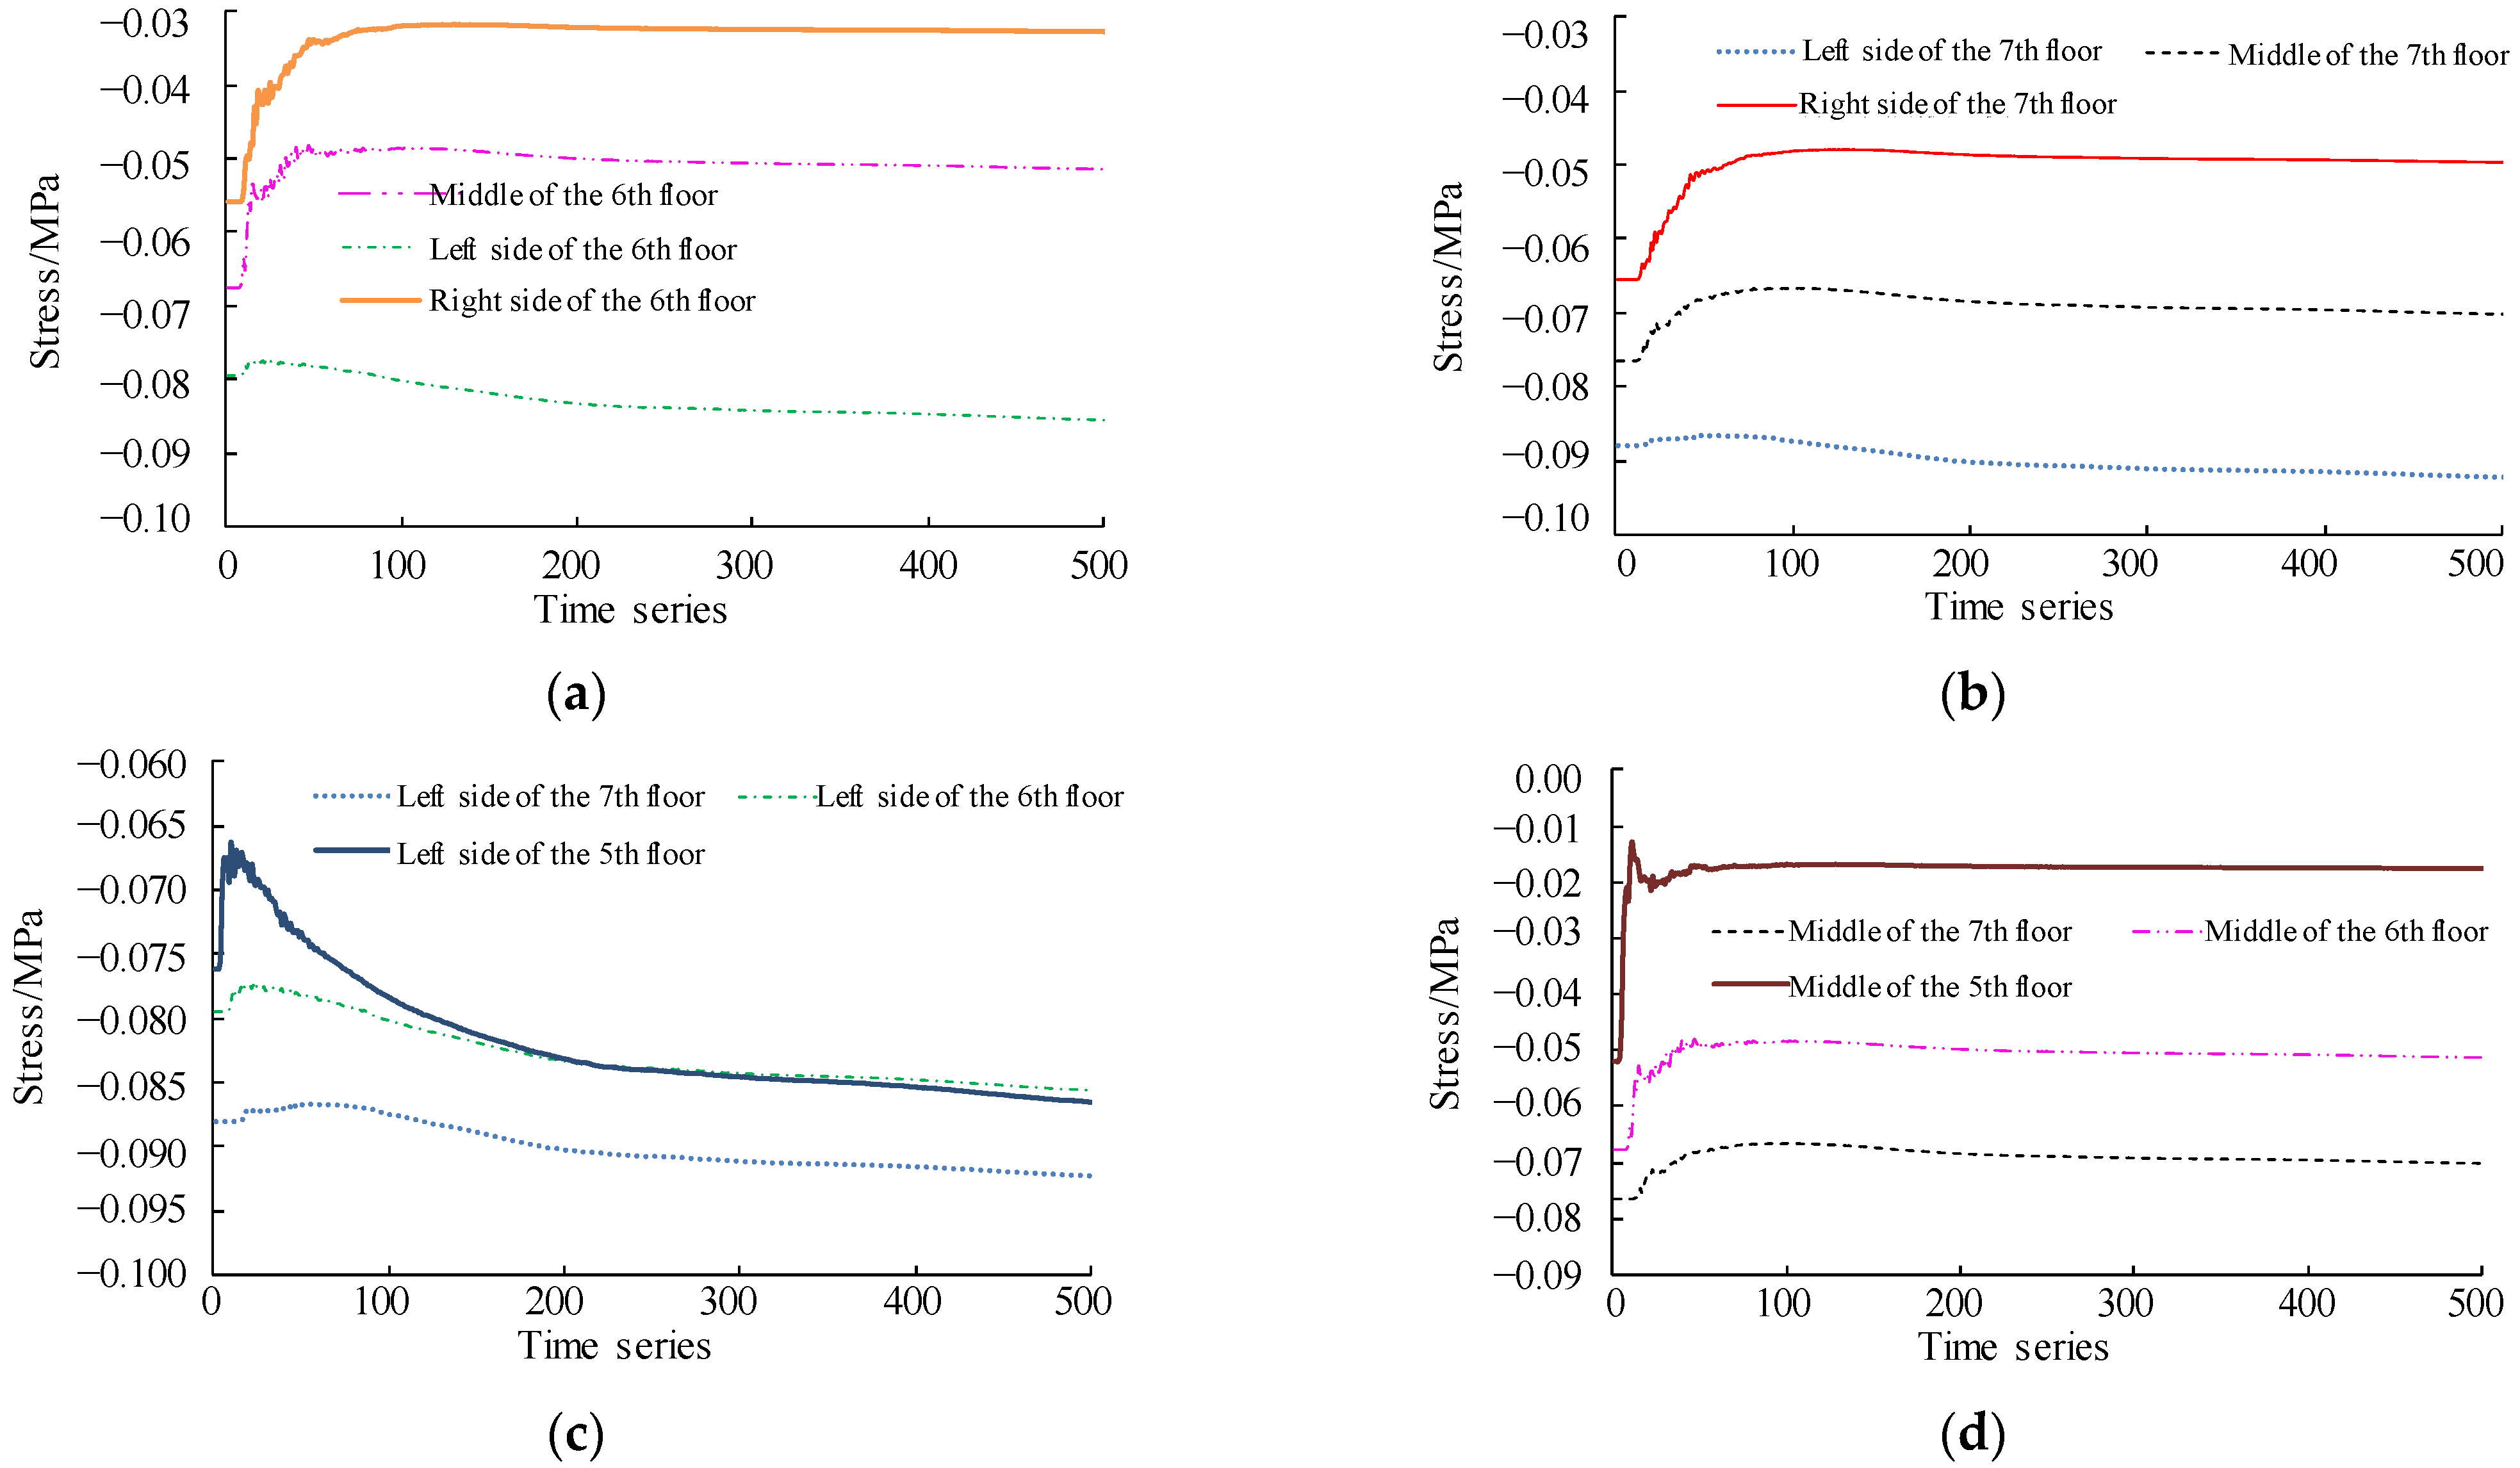
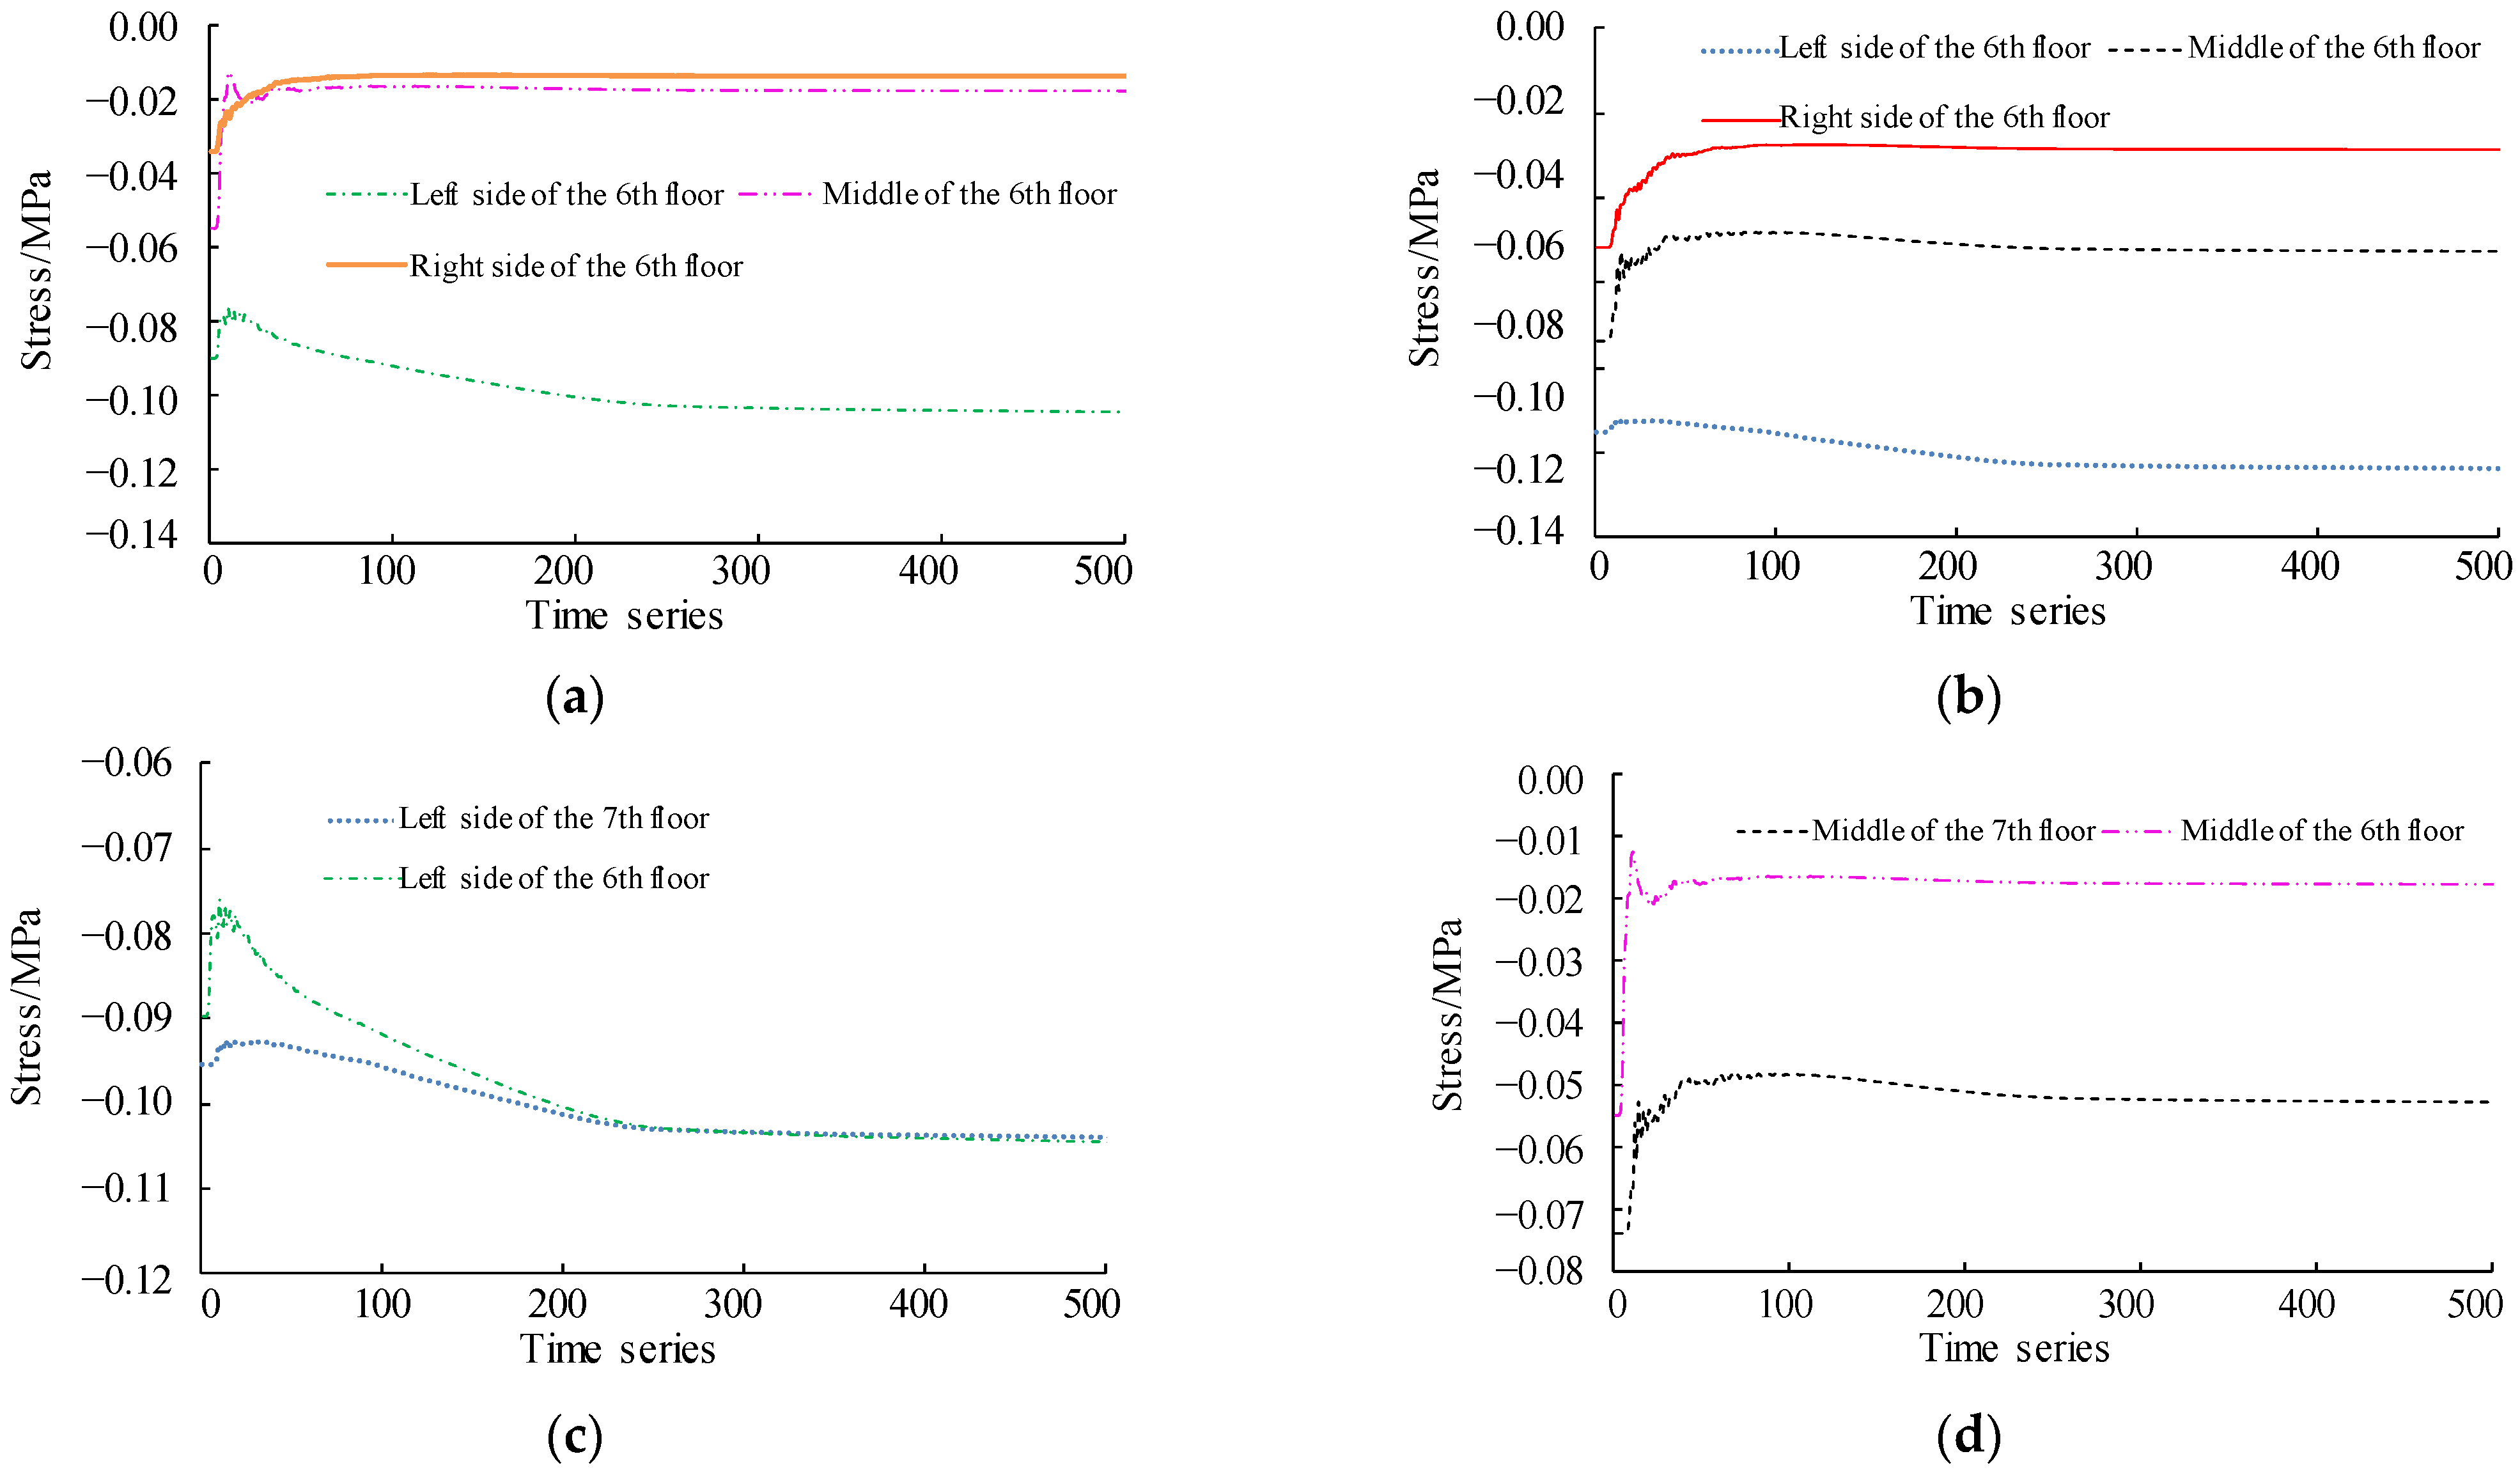
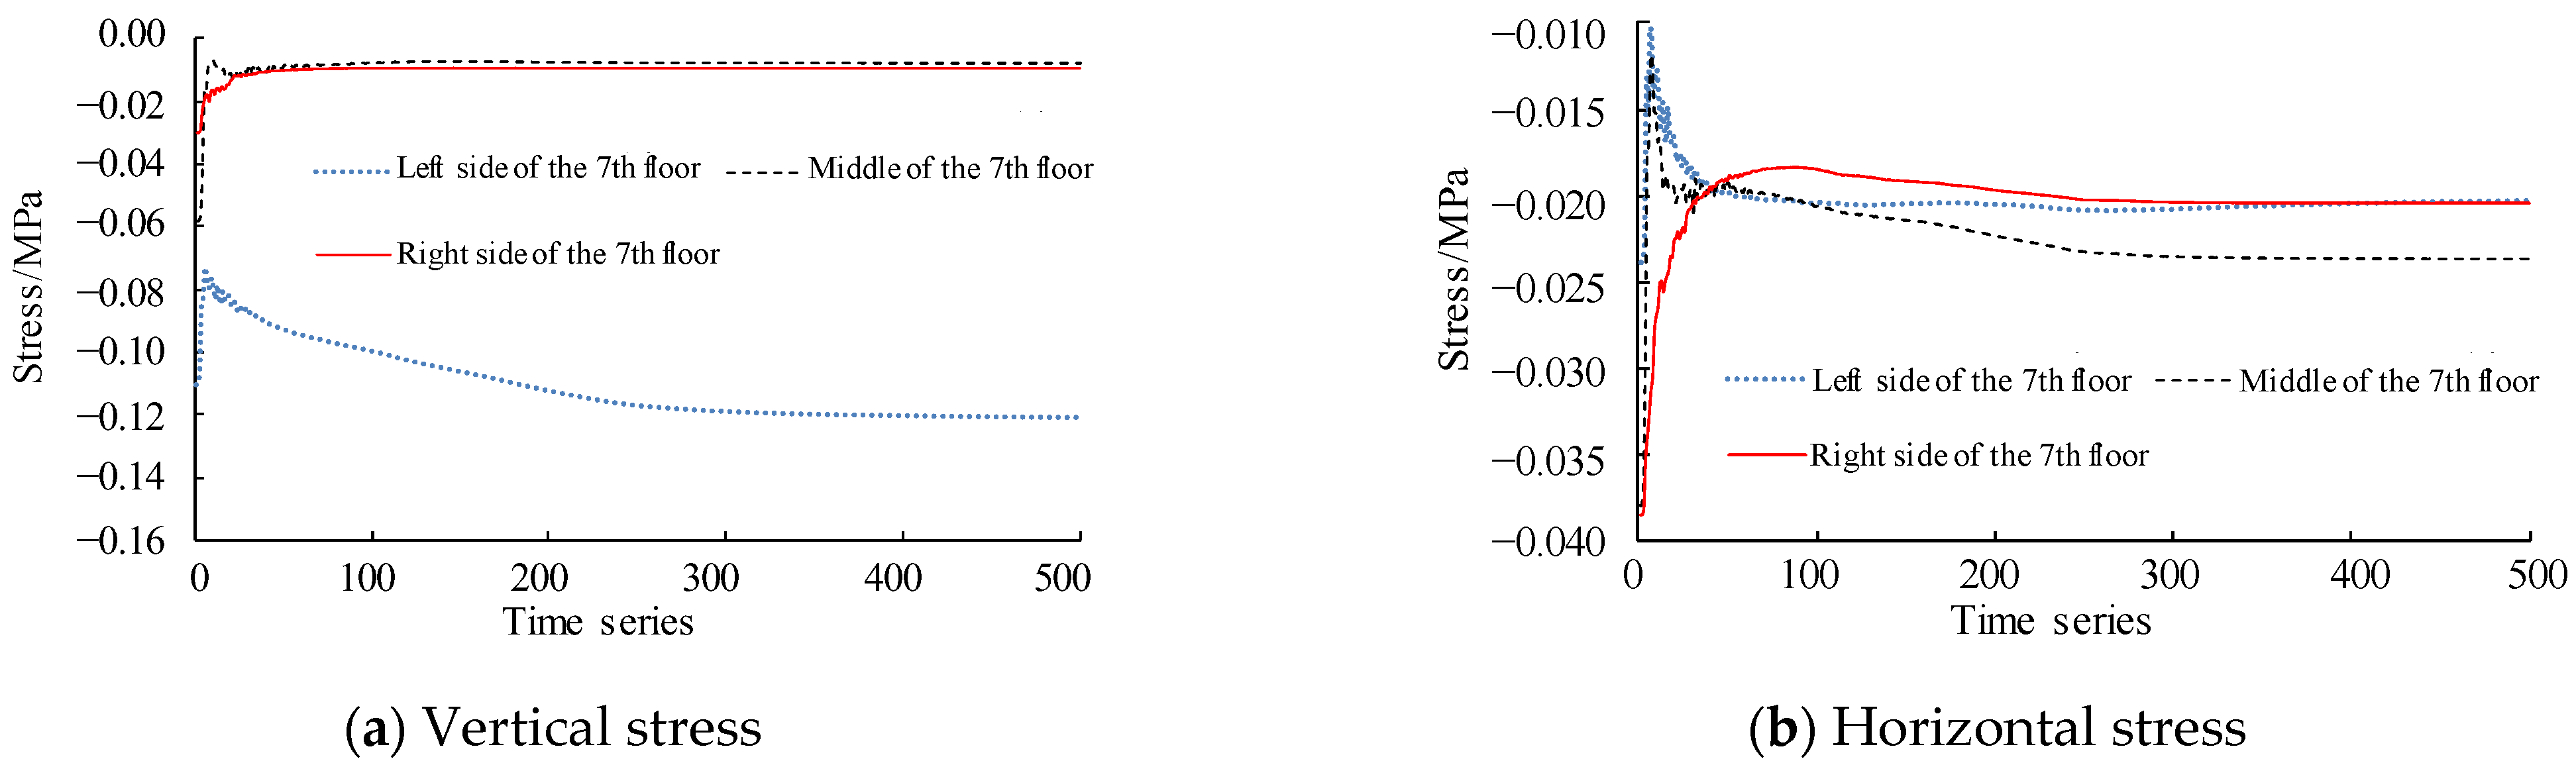
4.2. Analysis of Stress Evolution Law
4.3. Acceleration and Displacement Response Characteristics of Coal and Rock
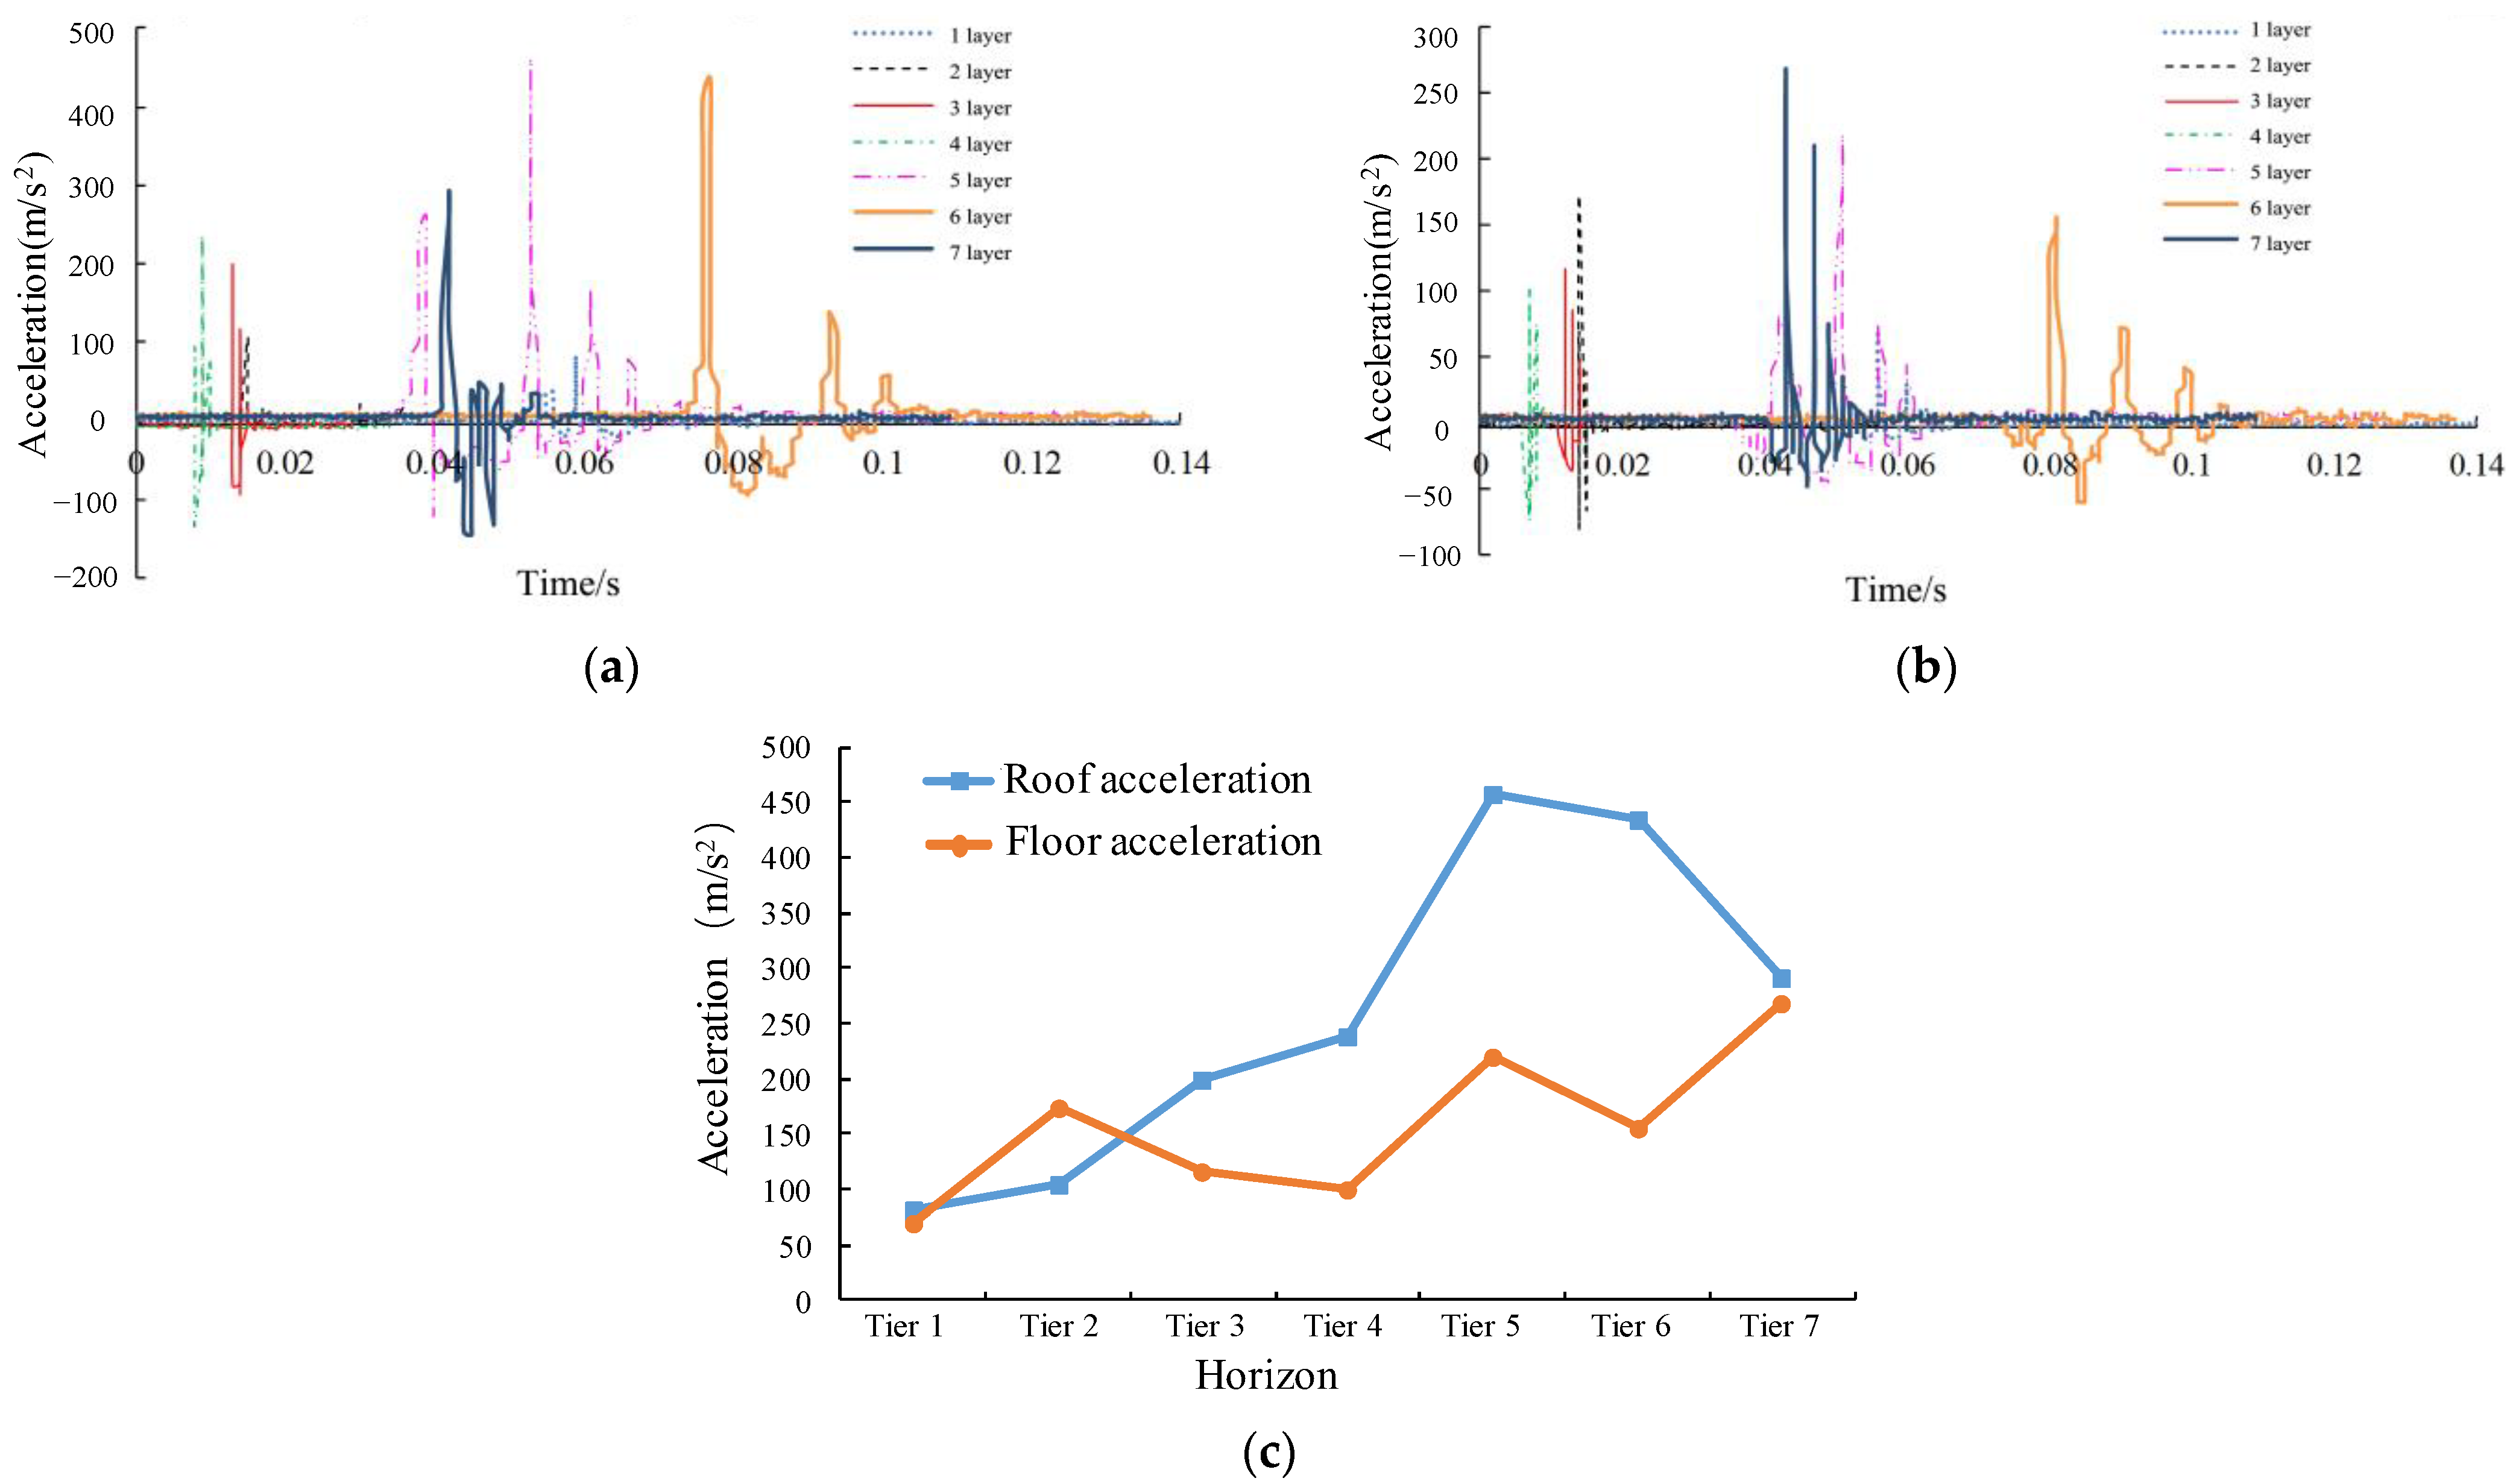
4.3.1. Acceleration Response Characteristics at the Same Position with Different Energies
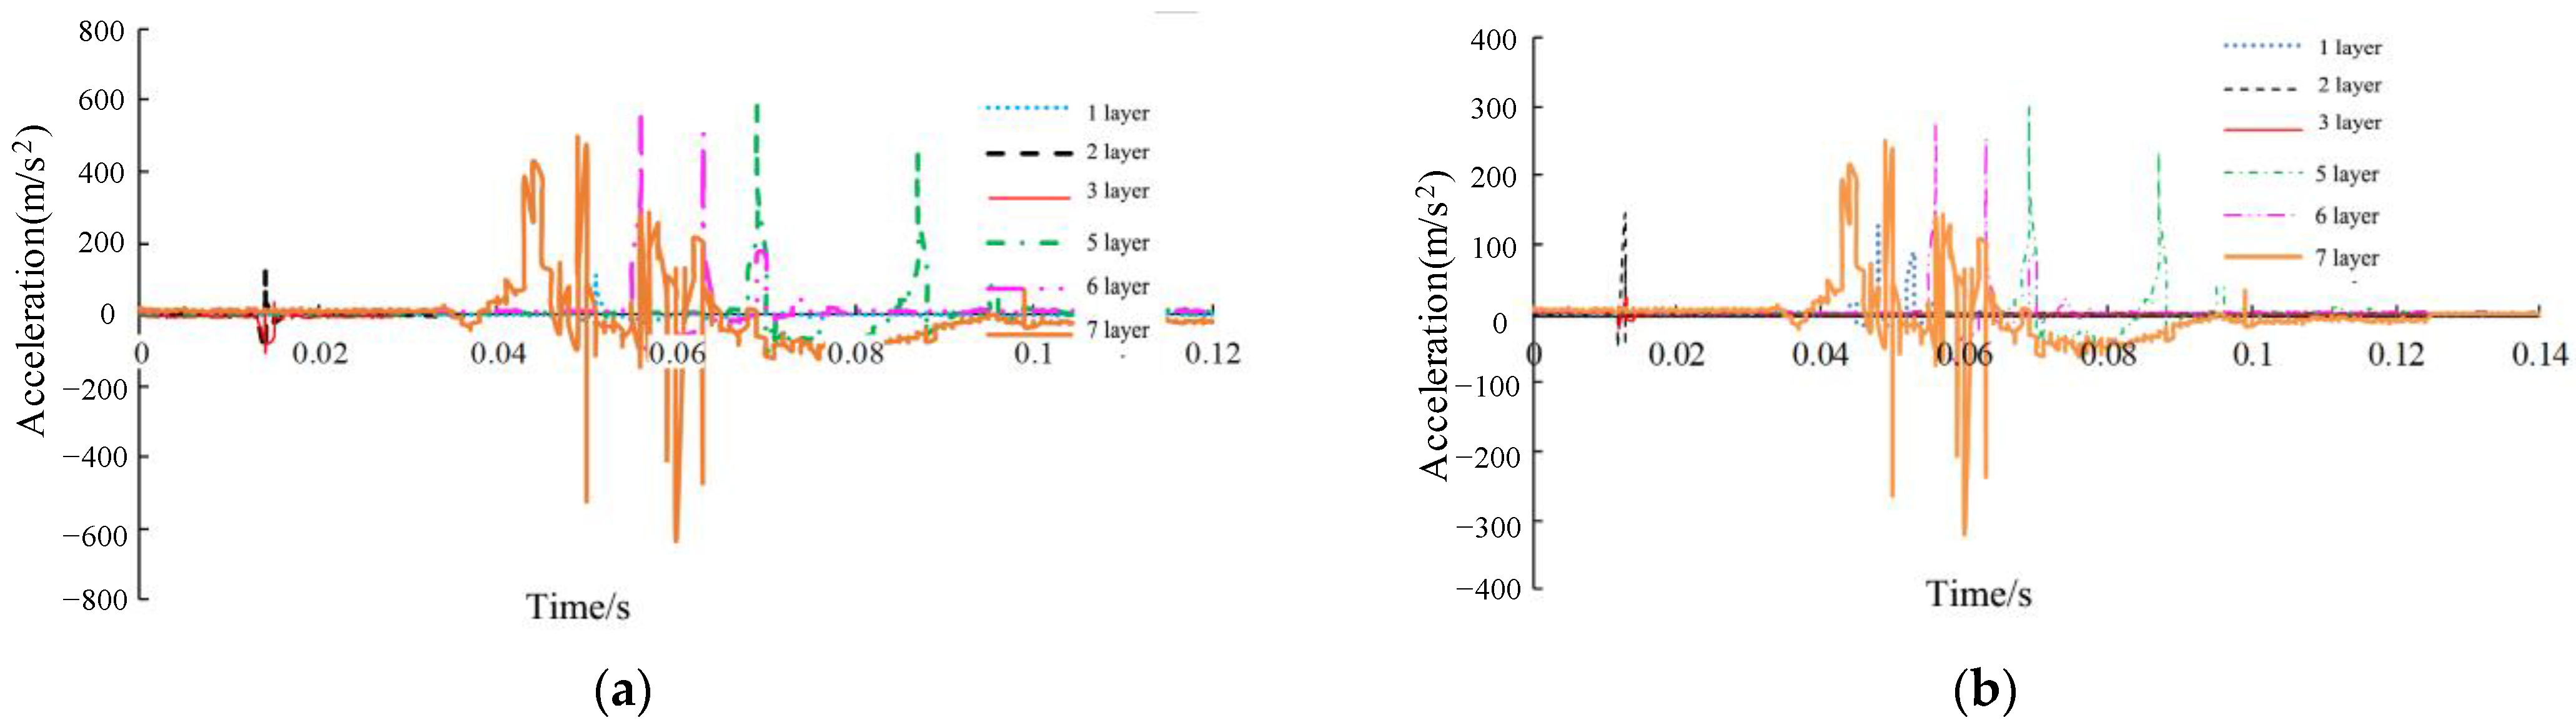
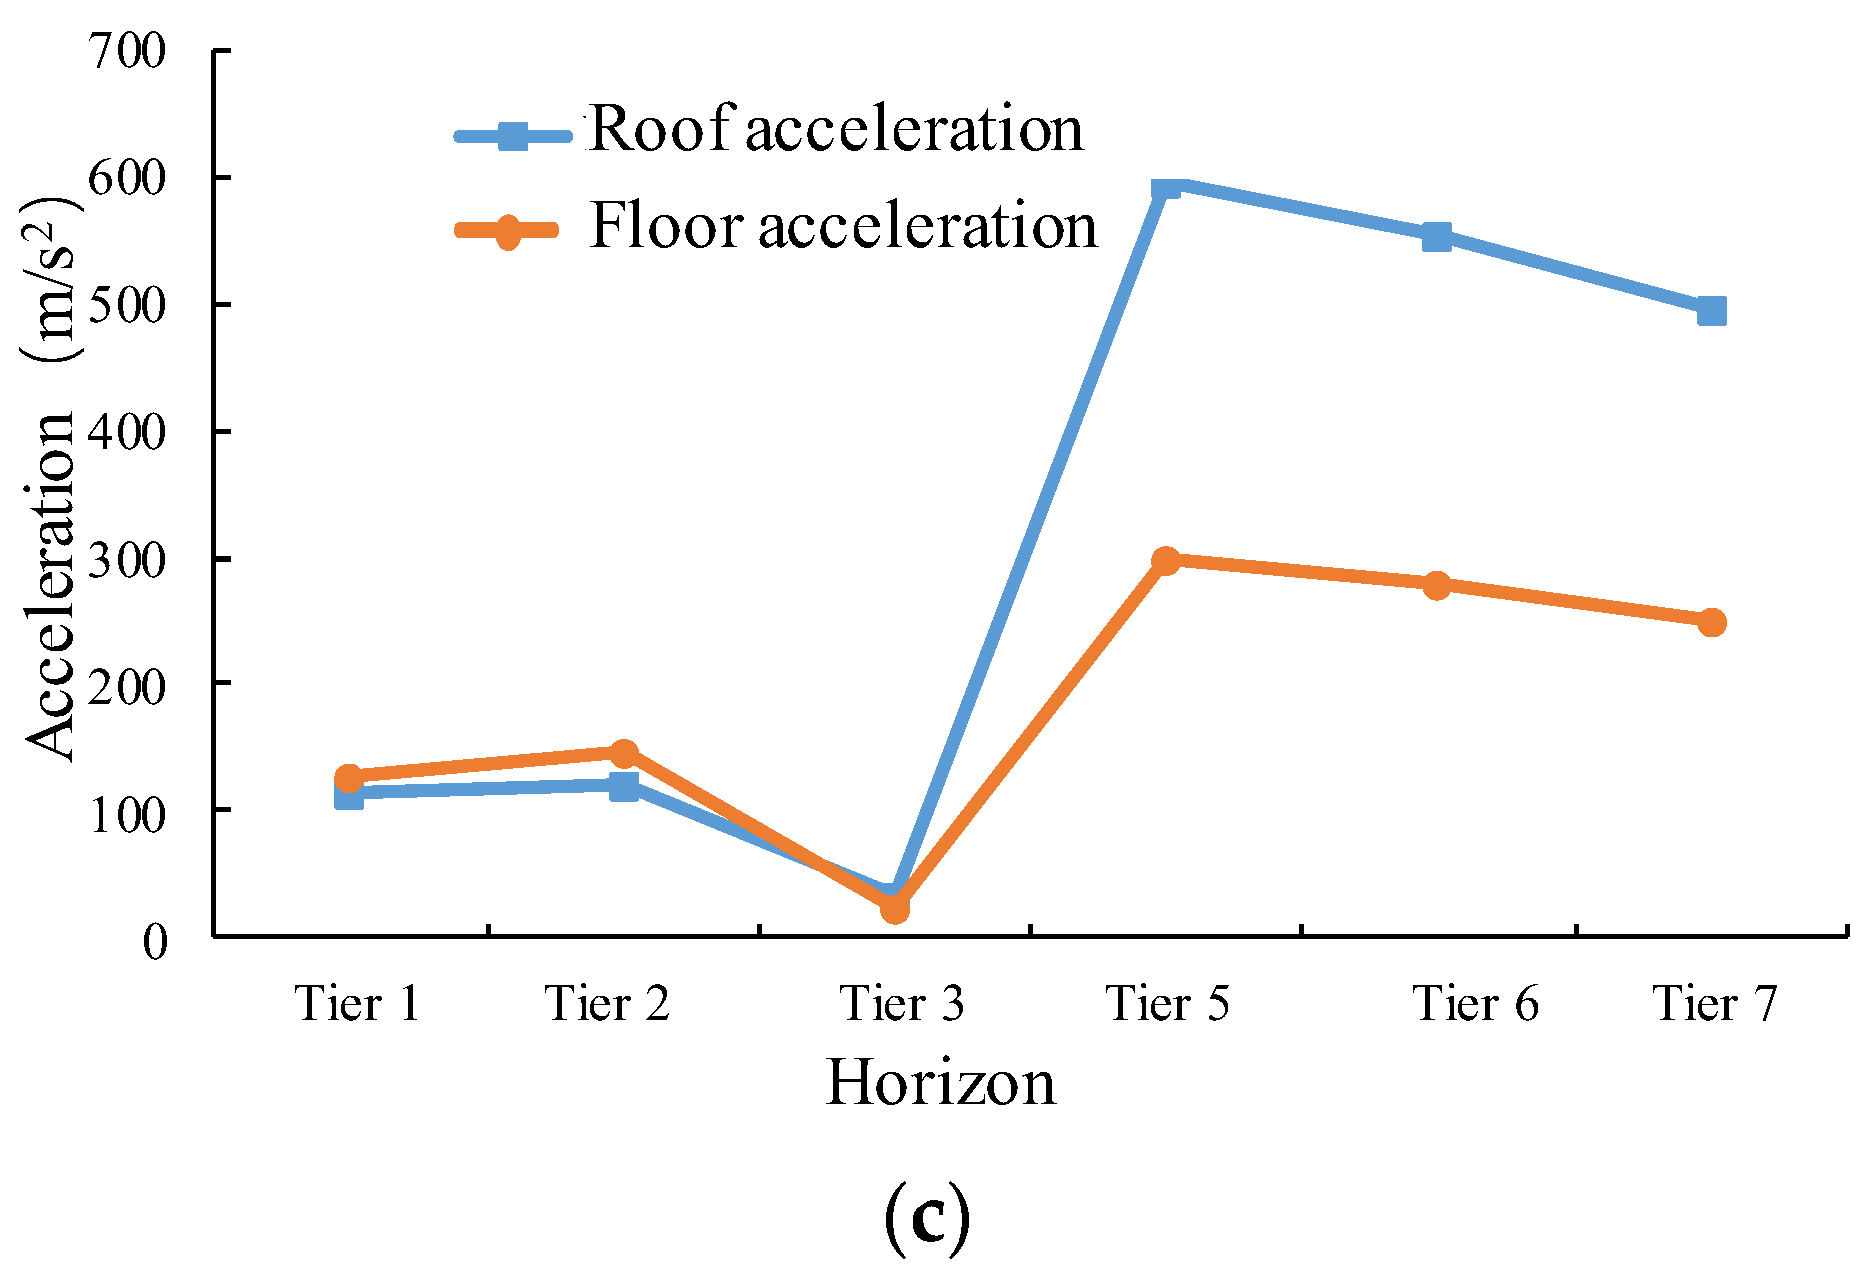
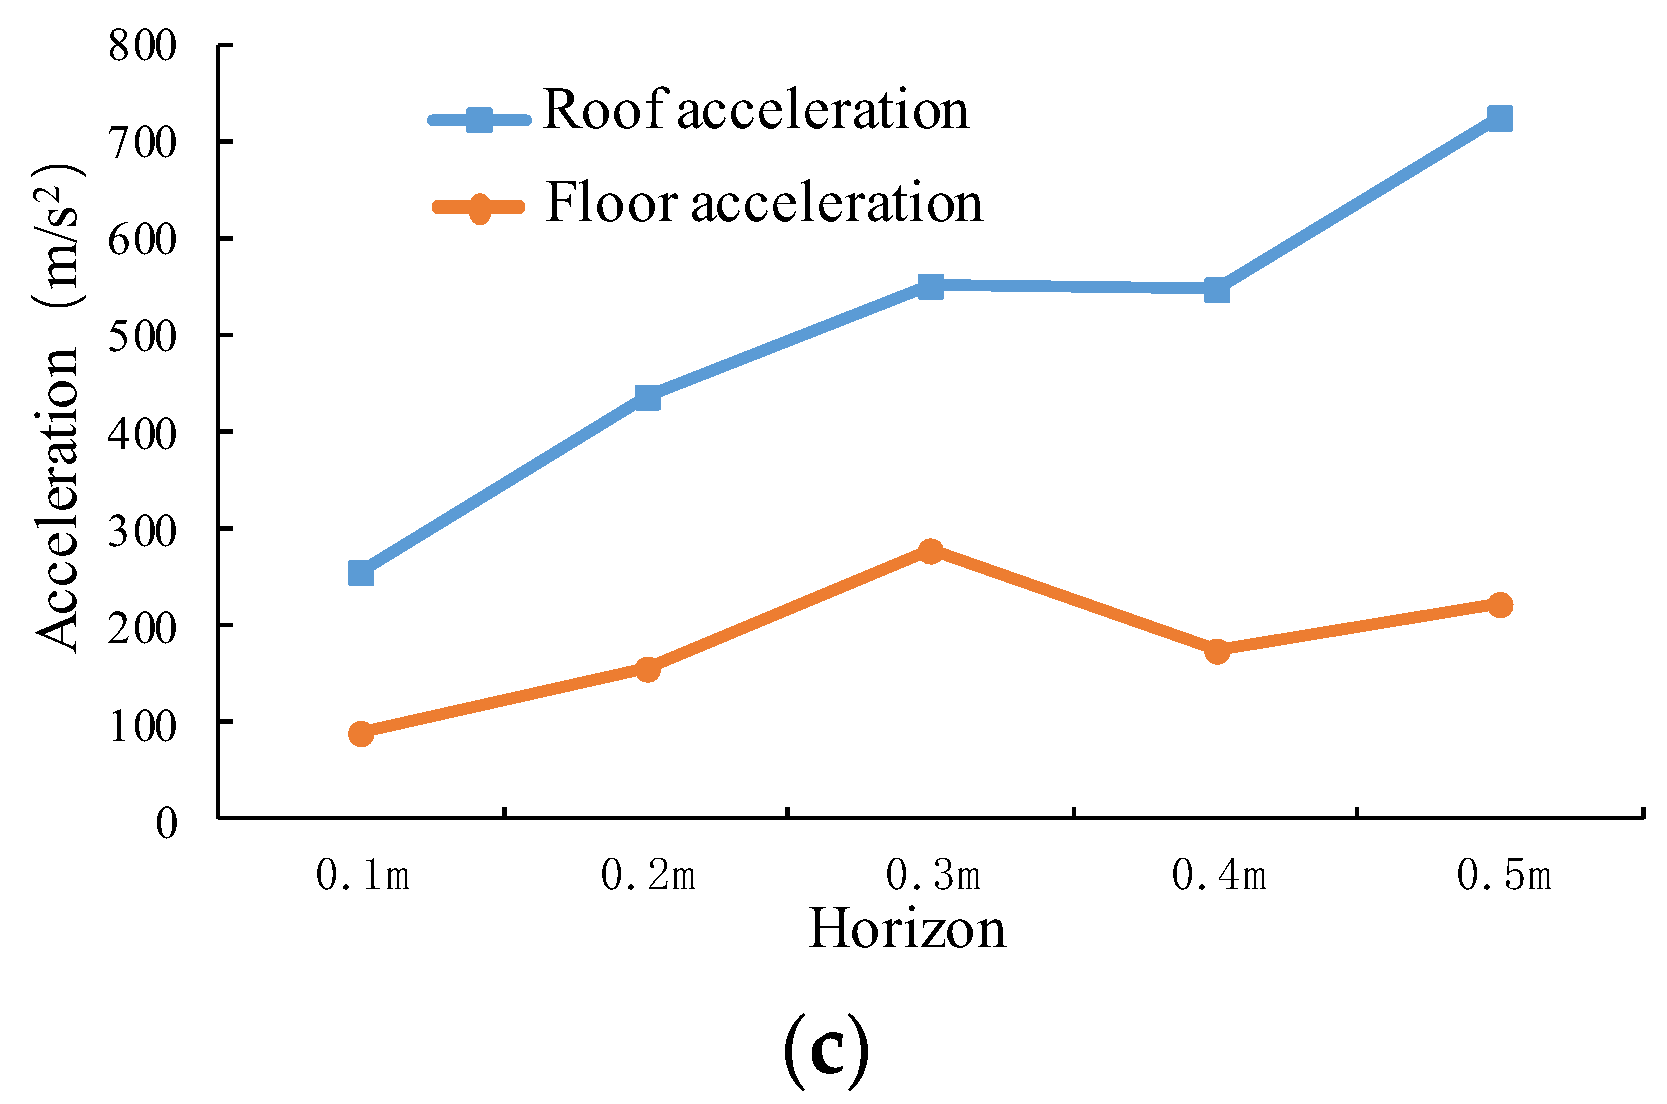
4.3.2. Acceleration Response Characteristics at Different Positions with the Same Energy
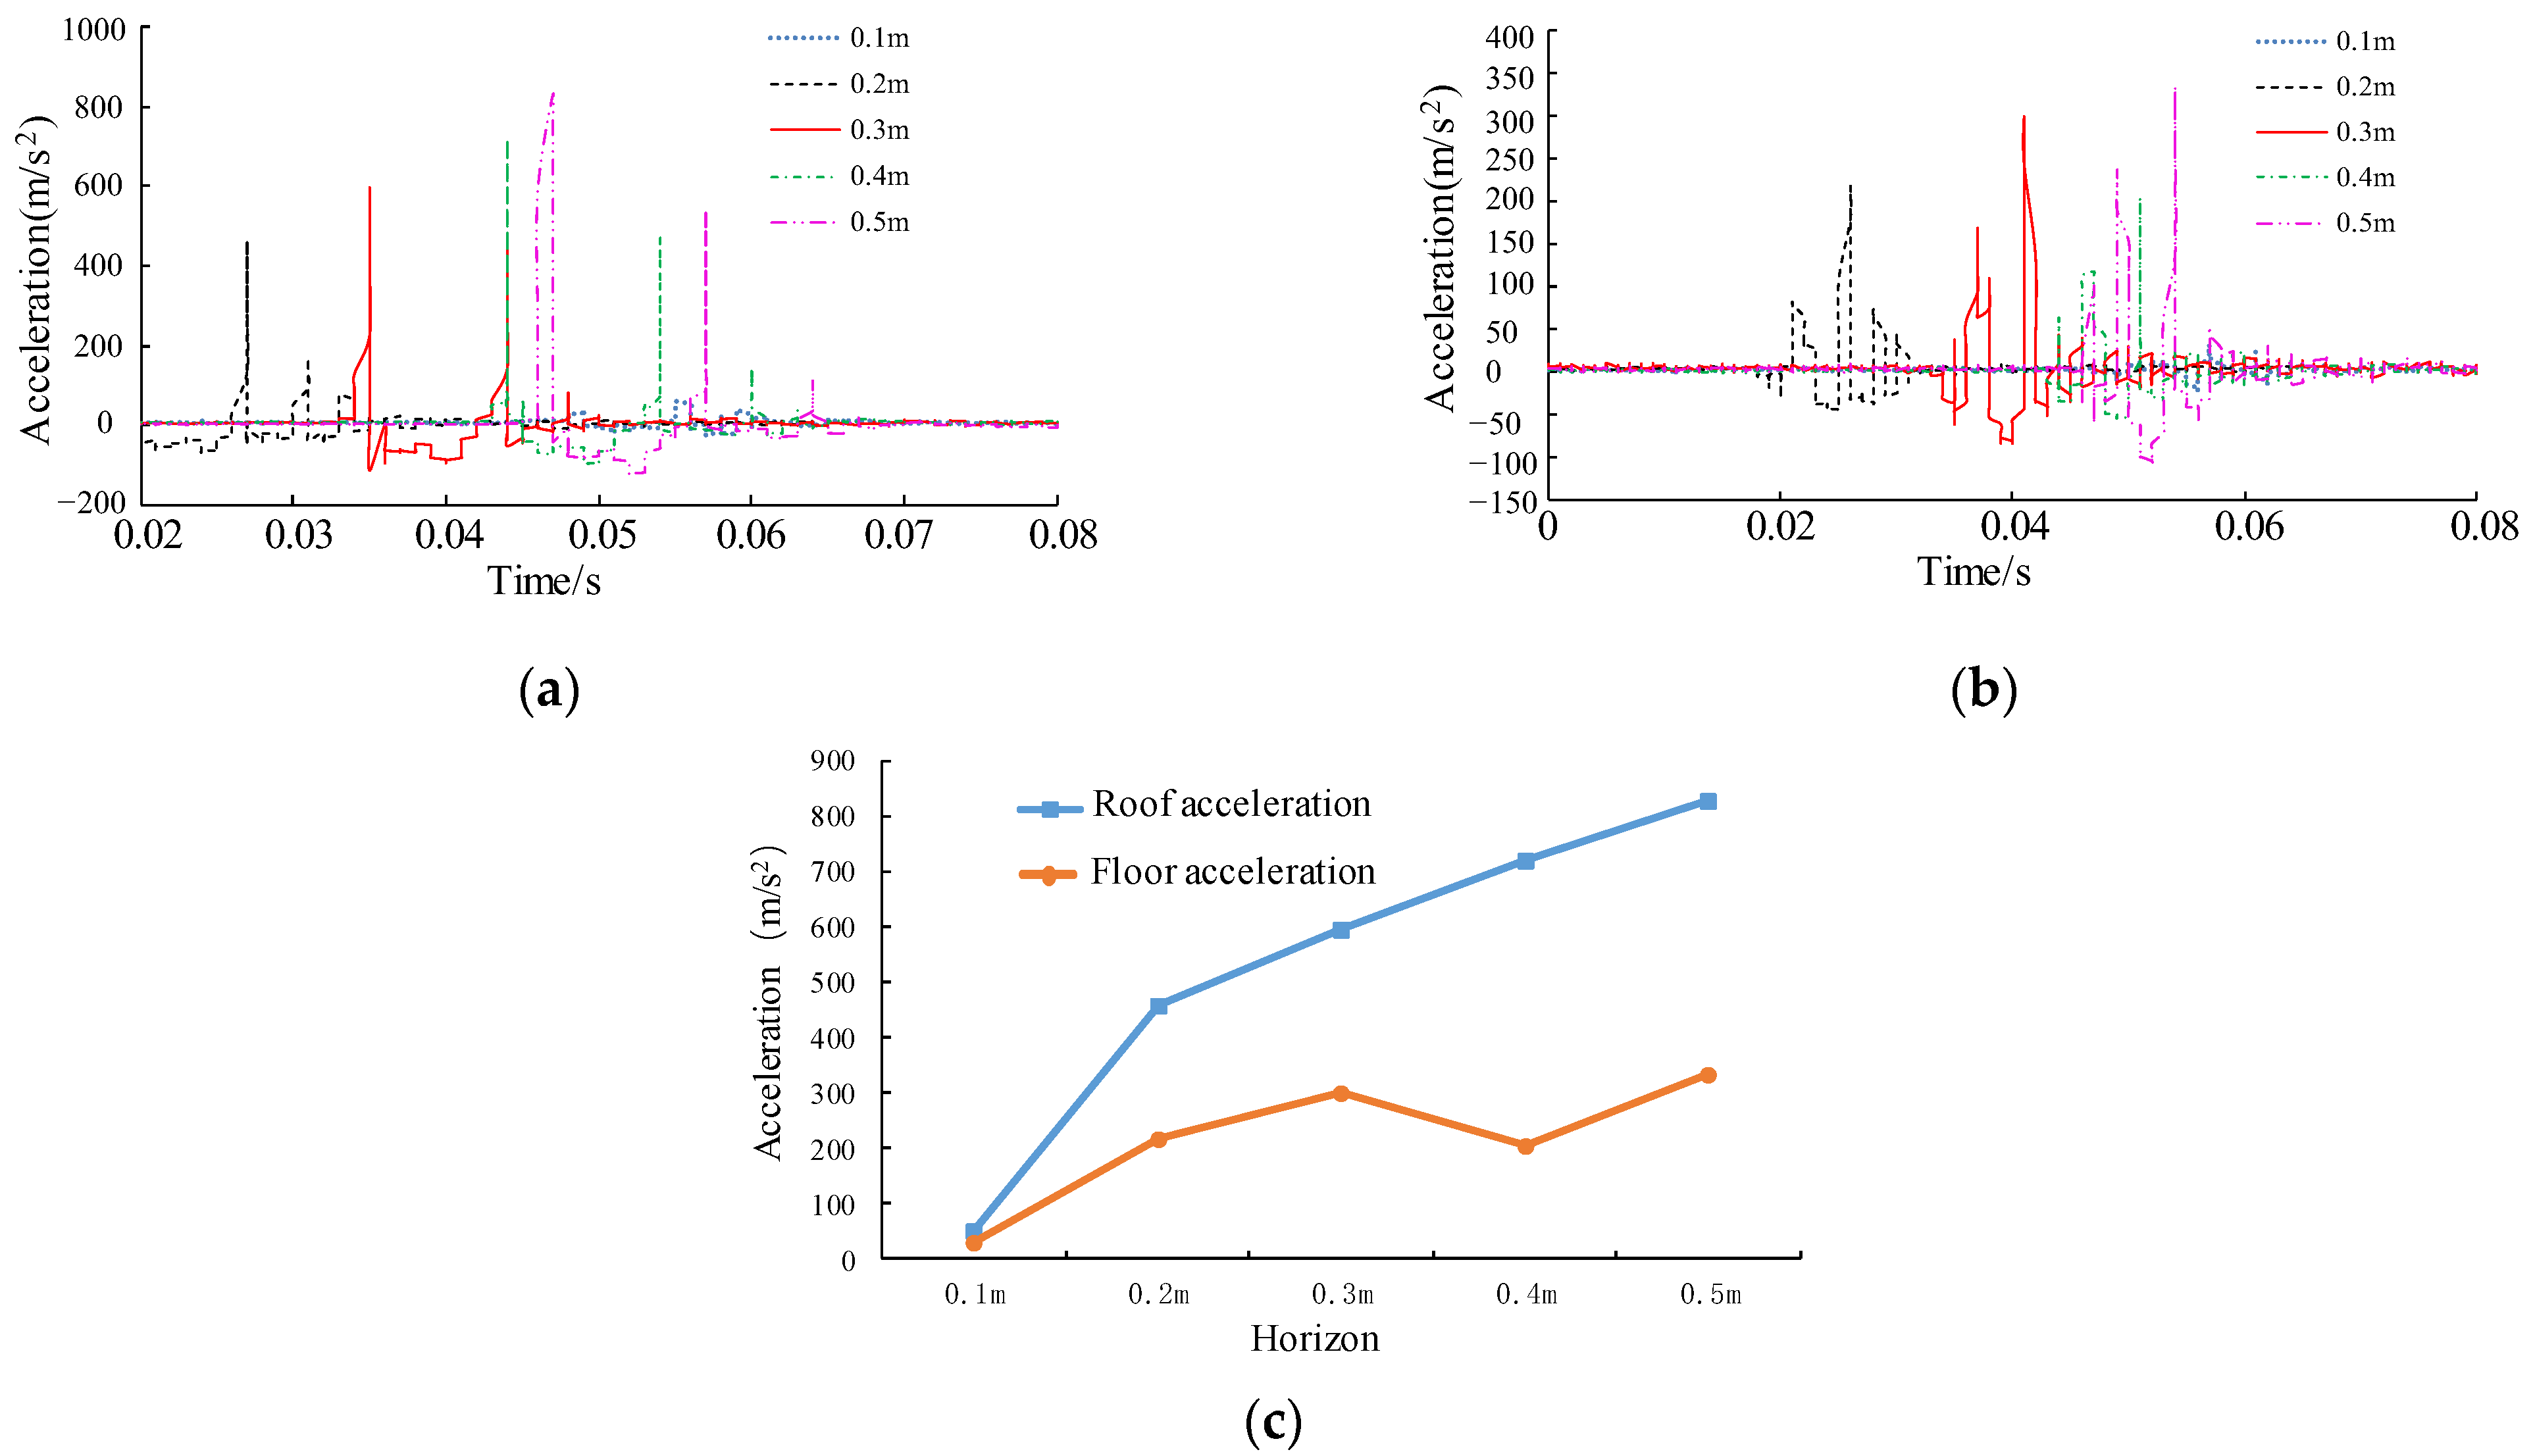
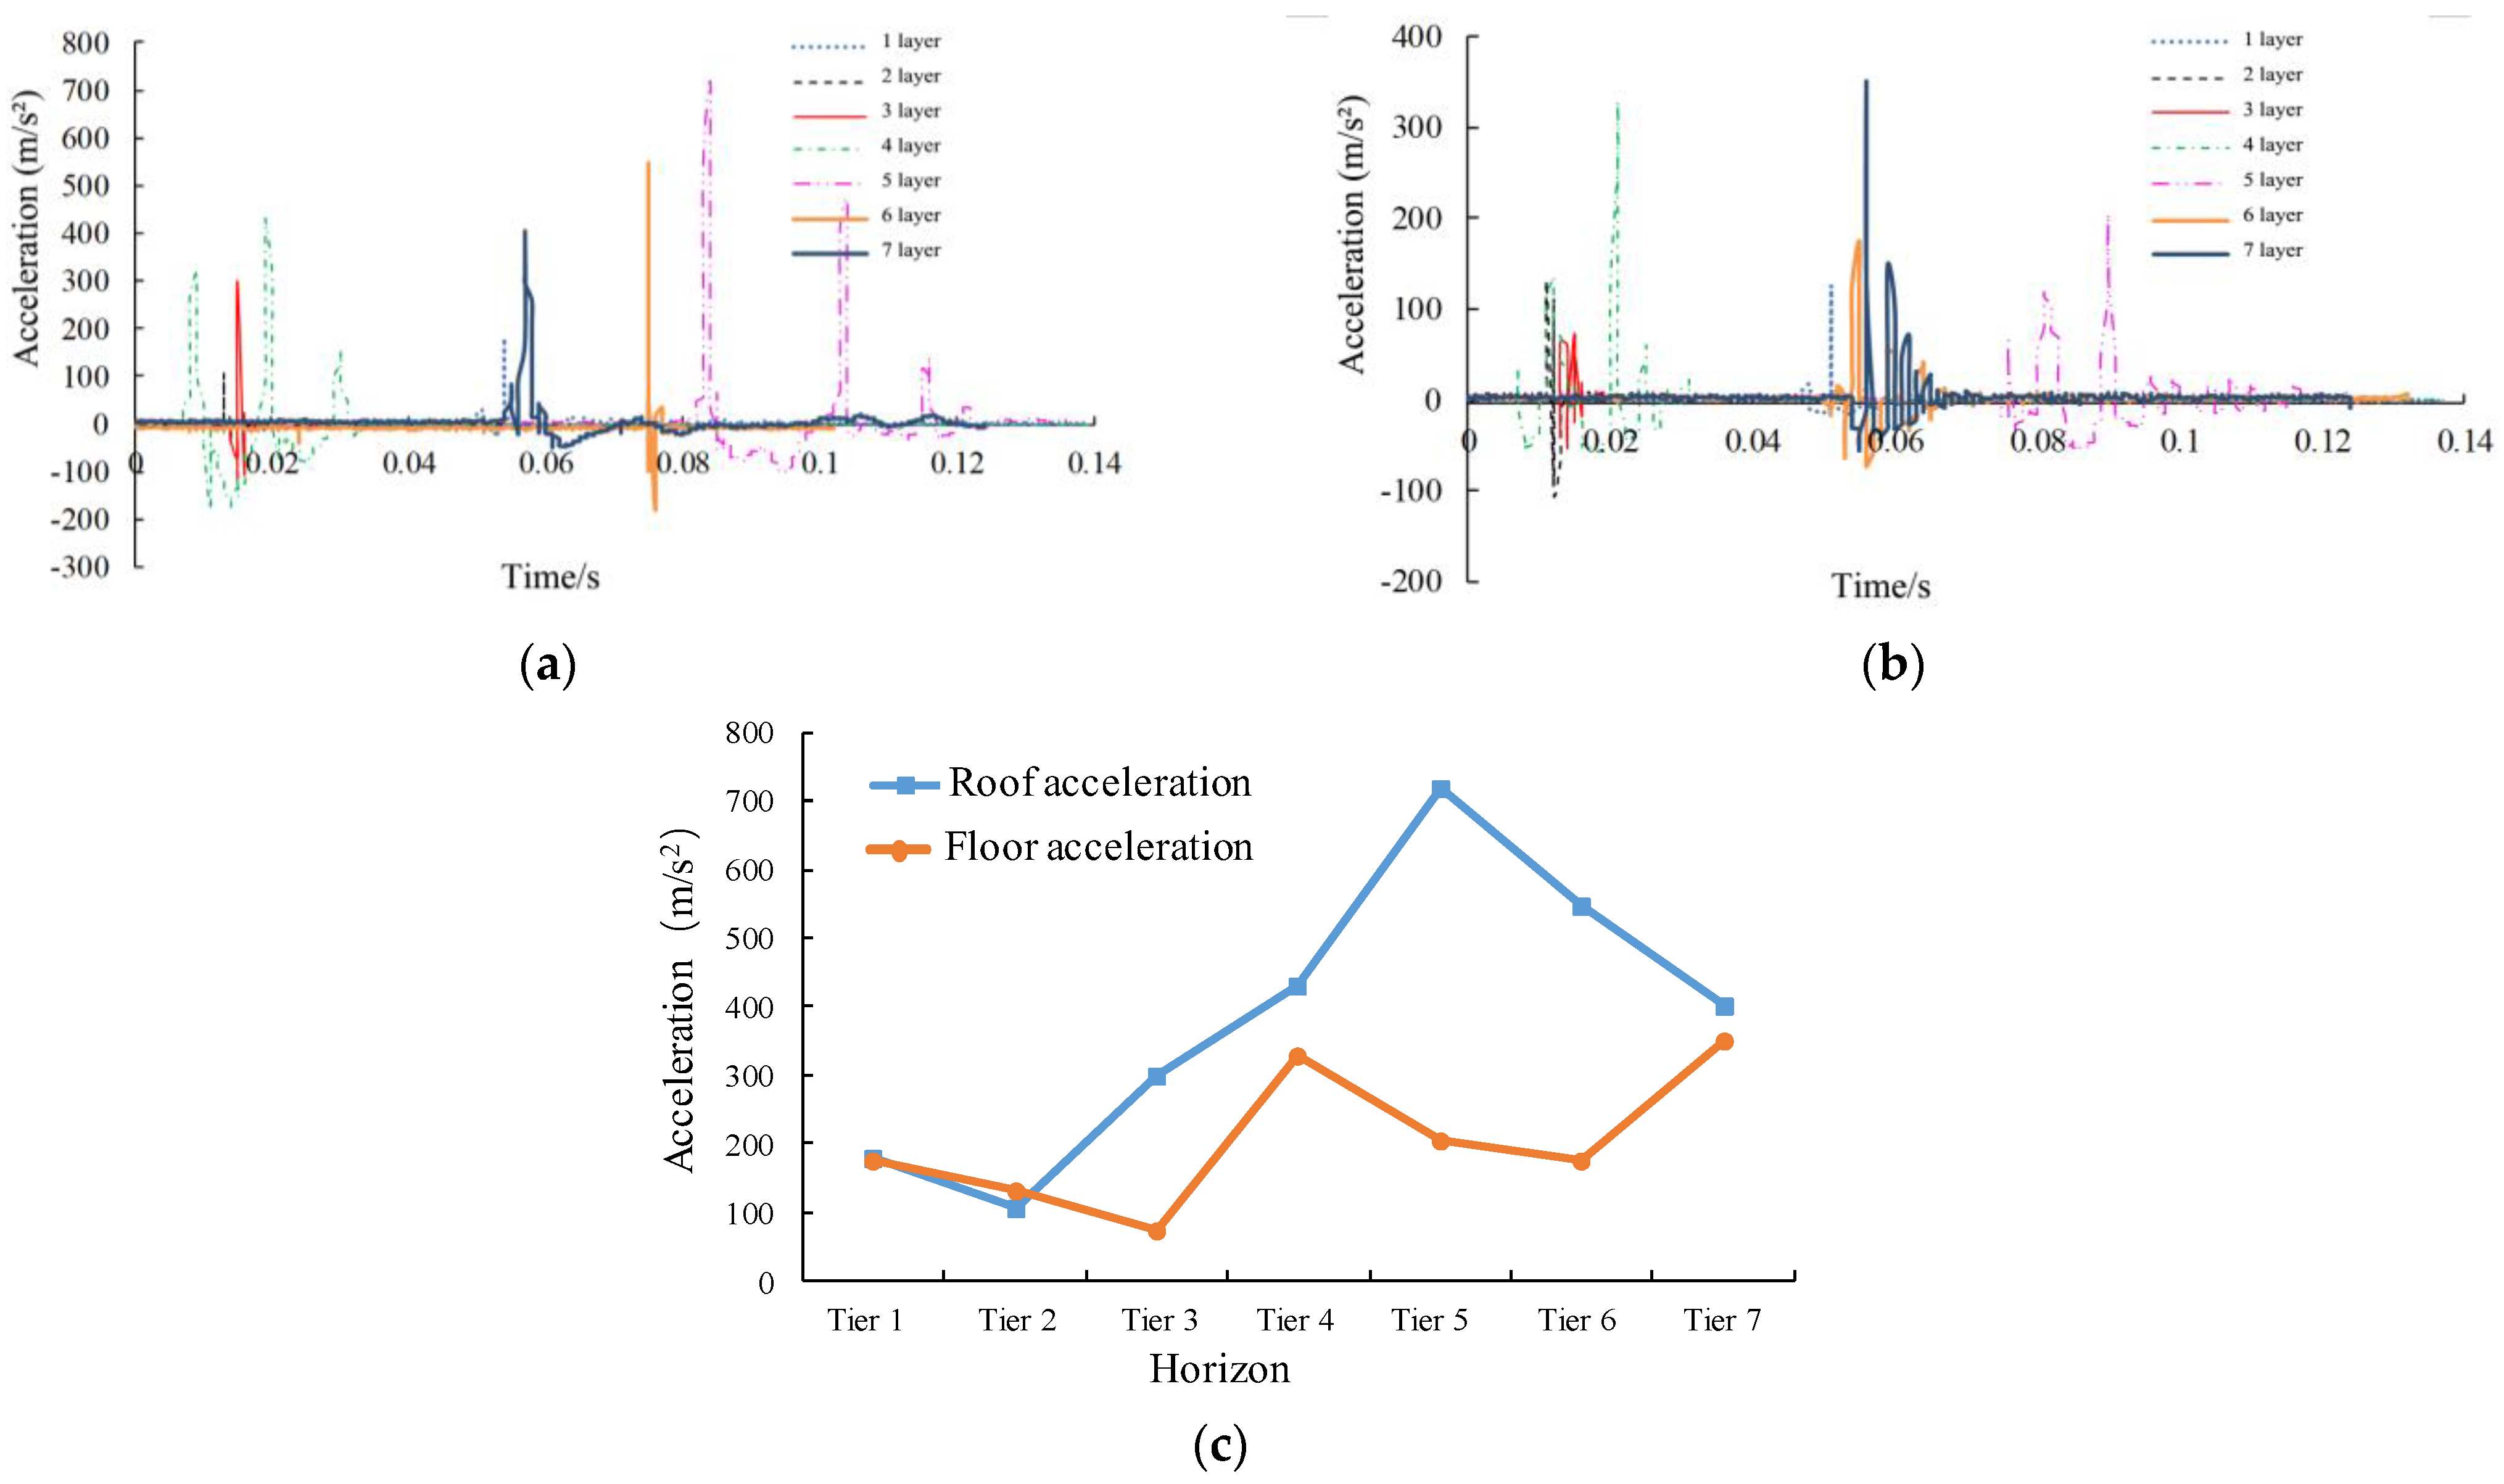
- (1)
- Except for the pendulum height of 0.1 m, the peak acceleration at the top plate of each stratum is basically linear with the propagation distance. Take the pendulum height of 0.4 m as an example, the peak acceleration at the top plate of the fifth stratum is the largest, reaching 718.72 m/s2, while the peak accelerations at the other strata 1–7 are 25.03%, 14.55%, 41.74%, 59.77%, 76.12%, and 55.61%, respectively, the larger the propagation distance, the smaller the peak acceleration value, and the coupling is good.
- (2)
- Although the peak acceleration at the bottom of the roadway and the top of the roadway have similar trends, the differences between individual layers are larger, especially when the dynamic load energy is larger. In addition, taking the pendulum height of 0.4 m as an example, the acceleration peak at the bottom plate of the seventh stratum is the largest, reaching 350.62 m/s2, and the acceleration peaks of the other strata 1–6 are 49.89%, 37.15%, 20.86%, 93.82%, 58.35%, and 49.98%, respectively. The change pattern is obviously different from that at the top plate, but there is a certain correlation with the distance of the seismic source in the vertical direction, which indicates that there is a dominant propagation direction of the vibration wave longitudinal and transverse waves, and there is a certain variability in the direction of action on the form of coal rock action; not only that, when the vibration wave passes through the propagation and action in the medium of the coal body, it makes the form of action of the seismic source on the coal rock body become more complicated.
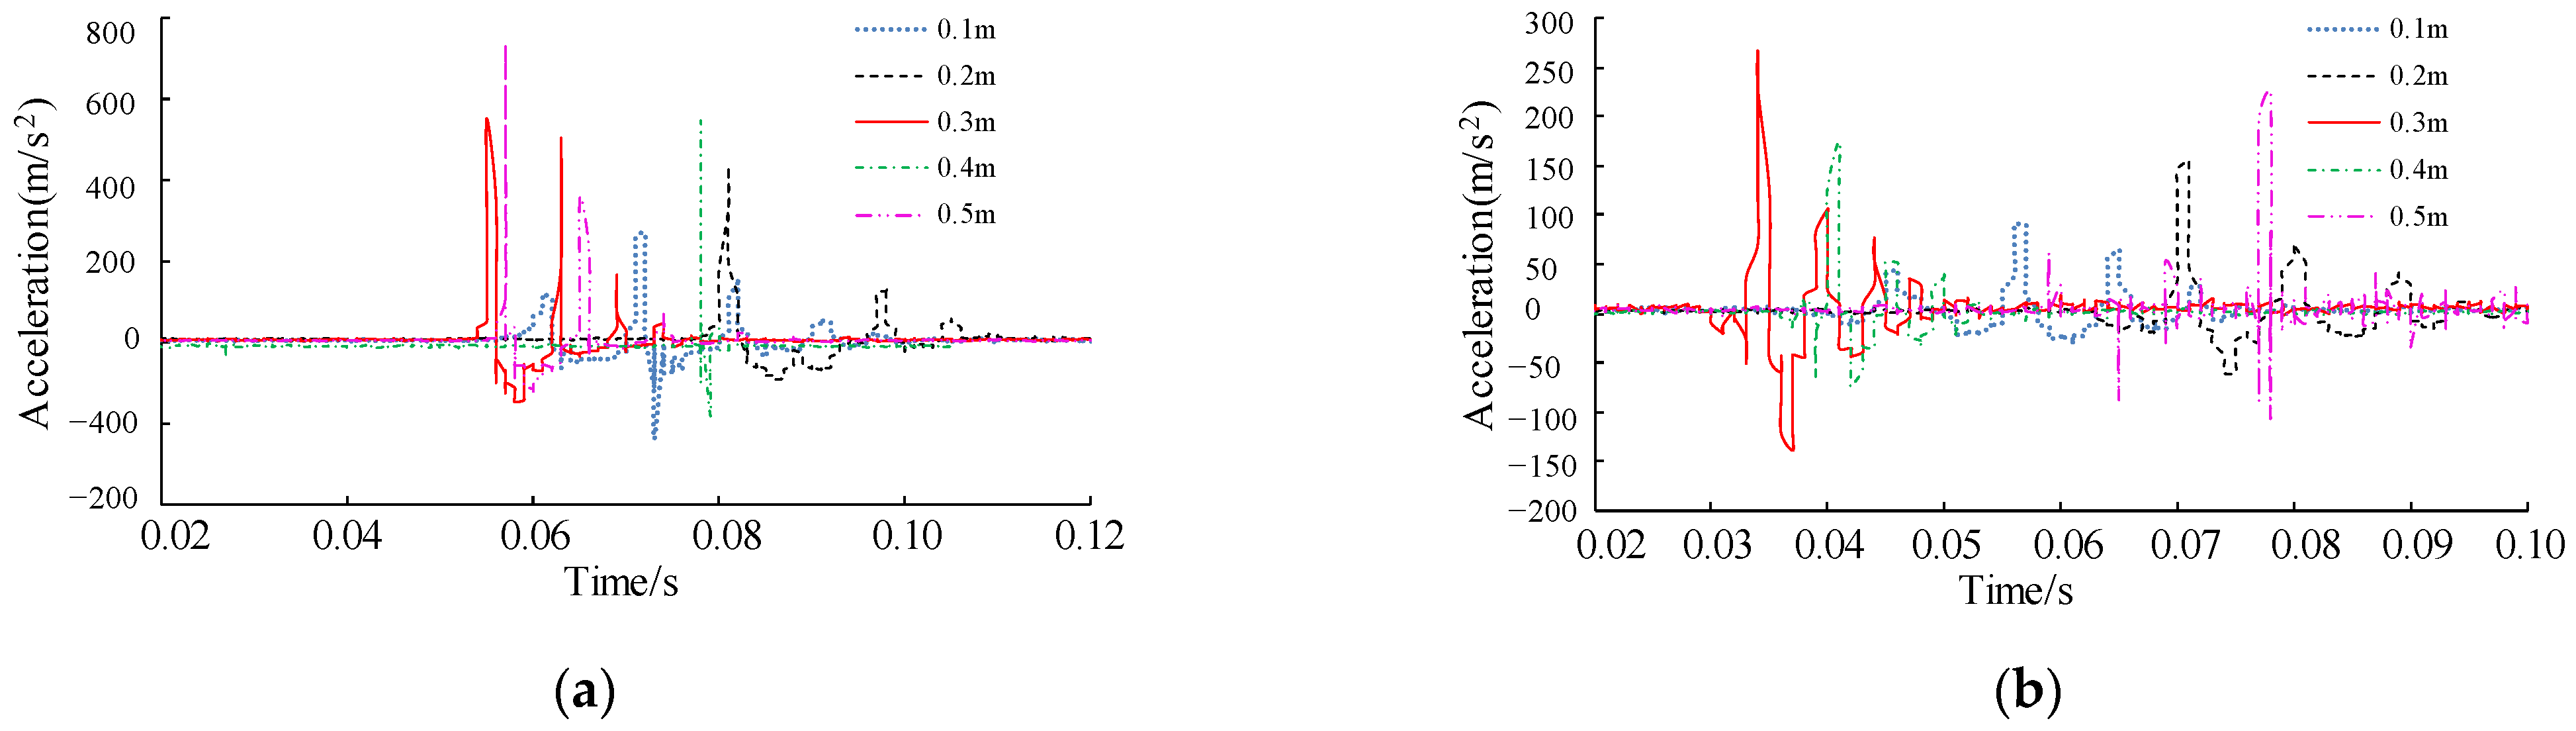
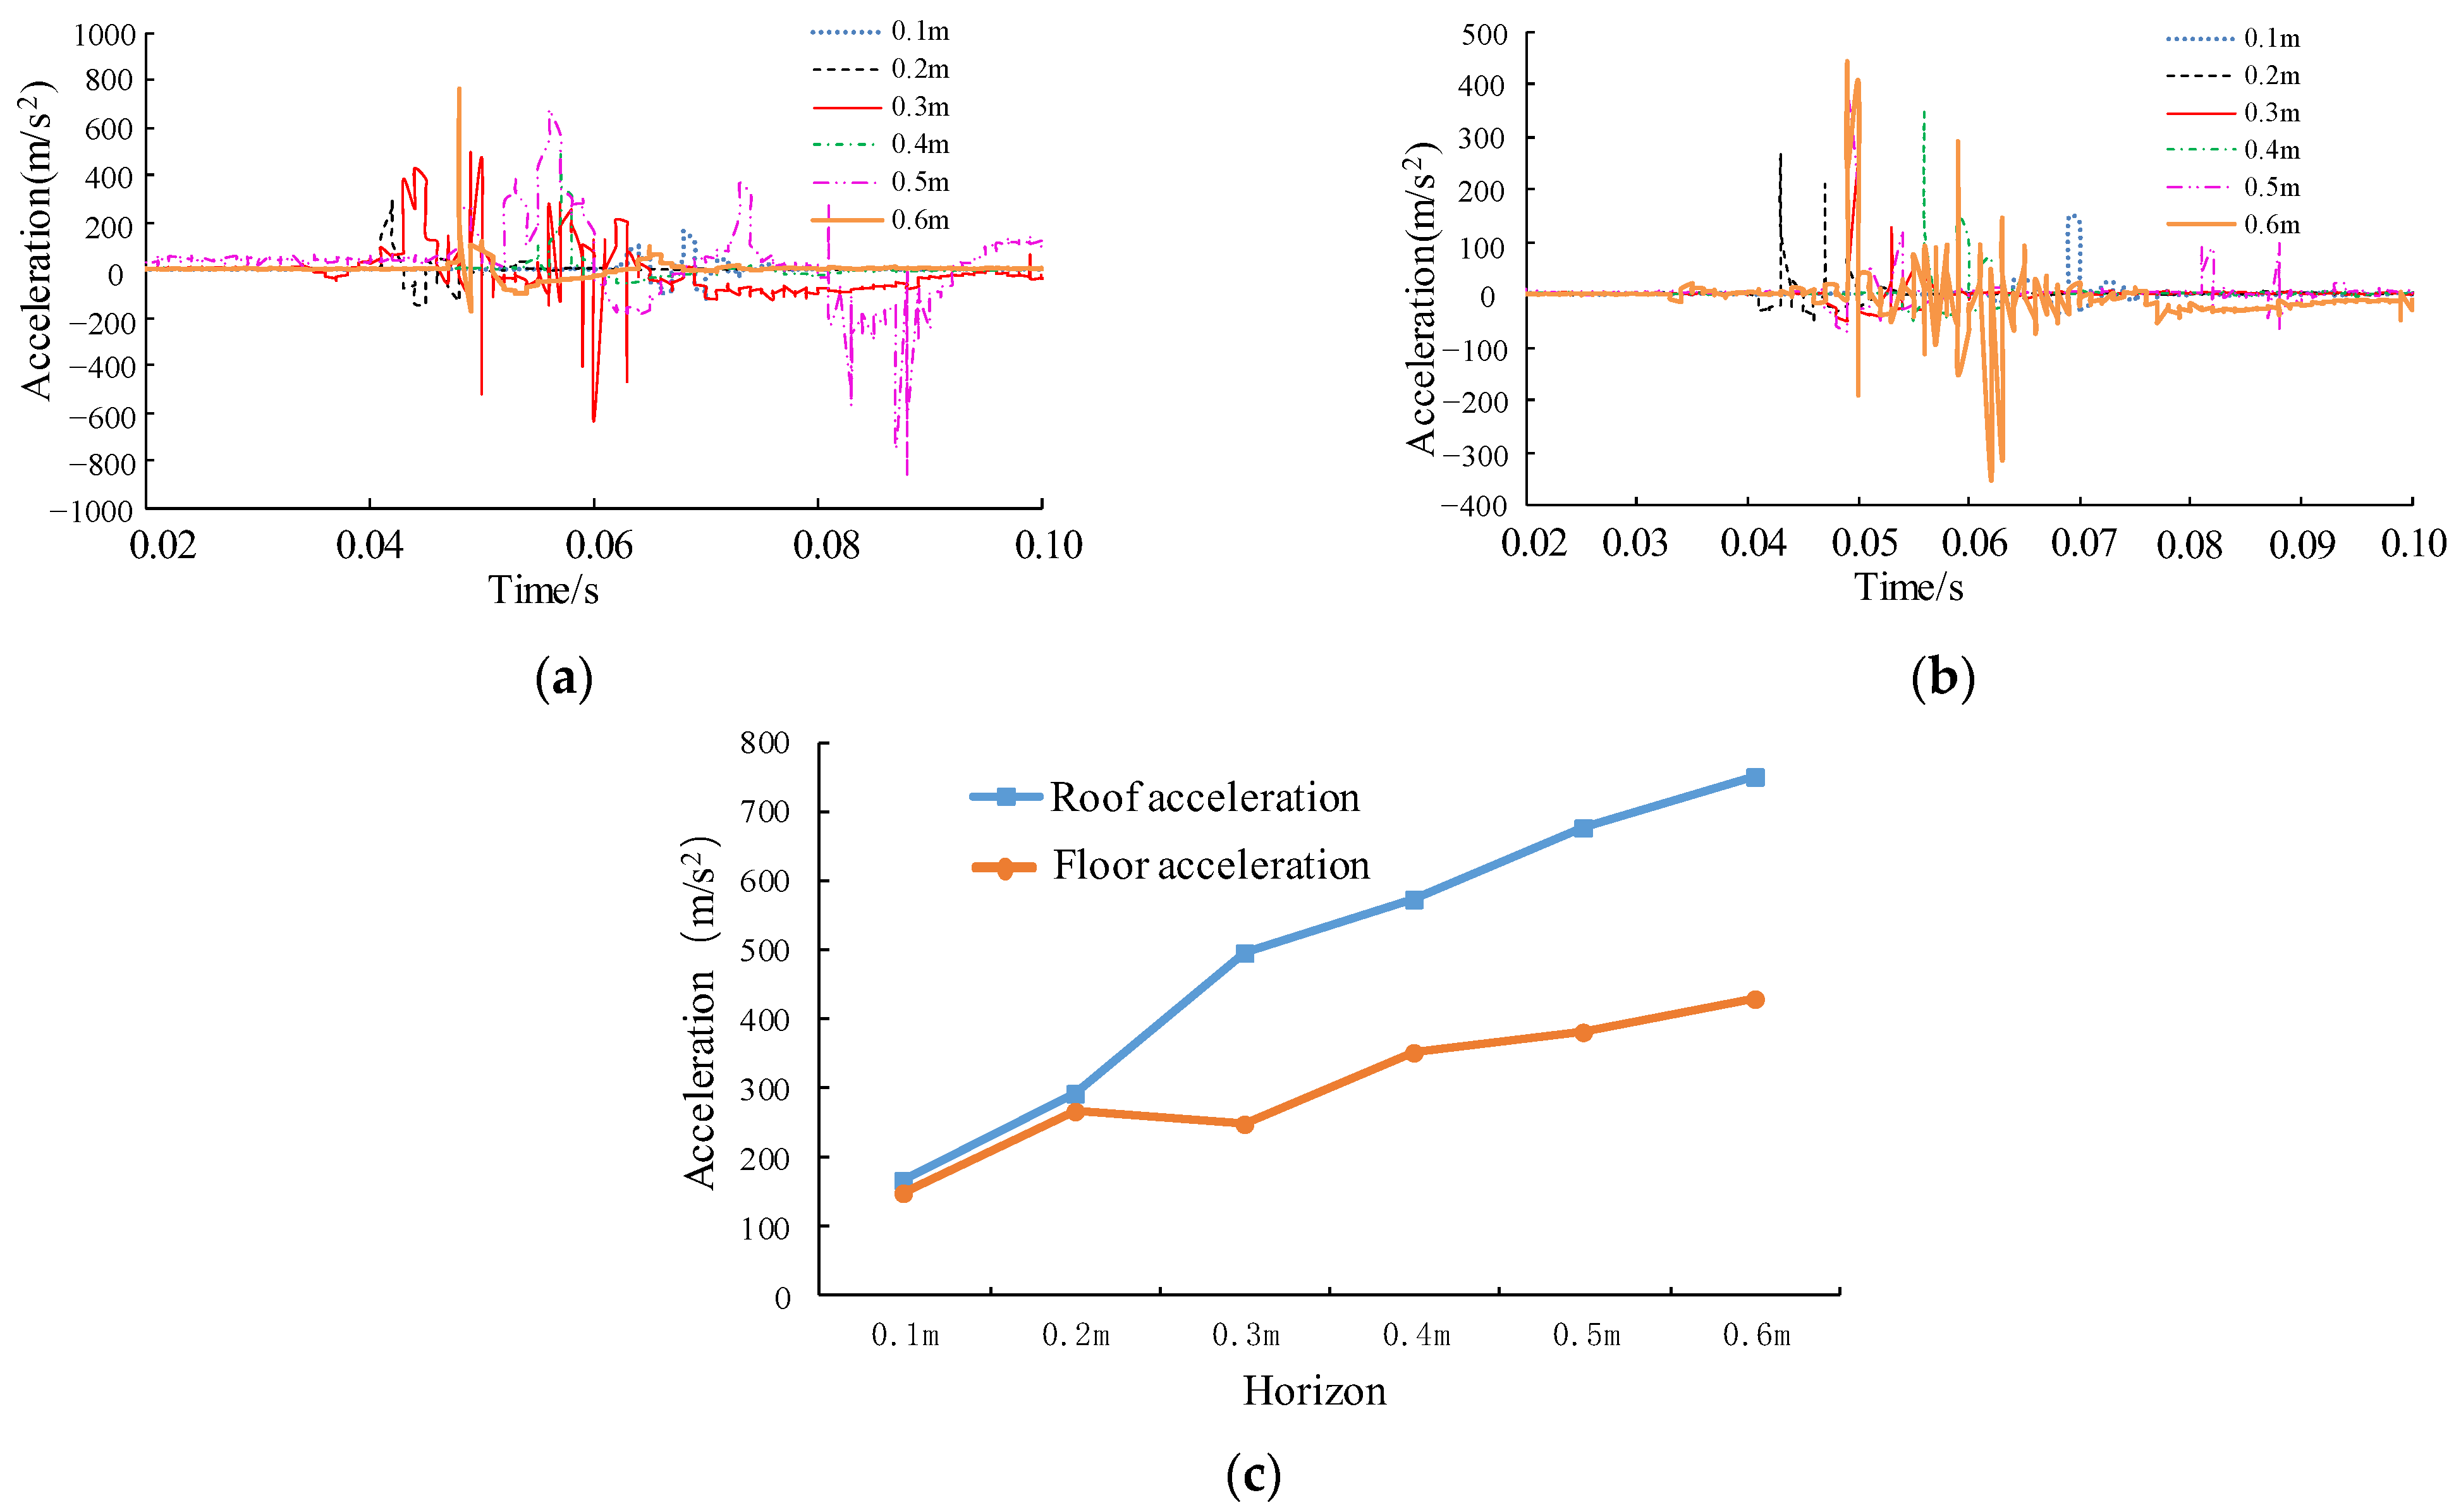
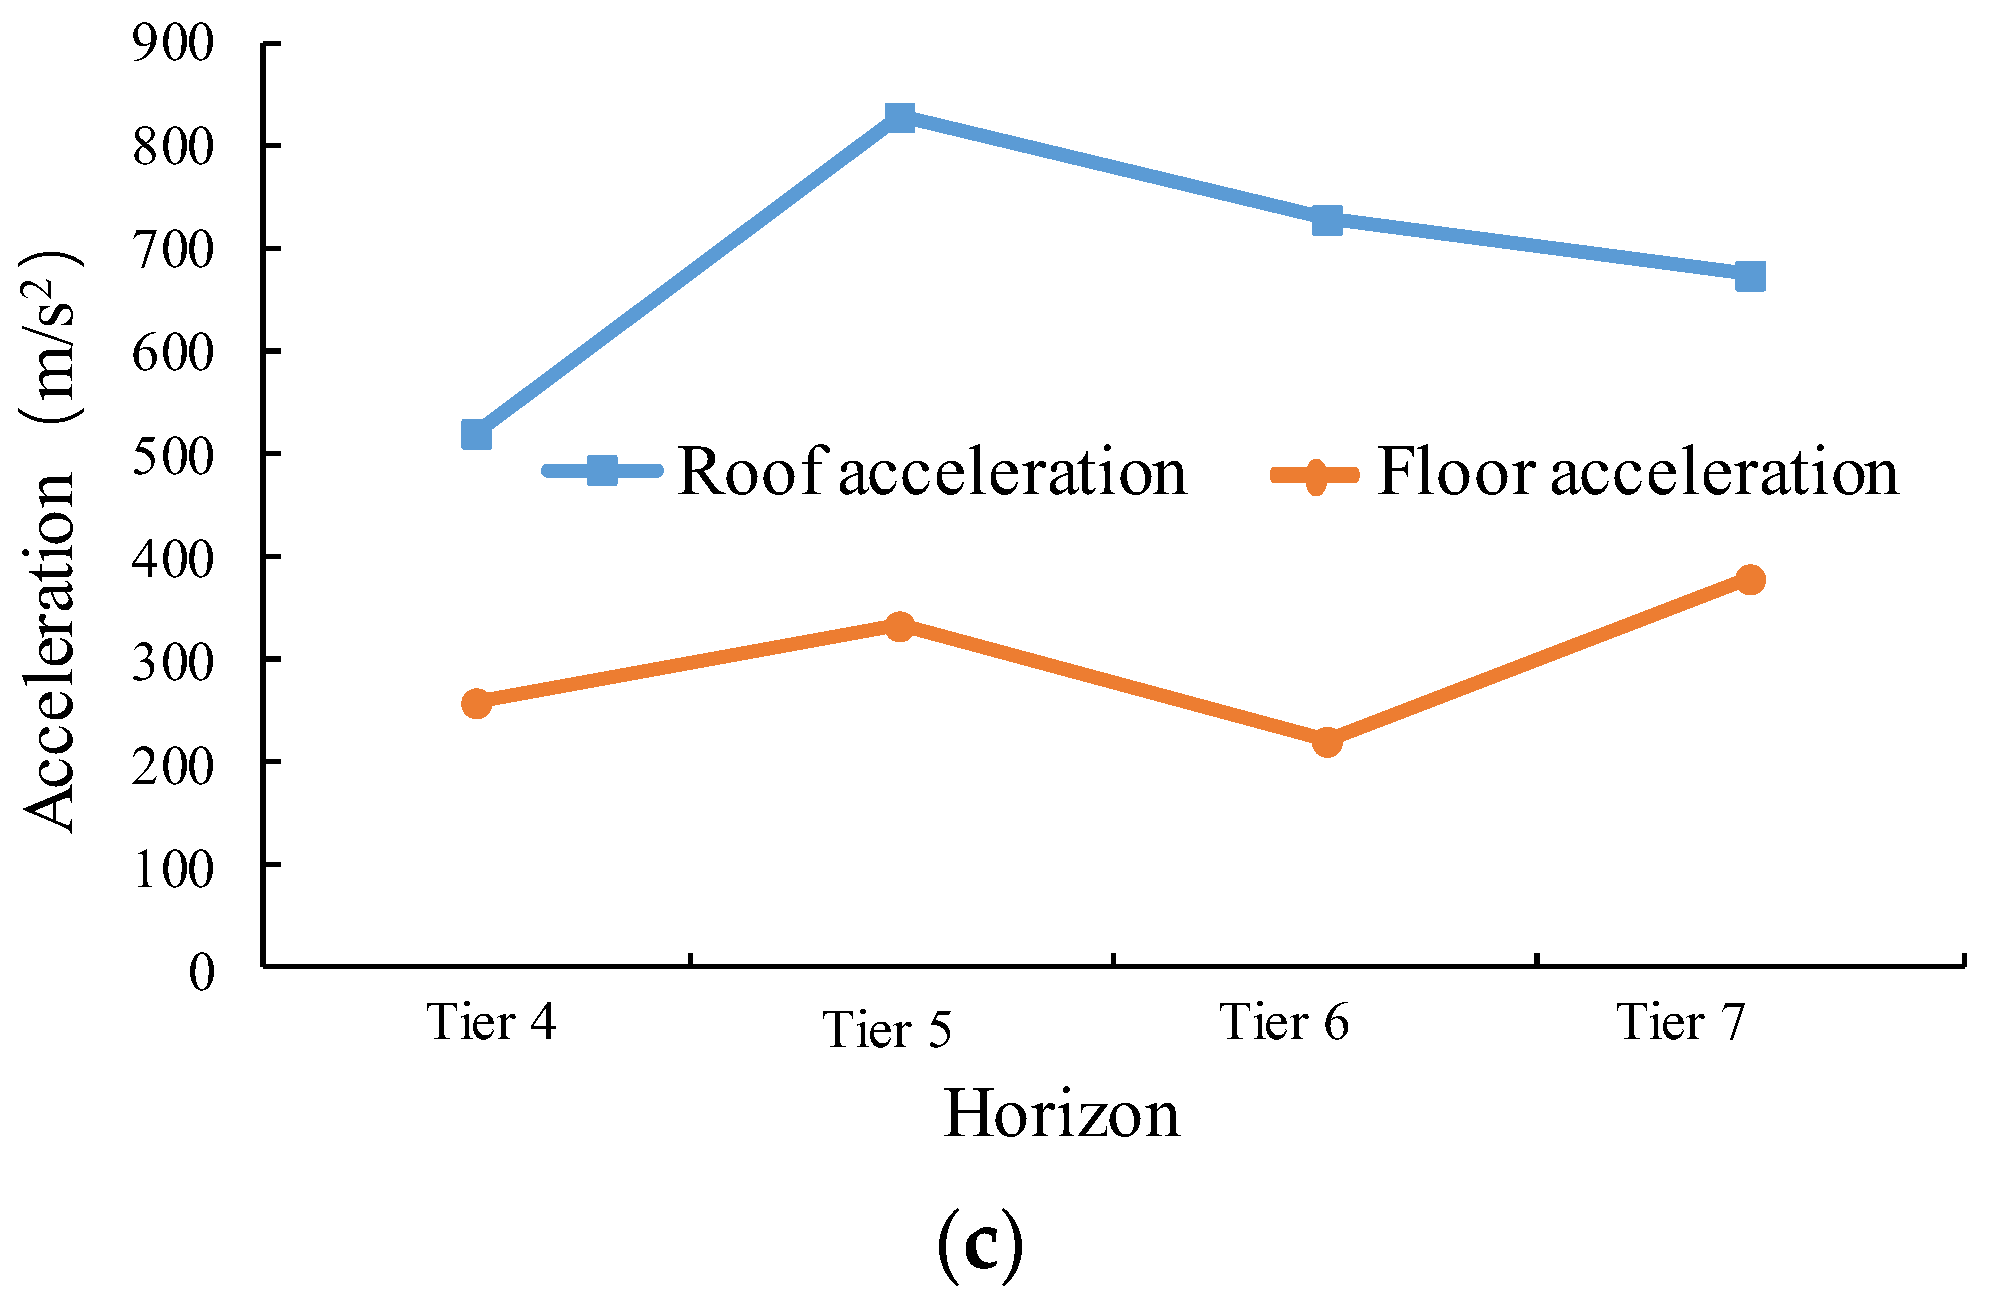
- (3)
- The propagation distance between stratum 4 and the earthquake source is smaller than that between stratum 6 and 7, but the peak acceleration velocities in stratum 6 and 7 are generally larger than that in stratum 4. By monitoring the model stress, it is found that the pressure in stratum 6 and 7 is significantly higher than that in stratum 4, the stress concentration is higher, and the stress is greater after the superposition of dynamic and static loads. It indicates that the stress has a certain influence on the acceleration response characteristics in the bearing range of the coal body. In addition, when the pendulum height is 0.4 and 0.5 m, the acceleration peak in the fifth stratum is greater than that in the seventh stratum when the impact appears, but no impact occurs, and the stress level in the seventh stratum is higher than that in the fifth stratum, so the dynamic load-induced impact appears as a result of the joint action of multiple factors.
4.4. Response Characteristics of Coal and Rock Acoustic Emission
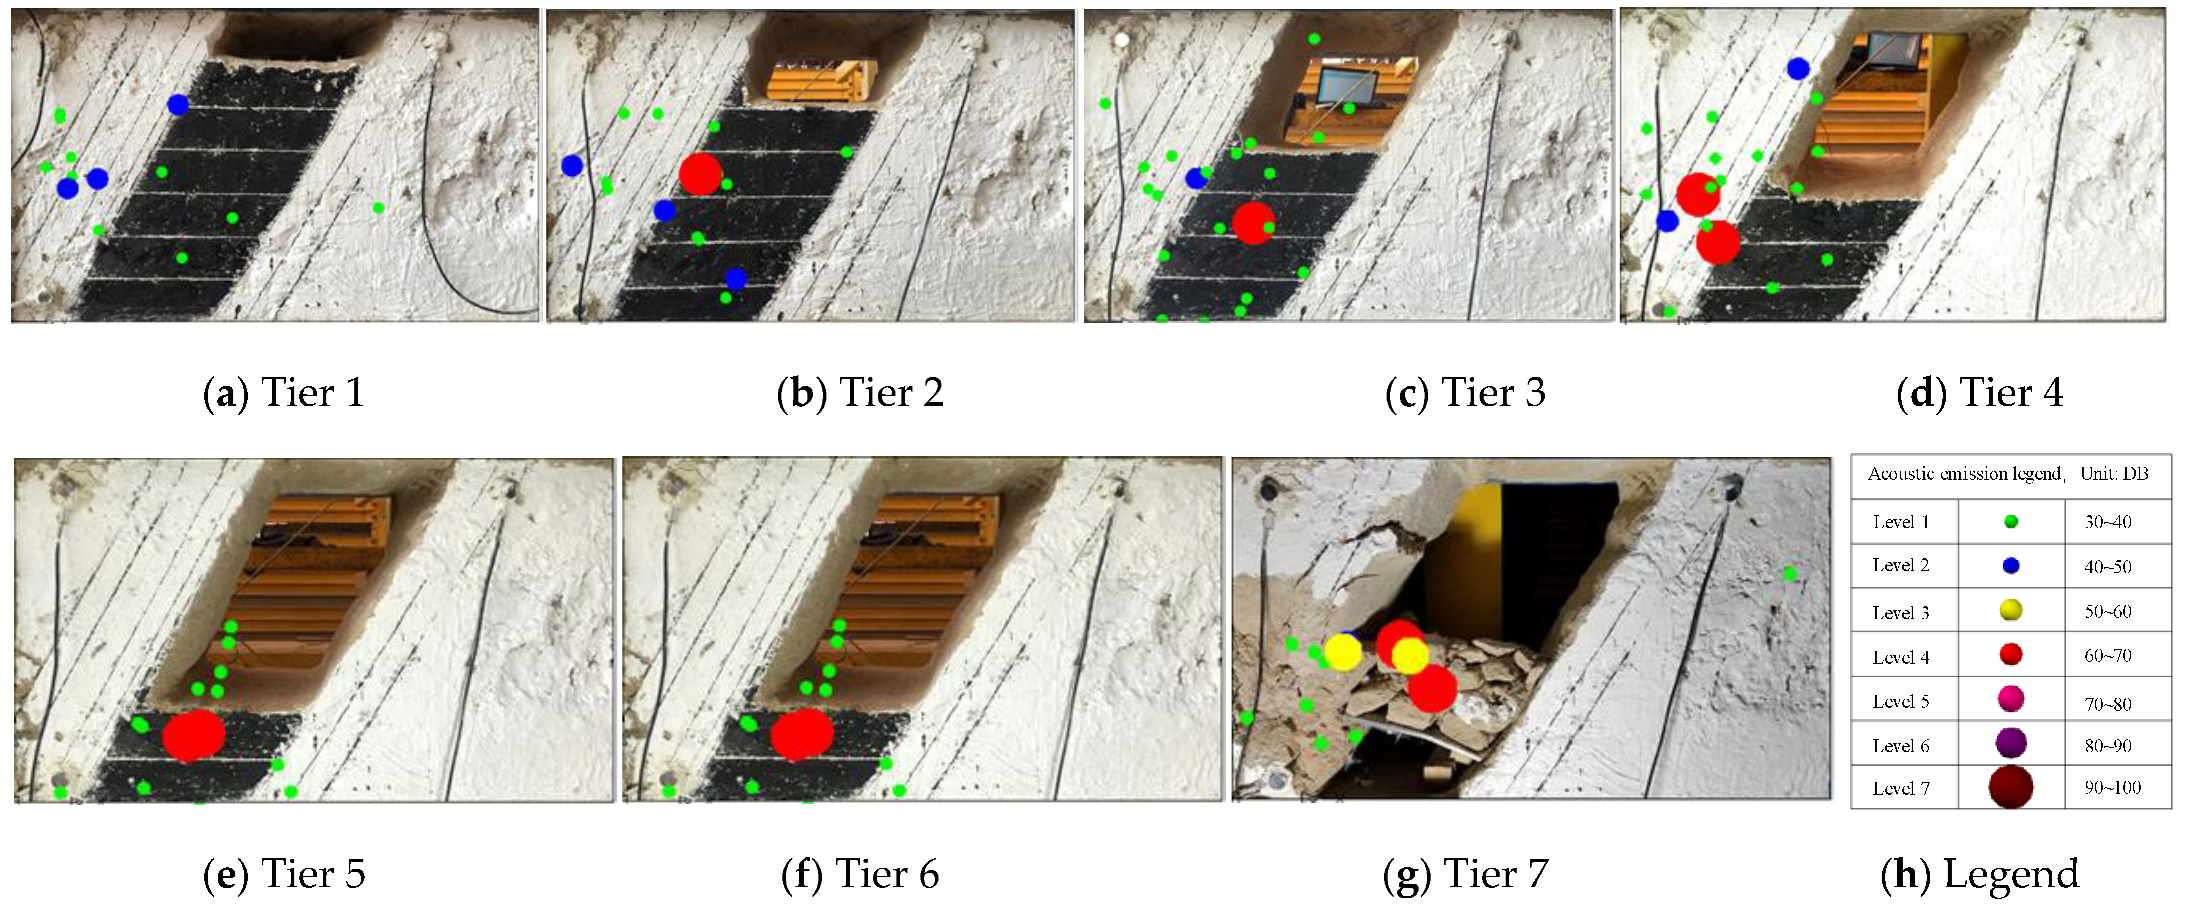
4.4.1. Acoustic Emission Localization Results
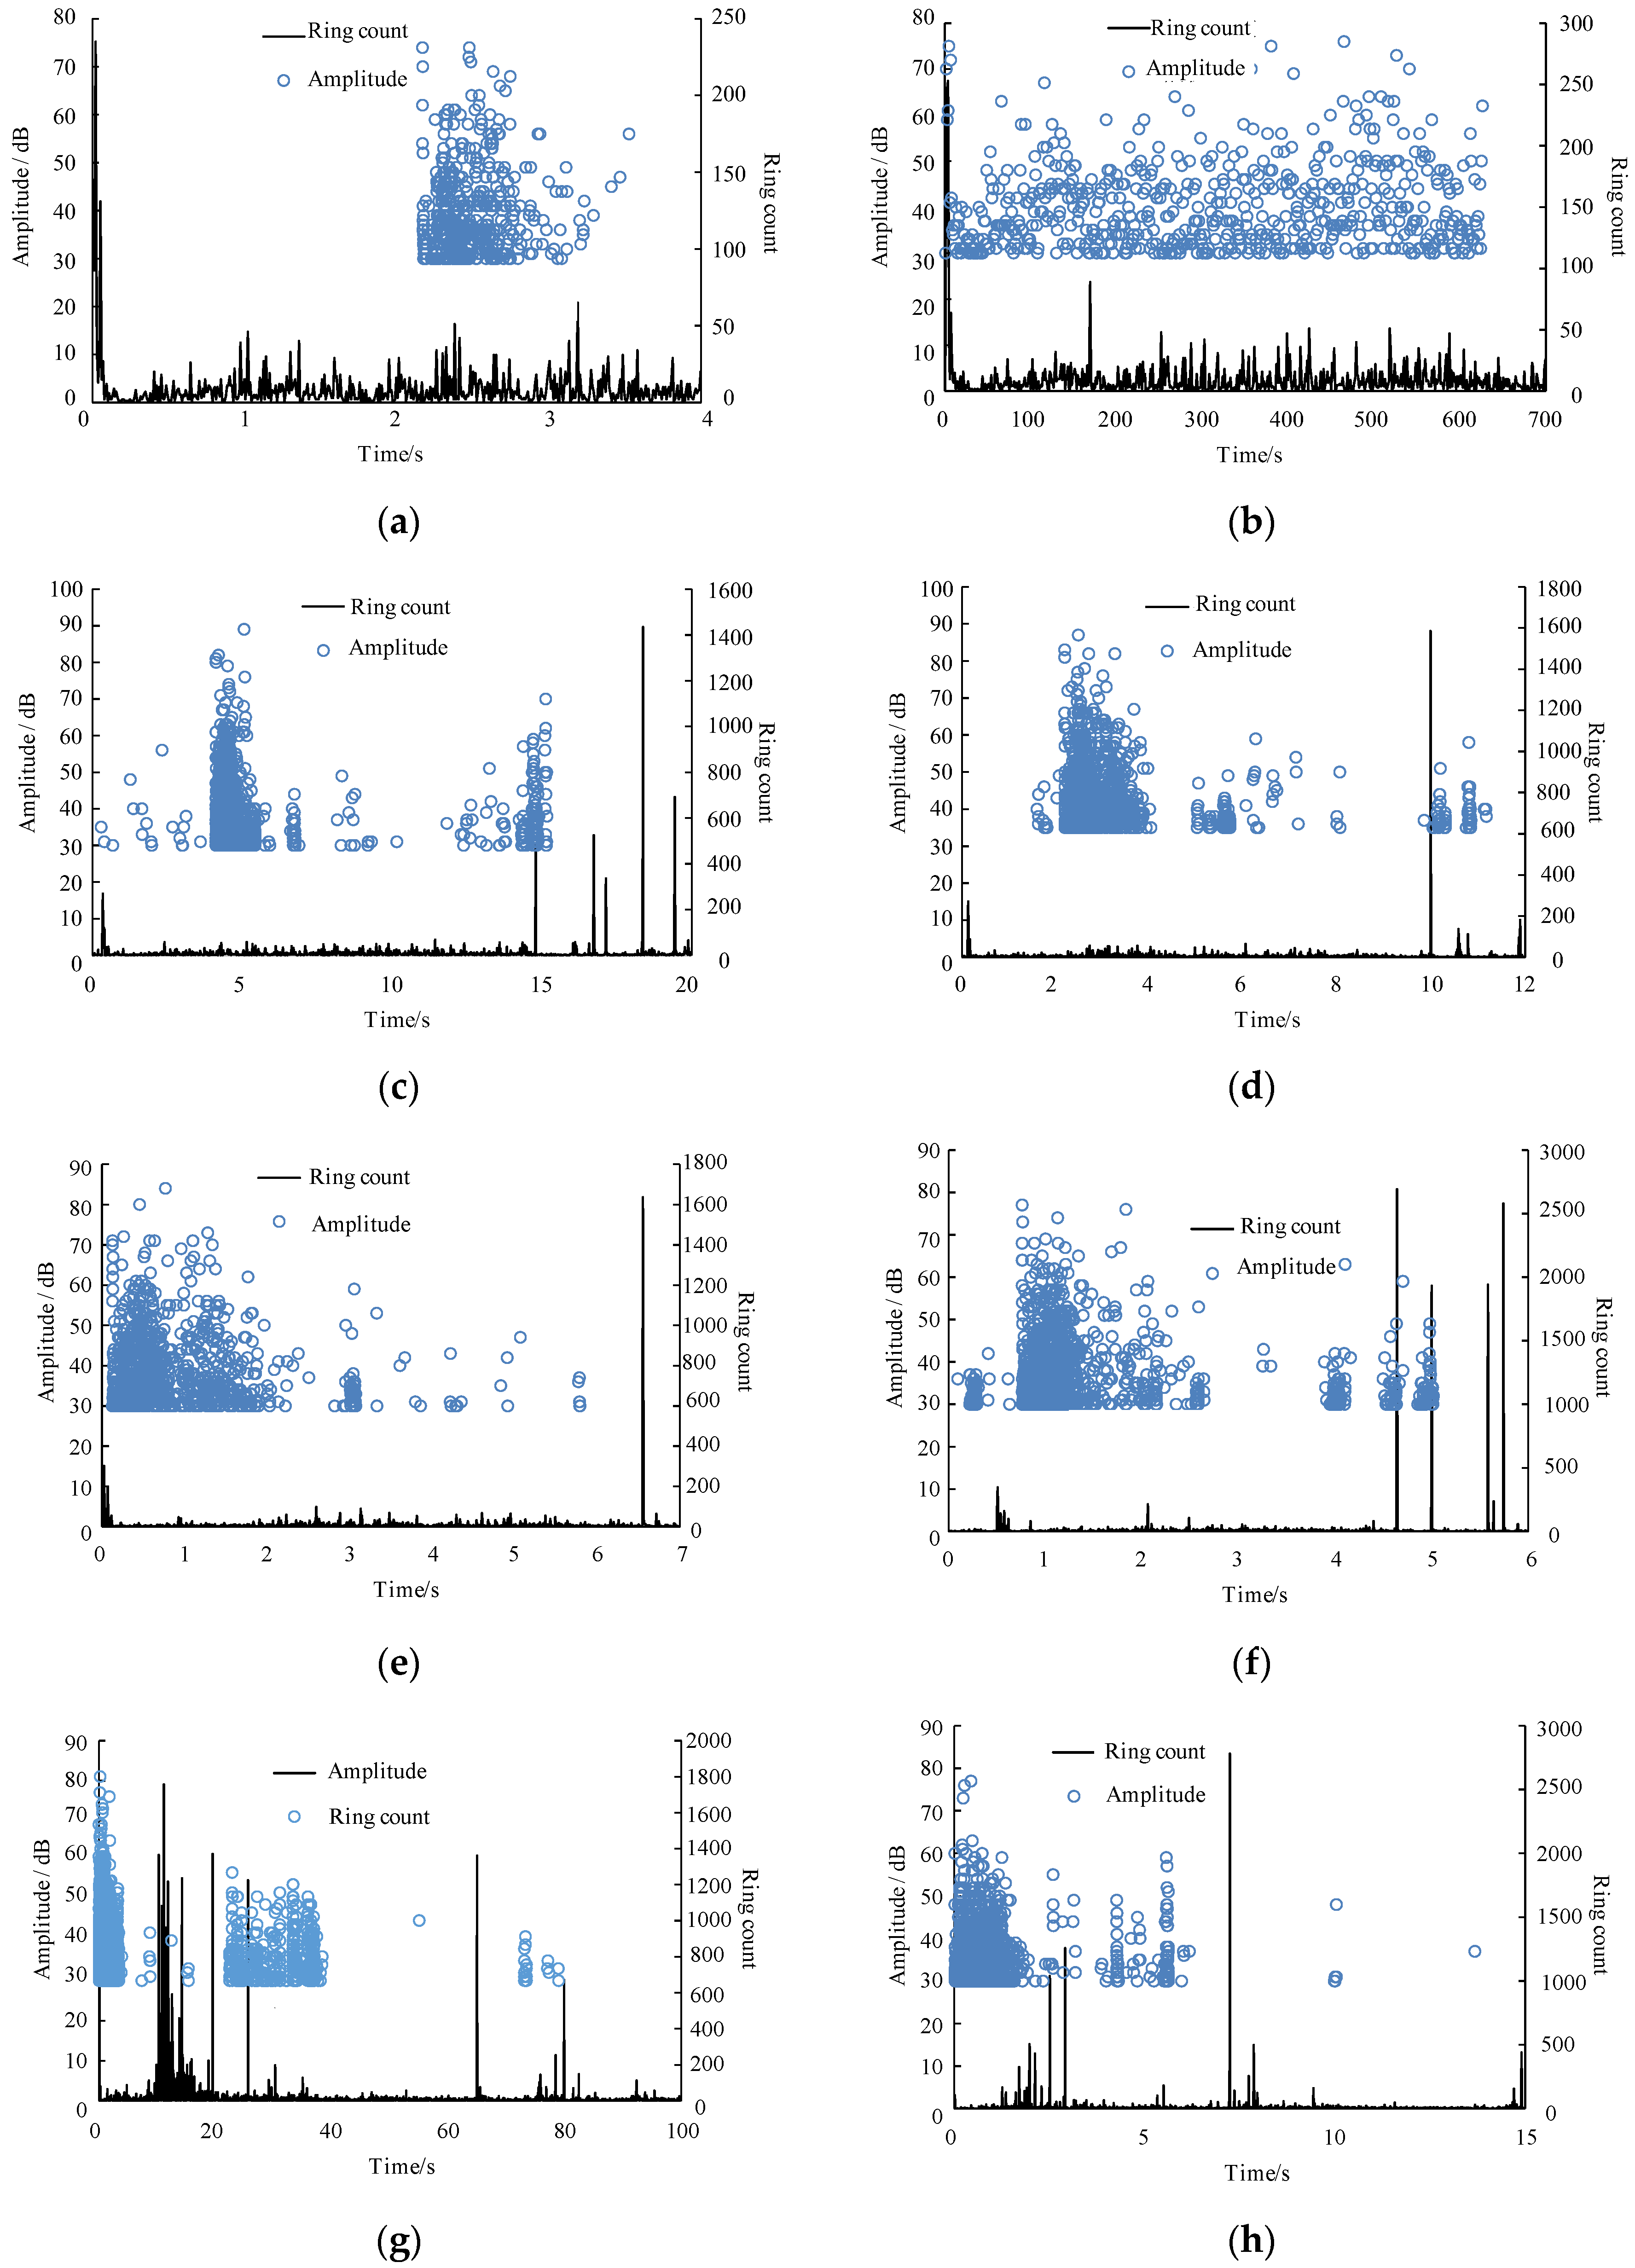
4.4.2. Characteristic Analysis of Coal Rock Fracture Signal
4.4.3. Characteristic Analysis of Acoustic Emission Activity
5. Conclusions
- (1)
- When the mining section of the steeply inclined ultra-thick coal seam is less, the roof of the upper goaf is suspended. With an increase in the mining section, the roof is gradually broken, and the broken block is dumped into the goaf due to gravity.
- (2)
- When the dynamic load energy is small, the model can resist the dynamic load disturbance. With the continuous increase in dynamic load energy, when the dynamic load energy exceeds the critical load of coal and rock under stress, it will cause the dynamic instability and failure of the moving load side of the roadway. It shows that the dynamic load-induced impact dynamic behavior requires critical energy, and the prevention and control of rock bursts are mainly aimed at strong earthquakes with large energy.
- (3)
- After the mining of the segmented working face, the stress of the side bottom coal of the working face is increased due to the influence of the lateral abutment pressure of the goaf, and the stress of the side bottom coal of the return airway is reduced due to the disturbance of the upper section mining. On the same side, the stress concentration phenomenon gradually increases with the increase in sub-mining depth, and the closer to the goaf, the more obvious the stress change in the coal below.
- (4)
- The dynamic load effect is transient. The negative peak value of acceleration is much smaller than the positive peak value, and the recovery time is short. The peak value increases linearly with the increase in the source energy, indicating that the negative acceleration is mainly caused by the reflection wave. Due to the vibration waves, the reflection tensile can be generated on the surface of the roadway, leading to the failure of the roadway. The stronger the dynamic load energy is, the higher the impact risk is.
- (5)
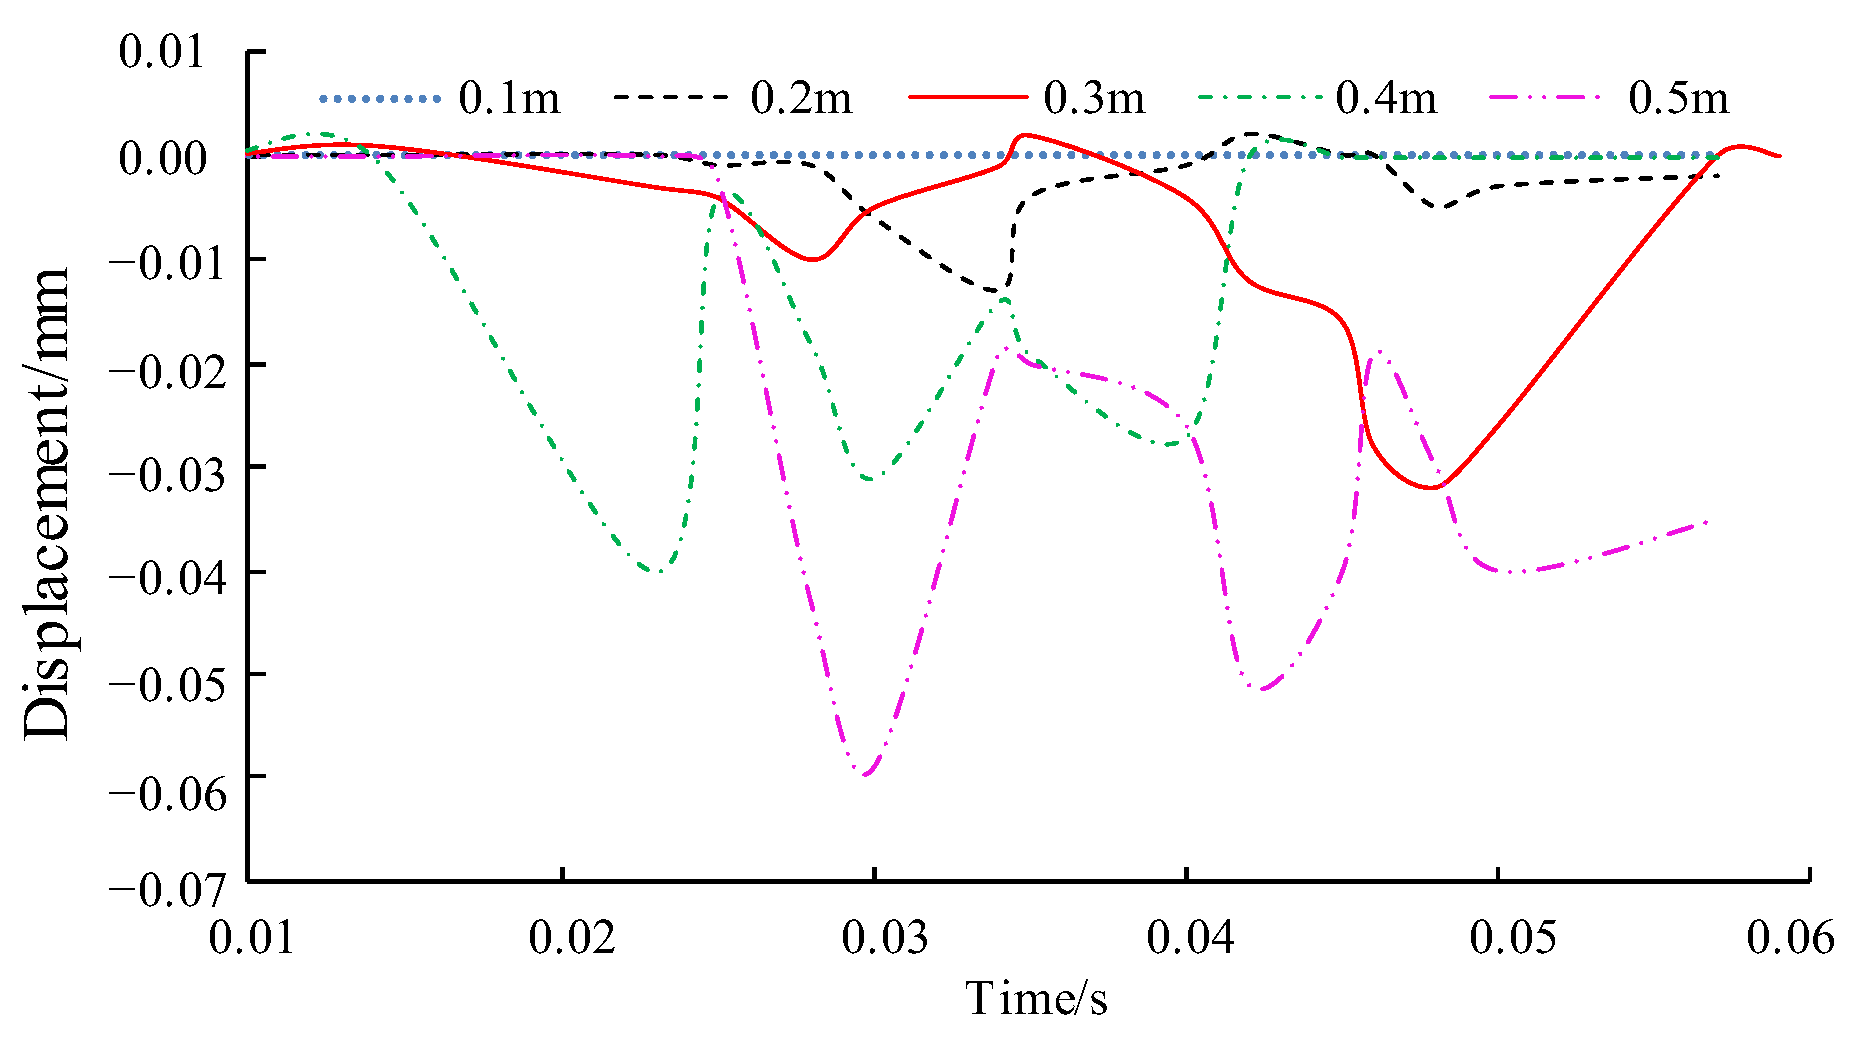
- When the dynamic load intensity is constant, the peak acceleration decreases with the increase in the propagation distance. The vibration wave has the dominant propagation direction, and there are certain differences in the form and direction of the action on the coal rock. Due to the dynamic load, the impact failure of coal has a critical displacement. When the displacement of the roadway surface is less than the critical displacement, no impact failure occurs. Therefore, strengthening roadway support is conducive to preventing rock bursts.
- (6)
- Large energy events often occur in the position of coal seam floor, which indicates that the stress of floor position is greatly affected by the goaf structure; the response characteristics are obvious after dynamic load loading, the degree of coal rock rupture is large, and the risk is high. The acoustic emission location and energy results can reflect the failure law of coal and rock mass. Microseismic monitoring can be used to judge the activity law of mining and excavation, so as to provide an early warning of the impact risk.
Author Contributions
Funding
Institutional Review Board Statement
Informed Consent Statement
Data Availability Statement
Conflicts of Interest
References
- Ju, W.J.; Zheng, J.W.; Wei, D.; Sun, L.W.; Li, W.Z. Study on the causes and control technology about the coal bump in multi-layered mining roadway in steep-thick coal seams. J. Min. Saf. Eng. 2019, 36, 280–289. [Google Scholar]
- Ju, W.; Li, W. Fracture mechanical model of main roof along inclined for fully mechanized top coal caving in steep and extra thick coal seam. J. China Coal Soc. 2008, 33, 606–608. [Google Scholar]
- Lai, X.P.; Liu, B.; Chen, J.Q.; Zhang, X.Z.; Sun, B.C.; Wang, J. Induced hazardprone prediction to the intermediate rock—Pillar dynamic instability in heavy steep—Thick coal seam. J. Xi’an Univ. Sci. Technol. 2015, 35, 277–283. [Google Scholar]
- Lai, X.P.; Sun, H.; Cai, M.; Chen, J.Q.; Chang, B. Mechanism of dynamic hazards due to coal and rock mass instability in extremely steep coal seams with the deepening mining. J. Xi’an Univ. Sci. Technol. 2017, 37, 305–311. [Google Scholar]
- Lai, X.P.; Yang, Y.R.; Chen, J.Q.; Ge, R.Z.; Cui, F. Control of dynamic hazards induced by mining stress distortion in extremely steep and thick coal seams. J. China Coal Soc. 2016, 41, 1610. [Google Scholar]
- Lai, X.P.; Yang, Y.R.; Shan, P.F.; Lv, Z.H. Comprehensive analysis of disaster-causing characteristics of roof stress superimposed effect in steeply inclined coal seams. J. China Coal Soc. 2018, 43, 70–78. [Google Scholar]
- Wang, Z.; Dou, L.; Wang, G. Coal burst induced by horizontal section mining of a steeply inclined, extra-thick coal seam and its prevention: A case study from Yao jie No.3 Coal Mine, China. Shock Vib. 2019, 2019, 1–13. [Google Scholar] [CrossRef]
- Li, A.N.; Dou, L.M.; Wang, Z.Y.; Xie, J.H.; Wang, Y.Z. Impact mechanism and prevention of clamped coal in horizontal sublevel mining of near vertical coal seam. J. Coal 2018, 43, 50–56. [Google Scholar]
- Dou, L.M.; He, J.; Cao, A.Y.; Gong, S.Y.; Cai, W. Superposition principle of dynamic and static loads of rockburst in coal mine and its prevention. J. Coal Ind. 2015, 40, 1469. [Google Scholar]
- Wang, N.; Zhang, N.; Cui, F.; Cao, J.; Lai, X. Characteristics of stope migration and roadway surrounding rock fracture for fully mechanized top coal caving face in steeply dipping and extra thick coal seam. J. China Coal Soc. 2013, 38, 1312–1318. [Google Scholar]
- Zhang, J.W.; Wang, J.N. Energy distribution characteristics and rock burst control methods of steeper inclined thick coal seam hanging roof. J. China Coal Soc. 2014, 39, 316. [Google Scholar]
- Jiang, F.X.; Shi, X.F.; Wang, C.W.; Wei, Q.D.; Yao, S.L.; Zhu, S.T.; Geng, C. Mechanical mechanism of rock burst accidents in slice mining face under high pressure. Chin. J. Geotech. Eng. 2015, 37, 1123–1131. [Google Scholar]
- Du, T.T.; Chen, J.Q.; Lan, H.; Sun, B.C.; Yang, L.; Liu, X.D. Risk analysis of rockburst in near vertical extra thick coal seam. Coal Sci. Technol. 2016, 44, 123–127. [Google Scholar]
- Yu, G.L.; Li, Q.; Wang, Y.J. Prevention and control technology of rock burst in layered mining of deep steep and extra thick coal seam. Coal Sci. Technol. 2011, 39, 17–21. [Google Scholar]
- Zhang, B.; Zhou, H.Q.; Chang, Q.L.; Zhao, X.; Sun, Y.T. The Stability Analysis of Roadway near Faults under Complex High Stress. Adv. Civ. Eng. 2020, 2020, 8893842. [Google Scholar] [CrossRef]
- Miao, S.; Lai, X.P.; Cui, F. Top coal flows in an excavation disturbed zone of high section top coal caving of an extremely steep and thick seam. Min. Sci. Technol. 2011, 21, 99–105. [Google Scholar]
- Miao, S.J.; Lai, X.P.; Zhao, X.G.; Ren, F.H. Simulation experiment of AE-based locali zation damage and deformation characteristic on covering rock in mined-out area. Int. J. Miner. Metall. Mater. 2009, 16, 255–260. [Google Scholar] [CrossRef]
- Cai, M.; Kaiser, P.K.; Morioka, H. FIAC/PFC coupled numerical simulation of AE in large-scale underground excavations. Int. J. Rock Mech. Min. Sci. 2007, 44, 550–564. [Google Scholar] [CrossRef]
- Jeoungseok, Y. Application of experimental design and optimization to PFC model calibration in uniaxial compression simulation. Int. J. Rock Mech. Min. Sci. 2007, 44, 871–889. [Google Scholar]


| Name | Lithology | Thickness (m) | Lithological Description |
|---|---|---|---|
| Main roof | Four layers of oil | 8 | Black, with dense structure and well-developed bedding. |
| Immediate roof | Quartz fine sandstone | 2–3 | Grey (off-white) siliceous cement, which is dense and hard. |
| False roof | carbonaceous mudstone | 1–1.6 | Black, scaly structure, easy to slide and fall. |
| Coal seam | 2# coal | 34–115 70.5 | Black, asphalt gloss, banded structure, block structure, stepped fracture. |
| Immediate floor | Carbonaceous mudstone with coal line or carbonaceous siltstone | 2–6 | Gray-black carbonaceous mudstone, gray-brown thin-layered fine sandstone, gravel-bearing sandstone, developed fissures, loose and easily broken, and softened in contact with water. |
| Main floor | sandstone | 0–232.61 40.14 | Grey-white fine sandstone. |
| Serial Number | Pendulum Height/m | Pendulum Angle/° | Analog Energy/J |
|---|---|---|---|
| 1 | 0.1 | 25.9 | 6.53 × 10⁴ |
| 2 | 0.2 | 36.8 | 1.31 × 10⁵ |
| 3 | 0.3 | 45.6 | 1.96 × 10⁵ |
| 4 | 0.4 | 53.1 | 2.61 × 10⁵ |
| 5 | 0.5 | 60 | 3.27 × 10⁵ |
| 6 | 0.6 | 66.4 | 3.92 × 10⁵ |
| 7 | 0.7 | 72.5 | 4.57 × 10⁵ |
| 8 | 0.8 | 78.5 | 5.23 × 10⁵ |
| 9 | 0.9 | 84.3 | 5.88 × 10⁵ |
| 10 | 1.0 | 90 | 6.53 × 10⁵ |
| Monitoring Horizon | Rock Formation Roof | Roadway Floor |
|---|---|---|
| fifth layer | 182.10 | 59.37 |
| sixth layer | 105.01 | 28.90 |
| seventh layer | 118.24 | 52.85 |
Publisher’s Note: MDPI stays neutral with regard to jurisdictional claims in published maps and institutional affiliations. |
© 2022 by the authors. Licensee MDPI, Basel, Switzerland. This article is an open access article distributed under the terms and conditions of the Creative Commons Attribution (CC BY) license (https://creativecommons.org/licenses/by/4.0/).
Share and Cite
Wang, Y.; Yuan, C.; Shi, X.; Chang, Q.; Zhang, B. Study on Dynamic Failure Characteristics of Coal and Rock in Stope Induced by Dynamic Load of Steep Horizontal Sublevel Mining. Processes 2022, 10, 1684. https://doi.org/10.3390/pr10091684
Wang Y, Yuan C, Shi X, Chang Q, Zhang B. Study on Dynamic Failure Characteristics of Coal and Rock in Stope Induced by Dynamic Load of Steep Horizontal Sublevel Mining. Processes. 2022; 10(9):1684. https://doi.org/10.3390/pr10091684
Chicago/Turabian StyleWang, Yongzhong, Chongliang Yuan, Xianyuan Shi, Qingliang Chang, and Biao Zhang. 2022. "Study on Dynamic Failure Characteristics of Coal and Rock in Stope Induced by Dynamic Load of Steep Horizontal Sublevel Mining" Processes 10, no. 9: 1684. https://doi.org/10.3390/pr10091684
APA StyleWang, Y., Yuan, C., Shi, X., Chang, Q., & Zhang, B. (2022). Study on Dynamic Failure Characteristics of Coal and Rock in Stope Induced by Dynamic Load of Steep Horizontal Sublevel Mining. Processes, 10(9), 1684. https://doi.org/10.3390/pr10091684