1. Introduction
With global warming issues having more and more influence on nature and human existence, the utilization of biomass as a source of renewable energy is receiving increased attention. Thermochemical conversion to syngas through the gasification of biological wastes like food, agricultural or wood residuals is one of various routes under discussion to produce energy from biomass on a larger scale, i.e., to provide a considerable part of our energy demand in a technological future which has to be free of fossil carbon use [
1] at acceptable costs [
2]. Besides renewability, availability on demand and production at relatively high efficiency—i.e., without the application of a high amount of (green) electricity—are the most important advantages of this kind of energy source. The biorefinery of those wastes by gasification to syngas is a very often discussed route of utilization. The syngas produced in gasifiers under conditions of oxygen deficit is composed of fuel components such as CO, CH
4, H
2, light hydrocarbons, water vapour and some residual oxygen. However, it also contains high amounts of undesirable components like particulate matter, and particularly tar [
3]. In recent publications—such as, for example, in [
4]—the syngas is reported to be the raw material for several second-step refinements, such as the production of liquid fuels (bioethanol) or chemicals by fermentation processes. However, the tar components are one of the major impurities which inhibit the performance of the microorganisms in the fermentation processes. Another, very attractive route of energy transformation is direct conversion to electric power by the utilization of the syngas in high-temperature solid oxide fuel cells (SOFCs) [
5]. In this process, tar has been identified to cause the degradation of the SOFC anodes. However, there is some hope that, at least at low concentrations, tar may be decomposed at the NiYSZ-anode of the SOFC, as was experimentally demonstrated with real wood syngas extracted from a pilot batch gasifier [
6]. Moreover, it is well known that tar components of higher molecular weight, which can condensate or polymerize at relatively high temperatures, cause operational problems when syngas is used in diverse appliances. The blocking of gas coolers, filter elements or exit pipes—e.g., when used as the fuel to operate combustion engines for the generation of electricity or in combustion systems for heat production [
7]—is a typical operational risk.
Tar represents a complex mixture of aromatic compounds, such as toluene, phenol or naphthalene [
7], which vary in relative fractions and absolute concentrations related to the composition of the biomass fuel, the type of the gasifier, and the actual quality of the gasification process, as determined by the operation conditions such as the temperature, pressure and gasification agent [
3,
8]. In particular, the tar compounds of class 1 (very-heavy tars), class 2 (heterocyclic aromatics, such as phenol or pyridine), class 4 (light polycyclic aromatic hydrocarbon (PAH), such as indene or naphthalene), and class 5 (heavy PAH, such as pyrene or chrysene) condensate even at temperatures higher than 100 °C if their concentration is higher than 1000 mg/m
3. An exception is class 5 tar, which condensates even at concentrations below 1 mg/m
3. All of them have been identified to cause major risks in long-term operation of those appliances [
7].
To overcome these problems with tar impurities, extensive gas cleaning is necessary in order to enable the use of syngas mainly for fuel applications, as was already mentioned above. Different methods of tar removal have been proposed, such as, e.g., the combination of the gasification reactor with catalyst sorbents [
9], catalytic cracking [
10] or partial oxidation at high temperatures [
11], as have been reported recently. Of course, all of these methods of syngas cleaning provoke additional costs; therefore, there is no doubt that the minimization of tar formation by the optimized control of the gasification process is highly desirable. In this context, one of the major challenges is the continuous monitoring of the tar in the syngas even at low concentrations, in order to enable (i) the feedback-controlled operation of the gasification process for the minimization of tar production at maximized efficiency, and (ii) a reliable tracing of the efficiency of the tar removal process.
The analysis of tar by conventional off-line analysis methods, such as GC/MS [
12], is characterized by high accuracy and reliability. However, due to rather long sampling and measurement times in the range of an hour, they are not suitable for continuous gasification process control. In the actual situation, no in-situ analysis instrument for continuous tar monitoring in syngas has been established. In the last ten years, several online-detection methods were investigated and their applicability was published. Good sensitivity to different tar components and rapid response is achieved by the direct measurement of the tar components in the vapour state using a photo ionization detector (PID) operated with a UV lamp filled with xenon. This provides a UV-light emission spectrum which allows the selective online-measurement of the tar components diluted in the syngas. However, a dramatic loss of sensitivity was observed in terms of a day, which was interpreted to be due to deposition of (tar)molecules on the excitation chamber windows during the measurement procedure [
13]. Other monitoring concepts are based on the fluorescence characteristics of aromatic molecules. In an early work, the online analysis of tar components in syngas was reported by the use of a Nd:YAG laser as the light source, a spectrograph and a CCD-camera for light analysis [
14]. Meanwhile, LED-induced fluorescence is available using a photomultiplier [
15] or a spectrometer for fluorescent light analysis [
16]. These light-based online monitoring concepts are without doubt very interesting. However, they have in common the fact that high effort—such as the gas purging of the excitation windows under high temperature conditions—is necessary to prevent the deposition of condensable molecules. Indeed, such a setup which allows stable measurements over weeks was reported previously [
16]. In any case, the service efforts needed to keep those light-analysis methods running well seem to be quite high, which could probably make the system rather expensive in terms of daily use. A completely different, more robust tar monitoring concept is based on differential measurement of total hydrocarbon using an FID detector [
17]. In the first setting, the hot syngas sample is analysed. From this signal, the signal of the second setting is subtracted, at which point the tar will have been removed by a cooled trap. This latter method seems to work well, but suffers mainly from the drawback that the FID-signal in both settings represents the whole content of ionizable components, respectively. This means that from two large signals a very small difference has to be calculated in the case of low tar content. With regard to inaccuracies of measurement, this results in a relatively high lower-detection limit value of several g/m
3 [
17].
In this article, the authors are pleased to report a new method of tar monitoring which is based on the determination of the oxygen demand for complete, catalytically induced tar oxidation at the Pt-electrodes of a lambda-probe, which simultaneously acts as a robust sensor for the continuous monitoring of the residual oxygen concentration. Particular attention is paid to the utilization of the method for the analysis of hot syngas by the combination of devices which have shown their robustness under these hot conditions with others which are operated in the ambient temperature zone (versatile components, such as valves, pumps or mass-flow controllers (MFCs)) in order to gain very good long-term stability and keep the costs at a rather low level.
2. Materials and Methods
2.1. Tar Online Analysis by the Estimation of the Oxygen Demand
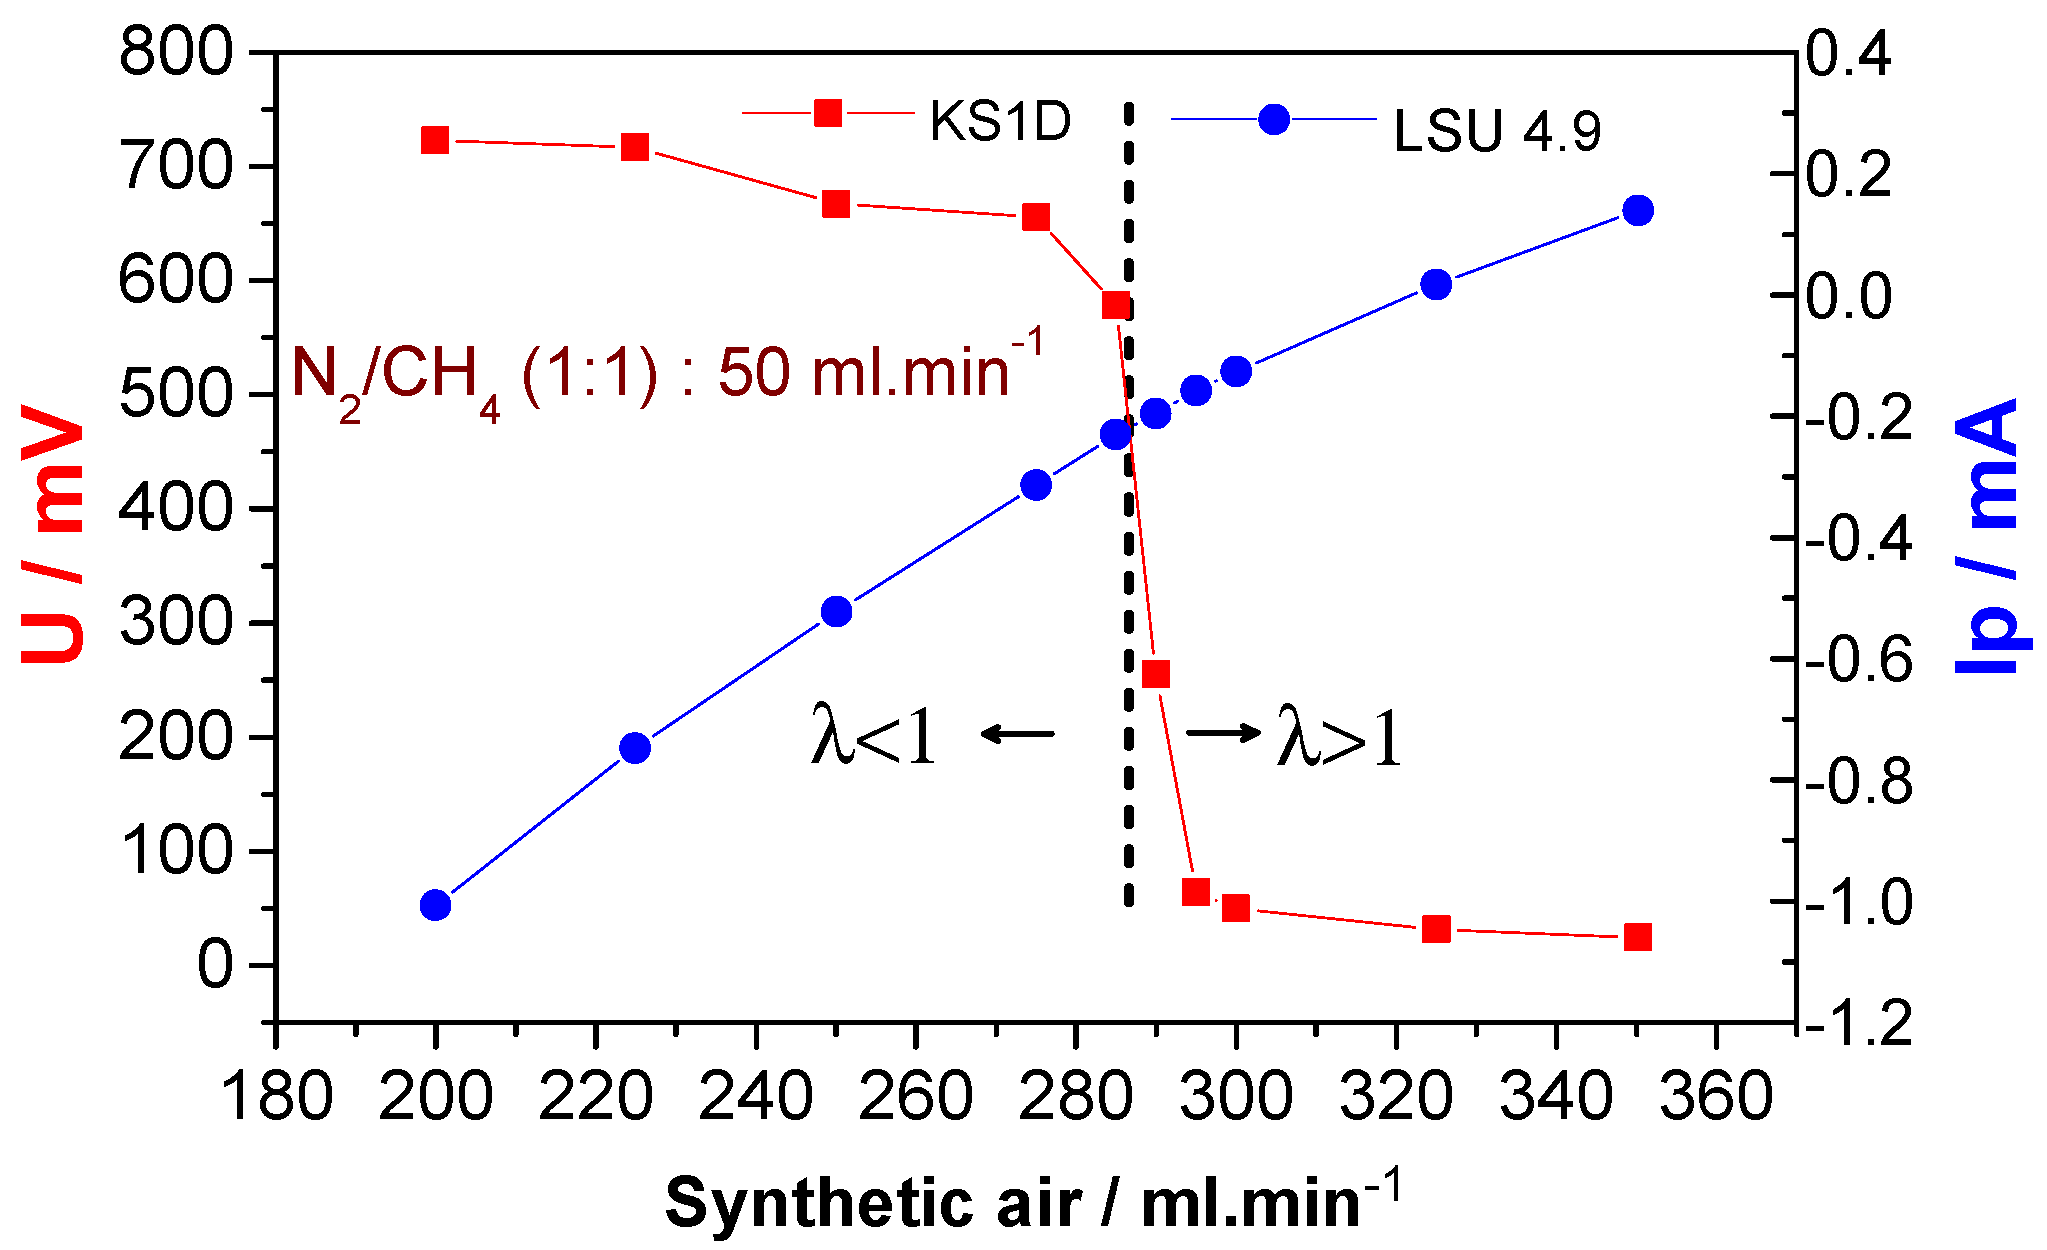
The idea of this new concept of tar monitoring is to measure the oxygen demand of the combustion of a low, but well-defined flow of syngas extracted from the output gas stream of the gasifier. This value is estimated in two steps. In the first measurement setting, a stoichiometric condition is adjusted by the admixture of a synthetic air flow with the extracted syngas flow in order to achieve an air concentration level at which the combustion of all hydrocarbons and CO is stoichiometric. At the corresponding Lambda-leap (λ = 1), the equilibrium potential of the classical high-temperature Nernst oxygen sensor changes abruptly vs. the oxygen concentration (
Figure 1). This means that this stoichiometric point of gas admixture with synthetic air can be measured very accurately [
18]. It is determined in a feedback loop of synthetic air adjusted by an air mass flow controller (MFC) and the voltage of a Pt/YSZ—solid electrolyte high-temperature oxygen concentration cell (YSZ: yttrium-stabilized zirconia). This oxygen sensor is commercially available as a lambda probe, and has been introduced worldwide, e.g., for the lambda control of combustion engines in motor cars.
After the adjustment of the λ = 1 condition in the first setting, in the following second setting, the tar in the syngas is first trapped by a gas cooler, and then the tar-free syngas is admixed with the synthetic air of the same flow adjusted in the first setting. The difference in oxygen concentrations of the first and second setting—i.e., the corresponding signal difference of the lambda probe—relates directly to the excess oxygen concentration (λ > 1) measured in the second setting, which represents the oxygen demand of tar combustion. This relation of the excess oxygen concentration to the oxygen demand of tar combustion is only valid if the compositions of the syngas and its flow rates in both settings are equal.
2.2. Continuous Oxygen Sensing and the Determination of the Tar Concentration
For the estimation of the oxygen concentrations in the first setting (syngas with tar, λ = 1) and in the second setting (syngas after tar condensation, λ > 1), an advanced high-temperature solid electrolyte Pt/YSZ oxygen sensor LSU 4.9 (Bosch GmbH (Stuttgart, Germany)) was used. This device is a combination of two solid-state electrochemical cells which consist of a Pt/YSZ Nernst concentration cell and an oxygen diffusion limited Pt/YSZ/Pt-coulometric cell [
19]. The sensor element is operated at an electrochemical state at which the gas molecules reaching the internal Pt-electrode via a diffusion channel (i) equilibrate chemically and thermodynamically with the oxygen according to reaction Equation (1), and (ii) the residual oxygen molecules in the case of excess oxygen are electrochemically reduced to O
2−-ions (Equation (2)). In the electric field applied between the inner Pt-cathode and the outer Pt-anode of the coulometric cell [
19], the O
2− ions are transported out of the cell via the YSZ solid electrolyte and reoxidized at the Pt-anode (Equation (3)).
The corresponding electric current Ip relates directly to the diffusion-limited current of the oxygen molecules into the reaction cell, and is therefore linearly dependent on the residual oxygen concentration in the syngas in thermodynamic equilibrium with all of the other gas components according to Fick’s first law.
The Ip(λ = 1) value and its (nearly) linear slope of change with the excess residual oxygen concentration (
Figure 1) are specific signal values of the individual LSU 4.9 oxygen sensor element, and therefore they had to be calibrated. This was achieved by the simultaneous measurement of the electromotive force (U/mV) of a commercial lambda sensor, realized as a classical Nernst oxygen concentration cell (KS1D, Lamtec Mess- und Regeltechnik für Feuerungen GmbH & Co KG, (Walldorf, Germany)), and of the Ip of the LSU 4.9 in a constant flow of N
2/CH
4 (1:1) gas admixed with various well-adjusted flows of synthetic air by the use of gas flow controllers. The signals are depicted in
Figure 1. The quasi-linearity of the signal of the LSU 4.9 oxygen sensor with the oxygen dosage is demonstrated at least for values in the neighbourhood of the Lambda-leap around λ = 1, and the Ip(λ = 1) = −0.22 mA could be determined quite accurately. This value of the LSU 4.9 oxygen sensor was further used in the following experiments for the adjustment of the stoichiometric oxygen dosage.
According to the considerations described above, the oxygen demand is calculated from the signal difference of the LSU 4.9 oxygen sensor.
Ip(SG) represents the signal of the LSU 4.9 lambda probe measured at λ = 1 in the syngas, as extracted from the gasifier (first setting), and Ip(SGT) is the signal measured after the trapping of the tar (second setting). The difference is proportional to the difference of the oxygen partial pressures Δp(O
2). The factor ε represents the gas transport conditions by diffusion into the Pt/YSZ solid-state reaction cell (LSU 4.9), such as the geometry (cross area and length) of the diffusion channel and the diffusion coefficient. Those parameters are all constant at the constant operation temperature of the sensor element (about 600 °C). The tar content of the syngas is now directly related to Δp(O
2), which in good approximation represents the residual oxygen partial pressure measured without tar, or in other words, the oxygen demand for tar combustion. In the case of the model syngas N
2/CH
4/naphthalene with naphthalene as the model tar, the proportional factor κ (Equation (4)) is well defined by the stoichiometry of the oxygen demand for complete tar combustion at the Pt-electrode of the sensor element (Equation (1)), which works as an excellent oxidation catalyst. For another model tar—such as, e.g., phenol or indene—the individual stoichiometry of combustion will estimate this factor. This means that, in typical gasification situations with an unknown concentration and composition of the tar, the monitoring of the oxygen demand (i) only enables us to determine a tar concentration which is equivalent to the model tar by which the system was calibrated, e.g., the naphthalene equivalent tar concentration; (ii) is limited to the (different) condensation properties of the tar components depending on the (different) saturation partial pressures at a given temperature of the gas cooler; and (iii) relates, in its result, to dried syngas because in the gas cooler the humidity is condensed as well. Based on the data given in the excellent review of Chunshan Li et al. [
7], a temperature of the gas cooler lower than 0 °C should be low enough to monitor all of the relevant tar components sensitively enough to meet the application demands.
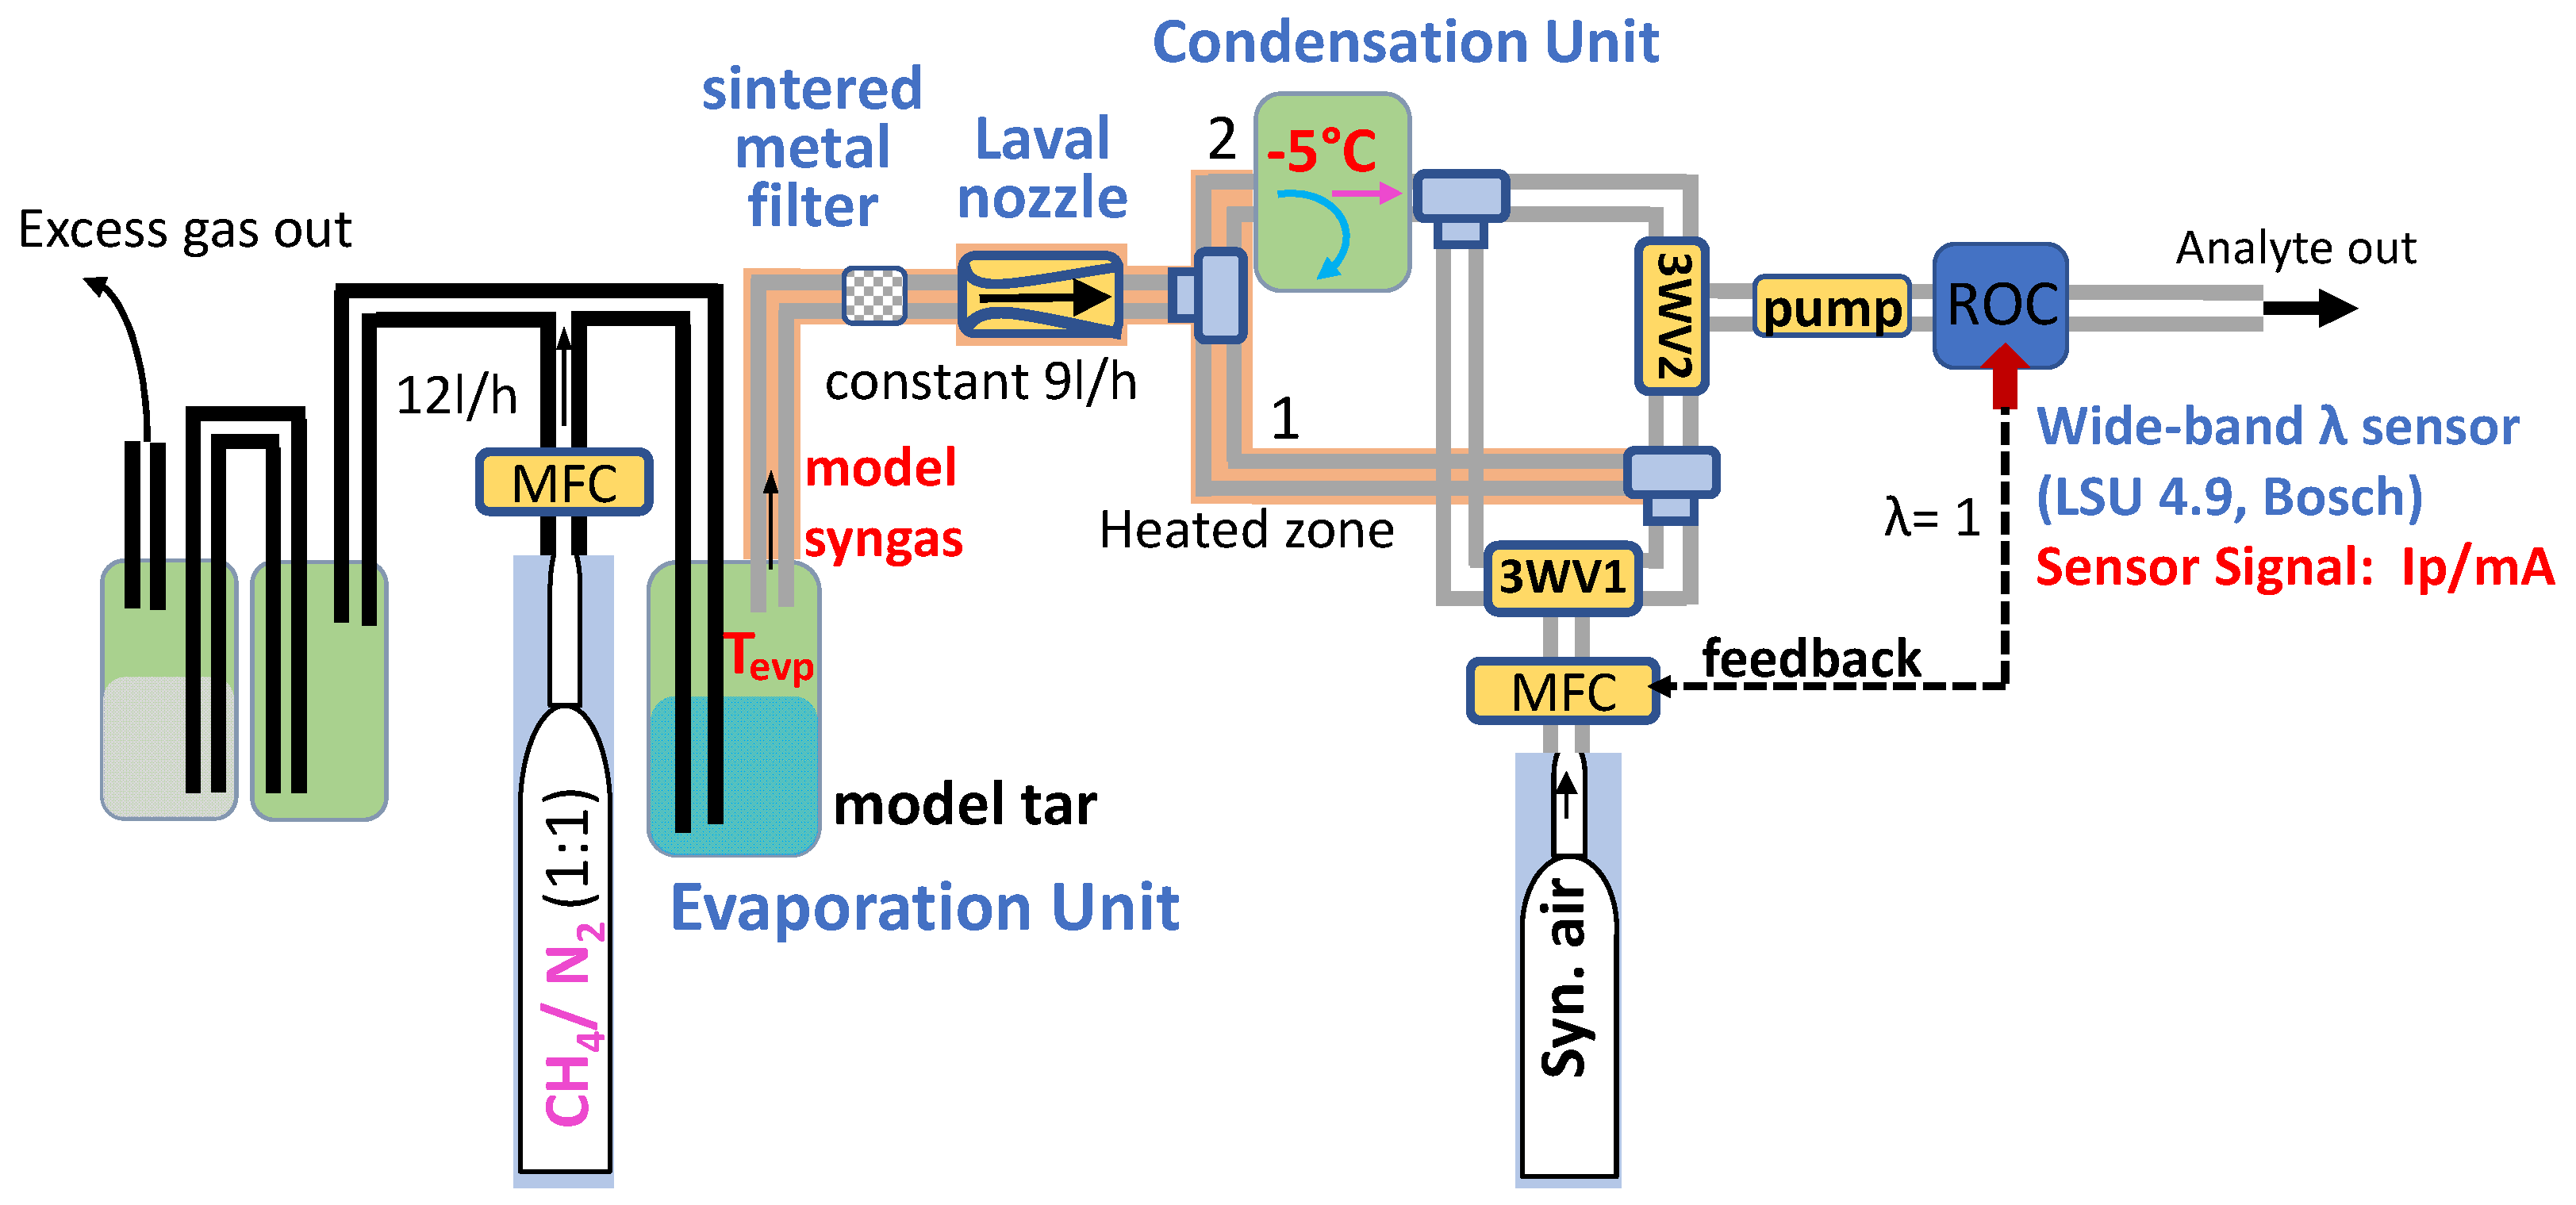
2.3. Evaluation of the Tar Monitoring Concept with Model Syngas
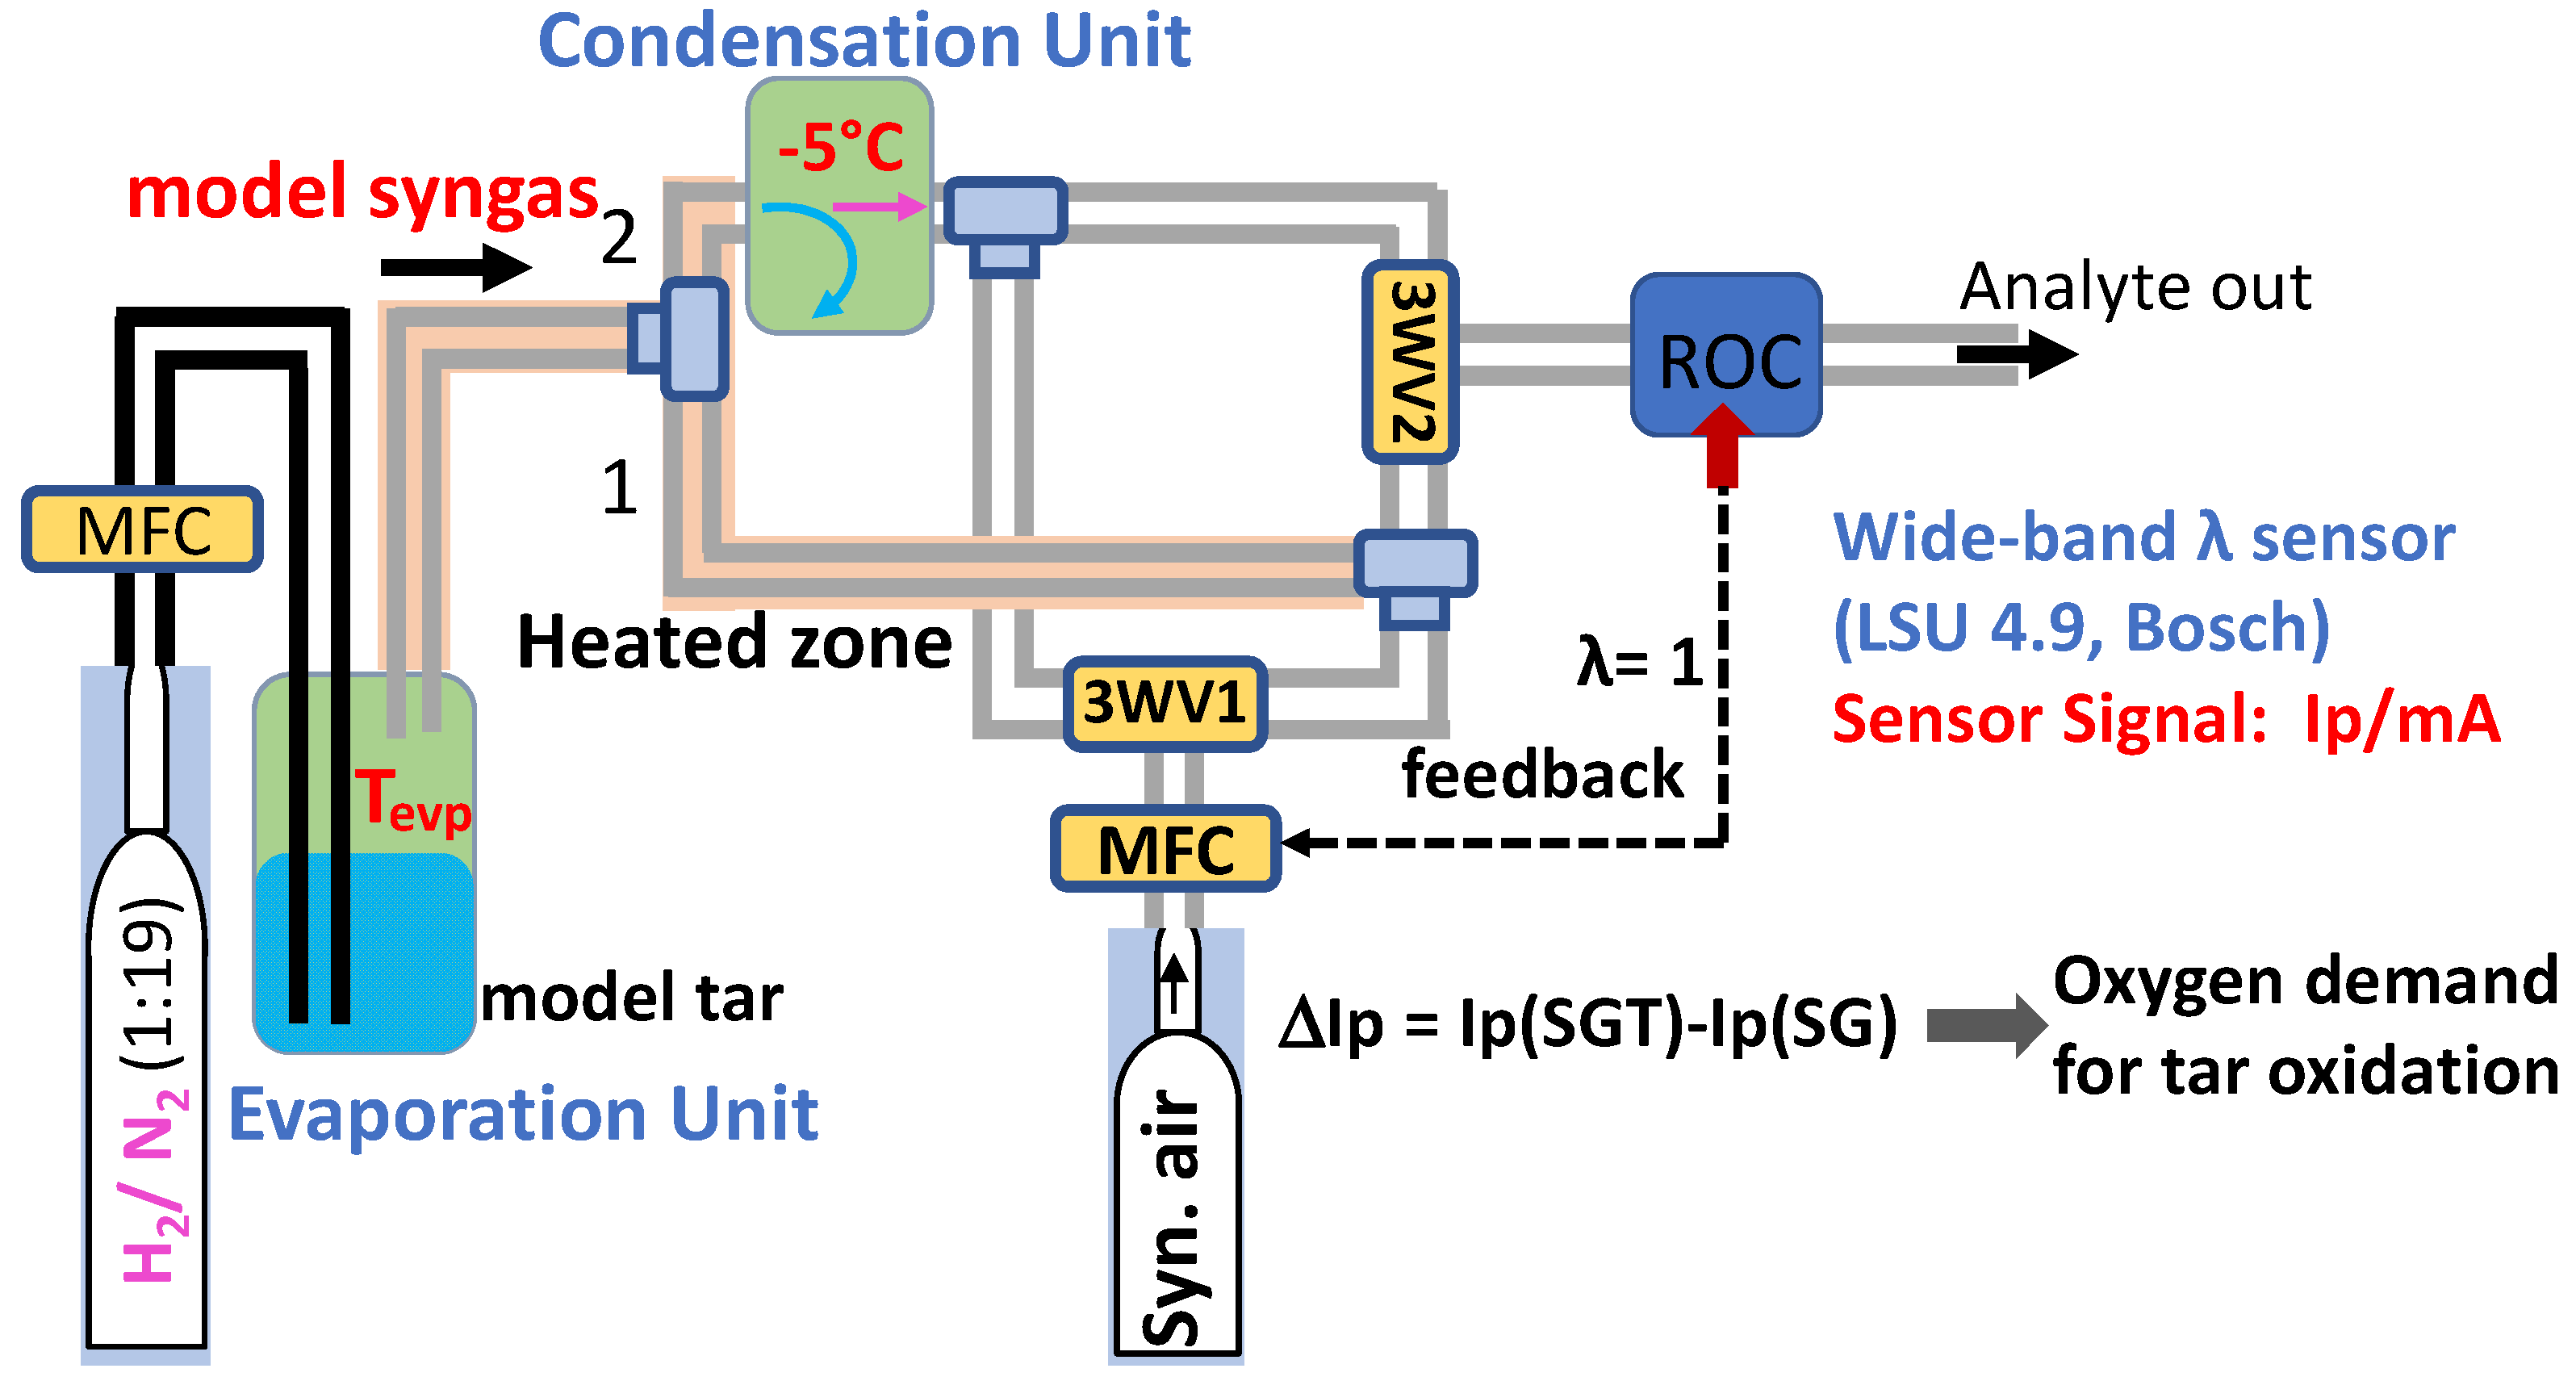
The sensitivity, accuracy and detection limit of this novel tar monitoring method were experimentally evaluated in the laboratory using naphthalene as a model tar in a 19:1 admixture of N2 and H2 forming the model syngas. The model tar content of the model syngas was varied by leading a constant N2/H2 gas flow through an evaporator operated at a variable but well-adjusted temperature, Tevp. In this way, according to the Clausius Clapeyron equation, the naphthalene saturation concentration was varied in the concentration range between 14 ppm/74 mgm−3 (Tevp = −5 °C) and 465 ppm/2300 mgm−3 (Tevp = 40 °C).
The tar was periodically trapped in a self-constructed condensation unit by switching a 3-way valve (3WV2) between two syngas pathways (
Figure 2) in coincidence with the switching of the synthetic airflow (3WV1), which alternatively represented the first and second measurement setting (
Section 2.2). The gases were conducted in heated noble steel tubes (300 °C) in order to prevent condensation effects outside the condensation unit. This experimental setup allows the periodic condensation of the (model) syngas stream components over several days at a syngas flow which is not higher than 50 mL/min. The temperature of the condensation unit was set in the bath of a commercial thermostat (Lauda RE207 Ecoline laboratory chiller, Lauda Dr. R. Wobser GmbH & Co. KG, (Lauda-Königshofen, Germany)) which can be cooled down to temperatures below −30 °C using ethylene glycol as a coolant.
2.4. Tar Monitoring Concept for the Analysis of Real Hot Syngas
For the continuous monitoring of the tar content in real hot syngas of a gasifier by the determination of the oxygen demand following the method described above (
Section 2.2), it was crucial to find a solution for the long-term continuous extraction of a small, but constant, hot syngas stream from the syngas outlet of the gasifier. The option to operate a gas pump in the hot zone (300 °C) of a syngas extraction system was ruled out because such pumps are non-standard, vulnerable in operation under such harsh conditions, and generally very costly.
This motivated the conception and experimental simulation of a syngas extraction system in the laboratory with all of the versatile parts (valve, pump) outside the hot zone. At first, the setup had to be evaluated in the laboratory. The mass flow controller for the adjustment of the model syngas flow (
Figure 2) was operated at an excess flow (simulating the syngas flow of the gasifier) and combined with a particle filter (a sintered porous metal plate (10 µm), GKN Sinter Metals Engineering GmbH, Germany) and a Laval nozzle (
Figure 3). The nozzle was dimensioned by the producer (Ehrler Prüftechnik (Niederstetten, Germany)) for a flow of about 9 L/h at 320 °C. Both were operated in the hot zone and combined with a gas pump (Gardner Denver Thomas GmbH (Fürstenfeldbruck, Germany)) operated in the ambient air zone which produced a vacuum pressure of less than 400 hPa, i.e., the Laval nozzle was operated in the supersonic mode, at which the flow is independent of smaller fluctuations of the pressure but depends sensitively on the temperature. This means that in order to keep the syngas flow constant and to prevent any condensation of tar in the extraction system, the Laval nozzle, the particle filter and the noble steel tubing up to the synthetic air admixture (setting 1) and condensation unit (setting 2), respectively, had to be electrically heated at a constant 300 °C. The setup is visualized schematically in
Figure 3.
As was already mentioned, a clear advantage of this setup is that all of the devices with versatile parts (switches, pump) are operated outside the hot zone at nearly ambient temperature conditions, and for the tar monitoring an oxygen sensor (LSU 4.9, Bosch (Stuttgart, Germany)) is used, which has demonstrated excellent robustness and long-term stability in harsh environments, such as for hot exhaust gases of motor cars.
2.5. Evaluation of the Tar Monitoring System at a Gasifier Fuelled with Wood Chips
Finally for the evaluation of this new tar monitoring concept, the setup as described in
Section 2.2 was directly connected to the hot output tube of a gasifier (
Figure 4). For the periodic condensation of the tar, the condensation unit was operated at temperatures down to T = −30 °C, and again the two measurement settings were switched by 3WV2 and 3WV1. This limits the lower limit of detection of some class 3 tar components—such as toluene—to rather high values (toluene sat. partial pressure at −30 °C: 1070 ppm). Hence, these tar components are of minor relevance with respect to condensation risks in considered appliances [
7]; therefore, this limitation was accepted for a preliminary evaluation of functionality.
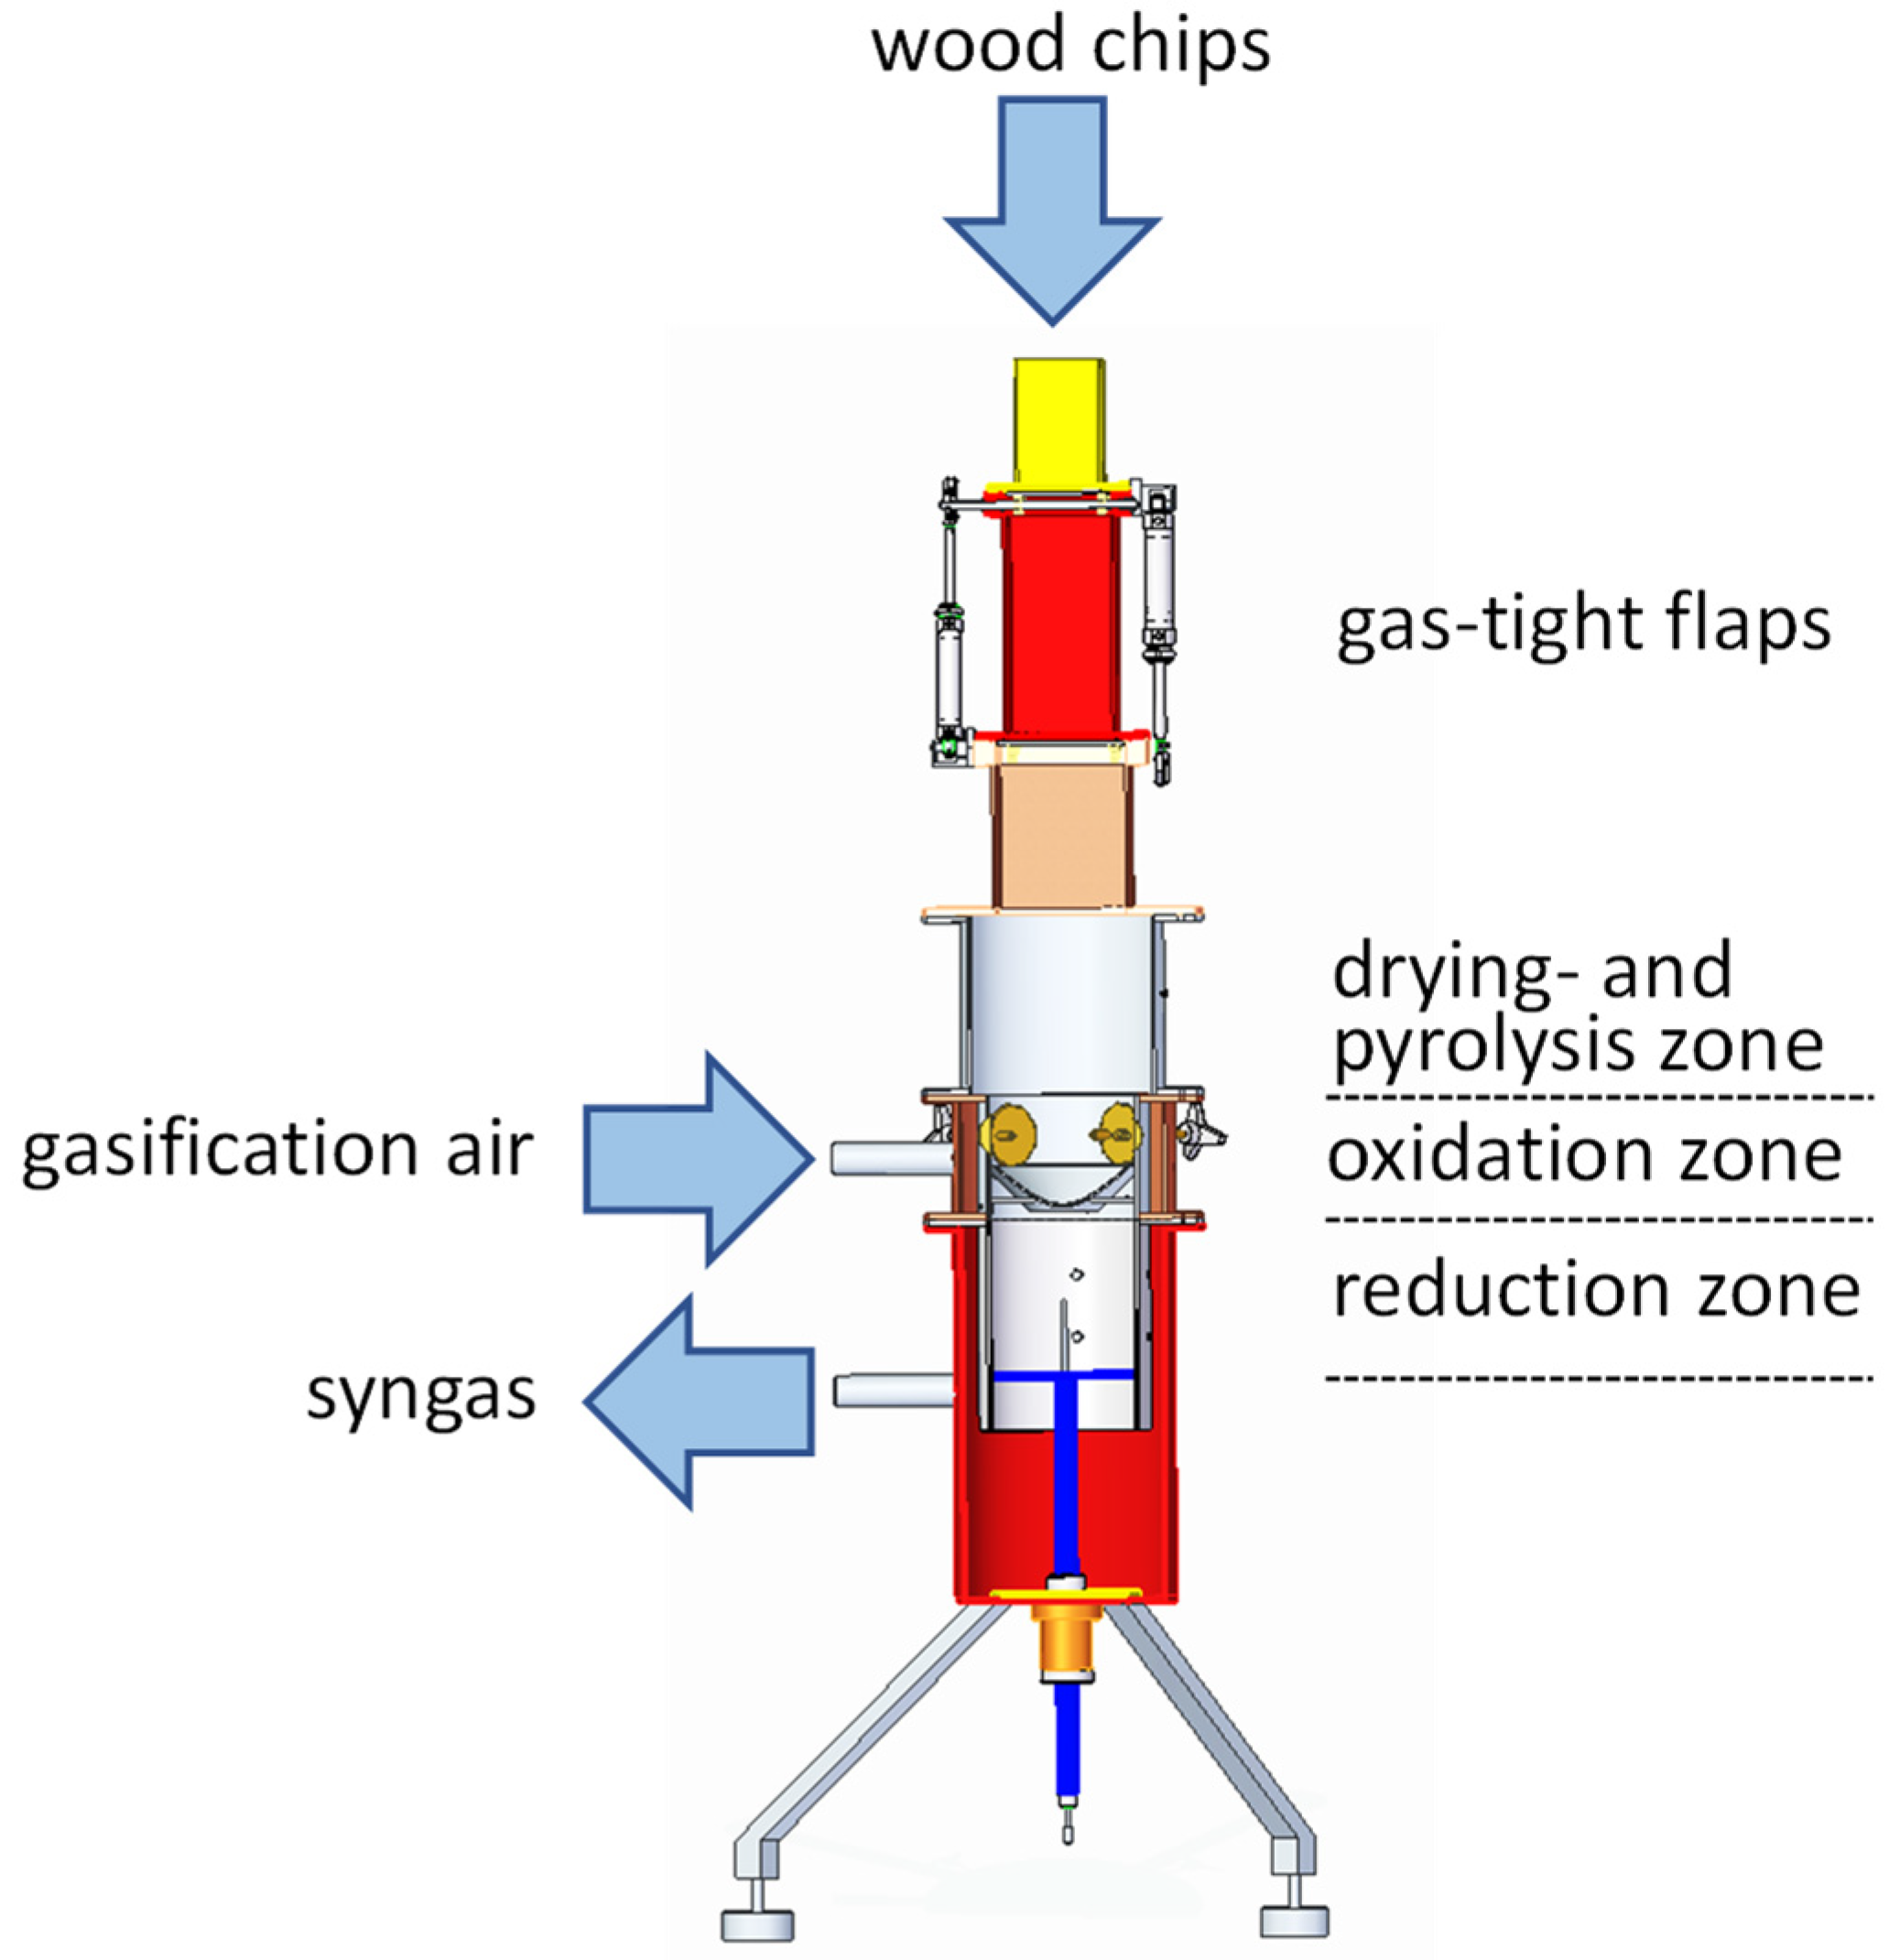
The wood chip gasifier used for the evaluation was a downdraft fixed-feed gasifier (
Figure 5).
As the fuel, coniferous wood chips with a humidity of 7–9 wt.% were used. The fuel level of the gasifier was kept roughly constant by the estimation of the weight and the periodic refilling of the fuel portions (500–600 g) every 2–3 min by an automated belt conveyor. This lead to a quasi-steady-state gasification process. A feeding system which operates two flaps avoids the entry of external air during the filling process. The raw syngas with the main components N2, CO2, CO, H2 and CH4 was extracted at a slight underpressure, and left the gasifier at a temperature of about 450 °C.
For the tar monitoring, the hot syngas was extracted immediately at the gasifier outlet. However, the gas samples for the continuous monitoring of the non-condensable components of the syngas were extracted downwards after the heat exchanger stream. CO2, CO and CH4 were measured continually by infrared absorption analysis, and the H2 concentration was estimated by the measurement of the thermal conductance (Advanced Optima Continuous Gas Analyzers, ABB Automation GmbH, Frankfurt, Germany).
4. Conclusions and Outlook
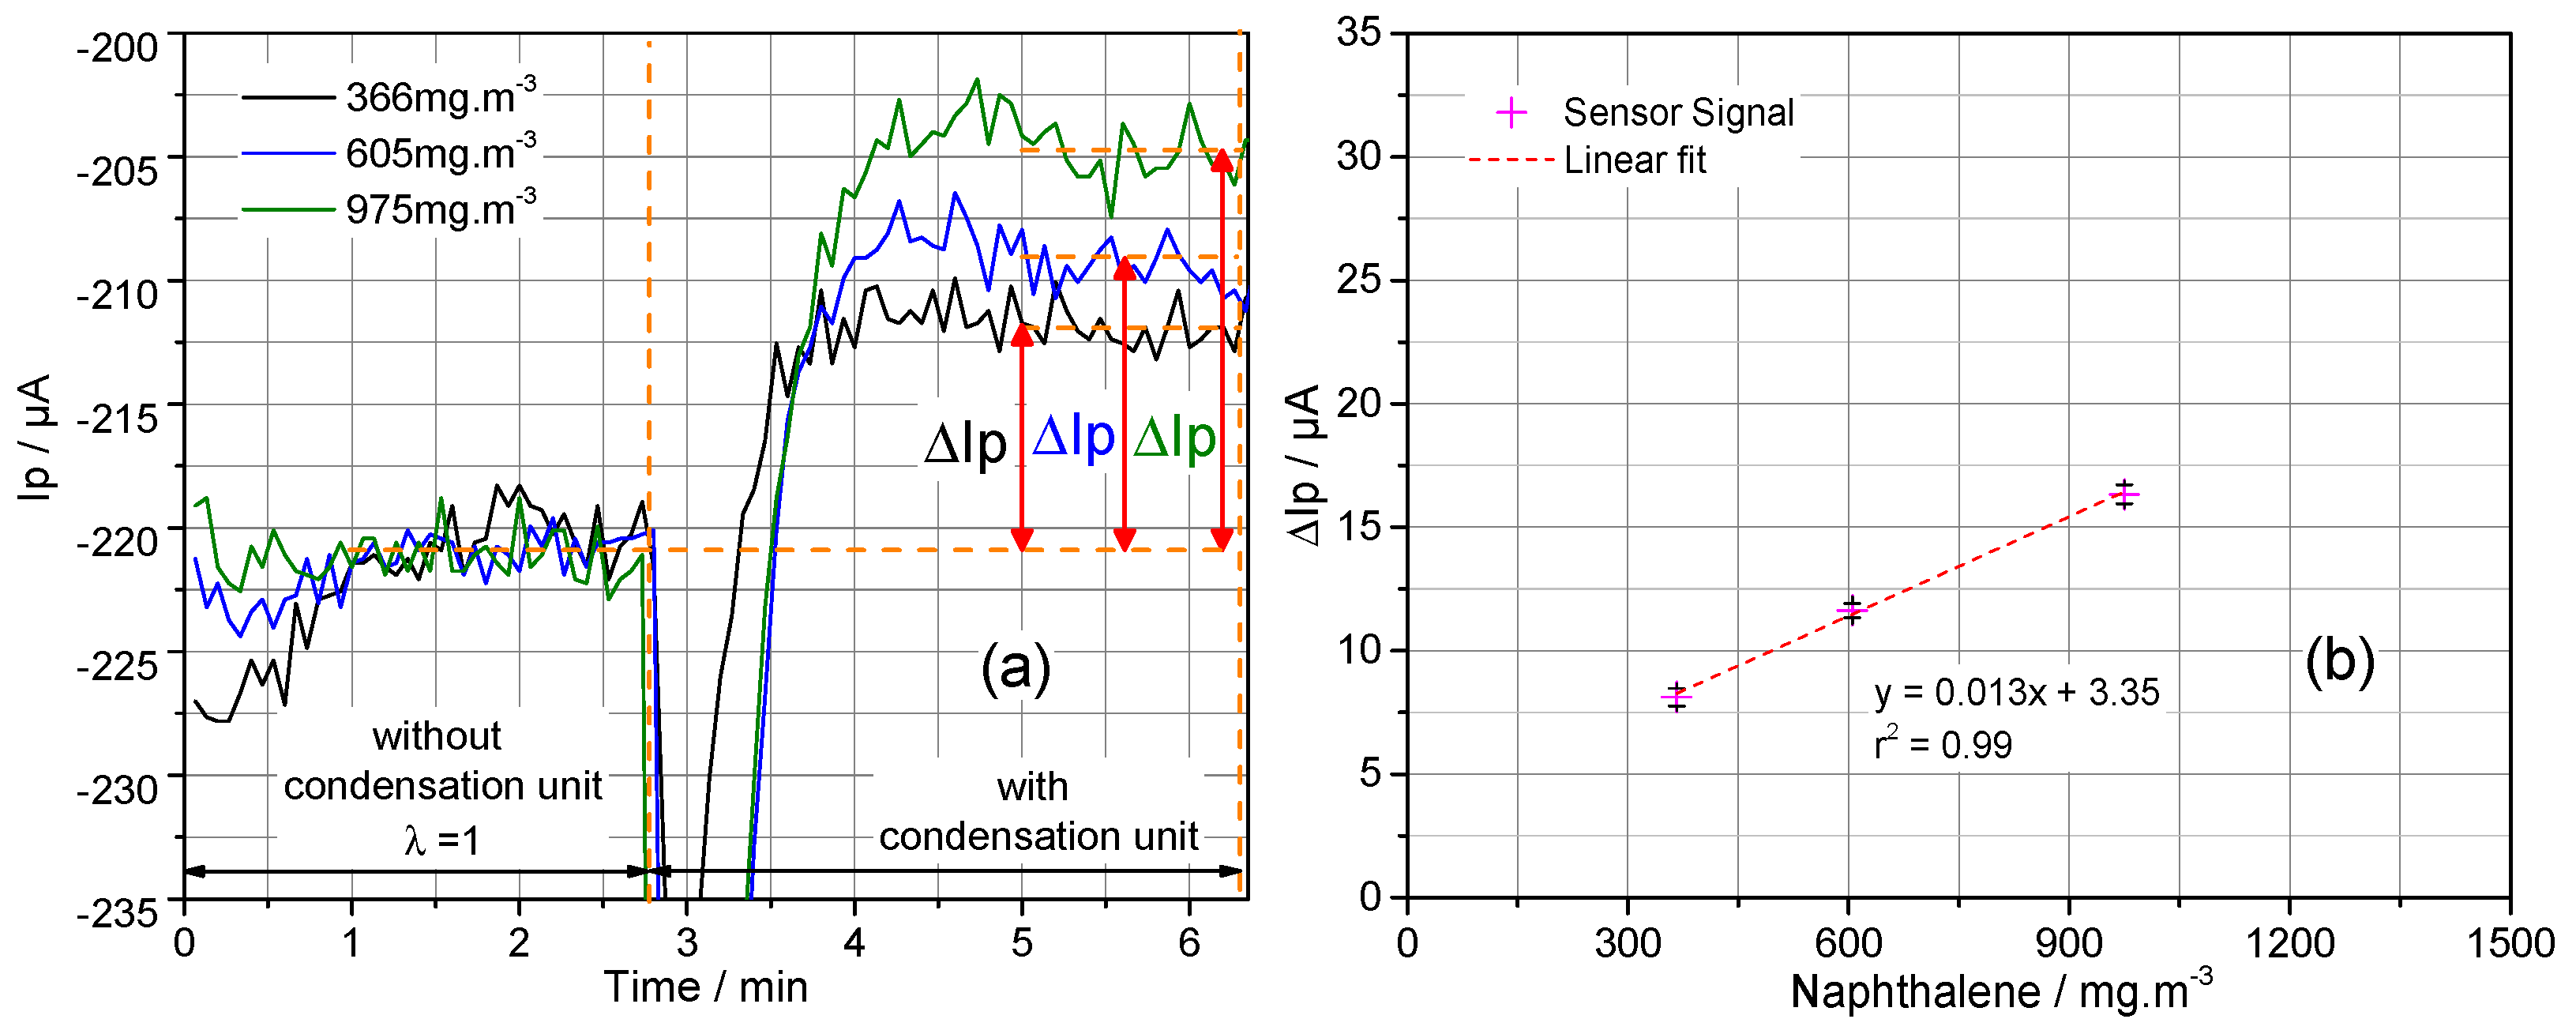
In this proof of concept, it could be shown that the measurement of the oxygen demand for the monitoring of the tar content in hot syngas is an interesting, very robust alternative to some other already-published methods. Initial experiments in the laboratory by the use of model syngas with naphthalene as the model tar highlighted the very good sensitivity, the very good linearity of the signal, and the very small lower limit of detection of about 70 ± 5 mg/m3 naphthalene. For the extraction of a very small but constant flow (9 L/h) of the hot syngas, a sintered metal filter/Laval nozzle setting in the hot zone was combined with a gas pump and an MFC for synthetic air dosage in the ambient zone, and was complemented with an LSU 4.9 oxygen sensor. This setup was evaluated in the laboratory. This confirmed the high sensitivity and very good long-term stability of this tar monitoring concept, which may be realized at moderate installation and operation costs.
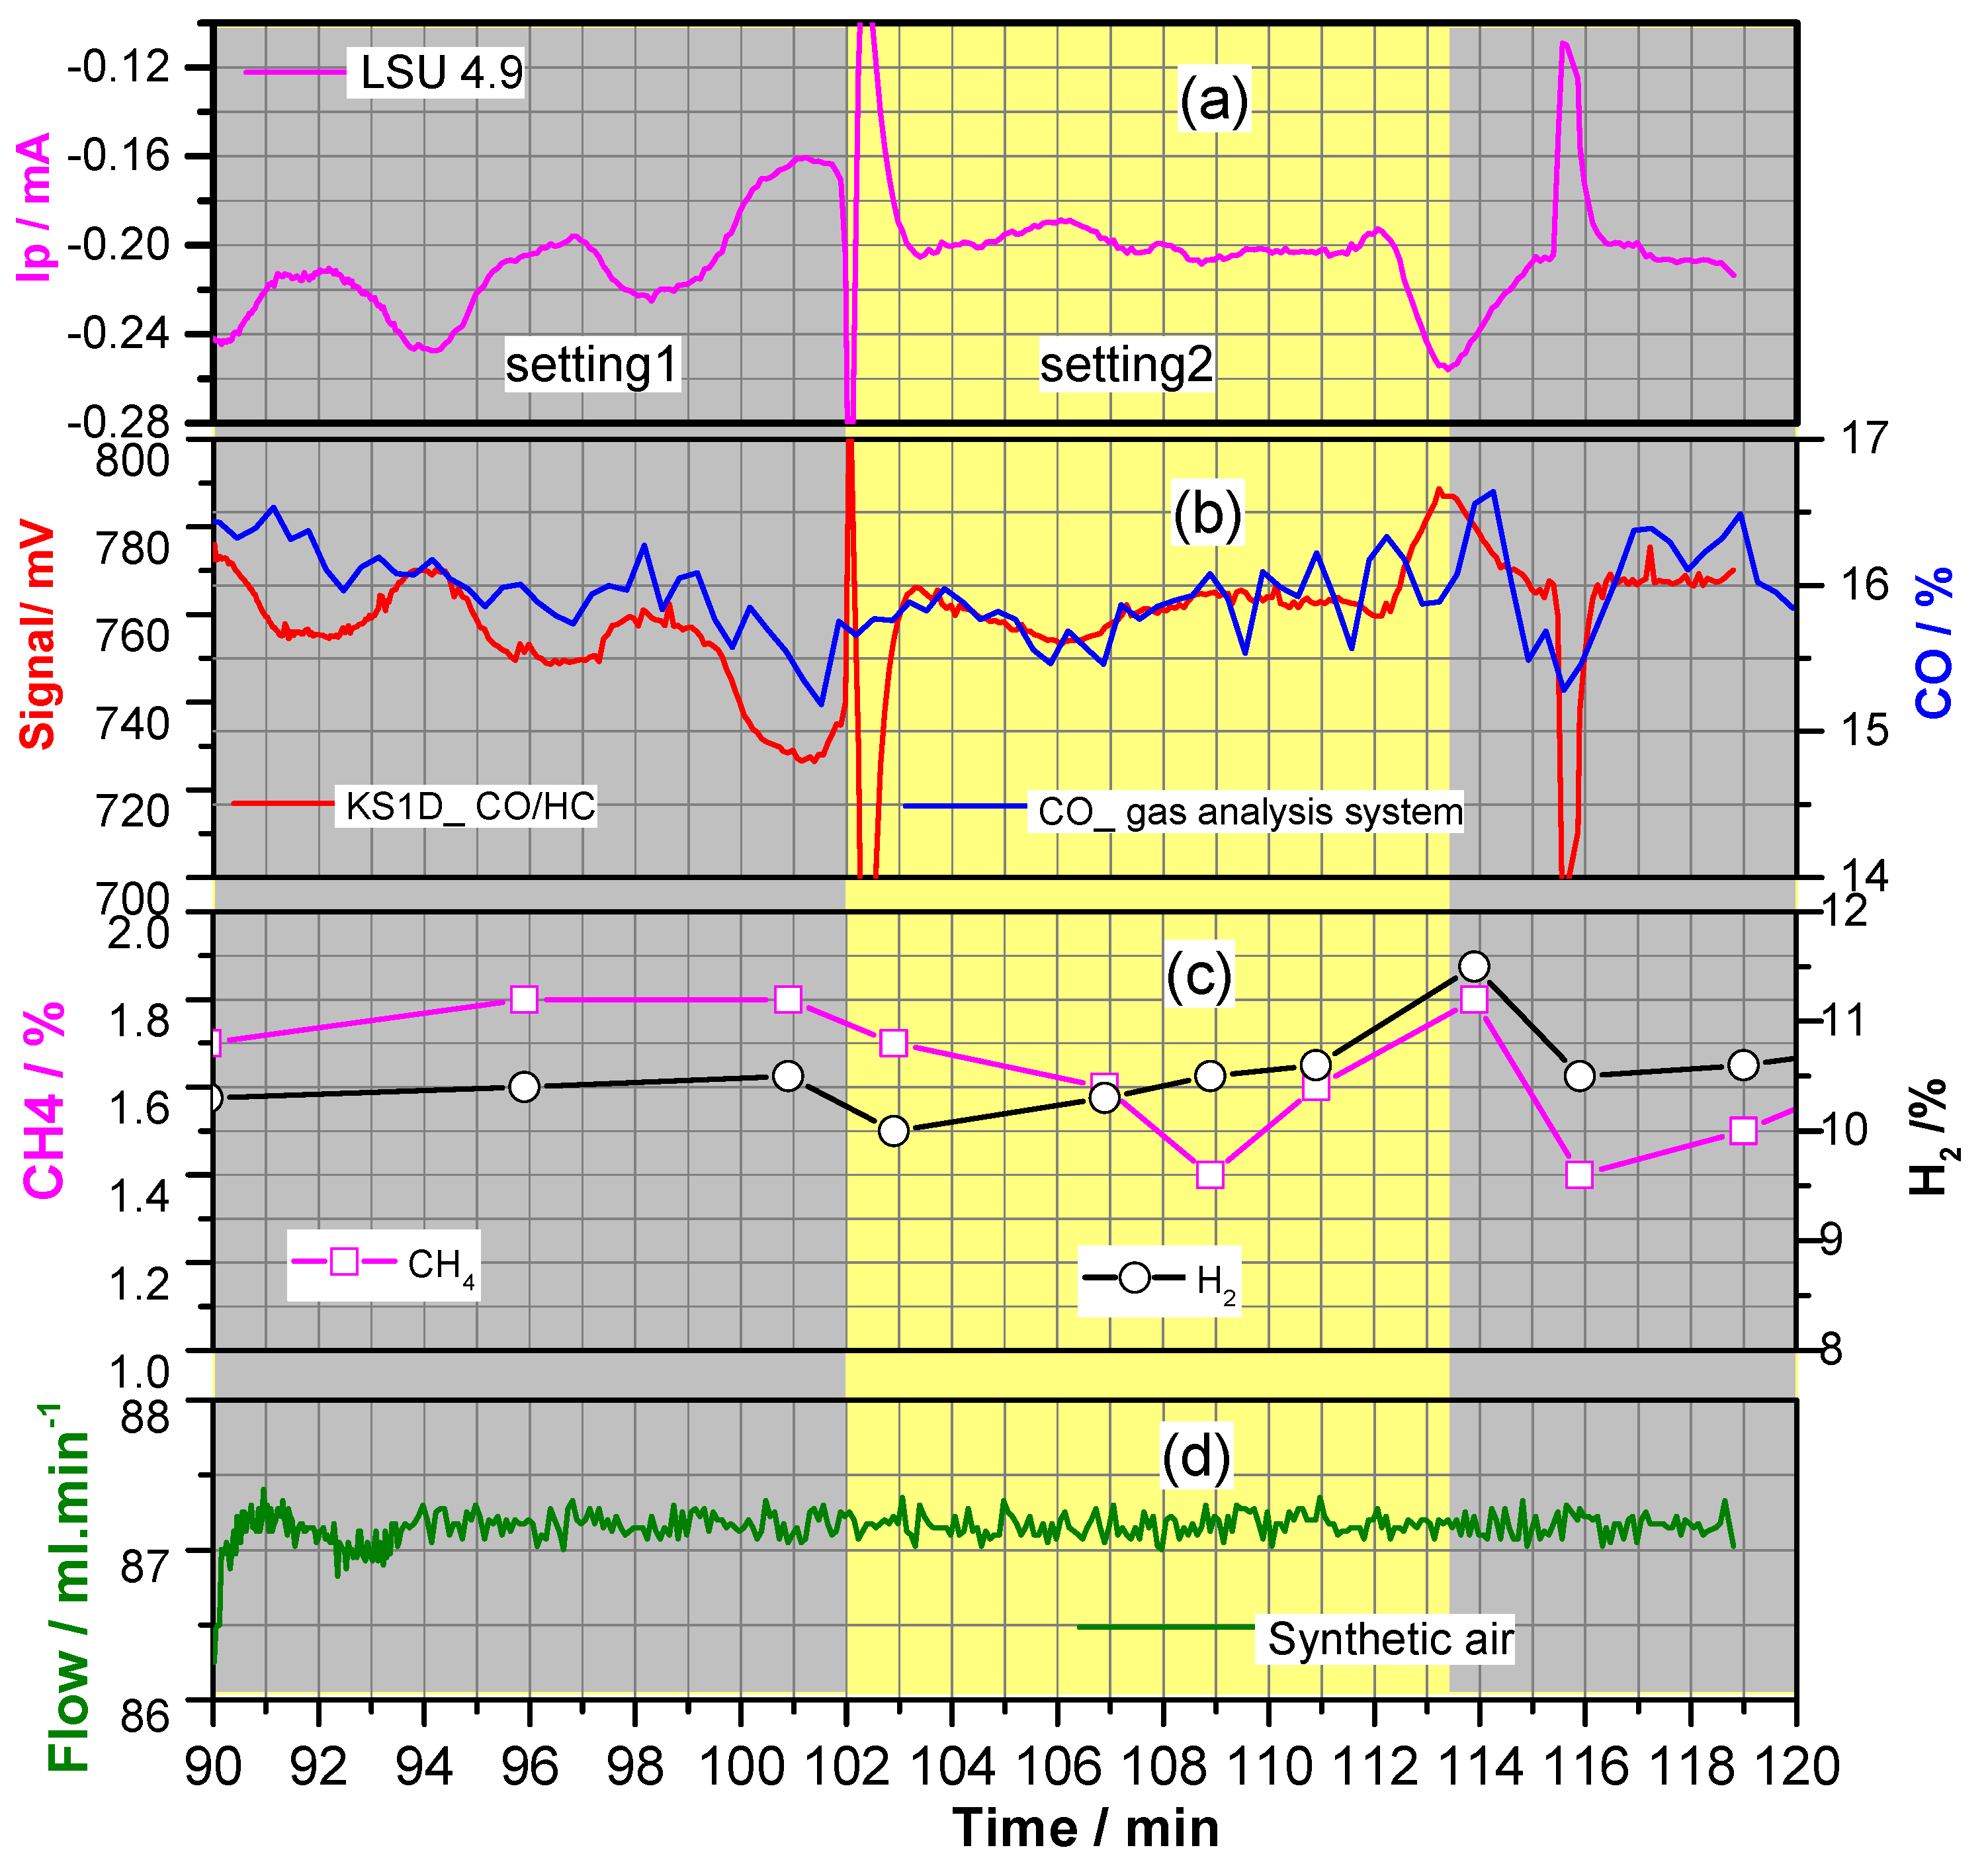
However, there are also some constraints which have to be considered. First, tar is a multi-component compound; therefore, the oxygen demand for tar oxidation does not only vary with the tar concentration but also with its composition. This means that with this method only a concentration value equivalent to the tar component used for calibration (e.g., naphthalene) can be monitored. Second, with the tar, the water vapour (about 8–10%) is also condensed in the condensation trap. This means that the estimation of the oxygen demand relates to the (equivalent) tar concentration in dry syngas. Third, the components with low boiling temperatures, such as toluene, are monitored with a much higher lower limit of detection if the condensation temperature is not much lower than the temperature reached with standard thermostats (about −30 °C). However, if necessary, even lower condensation temperatures can be rather simply realized by the immersion of the condensation unit, e.g., in an ethanol/dry ice—mixture (−72 °C) provided in a Dewar vessel. This would allow us to lower the lower limit of detection of toluene to about 15 ppm (57 mg/m3). Fourth, the main drawback of this tar detection method is that the very sensitive estimation of the oxygen demand is only possible if the composition of the syngas is instantaneously constant over the time period of estimation (about 6 min).
As shown in the field tests, this latter precondition for accurate tar estimation is unrealistic. However, this problem can be relatively simply overcome by the simultaneous monitoring of the residual oxygen concentration in a dual-branch system of equal hot syngas streams: one without condensation trap for adjustment of stoichiometric combustion conditions (λ = 1, setting 1) and the other with tar condensation (setting 2). Of course, the gas streams in both branches have to be admixed with equal synthetic air streams, as are actually estimated by setting 1. With two simultaneously operated LSU 4.9 oxygen sensors in each branch, the formation of the signal difference ΔIp under coincidence conditions yields the estimation of the oxygen demand resolved over time even under conditions of varying syngas composition. This option is believed to provide a high potential for realization but still has to be evaluated in the future.


