Abstract
Employees are the most important and dynamic elements in the railway transportation system. How to achieve accurate control of inertial violation of “key person, key matter, key period”, and formulate more personalized risk response strategy is a thorny problem that faced by safety managers. The existing risk response usually takes control measures from the perspective of the system as a whole, ignoring the heterogeneity of risk, and the selection of response strategies only considers the target risks to be dealt with, ignoring the secondary risks that may occur in the process of risk response, or the residual risks formed by changing the existing risk, coupled with the lack of quantitative evaluation of risk response effect, resulting in poor risk response effect. By introducing the grid theory and taking the risk event of “the assistant watchman does not appear as required” at Huangyangcheng station of Shenshuo Railway as an example, this study constructs a grid response model of the assistant watchman risk events based on system dynamics. Through the grid division, the model accurately locates and classifies the assistant watchman on duty. Then, during the system dynamics simulation process, the hazard factor is regarded as a bridge, and the traditional virtual boundary of system simulation is transformed into accurate grid definition. By improving the response strategy of safety behavior risk event of the assistant watchman on duty in cell grid and using Vensim-PLE software for personalized simulation, the intervention of “the assistant watchman does not appear as required” risk event is transformed from qualitative analysis to dynamic quantitative mathematical model, so as to realize the personalized response simulation analysis of employees in the grid.
1. Introduction
As the practice subject of safety production of railway transportation system, the potential impact of personnel’s behavior on system safety is huge. The operation area of the station assistant watchman spans the whole station yard, and there are many combinations with other positions, which are more affected by spatio-temporal hazard factors. Moreover, unsafe behavior of on-site workers is prevalent, so it is urgent to solve the problem of how to make more personalized risk response strategies to ensure transportation safety. As a process of changing risk, risk response is an important sub-process of risk management, and also one of the purposes of risk assessment [1]. If risk response cannot be effectively implemented, the effect of risk assessment will be affected, which will have a negative impact on risk management. In risk practice, due to the lack of mature risk response models and tools to select appropriate response strategies, risk response has not received due attention such as risk assessment [2,3], which is reflected in the following aspects: First of all, risk response strategy indicators are not considered comprehensively. Although some experts and scholars have conducted research on risk response strategies, the choice of traditional risk response strategy only considers the target risks to be dealt with, and ignores the secondary risks that may be generated in the process of risk response or the residual risks that may be formed by changing the existing risks, exposing that the risk response measures do not consider the secondary risks or residual risks that may be brought about. Secondly, the existing risk response usually takes control measures from the perspective of the system as a whole, ignoring the heterogeneous expression of risk, and it is easy to waste resources to a certain extent. Thirdly, the risk response effect lacks quantitative evaluation. In the process of railway safety production, the transportation system is a time-varying and complex system, accompanied by the complexity of human behavior, it is difficult to measure the effectiveness of the countermeasures.
To systematically solve the aforementioned problem, this study innovatively proposes a grid response model for the safety behavior risk events of transportation system based on system dynamics. Through the grid division, the model accurately locates and classifies the assistant watchman on duty. Then, during the system dynamics simulation process, the hazard factor is regarded as a bridge, and the traditional virtual boundary of system simulation is transformed into accurate grid definition. By improving the response strategy of safety behavior risk event of the assistant watchman on duty in cell grid and using Vensim-PLE software for personalized simulation, the intervention of risk event in grid can be transformed from qualitative analysis to dynamic quantitative mathematical model, so as to realize the personalized response simulation analysis of employees in the grid.
The structure of this paper is as follows: The second chapter is a literature review. The third chapter introduces the grid management method of the transportation system, containing the definition and coding of grids, grid elements, and grid events, respectively. The fourth chapter introduces the grid response model of “the assistant watchman does not appear as required” based on system dynamics. In this model, the traditional virtual boundary of system simulation is defined as precise grid definition by introducing spatial location variable, aiming at the situation that the hazard factors can trigger different risk responses under the action of risk coupling, and the personalized simulation analysis of grid element risk events is realized by Vensim-PLE software. The fifth chapter summarizes the shortcomings of this study and the future research direction.
2. Literature Review
At present, scholars in different industries carried out research on risk response strategies. Chiu and Hsieh [4] studied the influencing factors of potential human errors in aviation maintenance tasks, and then used fuzzy TOPSIS method to evaluate the improvement efficiency of each potential error factor, aiming at six potential human errors: maintenance ability, environment, work order, communication, physiological state, and psychological factors, so as to provide an improvement strategy for reducing potential human errors in maintenance tasks. Through the research on the determinants of seafarers’ safety behavior, such as emotional appeal, perceived threat, result expectation, self-recognition, and behavior temptation, Yuen et al. [5] put forward targeted suggestions on seafarers’ safety management of shipping companies from three aspects: encouraging safety behavior, formulating plans, and strengthening drills. Chang and Wang [6] classified and ranked 77 preliminary risk factors and 46 major risk factors of airlines by the improved human factor SHELLO model (Liveware, L; Liveware-Software, L-S; Liveware-Hardware, L-H; Liveware-Environment, L-E; Liveware-Liveware, L-L; Liveware-Organization, L-O), so as to help airlines improve maintenance operation under the condition of limited resources. Liang [7] established a novel system dynamics model involving five communication organizations and 36 controlling parameters to investigate the interactive relationships among them and the dynamical behavior of food safety risk communication. In modeling the problem’s dynamics, the influencing factors were taken from the survey data of questionnaire and mathematical statistics and might be not sufficient to predict the system’s behavior precisely. Lei et al. [8] proposed a new rail life prediction model by using grid theory. In this model, railway lines were divided into equal length cell grids, and the service life of each rail grid was estimated by Markov process theory and risk assessment model, and the deterioration trend of rail was predicted. Liu et al. [9] applied a system dynamics approach to analysis the dependency of performance shaping factors (PSFs) within the standardized plant analysis of risk-human reliability analysis approach. What is more, they used the factor analysis technique and literature review method to identify the overlapped PSFs and make modifications. Zarghami and Dumrak [10] proposed a system dynamics model that simulated the socio-economic and demographic characteristics of the population into the future. In order to develop a comprehensive and sustainable disaster-scale management strategy, it was strongly recommended that decision makers and disaster managers pay attention to the multifaceted nature of risk. This could be conducted, according to the authors, by considering jointly the severity of the disaster, the current state of vulnerability and the long-term evolution of vulnerability in response to changes in its contributing factors. Shire et al. [11] carried out a review of literature addressing safety issues using system dynamics across safety critical domains. Sixty-three studies were included and classified based on a customized human factors safety taxonomyframework. The thematic analysis of the literature resulted in five themes: external factors, organizational influences, unsafe supervisions, preconditions for unsafe acts and unsafe acts. In view of the deficiency of relevant research focusing on target risk response, this study improves the risk event response strategy indicators from three aspects of internal cause response, external cause response and post-intervention.
Some researchers take control measures from the perspective of the system as a whole, ignoring the expression of other risk characteristics. For example, Zhang et al. [12] analyzed the characteristics and influencing factors of unsafe behavior from the perspective of coal mine accidents, and pre controlled unsafe behavior through the study of 1203 major accidents in Chinese coal mines and hidden danger events of a coal mine company in recent five years. Na and Yi [13] compared and analyzed the advantages and disadvantages of behavior correction methods at home and abroad, such as Behavior-based Safety, Toyota 6S management (Seiri, Seiton, Seiso, Seiketsu, Shitsuke, Safety), DuPont’s Safety Training & Observation Program, Sumitomo’s KYT method, etc., combined with the application of situational teaching and virtual reality technology in coal mines, and two methods of controlling unsafe behaviors in coal mines in China were proposed: scenario design and virtual reality training. Qing-gui et al. [14] developed a coal mine risk management and early-warning control system and applied it to the risk management of potential accidents, hazard sources, and human behaviors. Management control schemes were proposed from the perspective of systematic risk management, which mainly include: coal mine workers unsafe behavior warning, unsafe behavior management and control, safety countermeasures, and optimization technology. Min et al. [15] proposed a safety behavior planning model for the high-risk attributes of coal chemical industry, and provided corresponding control countermeasures in terms of work difficulty, incentive mechanism and employee skills. Chen et al. [16] developed a comprehensive modeling framework for the mixed noise-driven shale gas-water supply chains, which is integrated with techniques of system dynamics model and two-stage stochastic risk-aversion programming. They pointed out that more social, environmental, and economic performances of shale gas supply chains with a more detailed system boundaries should be further considered. For example, the three concerns and their hierarchical relationships could be systematically incorporated into the current modeling framework. Liu et al. [17] established a dynamic risk assessment model of buried gas pipelines based on system dynamics (SD) to deal with both the complexity of a given system, and changes, therein, with time. The proposed SD model could be used to dynamically track the risk of pipelines and realize the functions of “pre-prevention” and “prewarning” of gas accidents. The transportation system has a strong linkage in production operation, and the job activity of the staff is an open dynamic system with a wide distribution in time and space. Due to the influence of heterogeneous factors, employees’ unsafe behaviors are not only affected by their own factors, but also affected by the correlation of other hazard factors. Therefore, it is necessary to further subdivide the scope of risk response with the help of grid. At present, some scholars have applied grid management to railway safety management. Rengkui et al. [18] proposed the grid management theory of high-speed railway infrastructure in view of the traditional railway infrastructure management mode that could not adapt to the characteristics of high intelligence, high integration, and high state correlation of China’s high-speed railway. According to the theory, high-speed railway lines were divided into several grid units according to certain rules, and the state prediction model for each component was personalized by using the idea of big data, so as to grasp the degradation law of infrastructure equipment more accurately and efficiently and diagnose infrastructure faults.
In recent years, many experts have carried out risk response practices by using system dynamics. Shin et al. [19] established an analysis model of construction workers’ psychological process based on system dynamics to help analyzing the complex dynamic feedback mechanism between workers’ safety attitude and safety behavior. On this basis, the effects of safety incentive, accident case study and warning education were verified. Yu et al. [20] identified the hazard factors of coal mine workers’ unsafe behaviors from multiple perspectives and formed an evaluation index of unsafe behaviors. Then the relative weight of the evaluation index was obtained by ANP method, and the system dynamics method was used to analyze the intervention strategies of coal miners’ unsafe behaviors. Hosseinalizadeh et al. [21] built a framework for a hybrid closed-loop system dynamics-optimization model to investigate a waste management system, and focus on developing waste-to-energy technologies. Comparing the hybrid model’s results with those of the system dynamics model proved that the optimized policies considerably improve the system financially and environmentally. Using system dynamics for simulation is difficult to clearly delineate the boundary of the system. If the boundary of the system is too broad, the research problem will become complicated, and if it is too simple, some important influencing factors of the research problem will be omitted. Therefore, it is necessary to determine the width and depth of the system boundary reasonably to improve the simulation effect. Based on the theory of system dynamics, this study integrates the grid management theory to construct a grid response model for the safety behavior risk of transportation system employees. The model is based on the space-time characteristics of grid management, and the hazard factor is used as a bridge to change the traditional virtual simulation boundary of the system into precise grid definition, and the ANP method is used to solve the relative weight of coping strategies, so as to further improve the simulation effect of risk events.
3. Gridding Method of Transportation System
Grid management of safety behavior risk of employees in transportation system refers to dividing all kinds of employees into several grid units according to certain standards, and taking hazard factors as the core to conduct personalized modeling assessment and accurate risk response for grid employees’ possible risk events.
3.1. Grid Definition and Coding
- (1)
- Cell grid definition and division method. The railway traffic organization is mainly organized and implemented in the station. The unit grid division of transportation system refers to the discretization of the plane space of each type of work area covered by the mileage range of railway signal. That is, it is divided into a number of discrete and unequal “small areas” according to certain rules. The “small areas” can be regarded as a collection of several workers’ working activities of a certain post, and each “small area” is called a grid unit , . Based on the perspective of working range and spatial location, the grid division of the transportation system should be represented by the area of the two-dimensional space covered by the working scope of the staff of each position, so as to realize the association between the operation of the position and the spatial location. For example, the grid to which the assistant on duty belongs is , as shown in Figure 1.
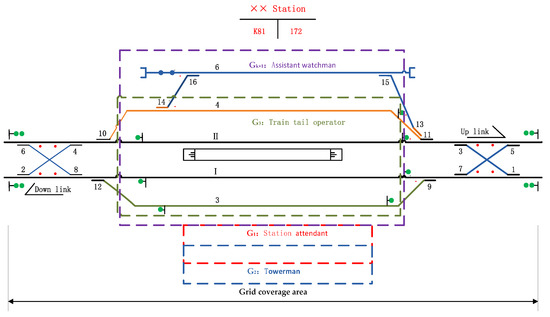 Figure 1. Railway station grid division.
 - (2)
- Grid coding rules. Grid coding is mainly related to geospatial information, and grid data should include spatial data and attribute data. The grid code of the transportation system includes “line code + position code + sequence code”. The line code is 4 bits, and the location code is expressed by the kilometers of the central mileage of the station, according to the length of the line, the location code is set as 4 digits, and the sequence code represents the sequence number of a grid at the station, which can be set as 2 digits. It is sequentially numbered from the direction of small mileage to the direction of large mileage in the station, so the grid code is set as 10 digits, as shown in Figure 2.
 Figure 2. Code structure of the train operation department grid.
3.2. Definition and Coding of Grid Elements
The individual workers and equipment contained in the transportation system grids are collectively referred to as the elements of the grids. This study focuses on the special element of “individual worker”. Element coding generally includes employee information and geospatial information. The employee code is used to determine the work type of the employee, and the geospatial code is used to determine the location of the employee, which can be expressed by the corresponding grid code. The combination of the two can achieve the unique identification of the employee element. Therefore, the code is designed as “grid code + employee job code + sequence code”. The employee job code can be set as 4 bits, and the sequence code represents the serial number of an employee in a grid, which can be set as 2 bits. Therefore, the code of grid elements is 16 bits in total, as shown in Figure 3.
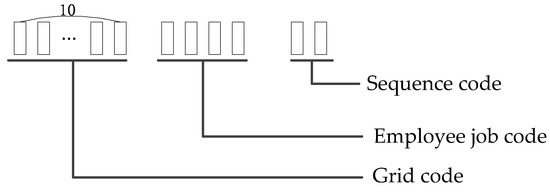
Figure 3.
Code structure of the grid elements in the railway transportation system.
3.3. Grid Events Definition and Coding
The safety behavior information generated by elements in cell grid at a certain moment is called the events of grid elements. The grid element is the implementation subject of the event, and the event depends on the element, which is the relationship between the subject and the object. Event coding is composed of event and element information. The event information determines the category of the event, and the element information directly adopts the encoding of the corresponding element of the event. The coding design is “element code + event category code + event code”, event category code can be set as 2 bits, event code can be set as 2 bits, so the event coding is 20 bits in total, as shown in Figure 4.
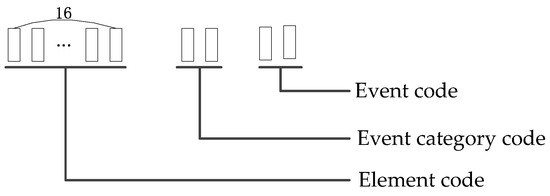
Figure 4.
Code structure of the grid events in the railway transportation system.
According to the above coding rules, the grid code of “the assistant watchman does not appear as required” at Huangyangcheng station of the Shenshuo Railway is “00010044010003010201” (hereinafter referred to as “grid ”).
4. System Dynamics Risk Response Model
4.1. Model Framework
System dynamics was proposed by Forrester in the mid-1950s. It established the structural model of the system from the microstructure of the system, described the system structural framework with the loop, described the logical relationship between the system elements with the causality diagram and flow diagram, described the quantitative relationship between the system elements with the equation, and carried out simulation analysis with special simulation software [22,23,24,25,26]. This theory has been widely applied to the study of complex, nonlinear and delayed systemic problems in the fields of society, economy, education, finance, medicine, biology, etc. [27,28,29,30]. In this study, a grid response model for risk events of “the assistant watchman does not appear as required” is established based on the principle of system dynamics, and the risk response effect is dynamically simulated. The model framework is shown in Figure 5, and the modeling process is as follows:
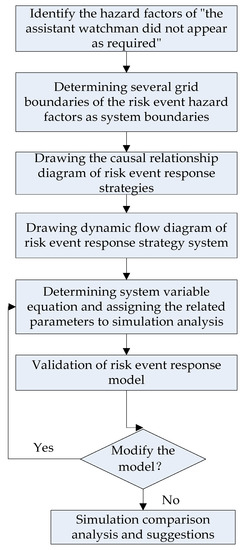
Figure 5.
The grid response framework of .
- Step 1
- Identify the hazard factors of . This study divides the hazard factors of grid risk events into four aspects: human, environment, equipment, and management.
- Step 2
- According to the identification results of hazard factors of , corresponding coping strategies are formulated according to the order of importance. The coping strategies are system variables, and the boundary of the cell grid where the hazard factors are located is the boundary of the system.
- Step 3
- Draw the causal relationship diagram between risk event response strategies and sort out the causal relationship between system variables.
- Step 4
- Draw the system dynamic flow diagram of risk events and determine relevant variables.
- Step 5
- Construct the equation and perform the simulation analysis of initial value assignment of variable parameters in Vensim-PLE software.
- Step 6
- Verify the validity of the established model. If the model does not need to be modified, conduct simulation comparative analysis; if so, jump to the simulation assignment stage and start again.
4.2. Model Structure Analysis
By establishing the causality diagram and stock flow diagram of the grid response strategy for the risk event of “the assistant watchman does not appear as required”, this study analyzes the causality between the response strategies in the grid, that is, to establish the structural relationship of the model, determine the types of variables and main variable sets, and verify the rationality of the model through historical data, so as to lay a foundation for the subsequent simulation analysis.
4.2.1. Determining the System Boundary
A system boundary is the boundary between what the system contains and what the system does not contain. The boundary of a system can be thought of as a wheel that circles variables that are relevant for modeling purposes and separates those that are not. Under the action of risk coupling, the hazard factors will trigger different risk responses. When response measures are taken for the hazard factors, the cell grid where the hazard factors are located is the grid for the response strategy of risk events, and the boundaries of several different cell grids where the hazard factors are located can be determined as the system simulation boundary.
- (1)
- Identification of hazard factors. Identification of hazard factors is the first stage of risk assessment [31]. It refers to the hazard factors identification of the risk event elements in the cell grid under specific space-time conditions. All risks are related to “events”, and events are carriers of risks. Therefore, the hazard factors identification in transportation systems is to carry out hazard identification for specific risk events. Some scholars have studied the hazard factors classification from the perspective of system [32,33,34,35]. Combined with the research of hazard factors in related fields and the “Classification and Code of Hazardous and Harmful Factors in Production Process” (GB/T 13,861-2022) [36], this study divides the hazard factors of grid risk events into four aspects: human, environment, equipment, and management, and the hazard factors of “the assistant watchman does not appear as required” are shown in Table 1. The hazard factors of this risk event involve grid to which the duty station master belongs and cell grid to which the assistant duty officer belongs. Therefore, the boundary of these two grids is the simulation boundary of the risk event response strategy of grid . The grid boundary is the parallel connection of the boundaries of cell grid and , as shown in Figure 6.
 Table 1. Hazard factors of grid .
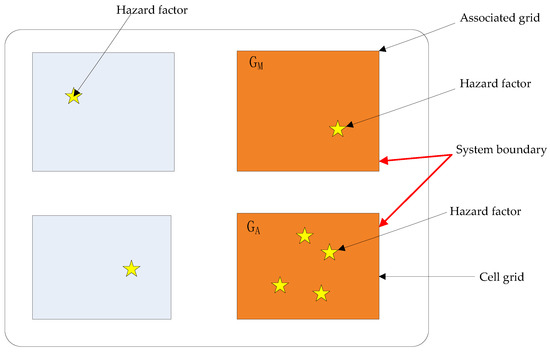 Figure 6. System boundary diagram of grid .
 - (2)
- Building coping strategies. Based on the above analysis of the coupling mechanism and hazard factors of the risk event, combined with the “Swiss Cheese” theoretical model [37,38,39,40], it can be seen that the occurrence of the risk event needs to go through three “holes”, namely three types of defects, as shown in Figure 7. The first cheese “hole” represents internal factors, indicating the defects or incompetence of employees in the cell grid where the risk event occurs. The second piece of cheese “hole”, represents external factors, which in addition to their own factors affect the safety behavior of employees in the cell grid. The third cheese “hole” represents the intervention, indicating the failure of the intervention. Based on the theory of the “Swiss Cheese” “holes”, through literature research, field investigation, experts’ evaluation, as well as the author’s working practice, this study formulates targeted response strategies for the hazard factors of different risk events from three aspects: internal response, external response, and post intervention, specific see Table 2.
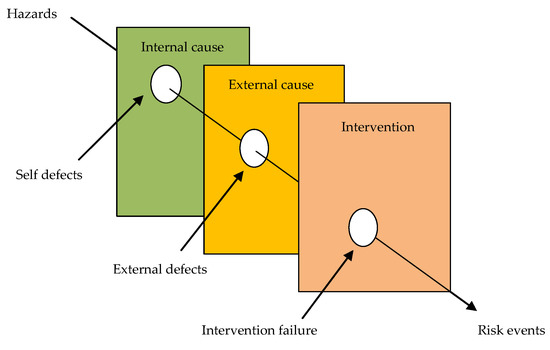 Figure 7. “Swiss Cheese” model of safety behavior risk of the train operation department.
 Table 2. Risk response strategy set for grid .
4.2.2. Drawing Causal Loop Diagram
Causal loop diagram is an important tool to express system feedback structure. It describes the structure affecting system behavior in the form of causal link, which lays a foundation for the establishment of system flow diagram in the next step. The drawing process of causal loop diagram of grid is as follows:
- (1)
- Drawing the internal cause response subsystem
Improving the quality of the staff is the most effective way to deal with the risk of safe behavior. Based on literature research [20,27,30,41,42,43,44], field investigation, experts’ evaluation, as well as the author’s working practice at Huangyangcheng station, this study clarifies the coping strategies for the internal causes of grid , and the causality of internal cause response subsystem is shown in Figure 8:
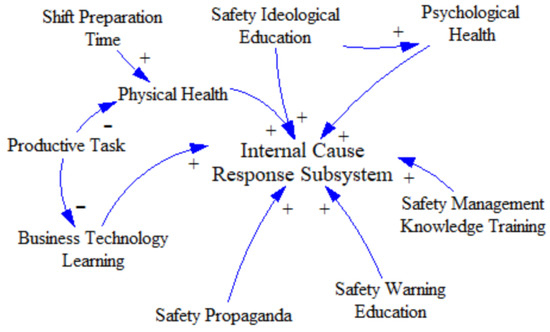
Figure 8.
Internal causal response diagram of grid .
- (2)
- Drawing the external cause response subsystem
Strengthening the management of external factors is the most important strategy to improve the comprehensive quality of workers. Based on literature research [20,27,30,41,42,43,44], field investigation, experts’ evaluation, as well as the author’s working practice at Huangyangcheng station, this study identifies 7 coping strategies for the external causes of grid , and the causality of external cause response subsystem is shown in Figure 9:
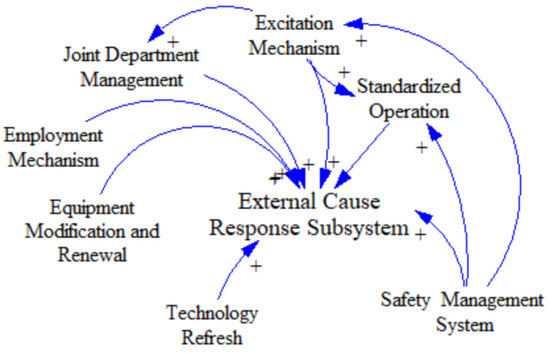
Figure 9.
External response causal diagram of .
- (3)
- Drawing the post intervention subsystem
Direct intervention of risk events is an effective way to ensure safe production. Based on literature research [20,27,30,41,42,43,44], field investigation, experts’ evaluation, as well as the author’s working practice at Huangyangcheng station, 9 post-interventions of grid are developed, and the causality of the post-intervention subsystem is shown in Figure 10:
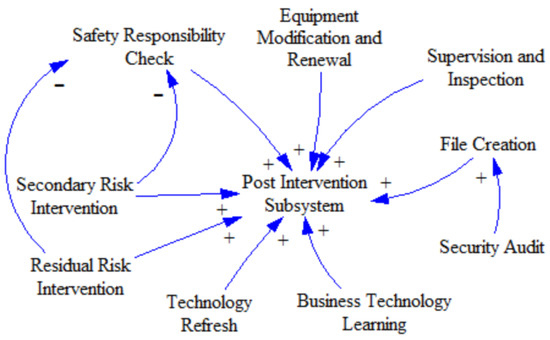
Figure 10.
Intervention causal diagram of grid .
The causal circuit diagram of grid can be obtained from the above three risk response subsystems, as shown in Figure 11:
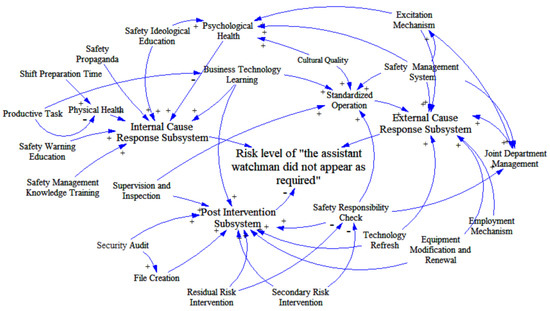
Figure 11.
Causal diagram of grid .
4.2.3. Establishing the System Flow Diagram
Causal loop diagram is suitable for expressing the correlation and feedback process between coping strategies of risk events, but it cannot express the nature of coping strategies in the system, and thus cannot describe the control process of risk coping. System flow diagram is to further distinguish the nature of coping strategies on the basis of causality diagram, to describe the logical relationship between system variables with more intuitive symbols, to clarify the feedback form and control law of the system, and to lay a foundation for system simulation. Through the analysis of coping strategies for grid , combined with relevant literatures [41,42], each element can be divided into different types of variables, as shown in Table 3:

Table 3.
Set of system dynamics variables of grid .
According to the set of variables and the interaction between variables, Vensim-PLE software is used to draw the dynamic flow diagram of the system for grid , as shown in Figure 12.
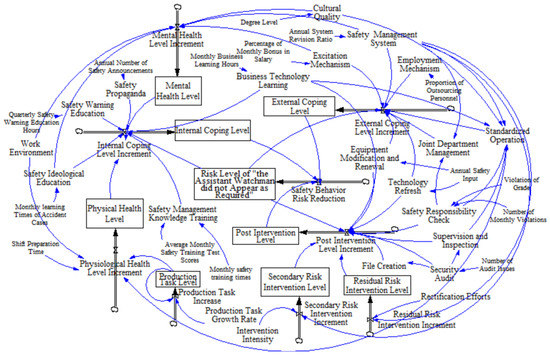
Figure 12.
Dynamics flow diagram of grid .
4.3. Model Establishment and Testing
4.3.1. Determining the Model Equation
Through the description of the causal feedback relationship of system variables of grid by the system flow diagram, the system structure framework is constructed. The quantitative relationship of each related variable can be further determined by the equation, that is, the equation between variables in the model can be determined. Based on the causality diagram, this study uses state variables, rate variables, and auxiliary variables to conduct quantitative processing on the safety behavior risk response system, and constructs the following equation:
- (1)
- Defining the state variable equations. The value of the state variable at time “t“ is equal to the initial value of the state variable plus the accumulation of time due to the change of net flow in time period [0,t]. Table 4 shows the expressions of all kinds of equations of grid :
 Table 4. Equation expression of grid .
 - (2)
- Defining the rate equations. An equation formed by flow rate within a unit time interval which often uses auxiliary variables to describe some rules in the decision-making process, and can eventually be transformed into a function representing state variables and constants, as shown in Formula (1):where, is the rate of change of state variable in unit time interval, and is state variable, is constant. According to the above definition, based on the accumulation of historical data, combined with the weight of various coping strategies and expert advice, the rate equations of grid are finally determined after repeated debugging as follows:
- (1)
- Increment of internal coping level= business technology learning × 0.083 + safety propaganda × 0.031 + safety ideological education × 0.039 + safety management knowledge training × 0.029 + safety warning education × 0.03 + mental health level × 0.081 + physical health level × 0.099 − risk level of the grid × 0.01
- (2)
- Mental health level increment = safety ideological education × 0.015+ work environment × 0.015+ excitation mechanism × 0.025 + safety management system × 0.02 + cultural quality × 0.025
- (3)
- Physiological health level increment = standardized operation × 0.02 + shift preparation time × 0.01 + work environment × 0.025 − production task level × 0.004
- (4)
- Production task increase =production task level × production task growth rate
- (5)
- External coping level increment = technology refresh × 0.031 + standardized operation × 0.083 + excitation mechanism × 0.04 + employment mechanism × 0.033 + safety management system × 0.067 + equipment modification and renewal × 0.032 + joint department management × 0.06 − risk level of grid × 0.0032
- (6)
- Post intervention level increment = business technology learning × 0.083 + safety responsibility check × 0.035 + supervision and inspection × 0.056 + file creation ∗ 0.017 + security audit × 0.021 + technology refresh × 0.031 + equipment modification and renewal × 0.032 + residual risk intervention level × 0.044 + secondary risk intervention level × 0.09 − risk level of grid × 0.031
- (7)
- Safe behavior risk reduction = −internal coping level × 0.035 − external coping level × 0.04 − post-intervention level × 0.03
- (8)
- Secondary risk intervention increment = intervention intensity × 0.15 + safety management system × 0.2
- (9)
- Residual risk intervention increment = rectification efforts × 0.2 + safety management system × 0.2
- (3)
- Auxiliary equations. It can be used to decompose and simplify the rate equation, and determine the rules between variables according to the practical meaning. The main auxiliary equations of grid are shown in Table 5:
 Table 5. System auxiliary equations.
4.3.2. Variable Weight Assignment
Due to the influence relationship of relative importance among the indicators of countermeasures, ANP method [45,46,47,48] is adopted to solve the weight of the risk event variables of grid according to the safety production data collected from Shenshuo Railway in previous years. The weight value of coping indicators reflects the relative importance of coping strategies. The larger the weight value is, the greater the influence of coping strategies is, as shown in Table 6.

Table 6.
Coping strategy weight values of grid .
4.3.3. Determining the Initial Value
The initial values in the model are usually determined in the following ways:
- (1)
- Collecting and sorting out historical data. Including daily safety inspection, education and training, production and operation data of Shenshuo railway transportation system, monthly, quarterly, and annual safety inspection data, as well as materials collected by field investigation.
- (2)
- Estimating the initial value of parameters according to the correlation between variables in the model.
- (3)
- According to the collected data related to production safety management of Shenshuo Railway transportation system, the initial values of relevant parameters are predicted by using relevant mathematical statistical analysis methods.
- (4)
- Estimating the initial parameter values based on experts’ experience. Due to the limitations of realistic conditions, some important data are difficult to obtain, so the related parameters can be assigned with experts’ experience.
By collecting the safety production data of Shenshuo in the past years, the initial value of the state variable is assigned based on expert opinions. After repeating adjustment and test, the initial value of the state variable is finally determined, as shown in Table 7. Setting the simulation start time: ININTLAL TIME = 0, end time: FINAL TIME = 12, units for time: Month, and time step: TIME STEP = 1.

Table 7.
Initial values of the state variables of grid .
4.3.4. Model Testing
The system dynamics model proposed in this study is a simulation of the real situation of grid , which cannot completely and accurately reflect the implementation effect of safety production practice. Therefore, it is necessary to verify the effectiveness of the model before the implementation of simulation. It mainly includes the following three aspects:
- (1)
- Conducting rationality tests
By means of questionnaire, expert interview, it is ensured that the boundary division of the grid system is reasonable, the causality analysis and the drawing of the system flow diagram are accurate, the equation setting is in line with the actual situation of the system, and the model is realistic and reasonable.
- (2)
- Conducting dimensional consistency tests
After dimensionless operation on the dimensions of model variables and variable equations, the variable unit is uniformly selected as “dmnl”, and then the “model check” in Vensim-PLE software is used to test the model to ensure that the model passes the dimensional consistency tests.
- (3)
- Conducting historical data tests
The uncertainty of railway safety risk leads to a certain discrepancy between the predicted value and the actual value, but the change trend reflected by the model should be more consistent with the actual situation. Based on the safety production related data of Shenshuo railway transportation system from January 2017 to December 2018, this study uses Vensim-PLE software to simulate and verify the risk response effect of grid during this time period, and locally adjust and correct the parameter values. The simulation results are basically consistent with the change trend of safety management level, which shows that the model has good reliability and basically meets the requirements. Therefore, this model can be used to simulate the response level of safety behavior risk of employees in transportation system.
4.3.5. Simulation Analysis of Coping Strategy of Grid
In order to systematically analyze the intervention effects of different coping strategies on grid coping level, the following four different situations are set to analyze the response effects of assistant watchmans’ safety behavior risk under different coping conditions:
- Scenario 1
- In the initial phase, simulating the change trend of the risk level of grid with time;
- Scenario 2
- Assuming that the internal coping level increases by 30%, simulating the change trend of the risk level of grid with time;
- Scenario 3
- Assuming that external coping level increases by 30%, simulating the change trend of the risk level of grid with time;
- Scenario 4
- Assuming that the post intervention level increases by 30%, simulating the change trend of the risk level of grid with time;
The comparison simulation results of intervention effects in the above four situations are shown in Table 8 and Figure 13, respectively.

Table 8.
Comparative analysis of intervention effects in different scenarios.
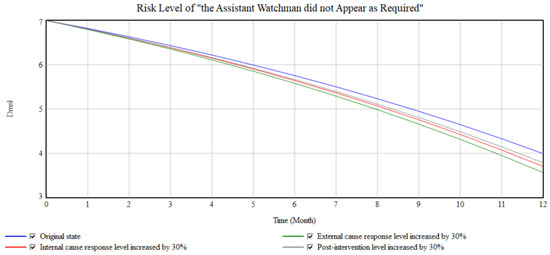
Figure 13.
Comparative analysis graph of intervention effects in different scenarios.
According to the comparison of simulation results in Figure 13, it can be seen that:
- (1)
- Discussing the simulation results of the initial state
The risk curve of the grid was relatively flat in the first five months and accelerated to decline from the sixth month. The safety risk level finally dropped to “4”, and the risk magnitude was “negligible”, indicating that with the successive implementation of “control” activities, the intervention effect gradually emerged.
- (2)
- Discussing the simulation results of different coping strategies
In the first 5 months, the risk level curves of the grid almost overlapped under the four scenarios, with no significant difference, and during the period from June to December, the simulation result curve gradually showed differences. Under the condition of the same intervention intensity, the intervention effect of each coping strategy of grid was as follows: external cause coping level > internal cause coping level > post-intervention level.
- (3)
- Discussing the simulation effects of different “control” activities under the same coping strategy
- (1)
- At the same internal cause coping level, other “control” activities remain unchanged, and a single variable was increased by 30% respectively. The simulation results of assistant watchmans’ physical health level, business and technical learning and employees’ mental health level change greatly compared with other variables.
- (2)
- Under the same external cause coping level, other “control” activities were kept unchanged, and the single variable was increased by 30%, respectively. It was found that the simulation results of standardized operation and joint management changed greatly compared with other variables.
- (3)
- At the same post-intervention level, with other “control” activities unchanged, the single variable was increased by 30%, respectively, and it is found that business technology learning and supervision had a greater impact on the simulation results of other variables.
- (4)
- Taking the safety countermeasures
The above simulation results verified the accurate management and control of key person, key matter, and key period of safety behavior risk control of employees in Shenshuo Railway. Related safety management suggestions are as follows: From the perspective of the station managers, in the process of safety management, managers should attach great importance to the mental and physical health of employees, strengthen the safety ideological education of employees, and do a good job of humanistic care. At the same time, managers should pay attention to the education and training of employees, improve their self-learning ability and improve their personal quality. From the perspective of the enterprise, the person in charge of the enterprise should increase the investment in the construction of enterprise culture, improve the safety management rules and regulations system, strengthen the organization of safety training, and lead the safety development with cultural construction. Finally, from the perspective of the safety supervision department, the supervisors should also strengthen the post intervention, check the leakage, and make up the deficiency, so as to ensure that the risk is under control and controllable.
5. Conclusions
In this study, the gridding method and system dynamics are combined for the first time to construct a gridding response model for safety behavior risk of assistant watchman based on system dynamics. By introducing spatial location variables, the model accurately locates and classifies the on-site assistant on duty, so as to master the time, place and possible risk events of the staff more comprehensively. In view of the situation that the hazard factors could trigger different risk responses under the action of risk coupling, the boundaries of several different unit grids where the hazard factors are located can be determined as the system simulation boundary. Therefore, the traditional virtual boundary of system simulation is determined as precise grid definition, and the implementation effect of response measures is dynamically simulated and predicted by Vensim-PLE software, so as to change the intervention of safety behavior risk events of assistant duty personnel from qualitative analysis to dynamic quantitative mathematical model, simulation analysis of personalized response to grid element risk events.
Although this study has improved the effect of safety behavior risk response of transportation system, there are still some deficiencies: Affected by the quantity and quality of data collection, the simulation effect of safety behavior risk response needs to be optimized. Relying on relevant information processing technology, the author will develop the safety behavior risk database of transportation system, realize the automatic collection, analysis and processing of risk information, and provide effective data support for the safety behavior risk response of the train operation department. Due to the subjective initiative of personnel, it is difficult to accurately evaluate all aspects related to human behavior. In this study, due to the heterogeneity, uncertainty, and coupling characteristics of safety behavior risks of transportation system employees, the implementation of coping strategies for risk events in the cell grid is affected by many factors, and it is difficult to accurately evaluate. Therefore, the next step is to further study the causal feedback relationship and the internal coupling mechanism of each coping strategy, strengthen the understanding of the internal mechanism of safe behavior risk, and improve the effect of risk response.
Author Contributions
Methodology, H.Z.; software, H.Z.; writing—original draft preparation, M.M.; writing—review and editing, C.Q. All authors have read and agreed to the published version of the manuscript.
Funding
This research received no external funding.
Institutional Review Board Statement
Not applicable.
Informed Consent Statement
Informed consent is obtained from all subjects involved in the study.
Acknowledgments
The authors are greatly thankful to the reviewers and editor for their precious advice to improve the quality of the thesis.
Conflicts of Interest
The authors declare no conflict of interest.
References
- ISO. Risk Management Vocabulary: ISO Guide 73-2009; ISO: Geneva, Switzerland, 2009. [Google Scholar]
- Zuo, F.; Zhang, K. Selection of risk response actions with consideration of secondary risks. Int. J. Proj. Manag. 2018, 36, 241–254. [Google Scholar] [CrossRef]
- Zhang, Y.; Fan, Z.P. An optimization method for selecting project risk response strategies. Int. J. Proj. Manag. 2014, 32, 412–422. [Google Scholar] [CrossRef]
- Chiu, M.; Hsieh, M. Latent human error analysis and efficient improvement strategies by fuzzy TOPSIS in aviation maintenance tasks. Appl. Ergon. 2016, 54, 136–147. [Google Scholar] [CrossRef] [PubMed]
- Yuen, K.F.; Li, K.X.; Ma, F.; Wang, X. The effect of emotional appeal on seafarers’ safety behaviour: An extended health belief model. J. Transp. Health 2020, 16, 100810. [Google Scholar] [CrossRef]
- Chang, Y.; Wang, Y. Significant human risk factors in aircraft maintenance technicians. Saf. Sci. 2010, 48, 54–62. [Google Scholar] [CrossRef]
- Liang, L. A study of system dynamics modelling and optimization for food safety risk communication in China. Alex. Eng. J. 2020, 60, 1917–1927. [Google Scholar] [CrossRef]
- Lei, B.; Liu, R.; Wang, F.; Sun, Q.; Wang, F. Estimating railway rail service life: A rail-grid-based approach. Transp. Res. Part A Policy Pract. 2017, 105, 54–65. [Google Scholar]
- Liu, J.; Zou, Y.; Wang, W.; Zhang, L.; Liu, X.; Ding, Q.; Qin, Z.; Cepin, M. Analysis of Dependencies among Performance Shaping Factors in Human Reliability Analysis Based on a System Dynamics Approach. Reliab. Eng. Syst. Saf. 2021, 215, 107890. [Google Scholar] [CrossRef]
- Zarghami, A.; Dumrak, J. A system dynamics model for social vulnerability to natural disasters: Disaster risk assessment of an Australian city. Int. J. Disaster Risk Reduct. 2021, 60, 102258. [Google Scholar] [CrossRef]
- Shire, M.I.; Jun, G.T.; Robinson, S. The application of system dynamics modelling to system safety improvement: Present use and future potential. Saf. Sci. 2018, 106, 104–120. [Google Scholar] [CrossRef]
- Zhang, J.; Gao, S.; Tao, J.; He, P. Study on Unsafe Behavior Pre-control Method Based on Accidents Statistic. Procedia Eng. 2011, 26, 1964–1969. [Google Scholar]
- Chen, N.; Mao, Y. Specific Statistics and Control Method Study on Unsafe Behavior in Chinese Coal Mines. Procedia Eng. 2011, 26, 2222–2229. [Google Scholar]
- Cao, Q.; Li, K.; Liu, Y.; Sun, Q.; Zhang, J. Risk management and workers’ safety behavior control in coal mine. Saf. Sci. 2012, 50, 909–913. [Google Scholar]
- Yao, M.; Fang, Y.; Tang, W.; Zhou, J. Study on safety behavior planning theory and control strategies for coal chemical workers. Saf. Sci. 2020, 128, 104726. [Google Scholar]
- Chen, Y.; Li, J.; Lu, H.; Yan, P. Coupling system dynamics analysis and risk aversion programming for optimizing the mixed noise-driven shale gas-water supply chains. J. Clean. Prod. 2020, 278, 123209. [Google Scholar] [CrossRef]
- Liu, A.; Chen, K.; Huang, X.; Li, D.; Zhang, X. Dynamic risk assessment model of buried gas pipelines based on system dynamics. Reliab. Eng. Syst. Saf. 2020, 208, 107326. [Google Scholar] [CrossRef]
- Liu, R.; Lei, B.; Wang, F.; Sun, Q.; Wang, F. Grid: A New Theory for High-Speed Railway Infrastructure Management. In Proceedings of the Transportation Research Board 94th Annual Meeting, Washington, DC, USA, 11–15 January 2015. [Google Scholar]
- Shin, M.; Lee, H.; Park, M.; Moon, M.; Han, S. A system dynamics approach for modeling construction workers’ safety attitudes and behaviors. Accid. Anal. Prev. 2014, 68, 95–105. [Google Scholar] [CrossRef] [PubMed]
- Yu, K.; Cao, Q.; Xie, C.; Qu, N.; Zhou, L. Analysis of intervention strategies for coal miners’ unsafe behaviors based on analytic network process and system dynamics. Saf. Sci. 2019, 118, 145–157. [Google Scholar] [CrossRef]
- Ramin, H.; Hamed, S.G.; Hamidreza, I. Planning for Energy Production from Municipal Solid Waste: An Optimal Technology Mix Via A Hybrid Closed-Loop System Dynamics-Optimization Approach. Expert Syst. Appl. 2022, 199, 116929. [Google Scholar]
- Li, G.; Kou, C.; Wang, Y.; Yang, H. System dynamics modelling for improving urban resilience in Beijing, China. Resour. Conserv. Recycl. 2020, 161, 104954. [Google Scholar] [CrossRef]
- Moradi, M.; Kazeminezhad, M.H.; Kabiri, K. Integration of Geographic Information System and system dynamics for assessment of the impacts of storm damage on coastal communities—Case study: Chabahar, Iran. Int. J. Disaster Risk Reduct. 2020, 49, 101665. [Google Scholar]
- Bahadir, M.C.; Akdag, H.C. The System Dynamics Modelling for Container Capacity & Transportation Planning Policies. Asian J. Shipp. Logist. 2019, 35, 200–212. [Google Scholar]
- Shakib, M.D. Using system dynamics to evaluate policies for industrial clusters development. Comput. Ind. Eng. 2020, 147, 106637. [Google Scholar] [CrossRef]
- Mohammadi, A.; Tavakolan, M. Identifying safety archetypes of construction workers using system dynamics and content analysis. Saf. Sci. 2020, 129, 104831. [Google Scholar] [CrossRef]
- Zhang, M.; Wang, X.; Mannan, M.S.; Qian, C.; Wang, J. A system dynamics model for risk perception of lay people in communication regarding risk of chemical incident. J. Loss Prev. Process Ind. 2017, 50, 101–111. [Google Scholar] [CrossRef]
- Liu, Q.; Li, X.; Meng, X. Effectiveness research on the multi-player evolutionary game of coal-mine safety regulation in China based on system dynamics. Saf. Sci. 2019, 111, 224–233. [Google Scholar] [CrossRef]
- Liu, Q.; Li, X.; Hassall, M. Evolutionary game analysis and stability control scenarios of coal mine safety inspection system in China based on system dynamics. Saf. Sci. 2015, 80, 13–22. [Google Scholar] [CrossRef]
- Zhang, M.; Wang, X.; Mannan, M.S.; Qian, C.; Wang, J. System dynamical simulation of risk perception for enterprise decision-maker in communication of chemical incident risks. J. Loss Prev. Process Ind. 2017, 46, 115–125. [Google Scholar] [CrossRef]
- ISO. Risk Management–Risk Assessment Techniques: IEC 31010-2009; ISO: Geneva, Switzerland, 2009. [Google Scholar]
- Huang, W.; Shuai, B.; Zhang, G. Improved WBS-RBS based identification of risks in railway transportation of dangerous goods. China Saf. Sci. J. 2018, 28, 93. [Google Scholar]
- Uğurlu, Ö.; Yıldız, S.; Loughney, S.; Wang, J. Modified human factor analysis and classification system for passenger vessel accidents (HFACS-PV). Ocean Eng. 2018, 161, 47–61. [Google Scholar] [CrossRef]
- Kyriakidis, M.; Majumdar, A.; Ochieng, W.Y. The human performance railway operational index—A novel approach to assess human performance for railway operations. Reliab. Eng. Syst. Saf. 2018, 170, 226–243. [Google Scholar] [CrossRef]
- Huang, W.; Shuai, B.; Zuo, B.; Xu, Y.; Antwi, E. A systematic railway dangerous goods transportation system risk analysis approach: The 24 model. J. Loss Prev. Process Ind. 2019, 61, 94–103. [Google Scholar] [CrossRef]
- GB/T 13861-2009; Classification and Code for the Hazardous and Harmful Factors in Process. General Administration of Quality Supervision. Inspection and Quarantine of the People’s Republic of China/Standardization Administration of China: Beijing, China, 2022.
- Larouzee, J.; Le Coze, J. Good and bad reasons: The Swiss cheese model and its critics. Saf. Sci. 2020, 126, 104660. [Google Scholar] [CrossRef]
- Suryoputro, M.R.; Sari, A.D.; Kurnia, R.D. Preliminary Study for Modeling Train Accident in Indonesia Using Swiss Cheese Model. Procedia Manuf. 2015, 3, 3100–3106. [Google Scholar] [CrossRef][Green Version]
- Song, W.; Li, J.; Li, H.; Ming, X. Human factors risk assessment: An integrated method for improving safety in clinical use of medical devices. Appl. Soft Comput. 2020, 86, 105918. [Google Scholar] [CrossRef]
- Underwood, P.; Waterson, P. Systems thinking, the Swiss Cheese Model and accident analysis: A comparative systemic analysis of the Grayrigg train derailment using the ATSB, AcciMap and STAMP models. Accid. Anal. Prev. 2014, 68, 75–94. [Google Scholar] [CrossRef]
- Ma, H.; Wu, Z.; Chang, P. Social impacts on hazard perception of construction workers: A system dynamics model analysis. Saf. Sci. 2021, 138, 105240. [Google Scholar] [CrossRef]
- You, M.; Li, S.; Li, D.; Cao, Q.; Xu, F. Evolutionary game analysis of coal-mine enterprise internal safety inspection system in China based on system dynamics. Resour. Policy 2020, 67, 101673. [Google Scholar] [CrossRef]
- Zhao, Y.; Zhang, M.; Liu, T.; Mebarki, A. Impact of safety attitude, safety knowledge and safety leadership on chemical industry workers’ risk perception based on Structural Equation Modelling and System Dynamics. J. Loss Prev. Process Ind. 2021, 72, 104542. [Google Scholar] [CrossRef]
- Xu, R.; Luo, F. Research on simulation of risk control strategy for air traffic controllers’ unsafe acts. Saf. Sci. 2022, 151, 105728. [Google Scholar] [CrossRef]
- Kheybari, S.; Rezaie, F.M.; Farazmand, H. Analytic network process: An overview of applications. Appl. Math. Comput. 2020, 367, 124780. [Google Scholar] [CrossRef]
- Farias, L.M.S.; Santos, L.C.; Gohr, C.F.; Rocha, L.O. An ANP-based approach for lean and green performance assessment. Resour. Conserv. Recycl. 2019, 143, 77–89. [Google Scholar] [CrossRef]
- Ervural, B.C.; Zaim, S.; Demirel, O.F.; Aydin, Z.; Delen, D. An ANP and fuzzy TOPSIS-based SWOT analysis for Turkey’s energy planning. Renew. Sust. Energ. Rev. 2018, 82, 1538–1550. [Google Scholar] [CrossRef]
- Arsić, S.; Nikolić, D.; Mihajlović, I.; Fedajev, A.; Živković, Ž. A New Approach Within ANP-SWOT Framework for Prioritization of Ecosystem Management and Case Study of National Park Djerdap, Serbia. Ecol. Econ. 2018, 146, 85–95. [Google Scholar] [CrossRef]
Publisher’s Note: MDPI stays neutral with regard to jurisdictional claims in published maps and institutional affiliations. |
© 2022 by the authors. Licensee MDPI, Basel, Switzerland. This article is an open access article distributed under the terms and conditions of the Creative Commons Attribution (CC BY) license (https://creativecommons.org/licenses/by/4.0/).