Article

Using Box–Behnken Design Coupled with Response Surface Methodology for Optimizing Rapeseed Oil Expression Parameters under Heating and Freezing Conditions

Department of Mechanical Engineering, Faculty of Engineering, Czech University of Life Sciences Prague, 16521 Prague, Czech Republic
*
Author to whom correspondence should be addressed.
Processes 2022, 10(3), 490; https://doi.org/10.3390/pr10030490
Submission received: 7 January 2022 / Revised: 23 February 2022 / Accepted: 24 February 2022 / Published: 28 February 2022
(This article belongs to the Special Issue Non-thermal Technologies in Food Science, Volume II)

Abstract

:
The effect of heating and freezing pretreatments on rapeseed oil yield and the volume of oil energy under uniaxial compression loading was investigated. Four separate experiments were carried out to achieve the study objective. The first and second experiments were performed to determine the compression parameters (deformation, mass of oil, oil yield, oil expression efficiency, energy, volume of oil and volume of oil energy). The third and fourth experiments identified the optimal factors (heating temperatures: 40, 60 and 80 °C, freezing temperatures: −2, −22 and −36 °C, heating times: 15, 30 and 45 min and speeds: 5, 10 and 15 mm/min) using the Box–Behnken design via the response surface methodology where the oil yield and volume of oil energy were the main responses. The optimal operating factors for obtaining a volume of oil energy of 0.0443 kJ/mL were a heating temperature of 40 °C, heating time of 45 min and speed of 15 mm/min. The volume of oil energy of 0.169 kJ/mL was reached at the optimal conditions of a freezing temperature of −36 °C, freezing time of 37.5 min and speed of 15 mm/min. The regression model established was adequate for predicting the volume of oil energy only under heating conditions.

1. Introduction

Seed oils can be used for different purposes, including human consumption as food, animal feed and biodiesel production [1,2,3,4,5]. Soybean, rapeseed, cottonseed, peanut, sunflower seed, palm kernel and copra are the major oilseed crops grown worldwide [1,6]. In the production of oil from oilseeds, the extraction process is one of the key stages [1]. The extraction of seed oils is performed by either mechanical pressing or solvent extraction [7,8]. Solvent oil extraction is the most efficient method. However, its application presents some challenges, such as high operation costs, poor-quality products caused by high processing temperatures, and health implications [7,9]. Mechanical pressing is a safer process with a chemical-free product [10,11,12]. Despite its advantages over the solvent extraction method, it is relatively inefficient. To increase the oil efficiency of the mechanical pressing process, oil-bearing materials are usually subjected to pretreatment processes [10,11,12]. Traditional pretreatment methods may include dehulling, size reduction, breaking, grinding, thermal treatment or cooking and enzymatic reduction [7,13,14]. Microwave radiation, ultrasound, pressurized liquid, and enzyme-assisted and supercritical fluid are modern methods for seed oil extraction in developed countries [7,11,15].
In rural areas, mechanical extraction is considered the best option [16]. Mechanically, seed oils may be extracted by cold or hot methods [17]. With the cold method, the seeds are pressed directly, while the hot method allows the seeds (crushed seeds) to be heated to temperatures between 40 and 120 °C or higher before oil extraction [15,17,18]. The heating of oilseeds is carried out to regulate the moisture of the material, rupture the cells to increase the fluidity of the oil, lower the viscosity and coagulate the protein meal [19]. The disadvantage is that heating induces chemical reactions such as oxidation, polymerization, hydrolysis and cis/trans isomerization, which affect the nutritional value of oils by generating toxic compounds harmful to health [20]. In that case, freezing plays an essential role in food quality, safety and preservation [21,22]. The high nutritional value and quality of frozen products can be achieved using appropriate and effective freezing methods [22]. To achieve this purpose, advanced freezing technologies have been widely developed, such as liquid nitrogen quick freezing, high-pressure-assisted freezing, ultrasound-assisted freezing and electric- or magnetic-field-assisted freezing [23]. Several researchers, to mention but a few [24,25,26,27,28,29], have studied the freezing process in food processing. Dealing with the processes of oil extraction from oilseeds, manufacturing and crushing industries are continually seeking to improve the yield and quality of the oil for consumer acceptability through various pretreatment and oil extraction methods [30,31]. Maximizing the oil yield also depends on the operating parameters: applied pressure, pressing temperature, pressing time and moisture content, amongst other factors [16]. These operating factors need to be optimized using appropriate statistical techniques, such as the Box–Behnken experimental design (BBD) combined with the response surface methodology (RSM) [32,33]. The BBD/RSM is a mathematical and statistical technique convenient for optimizing the responses, which are influenced by a range of process factors [34]. By applying the BBD/RSM, it is possible to evaluate the interactions of factors with the responses and to determine the optimal operating conditions for the process with the least number of experiments [35,36,37]. In general, the method requires three levels for each processing factor and the required experiments are executed based on the combination of the factors [38,39]. This approach is limited in the literature to the rapeseed oil extraction process under heating and freezing conditions in the uniaxial compression process.
Therefore, the objective of this study was to determine the optimal operating factors for extracting rapeseed oil in terms of percentage oil yield and volume of oil energy under the uniaxial compression process [19,40,41] using BBD/RSM.

2. Materials and Methods

2.1. Determination of Moisture and Oil Contents of Rapeseed Samples

In this study, a bag of rapeseed samples of weight 30 kg was procured from Farmet, a.s., Česká Skalice, Czech Republic. Unwanted materials such as dust, leaves, flowers and broken stems were removed. The experiments were conducted under a laboratory temperature of 25 °C and humidity of 25%. The moisture content of the sample of 5.14 ± 0.38 (% w.b.) was determined using the conventional oven method of 105 °C and drying time of 17 h [42,43]. The oil content in the rapeseed sample was determined to be 31.87 ± 0.01% using the Soxhlet extraction method [19,44,45].

2.2. Preliminary Compression Experiments

Two separate experiments were conducted to examine the effect of the heating and freezing pretreatments on the rapeseed sample by calculating the parameters of deformation (mm), mass of oil (g), oil yield (%), oil expression efficiency (%), energy (kJ), volume of oil (mL) and volume of oil energy (kJ/mL). The heating temperatures were 40, 60 and 80 °C and the freezing temperatures were −2, −22 and −36 °C. The temperature of 25 °C served as the control. The oven (MEMMERT GmbH + Co. KG, Buechenbach, Germany) and a blast chiller/freezer (Rev 02_2016–Del06/2016, Cod. Listrbn, Italy) were used for the pretreatment of the rapeseeds sample. The compression experiments were carried out using the universal compression testing machine (TEMPOS spol. s.r.o., Opava, Czech Republic (Machine Service); ZDM 50, VEB Werkstoffprüfmaschinen Leipzig, Germany) and a pressing vessel of diameter 60 mm with a plunger [19,40,41,46,47]. The initial pressing height of the rapeseeds sample was measured at 80 mm from which the volume of the rapeseeds sample was calculated to be 22.62 × 10⁻⁵ m3. The rapeseed samples were pressed at a speed of 5 mm/min and a force of 100 kN (equivalent pressure of 35.37 MPa). The deformation values were obtained directly from the compression data. The mass of oil was calculated as the initial mass of the sample minus the seedcake after compression according to the relationship given by [47]. The oil yield was calculated as the ratio of the mass of oil to that of mass of the sample multiplied by 100 according to the relationship given by [48]. The oil expression efficiency was calculated as the ratio of oil yield to that of the percentage oil content in the seeds as reported by [19,44]. The energy was calculated based on the trapezoidal rule [19,47,49,50]. The volume of oil was determined as the ratio of the mass of oil to that of the density of the oil, and the volume of oil energy was calculated based on the ratio of energy to that of the volume of oil. The literature data of the density of rapeseed oil was found to range from 0.903 to 0.907 g/mL [51]. All the mathematical formulas of the calculated parameters have been described in our previously published studies [19,41]. To fully understand the effect of the pretreatments and the compression variables, the BBD/RSM was employed to determine the optimal processing factors with the corresponding responses (oil yield and volume of oil energy).

2.3. Box–Behnken Design and Response Surface Methodology

The Box–Behnken design (BBD) combined with the response surface methodology (RSM) was used to determine the optimal factors (heating and freezing temperatures, heating time and speed) at three factor levels, each generating 34 experiments in total. The heating experimental factors were heating temperature 40, 60 and 80 °C; heating time 15, 30 and 45 min; and speed 5, 10 and 15 mm/min. The freezing experimental factors were freezing temperature −2 °C, −22 °C and −36 °C, and heating time and speed as already stated. The mathematical equation defining the BBD/RSM [52,53] is given in (Equation (1)).
Y = β 0 + i = 1 3 β i X i + i = 1 3 β i i X i i i 2 + i = 1 2 j = i + 1 3 β i j X i X j  
where Y is the response variable; β 0 , β i , β i i and β i j are the regression coefficients of the intercept, linear, quadratic and interaction terms, respectively; and X i and X j are the independent variables. The factor levels stated above were coded from −1 to +1, with 0 being the central value according to Equation (2) [54].
x i = X i X 0 Δ X  
where x i is the coded value of the ith variable, X i is the uncoded value of the ith test variable, X 0 is the uncoded value of the ith test variable at the centre point and ∆X is the step change in the real value of the variable i corresponding to the variation in a unit for the dimensionless value of the variable i.

2.4. Statistical Analysis of Experimental Data

The experimental data were analyzed by employing the repeated measures ANOVA and response surface regression techniques at a 5% significance level using STATISTICA 13 [55].

3. Results

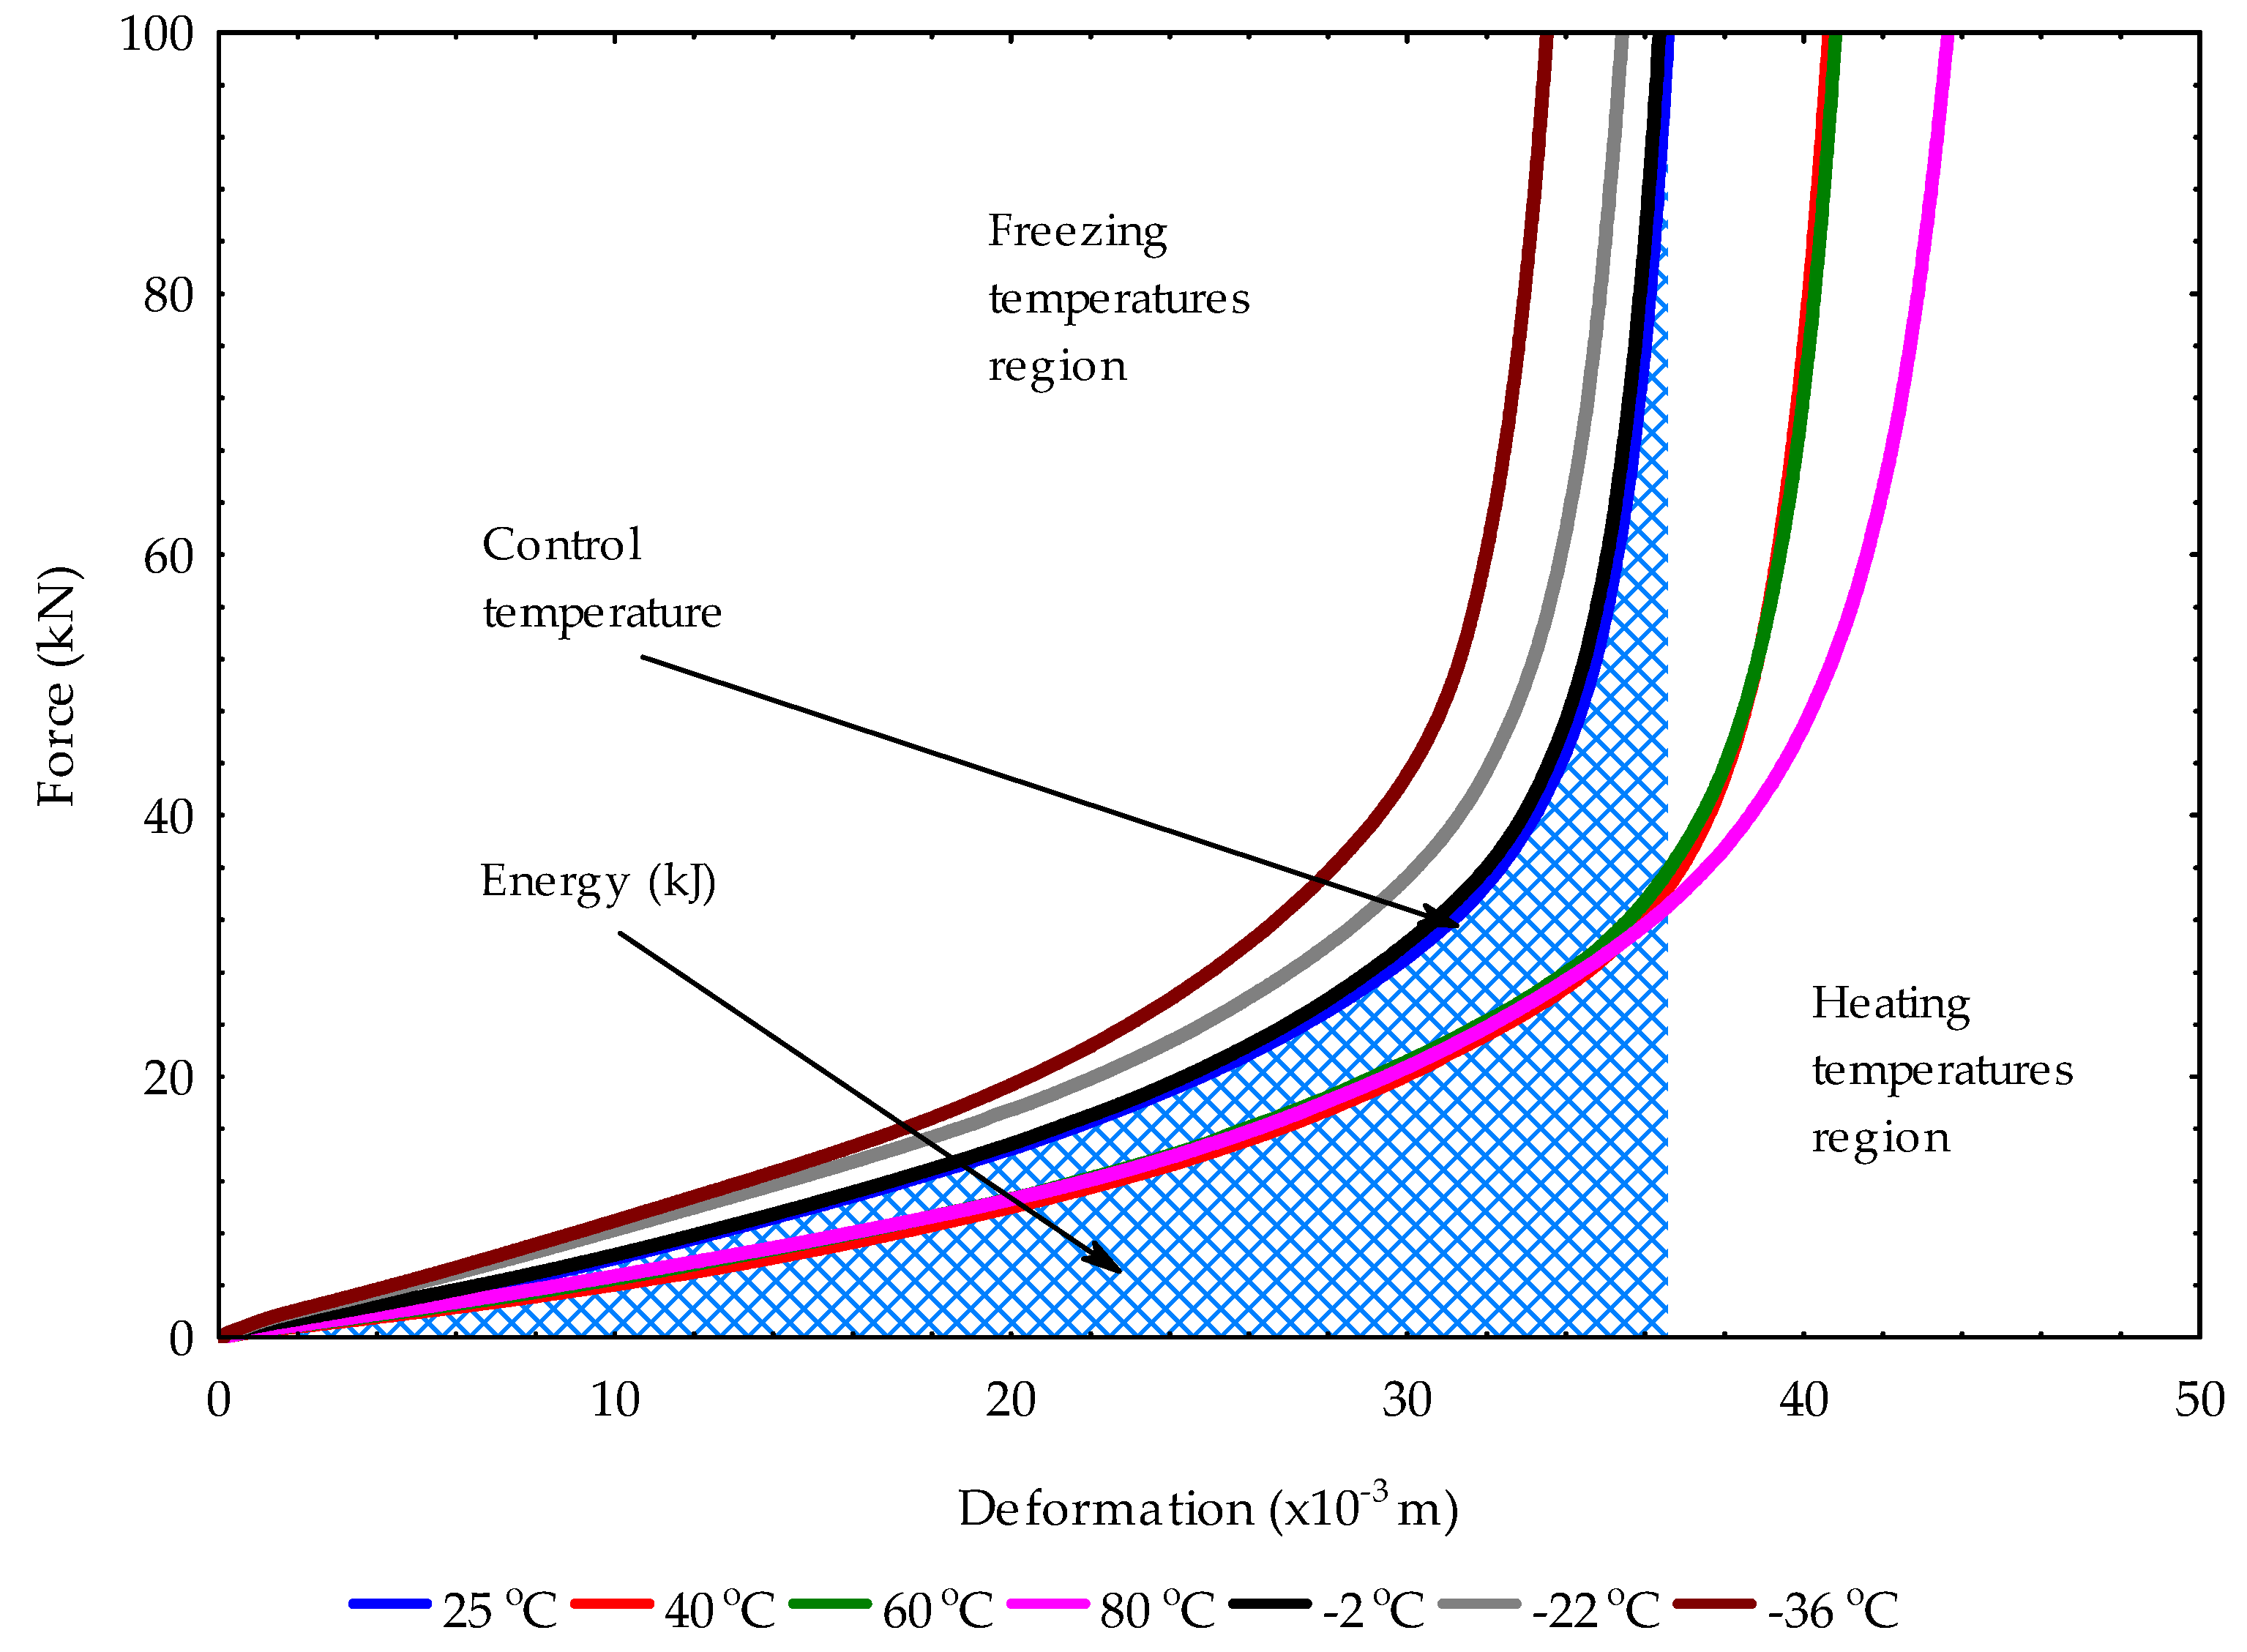
3.1. Force–Deformation Curves of Rapeseed Sample Pretreatments

The force–deformation curves of the rapeseed samples at heating and freezing temperatures are displayed in Figure 1. It can be seen in Figure 1 that the curves of the control temperature of 25 °C and freezing temperature of −2 °C are the same, indicating an equal amount of energy demand for producing the oil. A similar trend was observed for the heating temperatures of 40 °C and 60 °C. However, the curves of the freezing temperatures of −22 °C and −36 °C, as well as the heating temperature of 80 °C, were separated from each other, suggesting a different level of energy demand for obtaining the oil. The moisture content, pretreatment conditions, forces, speeds and pressing vessel of diameter 60 mm, together, during the compression process did not cause serration behavior or a wave-effect on the force–deformation curves of rapeseeds [47,49,50]. The smooth force–deformation curves obtained, however, indicate that maximum oil output was extracted with the corresponding energy demand, which is important for designing a new oil extraction system. The area under the force–deformation curve thus represents the energy demand (Figure 1) [47,49,50].

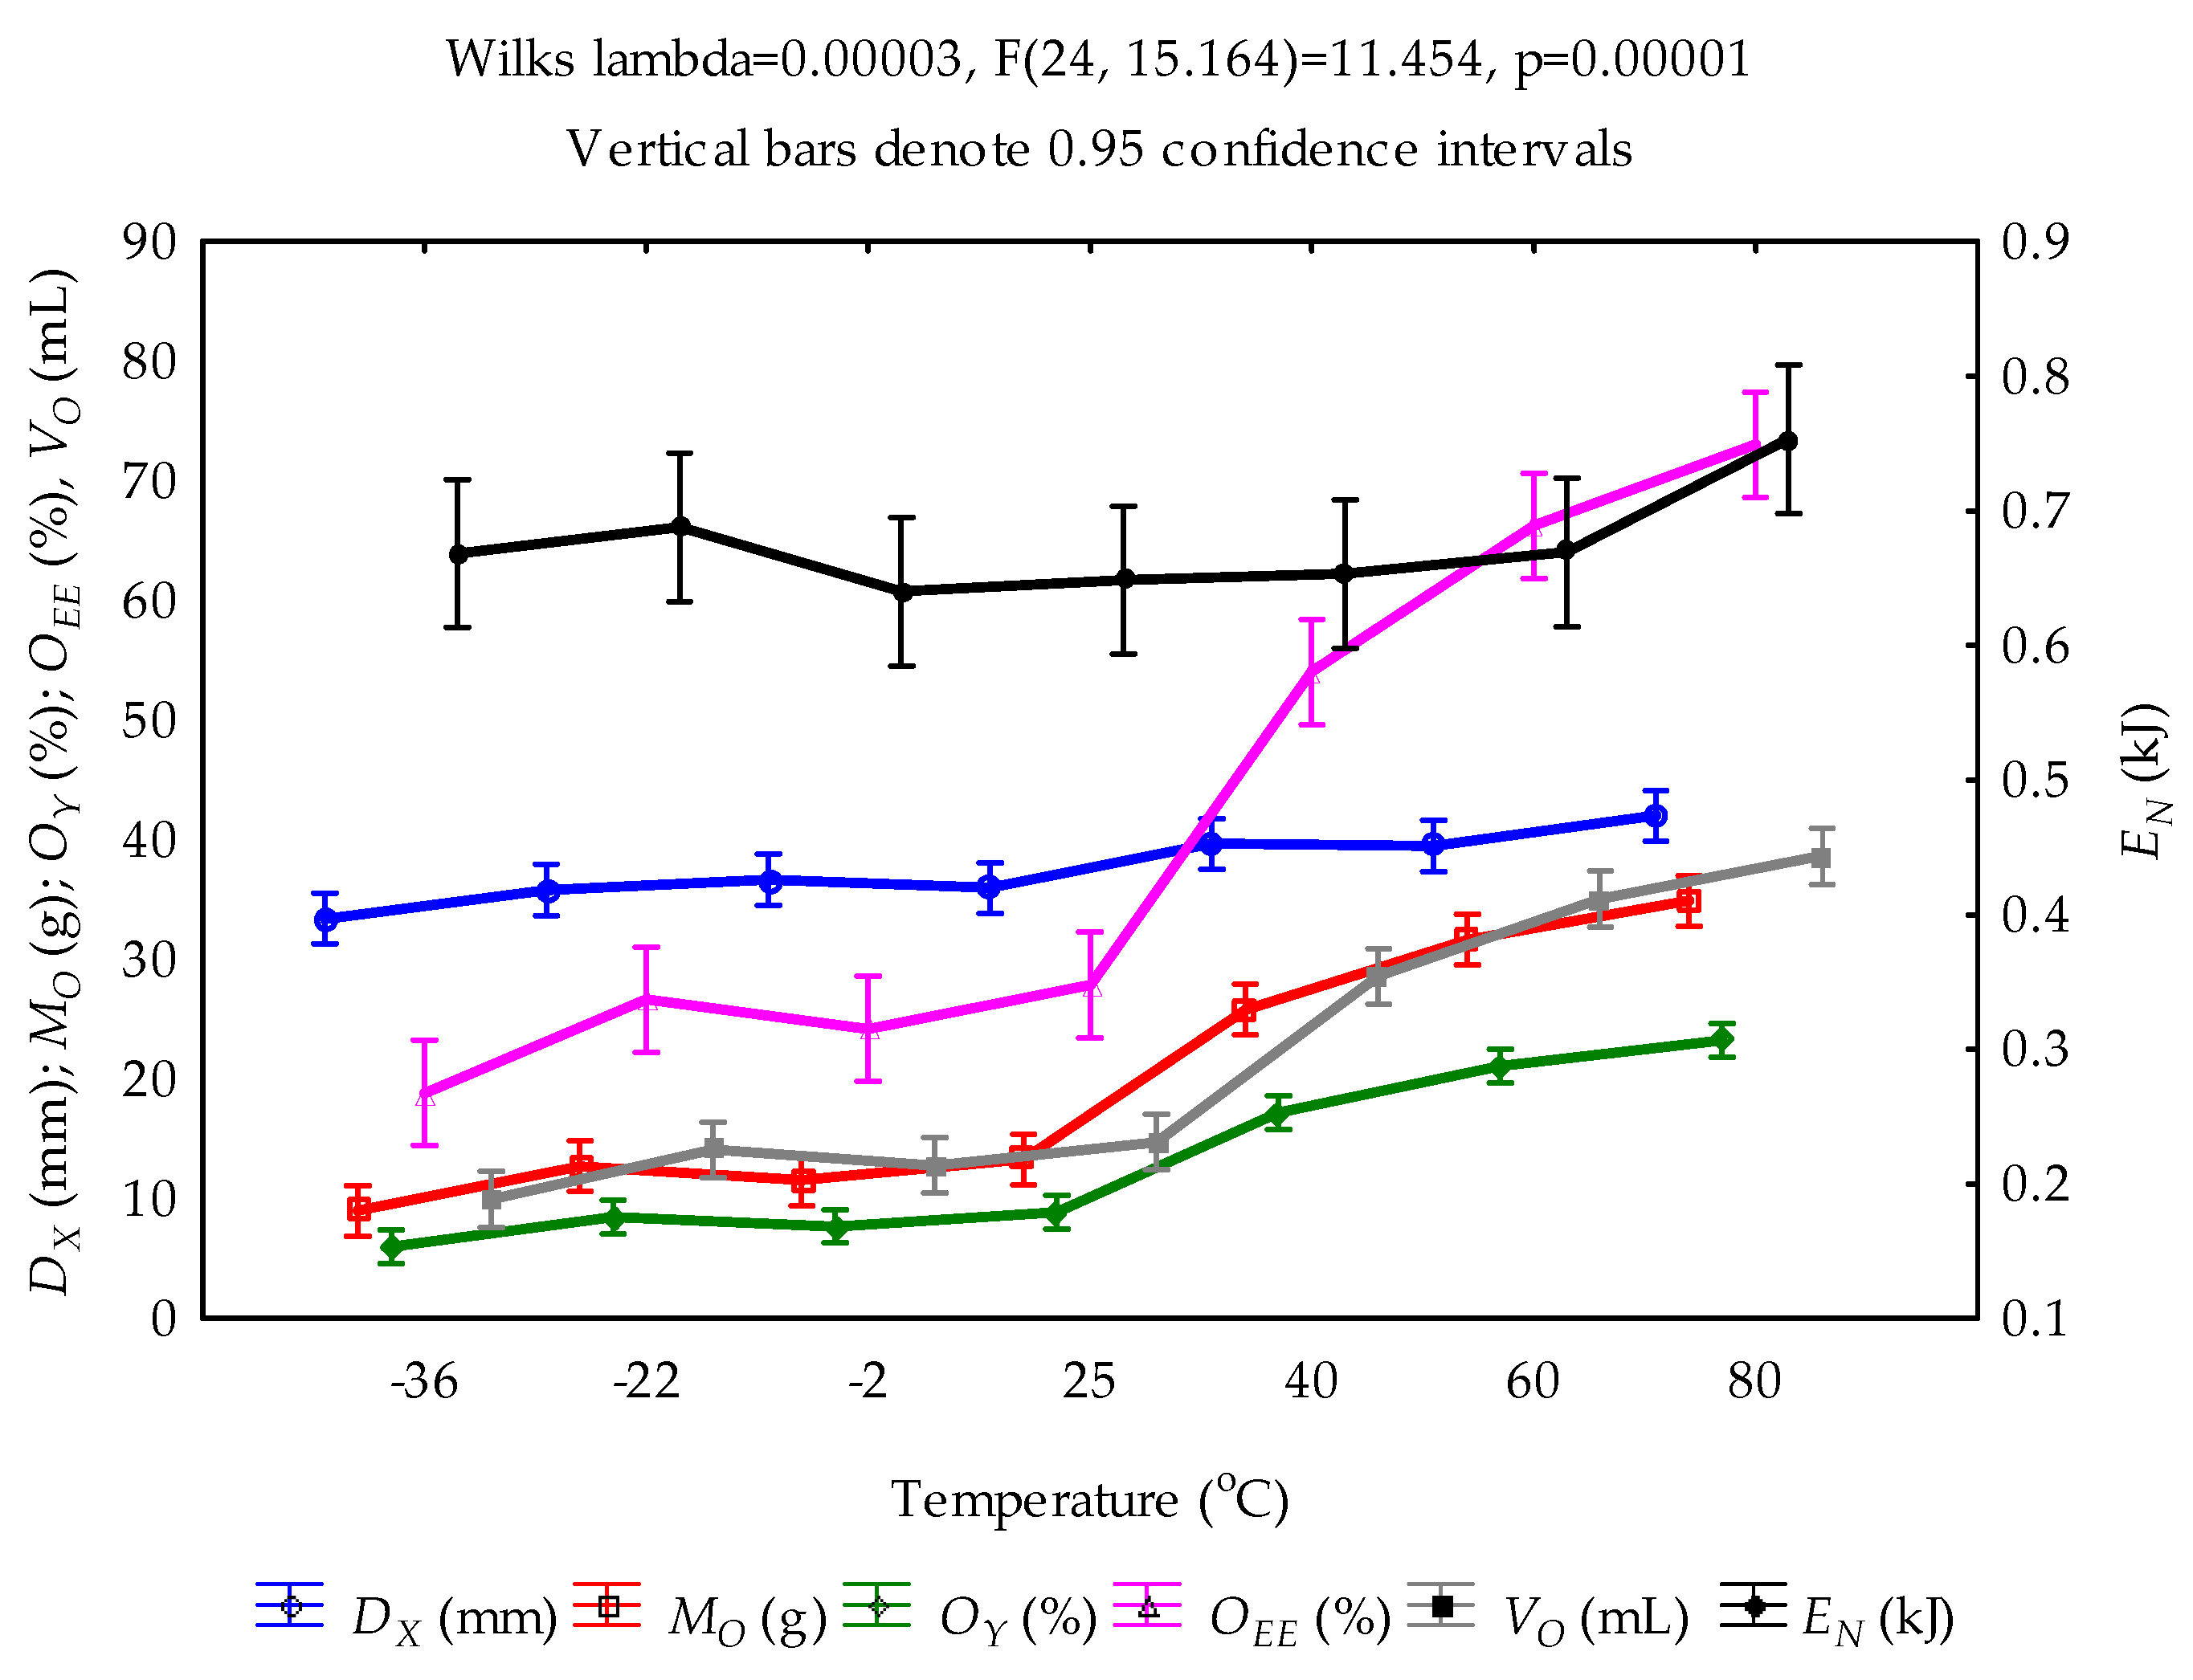
3.2. Calculated Parameters from Heating and Freezing Pretreatments

The means and standard deviations of the calculated parameters—deformation (mm), mass of oil (g), oil yield (%), oil expression efficiency (%), energy (kJ), volume of oil (mL) and volume of oil energy (kJ/mL)—with the variation in the heating and freezing temperatures are given in Table 1 and graphically shown in Figure 2. Based on the control temperature of 25 °C, all the calculated parameters linearly increased with the heating temperatures between 40 and 80 °C, except the volume of oil energy, which decreased linearly with heating temperature. In comparison with freezing temperatures between −2 °C and −36 °C, all of the parameters showed both increasing and decreasing trends, except oil expression efficiency, which linearly decreased with the freezing temperatures. Particularly, the oil yield value of 23.27 ± 1.30 was the highest at a heating temperature of 80 °C, with a corresponding volume of oil energy of 0.019 ± 0.001 kJ/mL. For the percentage oil yield and volume of oil energy or energy per unit volume of oil, it can be seen that it is more economical to extract the rapeseed oil at heating temperatures between 40 and 80 °C than at a control temperature of 25 °C and freezing temperatures between −2 °C and −36 °C, as shown in Figure 3.
To better understand the effect of the heating and freezing pretreatment temperatures on the calculated parameters, each pretreatment with the control temperature of 25 °C was subjected to ANOVA statistical analysis, and the results are given in Table 2 and Table 3. For the heating temperatures, deformation and energy were found to be non-significant (p > 0.05) compared with the other parameters, which showed significance (p < 0.05). Considering the freezing temperatures, only the energy parameter was non-significant. Again, without the control temperature of 25 °C for the freezing temperatures, the energy and volume of oil energy were non-significant. Statistically, the significant effect indicates that the increase in heating and the freezing pretreatment temperatures either increased or decreased with the calculated parameters. On the other hand, the non-significant effect explains that the calculated parameter(s) neither increase nor decrease regarding the heating and freezing pretreatment temperatures. The coefficients of determination (R2) justifying the results ranged between 55% and 99%. Among the calculated parameters stated above, oil yield and volume of oil energy were further evaluated based on the BBD/RSM (see Section 3.3).

3.3. BBD/RSM Factor Levels and Responses

The results of the three factor levels of heating temperatures (40, 60 and 80 °C), freezing temperatures (−2, −22 and −36 °C), heating times (15, 30 and 45 min), and speeds (5, 10 and 15 mm/min) are presented in Table 4 and Table 5. From the combination of heating temperatures, heating times and speeds, the values of oil yield ranged from 9.17 to 17.89%, whereas the values of the volume of oil energy ranged from 0.0251 to 0.0441 kJ/mL (Table 4). The highest oil yield value of 17.89% was achieved at 80 °C, a heating time of 30 min and speed of 5 mm/min. The lowest value of 9.17% was recorded at 40 °C, heating time of 30 min and speed of 15 mm/min. The volume of the oil energy value of 0.044 kJ/mL was the highest at 40 °C, a heating time of 30 min and speed of 15 mm/min, whereas the lowest value 0.0251 kJ/mL was observed at 80 °C, a heating time of 30 min and speed of 15 mm/min. It can be stated that the higher the heating temperature at a lower heating time and speed, the higher the oil yield. However, the lower the heating temperature and heating time at a higher speed, the lower the oil yield and the higher the volume of oil energy. In contrast, from the combination of freezing temperatures, heating times and speeds; the values of oil yield were between 2.13 and 8.72%, whereas the values of volume of oil energy were between 0.046 and 0.178 kJ/mL (Table 5). The highest oil yield value of 8.72% was achieved at −2 °C, a heating time of 30 min and speed of 5 mm/min, whereas the lowest value of 2.13% was recorded at −36 °C, a heating time of 30 min and speed of 15 mm/min. The volume of the oil energy value of 0.178 kJ/mL was the highest at −36 °C, a heating time of 30 min and speed of 15 mm/min, whereas the lowest value of 0.046 kJ/mL was recorded at −2 °C, a heating time of 30 min and speed of 5 mm/min. It was found that the lower the freezing temperature, heating time and speed, the higher the oil yield and the lower the volume of oil energy. However, the higher the freezing temperature at a lower freezing time and higher speed, the lower the oil yield and the higher the volume of oil energy.

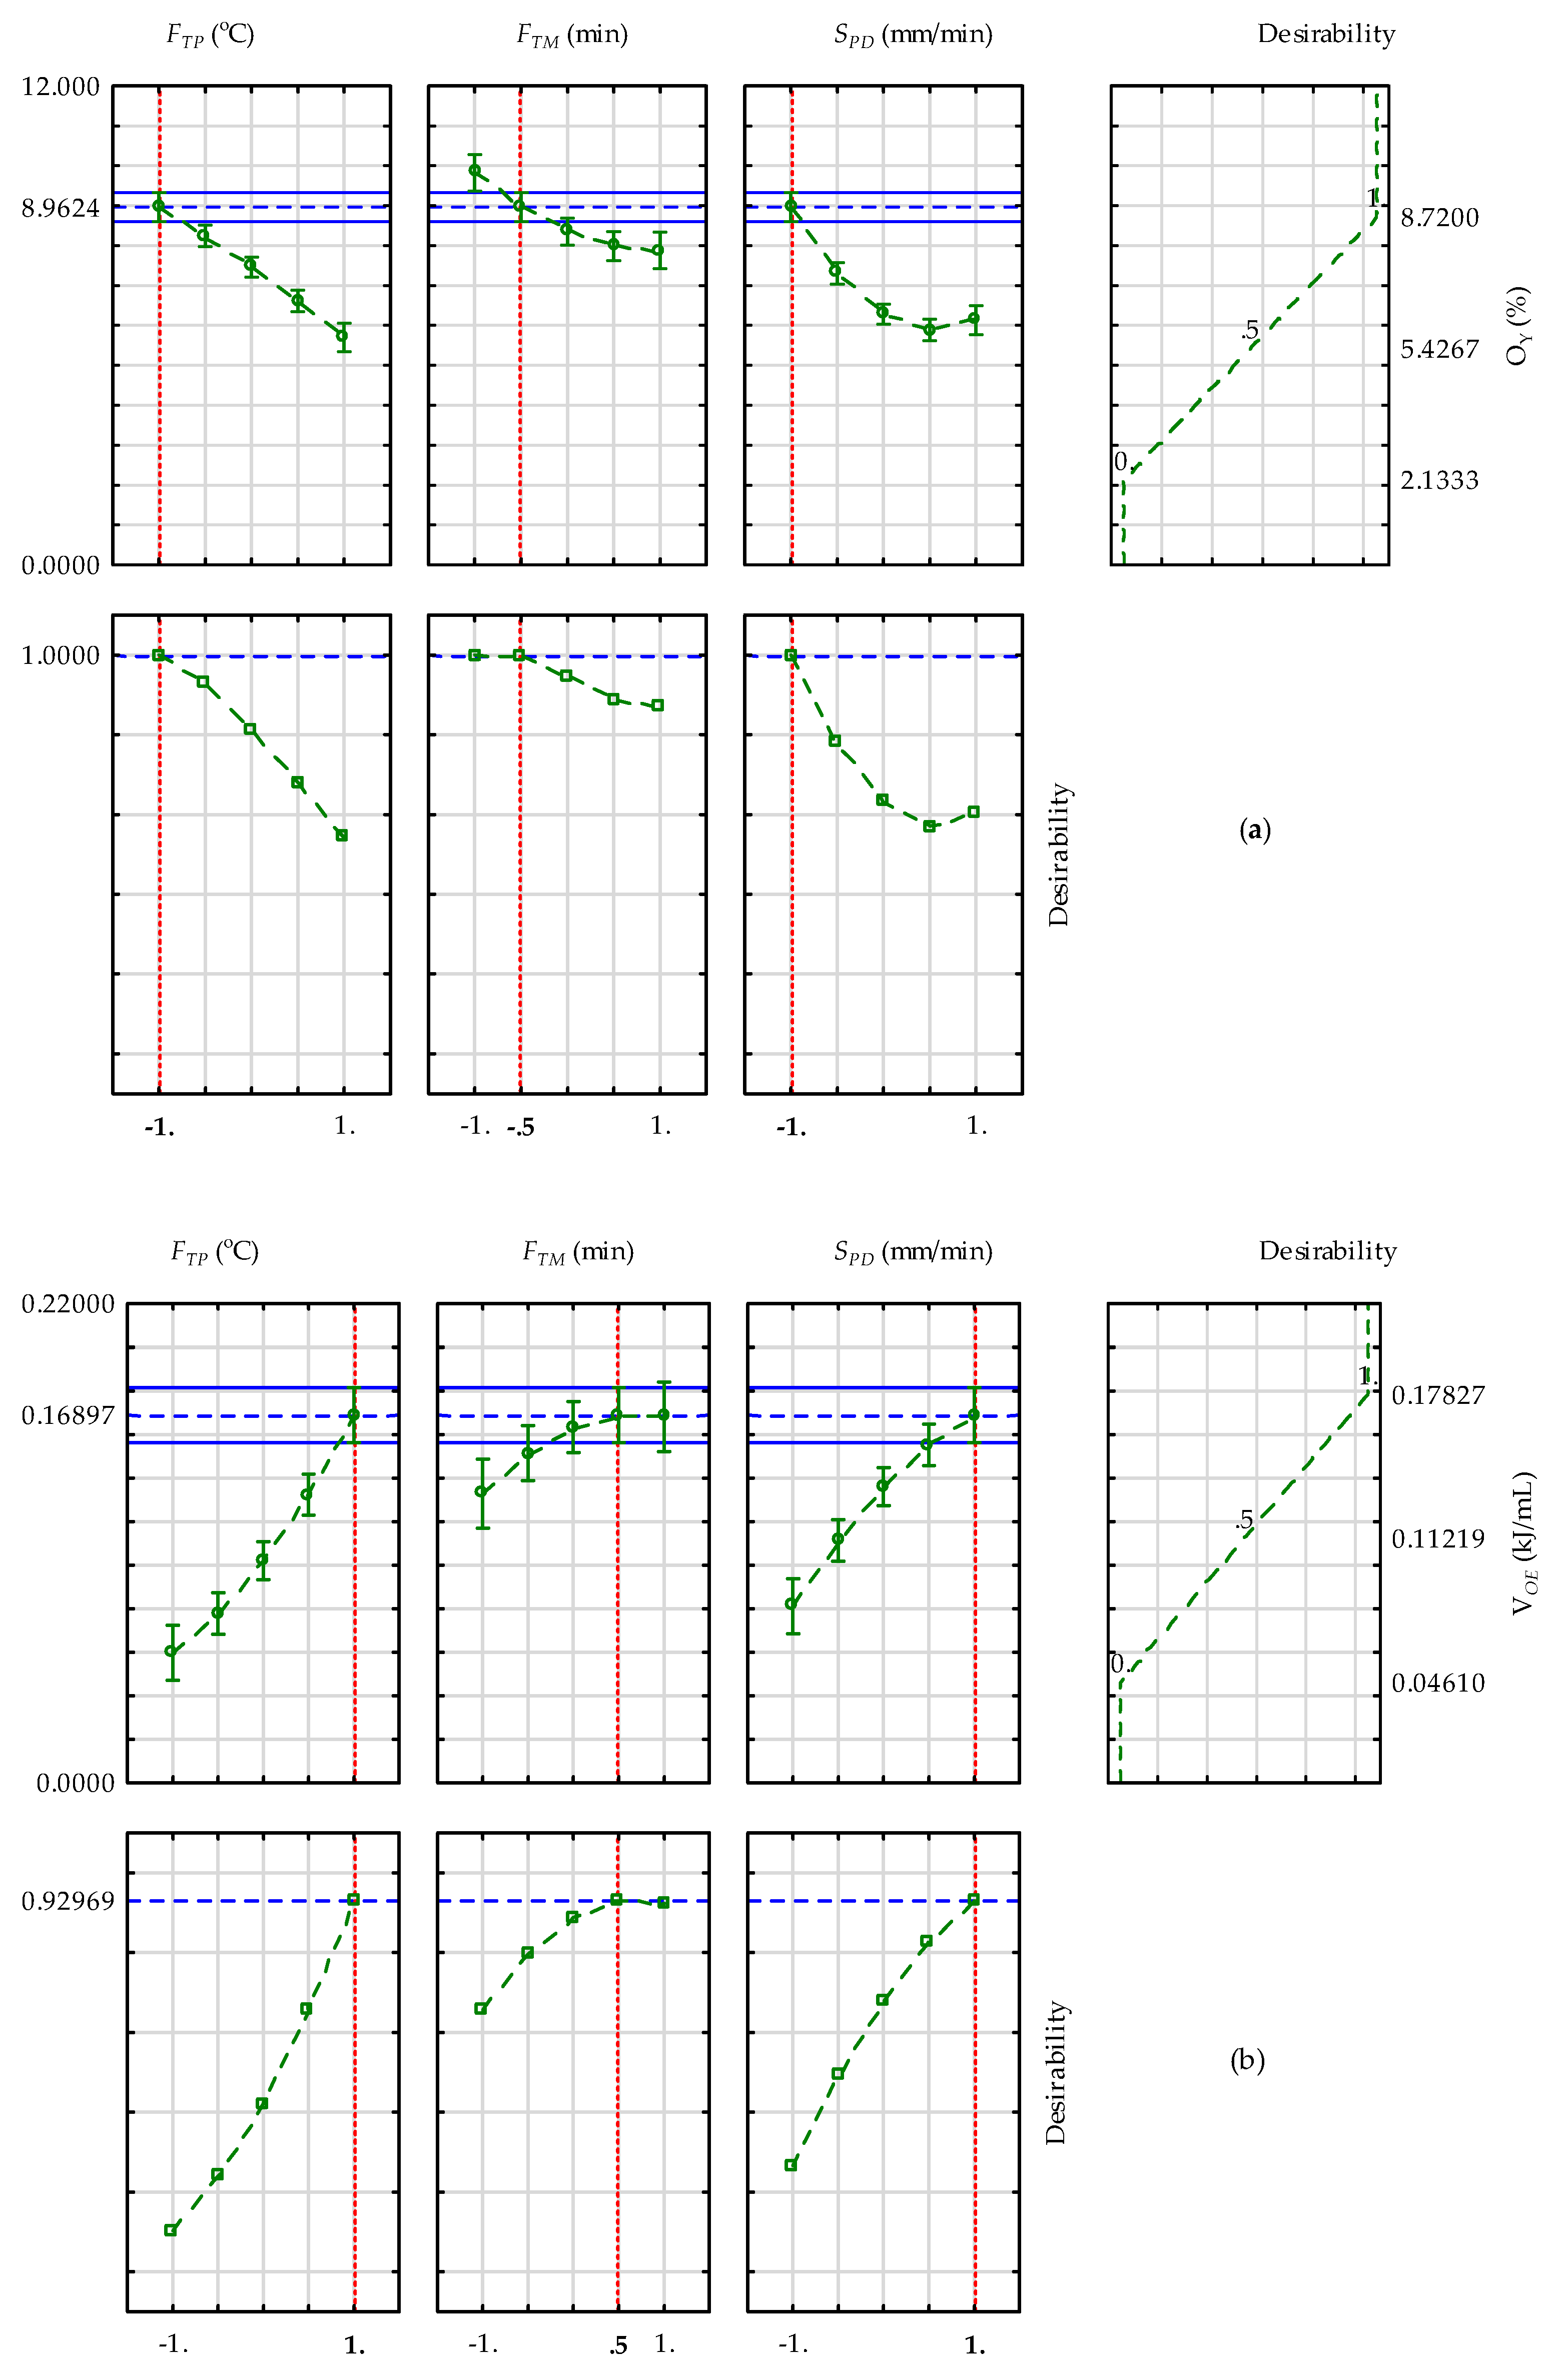
3.4. Estimates of Oil Yield and Volume of Oil Energy under Heating Temperatures

The regression results of oil yield and volume of oil energy with the heating temperatures, heating times and speeds, as well as their interactions are presented in Table 6 and Table 7. For oil yield, the coefficients of the intercept, the linear terms of the heating temperature and speed and the quadratic term of the speed were significant (p < 0.05) for predicting the oil yield. However, the lack of fit of the factors and their interactions is significant (p < 0.05), indicating that the model is not adequate for predicting the observed response under heating temperatures. The coefficient of determination was 96%. Under the same heating temperatures, the volume of the oil energy model (coefficients of the intercept, linear terms of heating temperature and speed and their interactions) was found to be significant for predicting the response, since its lack of fit was non-significant (p > 0.05), with a coefficient of determination of 94%. The Pareto charts of the significant terms of factors and their interactions for explaining the responses (oil yield and volume of oil energy) are shown in Figure 4a,b. The significant terms were above the red line, whereas the non-significant ones were below the red line. In Figure 5a,b, the interaction between heating temperature and speed at a constant heating time increased the oil yield by 15% and that of the volume of oil energy by 0.026 kJ/mL. Figure 5a,b represents other factor interactions. The predicted and desirability values of oil yield and volume of oil energy are also shown in Figure 6a,b. It can be seen in Figure 6a that the factor levels temperature of 80 °C, heating time of 30 min and speed of 5 mm/min were optimal for oil yield; and for the volume of oil energy (Figure 6b) the optimal factors were a temperature of 40 °C, heating time of 45 min and speed of 15 mm/min.

3.5. Estimates of Oil Yield and Volume of Oil Energy under Freezing Temperatures

The regression results of oil yield and the volume of oil energy with freezing temperatures, freezing times and speeds are presented in Table 8 and Table 9. The coefficients of the linear and quadratic terms of the freezing time and speed as well as the intercept and the linear term of freezing temperature for oil yield were significant (p < 0.05). Similarly, the coefficients of the intercept, freezing temperature, speed and their interactions for volume of oil energy were significant. However, the observed models were not adequate for predicting the response since the lack of fit was significant. The predicted and desirability values of oil yield and volume of oil energy are also shown in Figure 7a,b. It can be seen in Figure 7a,b that the factor levels for optimal oil yield were the freezing temperature of −2 °C, freezing time of 22.5 min and speed of 5 mm/min. The volume of oil energy factor levels were a freezing temperature of −36 °C, freezing time of 37.5 min and speed of 15 mm/min.

4. Discussion

The present study primarily evaluated the effect of heating and freezing pretreatments on rapeseed sample oil yield and the volume of oil energy under compression loading using the Box–Behnken design (BBD) approach coupled with response surface methodology (RSM). Four separate experiments were conducted to achieve the objective of the study. The first experiment examined heating temperatures from 40 °C to 80 °C. The second experiment assessed freezing temperatures from −2 °C to −36 °C. Here, the temperature of 25 °C served as the control. The first and second experiments were preliminary to appropriately determine the operating factor levels for the BBD/RSM in the third and fourth experiments. The third and fourth experiments were the focus of the study, which investigated the optimal operating factors (heating and freezing temperatures, heating times and speeds). In all experiments, the calculated parameters were deformation (mm), mass of oil (g), oil yield (%), oil expression efficiency (%), energy (kJ), volume of oil (mL) and volume of oil energy (kJ/mL). The deformation values were directly obtained from the compression tests using a maximum compressive force of 100 kN (equivalent pressure of 35.37 MPa) and speeds between 5 and 15 mm/min. The pressing height of the rapeseed sample was measured at 80 mm using the pressing vessel of diameter 60 mm with a plunger, whereby the volume of the sample was calculated to be 22.62 × 10⁻⁵ m3. The response surface regression statistical technique was used to determine the optimal factor levels for the main responses (oil yield and volume of oil energy).
Based on the ANOVA results of the preliminary experiments, the pretreatment temperatures (heating and freezing) had a significant effect (p < 0.05) on the rapeseed sample mass of oil (g), oil yield (%), oil expression efficiency (%), volume of oil (mL) and volume of oil energy (kJ/mL). However, the deformation and energy were not significantly (p > 0.05) affected by the pretreatment temperatures.
Under the heating temperatures combined with other factors (heating time and speed), all operating factors had a significant effect on oil yield, except the interactions of the factors, which had no significant effect (Figure 4a and Figure 5a). However, the oil yield model was not adequate for predicting its value of 17.772%, since its lack of fit was significant (p < 0.05) (Table 6). The coefficient of determination (R2) was 0.96. The optimal factors were the heating temperature, H T P : +1 = 80 °C; heating time, H T M : 0 = 30 min and speed, S P D : −1 = 5 mm/min (Figure 6a). Additionally, the volume of oil energy can be estimated by only the significant linear terms of the factors (heating temperature, heating time and speed) (Figure 4b and Figure 5b), being adequate for explaining the calculated response based on the non-significant term of the model lack of fit, which agrees with the studies of [16,52]. The volume of oil energy of 0.0443 kJ/mL was achieved at optimal conditions of heating temperature, H T P : −1 = 40 °C; heating time, H T M : 0 = 45 min and speed, S P D : +1 = 15 mm/min (Figure 6b). The coefficient of determination (R2) was 0.94, which indicates that the estimated model fits the experimental data satisfactorily, agreeing with the results reported by [16,41].
Regarding the results of the freezing temperatures combined with other factors, the interaction terms of the freezing time and speed, and freezing temperature and speed, as well as the quadratic term of freezing temperature, had no significant effect on oil yield compared with the linear terms of freezing temperature, speed, and freezing time together with the quadratic terms of speed and freezing time, which significantly affected the oil yield (Figure 4c). The model for predicting the oil yield under the freezing temperatures was assessed by the lack-of-fit value, which proved to be significant, indicating that the model was not adequate. However, the oil yield value of 8.962% was achieved at optimal conditions of freezing temperature of −2 °C, freezing time of 22.5 min and speed of 5 mm/min. Regarding the volume of oil energy, only the factor interaction terms of freezing temperature and freezing time, as well as the freezing time and speed, had no significant influence on the response compared with the other factor terms and their interactions, which influenced the response (Figure 4d). The volume of oil energy of 0.169 kJ/mL was achieved at the optimal conditions of freezing temperature, F T P : +1 = −36 °C; freezing time, F T M : +0.5 = 37.5 min and speed, S P D : +1 = 15 mm/min. The model was not adequate to explain the response based on the lack-of-fit value, which was significant.
In the literature, De Mello et al. [11] investigated the influence of the pretreatment of radish seeds and the ethanol flow rate, static time, temperature, and pressure on oil yield. The authors reported that an increase in temperature from 135 °C to 150 °C promoted an increase in oil yield, and a pressure of 5 MPa achieved an oil yield of 36.6%. Castejon et al. [56] reported Echium plantagineum L. seed oil yield of 31.2% and 29.1% at optimal conditions of temperatures of 50 °C and 150 °C, respectively, and a time of 10 min using pressurized liquid extraction and ultrasound-assisted extraction with ethanol. The oil yield of Jatropha curcas L. was also predicted to be 87% by Subroto et al. [16] based on optimal extraction conditions of 19 MPa applied pressure, 90 °C pressing temperature and 3.8% moisture content. Jalili et al. [57] investigated the influence of extraction temperature (35, 45 and 55 °C), ultrasound treatment time (30, 60 and 90 min) and solvent-to-canola sample ratio (5, 10 and 15% v/w) on the extraction yield of canola seed oil. The authors found the optimal conditions of an oil extraction percentage of 22.3% at an ultrasound treatment temperature of 55 °C, ultrasound treatment time of 87 min and solvent-to-canola ratio of 9.12% v/w. Finally, Agu et al. [58] studied the effect of the process parameters temperature, particle size and extraction time on Terminalia catappa seed oil using response surface methodology. The optimum parameters for 60.45% oil yield as reported by the authors were at 55 °C, 0.5 mm and 150 min. The studies mentioned above show that the BBD/RSM is useful for modeling and optimizing the process parameters as adopted in this present study. The results of the present study are an addition to our previously published studies [19,40,41] aimed at understanding completely the uniaxial oil extraction process to improve the mechanical oil pressing of edible and non-edible oilseeds in small to large scale productions.

5. Conclusions

In the present study, the following findings were established. Oil yield and oil expression efficiency increased linearly from 8.88 ± 0.25 to 23.27 ± 1.30, and 27.86 ± 0.77 to 73.03 ± 4.08 with heating temperatures from 40 to 80 °C. Under the freezing temperatures between −2 °C and −36 °C, these parameters did not show a linear trend, rather, they increased at −2 °C and −22 °C and then decreased at −36 °C. While the volume of oil energy decreased with heating temperature, it increased with freezing temperature. The volume of oil energy of 0.019 ± 0.001 kJ/mL was found at heating temperatures of 60 and 80 °C, respectively, indicating the efficient energy for obtaining 1L of the rapeseed oil under the uniaxial compression process. The control temperature of 25 °C produced the highest amount of the volume of oil energy of 0.044 ± 0.001 kJ/mL, indicating a higher energy demand for the cold pressing of the bulk rapeseeds compared with the hot pressing, which needed lower input energy. The regression model for predicting the oil yield under the heating temperatures was not adequate due to the significant value of the lack of fit. However, the lack-of-fit value for the volume of oil energy was non-significant, proving that the regression model was adequate for explaining the response. Under the freezing temperatures, the lack of fit of the regression models (oil yield and volume of oil energy) also proved to be significant. The optimal operating factors for the volume of oil energy of 0.0443 kJ/mL under the uniaxial compression process were found to be a heating temperature of 40 °C, heating time of 45 min and speed of 15 mm/min. In future studies, a similar methodology will be adopted to examine the operating factors of the mechanical screw press of type Farmet Duo (Farmet, a.s., Česká Skalice, Czech Republic) to extensively cognize both the uniaxial and mechanical screw-pressing processes of oil extraction from oilseeds. The variation in the oilseed moisture content with respect to the heating and freezing pretreatments will be considered, as well as the chemical and spectral properties of the extracted oil for the purposes of quality usage.

Author Contributions

Conceptualization, C.D., A.K., D.H. and Č.M.; methodology, C.D., A.K., D.H., A.S. and Č.M.; validation, C.D., A.K. and O.D.; formal analysis, C.D., A.K. and O.D.; data curation, C.D., A.K., A.S. and O.D; writing—original draft, C.D.; writing—review and editing, A.K., D.H. and Č.M. All authors have read and agreed to the published version of the manuscript.

Funding

The study was financed by the project ‘‘Supporting the development of international mobility of research staff at CULS Prague”, grant number: CZ.02.2.69/0.0/0.0/18_053/0016979.

Institutional Review Board Statement

Not applicable.

Informed Consent Statement

Not applicable.

Data Availability Statement

The data presented in this study are available on request from the corresponding author.

Conflicts of Interest

The authors declare no conflict of interest.

References

  1. Koubaa, M.; Mhemdi, H.; Barba, F.J.; Roohinejad, S.; Greiner, R.; Vorobiev, E. Oilseed treatment by ultrasound and microwaves to improve oil yield and quality: An overview. Food Res. Int. 2016, 85, 59–66. [Google Scholar] [CrossRef] [PubMed]
  2. Bacenetti, J.; Restuccia, A.; Schillaci, G.; Failla, S. Biodiesel production from unconventional oilseed crops (Linum usitatissimum L. and Camelina sativa L.) in Mediterranean conditions: Environmental sustainability assessment. Renew. Energy 2017, 112, 444–456. [Google Scholar] [CrossRef]
  3. Kumar, G. Ultrasonic-assisted reactive-extraction is a fast and easy method for biodiesel production from Jatropha curcas oilseeds. Ultrason. Sonochem. 2017, 37, 634–639. [Google Scholar] [CrossRef]
  4. Xie, W.; Wan, F. Immobilization of polyoxometalate-based sulfonated ionic liquids on UiO-66-2COOH metal-organic frameworks for biodiesel production via one-pot transesterification-esterification of acidic vegetable oils. Chem. Eng. J. 2019, 365, 40–50. [Google Scholar] [CrossRef]
  5. Abdulvahitoglu, A.; Kilic, M. A new approach for selecting the most suitable oilseed for biodiesel production; the integrated AHP-TOPSIS method. Ain Shams Eng. J. 2022, 13, 101604. [Google Scholar] [CrossRef]
  6. Daun, J.K.; Eskin, N.A.M.; Hickling, D. Canola: Chemistry, Production, Processing and Utilization; AOCS Press: Urbana, IL, USA, 2011. [Google Scholar]
  7. Uquiche, E.; Jerez, M.; Ortiz, J. Effect of pretreatment with microwaves on mechanical extraction yield and quality of vegetable oil from Chilean hazelnuts (Gevuina avellana Mol). Innov. Food Sci. Emerg.Technol. 2008, 9, 495–500. [Google Scholar] [CrossRef]
  8. Liu, J.-J.; Gasmalla, M.A.A.; Li, P.; Yang, R. Enzyme-assisted extraction processing from oilseeds: Principle, processing and application. Innov. Food Sci. Emerg. Technol. 2016, 35, 184–193. [Google Scholar] [CrossRef]
  9. Rahman, M.S.; Gul, K.; Yang, H.S.; Chun, J.; Kerr, W.L.; Choi, S.G. Thermal and functional characteristics of defatted bovine heart using supercritical CO2 and organic solvent. J. Sci. Food Agric. 2019, 99, 816–823. [Google Scholar] [CrossRef]
  10. Jablaoui, C.; Besombes, C.; Jamoussi, B.; Rhazi, L.; Allaf, K. Comparison of expander and instant controlled pressure-drop DIC technologies as thermomechanical pretreatments in enhancing solvent extraction of vegetal soybean oil. Arab. J. Chem. 2020, 13, 7235–7246. [Google Scholar] [CrossRef]
  11. De Mello, B.T.F.; Stevanato, N.; Filho, L.C.; da Silva, C. Pressurized liquid extraction of radish seed oil using ethanol as solvent: Effect of pretreatment on seeds and process variables. J. Supercrit. Fluids 2021, 176, 105307. [Google Scholar] [CrossRef]
  12. Mozhiarasi, V. Overview of pretreatment technologies on vegetable, fruit and flower market wastes disintegration and bioenergy potential: Indian scenario. Chemosphere 2022, 288, 132604. [Google Scholar] [CrossRef] [PubMed]
  13. Galloway, G.P. Cleaning, cracking, dehulling, decorticating and flaking of oil bearing materials. J. Am. Oil Chem. Soc. 1976, 53, 271–274. [Google Scholar] [CrossRef]
  14. Singh, J.; Bargale, P.C. Development of a small capacity double stage compression screw press for oil expression. J. Food Eng. 2000, 43, 75–82. [Google Scholar] [CrossRef]
  15. Zhang, Z.S.; Wang, L.J.; Li, D.; Jiao, S.S.; Chen, X.D.; Mao, Z.H. Ultrasound-assisted extraction of oil from flaxseed. Sep. Purif. Technol. 2008, 62, 192–198. [Google Scholar] [CrossRef]
  16. Subroto, E.; Manurung, R.; Heeres, H.J.; Broekhuis, A.A. Optimization of mechanical oil extraction from Jatropha curcas L. kernel using response surface method. Ind. Crops Prod. 2015, 63, 294–302. [Google Scholar] [CrossRef]
  17. Lee, K.-Y.; Rahman, M.S.; Kim, A.-N.; Son, Y.; Gu, S.; Lee, M.-H.; Kim, J.I.; Ha, T.J.; Kwak, D.; Kim, H.-J.; et al. Effect of freeze-thaw pretreatment on yield and quality of perilla seed oil. LWT-Food Sci. Technol. 2020, 122, 109026. [Google Scholar] [CrossRef]
  18. Wroniak, M.; Rekas, A.; Siger, A.; Janowicz, M. Microwave pretreatment effects on the changes in seeds microstructure, chemical composition and oxidative stability of rapeseed oil. LWT-Food Sci. Technol. 2016, 68, 634–641. [Google Scholar] [CrossRef]
  19. Gurdil, G.A.K.; Kabutey, A.; Selvi, K.C.; Hrabe, P.; Herak, D.; Frankova, A. Investigation of heating and freezing pretreatments on mechanical, chemical and spectral properties of bulk sunflower seeds oil. Processes 2020, 8, 411. [Google Scholar] [CrossRef] [Green Version]
  20. Botosoa, E.P.; Karoui, R. 3D front face fluorescence spectroscopy as a tool for monitoring the oxidation level of edible vegetable oil during storage at 60 °C. LWT-Food Sci. Technol. 2022, 15, 112659. [Google Scholar] [CrossRef]
  21. Mulot, V.; Benkhelifa, H.; Pathier, D.; Ndoye, F.-T.; Flick, D. Experimental and numerical characterization of food dehydration during freezing. J. Food Eng. 2019, 263, 13–24. [Google Scholar] [CrossRef]
  22. Palacz, M.; Piechnik, E.; Halski, M.; Stebel, M.; Adamczyk, W.; Eikevik, T.M.; Smolka, J. Experimental analysis of freezing process of stationary food samples inside a hydrofluidisation freezing chamber. Int. J. Refrig. 2021, 131, 68–77. [Google Scholar] [CrossRef]
  23. Zhu, Z.; Zhang, Y.; Sun, D.-W. Biomimetic modification of freezing facility surfaces to prevent icing and frosting during freezing for the food industry. Trends Food Sci. Technol. 2021, 111, 581–594. [Google Scholar] [CrossRef]
  24. Li, D.; Zhu, Z.; Sun, D.-W. Effects of freezing on cell structure of fresh cellular food materials: A review. Trends Food Sci. Technol. 2018, 75, 46–55. [Google Scholar] [CrossRef]
  25. Ferreira, S.R.; Rojas, L.O.A. Freezing times using time derivative of temperature on surface of foods. Int. J. Refrig. 2019, 98, 436–443. [Google Scholar] [CrossRef]
  26. Fu, X.; Belwal, T.; Cravotto, G.; Luo, Z. Sono-physical and sono-chemical effects of ultrasound: Primary applications in extraction and freezing operations and influence on food components. Ultrason. Sonochem. 2020, 60, 104726. [Google Scholar] [CrossRef]
  27. Stebel, M.; Smolka, J.; Palacz, M.; Piechnik, E.; Halski, M.; Knap, M.; Felis, E.; Eikevik, T.M.; Tolstorebrov, I.; Peralta, J.M.; et al. Numerical modelling of the food freezing process in a quasi-hydrofluidisation system. Innov. Food Sci. Emerg. Technol. 2021, 74, 102834. [Google Scholar] [CrossRef]
  28. Tian, Y.; Zhang, Z.; Zhu, Z.; Sun, D.-W. Effects of nano-bubbles and constant/variable-frequency ultrasound-assisted freezing on freezing behaviour of viscous food model systems. J. Food Eng. 2021, 292, 110284. [Google Scholar] [CrossRef]
  29. Chantanuson, R.; Nagamine, S.; Kobayashi, T.; Nakagawa, K. Preparation of soy protein-based food gels and control of fibrous structure and rheological property by freezing. Food Struct. 2022, 32, 100258. [Google Scholar] [CrossRef]
  30. Bogaert, L.; Mathieu, H.; Mhemdi, H.; Vorobiev, E. Characterization of oilseeds mechanical expression in an instrumental pilot screw press. Ind. Crops Prod. 2018, 121, 106–113. [Google Scholar] [CrossRef]
  31. Zhang, Y.; Li, X.; Lu, X.; Sun, H.; Wang, F. Effect of oilseed roasting on the quality flavor and safety of oil: A comprehensive review. Food Res. Int. 2021, 150, 110791. [Google Scholar] [CrossRef]
  32. de Almeida-Couto, J.M.; Abrantes, K.K.; Barão, C.E.; Wisniewski, A., Jr.; da Silva, C.; Cabral, V.F.; Cardozo-Filho, L. Pressured mixture of CO2 and propane for enhanced extraction of non-edible vegetable oil. J. Supercrit. Fluids 2021, 171, 105171. [Google Scholar] [CrossRef]
  33. Nekkaa, A.; Benaissa, A.; Lalaouna, A.E.D.; Mutelet, F.; Canabady-Rochelle, L. Optimization of the extraction process of bioactive compounds from Rhamnus alaternus leaves using Box-Behnken experimental design. J. Appl. Res. Med. Aromat. Plants 2021, 25, 100345. [Google Scholar] [CrossRef]
  34. Kassem, A.A.; Salama, A.; Mohsen, A.M. Formulation and optimization of cationic nanoemulsions for enhanced ocular delivery of dorzolamide hydrochloride using Box-Behnken design: In Vitro and In Vivo assessments. J. Drug Deliv. Sci. Technol. 2022, 68, 103047. [Google Scholar] [CrossRef]
  35. Aziz, A.; Driouich, A.; Bellil, A.; Ali, M.B.; Mabtouti, S.E.L.; Felaous, K.; Achab, M.; Bouari, A.E. Optimization of new eco-material synthesis obtained by phosphoric acid attach of natural Moroccan pozzolan using Box-Behnken Design. Ceram. Int. 2021, 47, 33028–33038. [Google Scholar] [CrossRef]
  36. Nor, A.F.M.; Hassan, M.Z.; Rasid, Z.A.; Sarip, S.; Daud, M.Y.M. Optimization on tensile properties of kenaf/multi-walled CNT hybrid composites with box-behnken design. Appl. Compos. Mater. 2021, 28, 607–632. [Google Scholar] [CrossRef]
  37. Driouich, A.; Chajri, F.; El Hassani, S.E.A.; Britel, O.; Belouafa, S.; Khabbazi, A.; Chaair, H. Optimization synthesis geopolymer based mixture metakaolin and fly ash activated by alkaline solution. J. Non-Cryst. Solids 2020, 544, 120197. [Google Scholar] [CrossRef]
  38. Rouhani, Z.; Karimi-Sabet, J.; Mehdipourghazi, M.; Hadi, A.; Dastbaz, A. Response surface optimization of hydrothermal synthesis of Bismuth ferrite nanoparticles under supercritical water conditions: Application for photocatalytic degradation of Tetracycline. Environ. Nanotechnol. Monit. Manag. 2019, 11, 1–9. [Google Scholar] [CrossRef]
  39. Matias, J.A.L.; Silva, I.B.T.; da Silva, A.O.; Oliveira, J.B.L.; da Silva, D.R.; Morales, M.A. (Bi13Co11) Co2O40–Co3O4 nanocomposites: Approach to different fuels in sol-gel combustion synthesis using the Box-Behnken design. Ceram. Int. 2022, 48, 481–494. [Google Scholar] [CrossRef]
  40. Kabutey, A.; Mizera, Č.; Dajbych, O.; Hrabě, P.; Herák, D.; Demirel, C. Modelling and Optimization of Processing Factors of Pumpkin Seeds Oil Extraction under Uniaxial Loading. Processes 2021, 9, 540. [Google Scholar] [CrossRef]
  41. Demirel, C.; Kabutey, A.; Herák, D.; Hrabě, P.; Mizera, Č.; Dajbych, O. Optimizing Uniaxial Oil Extraction of Bulk Rapeseeds: Spectrophotometric and Chemical Analyses of the Extracted Oil under Pretreatment Temperatures and Heating Intervals. Processes 2021, 9, 1755. [Google Scholar] [CrossRef]
  42. IS:3579; Indian Standard Methods for Analysis of Oilseeds. Indian Standard Institute: New Delhi, India, 1966.
  43. Blahovec, J. Agromatereials Study Guide; Czech University of Life Sciences: Prague, Czech Republic, 2008. [Google Scholar]
  44. Niu, L.; Li, J.; Chen, M.S.; Xu, Z.F. Determination of oil contents in Sacha inchi (Plukenetia volubilis) seeds at deferent developmental stages by two methods: Soxhlet extraction and time-domain nuclear magnetic resonance. Ind. Crops Prod. 2014, 56, 187–190. [Google Scholar] [CrossRef]
  45. Lee, A.; Chaibakhsh, N.; Rahman, M.B.A.; Basri, M.; Tejo, B.A. Optimizing enzymatic synthesis of levulinate ester in solvent-free system. Ind. Crops Prod. 2010, 32, 246–251. [Google Scholar] [CrossRef]
  46. Munson-Mcgee, S.H. D-optimal experimental designs for uniaxial expression. J. Food Process Eng. 2014, 37, 248–256. [Google Scholar] [CrossRef]
  47. Divisova, M.; Herak, D.; Kabutey, A.; Sigalingging, R.; Svatoňová, T. Deformation curve characteristics of rapeseeds and sunflower seeds under compression loading. Sci. Agric. Bohem. 2014, 45, 180–186. [Google Scholar]
  48. Deli, S.; Masturah, F.; Aris, T.Y.; Nadiah, W.W.A. The effects of physical parameters of the screw press oil expeller on oil yield from Nigella sativa L. Seeds. Int. Food Res. J. 2011, 18, 1367–1373. [Google Scholar]
  49. Gupta, R.K.; Das, S.K. Fracture resistance of sunflower seed and kernel to compressive loading. J. Food Eng. 2000, 46, 1–8. [Google Scholar] [CrossRef]
  50. Lysiak, G. Fracture toughness of pea: Weibull analysis. J. Food Eng. 2007, 83, 436–443. [Google Scholar] [CrossRef]
  51. Noureddini, H.; Teoh, B.C.; Clements, L.D. Densities of vegetable oils and fatty acids. J. Am. Oil Chem. Soc. 1992, 69, 1184–1188. [Google Scholar] [CrossRef]
  52. Chanioti, S.; Constantina, T. Optimization of ultrasound-assisted extraction of oil from olive pomace using response surface technology: Oil recovery, unsaponifiable matter, total phenol content and antioxidant activity. LWT-Food Sci. Technol. 2017, 79, 178–189. [Google Scholar] [CrossRef]
  53. Huang, S.; Hu, Y.; Li, F.; Jin, W.; Godara, V.; Wu, B. Optimization of mechanical oil extraction process from Camellia oleifera seeds regarding oil yield and energy consumption. J. Food Process Eng. 2019, 42, e13157. [Google Scholar] [CrossRef]
  54. Ocholi, O.; Menkiti, M.; Auta, M.; Ezemagu, I. Optimization of the operating parameters for the extractive synthesis of biolubricant from sesame seed oil via response surface methodology. Egypt. J. Pet. 2018, 27, 265–275. [Google Scholar] [CrossRef]
  55. StatSoft Inc. STATISTICA for Windows; StatSoft Inc.: Tulsa, OK, USA, 2013. [Google Scholar]
  56. Castejon, N.; Luna, P.; Senorans, F.J. Alternative oil extraction methods from Echium plantagenum L. seeds using advanced techniques and green solvents. Food Chem. 2018, 244, 75–82. [Google Scholar] [CrossRef] [PubMed]
  57. Jalili, F.; Jafari, S.M.; Emam-Djomeh, Z.; Malekjani, N.; Farzaneh, V. Optimization of ultrasound-assisted extraction of oil from canolo seeds with the use of response surface methodology. Food Anal. Methods 2018, 11, 598–612. [Google Scholar] [CrossRef]
  58. Agu, C.; Menkiti, M.; Kadurumba, C.; Menkiti, N. Process parameter optimization for transformer oil extraction from Terminalia catappa seed using response surface methodology. J. Chin. Adv. Mater. Soc. 2015, 3, 328–344. [Google Scholar]
Figure 1. Force−deformation curves of rapeseed under different pretreatment conditions (temperature of 25 °C served as the control).
Processes 10 00490 g001
Figure 2. Least square means of calculated parameters ( D X : deformation; M O : mass of oil; O Y : oil yield; O E E : oil expression efficiency; E N : energy and V O : volume of oil) grouped by temperature (°C).
Processes 10 00490 g002
Figure 3. Box plot of oil yield and volume of oil energy grouped by temperature (°C).
Processes 10 00490 g003
Figure 4. Pareto chart of standardized effects of the factors and interactions for O Y : oil yield (%) and V O E , volume of oil energy under heating temperatures (a,b); and freezing temperatures (c,d); H_Temp: H T P , heating temperature; Speed: S P D ; H_Time: H T M , heating time; F_Temp: F T P , freezing temperature; F_Time: F T M , freezing time; Q: quadratic; and L: linear.
Processes 10 00490 g004
Figure 5. Fitted surface plots of (a) O Y , oil yield, and (b) V O E , the volume of oil energy grouped by H T P , heating temperature (°C) and S P D , speed (mm/min), representing the other factor interactions.
Processes 10 00490 g005
Figure 6. Predicted and desirable values of (a) O Y , oil yield, and (b) V O E , the volume of oil energy under heating temperatures ( O Y : H T P : +1 = 80 °C; H T M : 0 = 30 min and S P D : −1 = 5 mm/min; V O E : H T P : −1 = 40 °C; H T M : +1 = 45 min and S P D : +1 = 15 mm/min).
Processes 10 00490 g006
Figure 7. Predicted values and desirability of (a) O Y , oil yield, and (b) V O E , volume of oil energy under heating temperatures ( O Y : F T P : −1 = −2 °C; F T M : −0.5 = 22.5 min and S P D : −1 = 5 mm/min; V O E : F T P : +1 = −36 °C; F T M : +0.5 = 37.5 min and S P D : +1 = 15 mm/min).
Processes 10 00490 g007
Table 1. Calculated parameters from the heating and freezing pretreatments of bulk rapeseeds.
H T p / F T p
(°C)
D X
(mm)
M O
(g)
O Y
(%)
O E E
(%)
E N
(kJ)
V O
(mL)
V O E
(kJ/mL)
2535.99 ± 0.6813.32 ± 0.378.88 ± 0.2527.86 ± 0.770.65 ± 0.0114.75 ± 0.410.044 ± 0.001
4039.67 ± 1.2725.84 ± 2.0617.22 ± 1.3754.04 ± 4.300.65 ± 0.0428.61 ± 2.280.023 ± 0.001
6039.51 ± 1.7731.68 ± 1.3321.12 ± 0.8966.27 ± 2.780.67 ± 0.0135.08 ± 1.470.019 ± 0.001
8042.03 ± 2.2834.91 ± 1.9523.27 ± 1.3073.03 ± 4.080.75 ± 0.0638.66 ± 2.160.019 ± 0.001
−236.67 ± 0.5911.58 ± 0.327.72 ± 0.2124.21 ± 0.670.64 ± 0.0212.82 ± 0.350.051 ± 0.003
−2235.81 ± 0.7412.75 ± 0.938.51 ± 0.6226.66 ± 1.940.69 ± 0.0314.11 ± 1.030.049 ± 0.006
−3633.41 ± 0.049.01 ± 0.526.00 ± 0.3418.84 ± 1.080.67 ± 0.039.97 ± 0.570.067 ± 0.007
H T p / F T p : heating/freezing temperatures; D X : deformation; M O : mass of oil (g); O Y : oil yield (%); O E E : oil expression efficiency (%); E N : energy; V O : volume of oil; V O E : volume of oil energy.
Table 2. ANOVA results of calculated parameters in relation to heating temperatures.
ParametersR2F-Valuep-Value
D X   (mm)0.784.74>0.05
M O   (g)0.9872.85<0.05
O Y   (%)0.9872.85<0.05
O E E   (%)0.9872.85<0.05
E N   (kJ)0.733.55>0.05
V O   (mL)0.9872.85<0.05
V O E   (kJ/mL)0.99836.57<0.05
Table 3. ANOVA results of calculated parameters in relation to freezing temperatures.
ParametersR2F-Valuep-Value
D X   (mm)0.8911.93<0.05
M O   (g)0.9421.53<0.05
O Y   (%)0.9421.53<0.05
O E E   (%)0.9421.53<0.05
E N   (kJ)0.551.62>0.05
V O   (mL)0.9421.53<0.05
V O E   (kJ/mL)0.879.19<0.05
D X : deformation; M O : mass of oil (g); O Y : oil yield (%); O E E : oil expression efficiency (%); E N : energy; V O : volume of oil; V O E : volume of oil energy; higher F-value > p-value or p-value < 0.05 is significant; lower F-value > p-value or p-value > 0.05 is non-significant.
Table 4. Factor levels and calculated parameters under heating temperatures.
Run H T P   ( ° C ) H T M   ( min ) S P D   ( mm / min ) O Y   ( % ) V O E   ( kJ / mL )
1−1(40)−1(15)0(10)10.060.0372
21(80)−1(15)0(10)14.220.0270
3−1(40)1(45)0(10)10.350.0383
41(80)1(45)0(10)13.850.0287
5−1(40)0(30)−1(5)13.190.0317
61(80)0(30)−1(5)17.890.0263
7−1(40)0(30)1(15)9.170.0441
81(80)0(30)1(15)15.260.0251
90(60)−1(15)−1(5)15.230.0277
100(60)1(45)−1(5)16.730.0261
110(60)−1(15)1(15)11.150.0360
120(60)1(45)1(15)11.950.0343
130(60)0(30)0(10)13.430.0287
140(60)0(30)0(10)13.060.0336
150(60)0(30)0(10)13.440.0303
160(60)0(30)0(10)13.690.0328
170(60)0(30)0(10)13.010.0316
H T p : heating temperature (°C); H T M : heating time (min); S P D : speed (mm/min); O Y : oil yield (%); V O E : volume of oil energy (kJ/mL).
Table 5. Factor levels and calculated parameters under freezing temperatures.
Run F T P   ( ° C ) F T M   ( min ) S P D   ( mm / min ) O Y   ( % ) V O E   ( kJ / mL )
1−1(−2)−1(15)0(10)7.030.0542
21(−36)−1(15)0(10)3.640.1000
3−1(−2)1(45)0(10)5.170.0679
41(−36)1(45)0(10)2.870.1318
5−1(−2)0(30)−1(5)8.720.0461
61(−36)0(30)−1(5)5.570.0705
7−1(−2)0(30)1(15)5.320.0671
81(−36)0(30)1(15)2.130.1783
90(−22)−1(15)−1(5)7.930.0511
100(−22)1(45)−1(5)6.470.0611
110(−22)−1(15)1(15)5.640.0626
120(−22)1(45)1(15)4.240.0856
130(−22)0(30)0(10)4.140.0935
140(−22)0(30)0(10)4.310.0852
150(−22)0(30)0(10)4.230.0929
160(−22)0(30)0(10)4.310.0910
170(−22)0(30)0(10)4.520.0825
F T p : freezing temperature (°C); F T M : freezing time (min); S P D : speed (mm/min); O Y : oil yield (%); V O E : volume of oil energy (kJ/mL).
Table 6. Regression analysis of oil yield, O Y (%), under heating temperatures.
Effect Model ,   O Y   ( % )   a Standard ErrorSum of SquaresdfMean SquareF-Valuep-Value
Intercept13.330.2981.6899.0822.10<0.05
H T P 2.310.2342.57142.57514.71<0.05
H T P 2 −0.550.311.2511.2515.13>0.05
H T M 0.280.230.6210.627.49>0.05
H T M 2 −0.660.311.8311.8322.08>0.05
S P D −1.940.2330.06130.06363.46<0.05
S P D 2 1.090.315.0515.0561.03<0.05
H T P × H T M −0.170.320.1110.111.32>0.05
H T P × S P D 0.350.320.4910.495.87>0.05
H T M × S P D −0.180.320.1210.121.48>0.05
Residual 2.8770.41
Lack of fit 2.5430.8510.25<0.05
Total 84.5516
H T p : heating temperature (°C); H T M : heating time (min); S P D : speed (mm/min); O Y : oil yield (%); df: degree of freedom; p-value < 0.05 means significant; df: degrees of freedom; p-value > 0.05 means non-significant; a: coefficient of determination (R2) = 0.96.
Table 7. Regression analysis of volume of oil energy, V O E (kJ/mL), under heating temperatures.
Effect Model ,   V O E ( kJ / mL )   a Standard ErrorSum of SquaresdfMean SquareF-Valuep-Value
Intercept0.03140.00090.0003990.00004411.99<0.05
H T P −0.00550.00070.00024410.00024465.39<0.05
H T P 2 0.00110.00090.00000510.0000051.31>0.05
H T M −0.00010.00070.00000010.0000000.01>0.05
H T M 2 0.00030.00090.00000010.0000000.12>0.05
S P D 0.00350.00070.00009610.00009625.75<0.05
S P D 2 −0.00070.00090.00000210.0000020.59>0.05
H T P ×   H T M 0.00010.00100.00000010.0000000.02>0.05
H T P ×   S P D −0.00340.00100.00004610.00004612.36<0.05
H T M ×   S P D −0.00000.00100.00000010.0000000.00>0.05
Residual 0.00002670.000004
Lack of fit 0.00001130.0000040.95>0.05
Total 0.00041916
H T p : heating temperature (°C); H T M : heating time (min); S P D : speed (mm/min); V O E : volume of oil energy (kJ/mL); df: degrees of freedom; p-value < 0.05 means significant; p-value > 0.05 means non-significant; a: coefficient of determination (R2) = 0.94.
Table 8. Regression analysis of oil yield, O Y (%), under freezing temperatures.
Effect Model ,   O Y   ( % )   a Standard ErrorSum of SquaresDfMean SquareF-Valuep-Value
Intercept4.300.1546.33295.14844.308<0.05
F T P −1.500.1218.080118.080919.742<0.05
F T P 2 −0.130.170.06810.0683.464>0.05
F T M −0.690.123.76313.763191.422<0.05
F T M 2 0.500.171.07211.07254.516<0.05
S P D −1.420.1216.112116.112819.639<0.05
S P D 2 1.260.176.69716.697340.680<0.05
F T P × F T M 0.270.170.29910.29915.202>0.05
F T P × S P D −0.010.170.00010.0000.020>0.05
F T M × S P D 0.020.170.00110.0010.046>0.05
Residual 0.81370.116
Lack of fit 0.73530.24512.460<0.05
Total 47.14616
F T p : freezing temperature (°C); F T M : freezing time (min); S P D : speed (mm/min); O Y : oil yield (%); df: degrees of freedom; p-value < 0.05 means significant; p-value > 0.05 means non-significant; a: coefficient of determination (R2) = 0.98.
Table 9. Regression analysis of volume of oil energy, V O E (kJ/mL), under freezing temperatures.
Effect Model ,   V O E   ( kJ / mL )   a Standard ErrorSum of SquaresDfMean Square F-Valuep-Value
Intercept0.0890.0060.0154890.0017209.43<0.05
F T P 0.0310.0050.00751810.007518311.66<0.05
F T P 2 0.0120.0070.00064910.00064926.91>0.05
F T M 0.0100.0050.00077010.00077031.90>0.05
F T M 2 −0.0130.0070.00070910.00070929.39>0.05
S P D 0.0210.0050.00338710.003387140.39<0.05
S P D 2 −0.0110.0070.00050610.00050620.96>0.05
F T P × F T M 0.0050.0070.00008310.0000833.43>0.05
F T P × S P D 0.0220.0070.00188310.00188378.05<0.05
F T M × S P D 0.0030.0070.00004210.0000421.75>0.05
Residual 0.00127770.000182
Lack of fit 0.00118030.00039316.31<0.05
Total 0.0167616
F T p : freezing temperature (°C); F T M : freezing time (min); S P D : speed (mm/min); V O E : volume of oil energy (kJ/mL); df: degrees of freedom; p-value < 0.05 means significant; p-value > 0.05 means non-significant; a: coefficient of determination (R2) = 0.92.
Publisher’s Note: MDPI stays neutral with regard to jurisdictional claims in published maps and institutional affiliations.

