Abstract
Composite sorbent materials (IL@MOF) with a metal-organic framework (MOF) ZIF-8 and [B(CN)4]−-based ionic liquids (ILs) were produced for the first time. Characterization results indicate the successful IL impregnation and conservation of the ZIF-8 crystalline structure and morphology. The data collected from the nitrogen (N2) physisorption at 77 K suggest that these IL@ZIF-8 materials are nonporous as their textural properties, such as BET specific surface area and total pore volume, are negligible. However, CO2, CH4, and N2 adsorption/desorption measurements in the IL@ZIF-8 composites at 303 and 273 K contradict the N2 data at 77 K, given that the obtained isotherms are Type I, typical of (micro)porous materials. Their gas adsorption capacity and ultramicroporous volume are in the same order of magnitude as the pristine microporous ZIF-8. The case study [C6MIM][B(CN)4] IL revealed a high affinity to both CO2 and CH4. This compromised the selectivity performance of its respective composite when compared with pristine ZIF-8. This work highlights the importance of accurate experimental gas adsorption/desorption equilibrium measurements to characterize the adsorption uptake and the porous nature of adsorbent materials.
1. Introduction
Developing new sorbent materials for carbon dioxide (CO2) capture/separation is vital for responding to global warming and its impacts [1,2]. Technologies like gas absorption, gas adsorption, membrane permeation, and chemical looping, among others, have been proposed for CO2 capture [3,4]. Different classes of materials have been considered for this purpose, such as ionic liquids (ILs) [5], metal-organic frameworks (MOFs) [6], covalent-organic frameworks (COFs) [7], or hybrid ultramicroporous materials (HUMs) [8]. In the last decade, the production of MOF-based composite materials for gas adsorption has been proposed [9]. Specifically, the incorporation of ILs into the structure of a MOF, named IL@MOF composite materials, has been studied [10]. In these studies, it is frequently assessed the CO2 separation from gaseous mixtures of topical interest that include methane (CH4) [11] or nitrogen (N2) [12] in their composition. Sorbent material properties like gas sorption capacity and selectivity performance are crucial to understanding the IL impact on the gaseous mixture separation compared to the pristine MOF. Ultimately, the desire is that IL impregnation creates a synergistic effect that improves both the CO2 uptake and selectivity of the composite material [10].
In a previous study by our group [13], different ILs were incorporated with the same molar loading into the structure of the MOF ZIF-8 to study their cation and anion effects and how ILs impact gas adsorption and selectivity of the material. All but one IL in their bulk phase absorb CO2 by physisorption, while [C2MIM][Ac] absorbs the gas by chemisorption. Two cyano-based ILs, namely [C6MIM][N(CN)2] and [C6MIM][C(CN)3], were used to produce IL@ZIF-8 composites, along with the fluorinated [C6MIM][NTf2]. High CO2 solubility has been reported for fluorinated ILs [14], although the cyano-based composites showed superior CO2 uptake between 0–16 bar than [C6MIM][NTf2]@ZIF-8.
Additionally, Carvalho et al. [15] compared the CO2 solubility of functionalized ILs with a generic n-alkane called eicosane. It was concluded that, in molality units, only cyano-based ILs containing the anion [B(CN)4]− showed superior CO2 solubility than eicosane. This means that, compared to a common and cheap n-alkane, only [B(CN)4]−-based ILs showed superior CO2 solubility. Another study by Zakrzewska and Nunes da Ponte [16] determined CO2 solubilities at 303.15 K for [C2MIM][B(CN)4] and [C6MIM][B(CN)4] between 0–190 bar. These solubilities were found to be comparable or even slightly superior to the ones found for [NTf2]−-based ILs. This indicates that [B(CN)4]−-based ILs have the potential to surpass the [NTf2]−-based ILs, which are commonly referred to in the literature as the best ILs for CO2 capture [17].
In this work, MOF ZIF-8 was impregnated for the first time with [CnMIM][B(CN)4] ILs, considering their proven high CO2 solubility, and the derived composites were fully studied. Different characterization techniques were employed to confirm the IL impregnation and to determine its impact on the crystalline structure, morphology, and textural properties of the produced composites, and ultimately on their sorption performance (with both cation and loading effects being studied). Complementary adsorption/desorption measurements of CO2, CH4, and N2 at 303 K and in a pressure range of 0–16 bar were obtained for the composites. The adsorption behavior of [CnMIM][B(CN)4]-based materials upon the adsorbates and temperatures studied should serve as a warning to researchers developing new composite materials for gas sorption applications.
2. Materials and Methods
2.1. Materials
The MOFs ZIF-8 (Basolite®Z1200) and MIL-53(Al) (Basolite®A100) were purchased from Sigma-Aldrich. The ILs 1-ethyl-3-methylimidazolium tetracyanoborate ([C2MIM][B(CN)4], ≥99.5%) and 1-hexyl-3-methylimidazolium tetracyanoborate ([C6MIM][B(CN)4], ≥98.0%) were acquired from Merck. The IL 1-hexyl-3-methylimidazolium tetrafluoroborate ([C6MIM][BF4], 99.0%) was purchased from IoLiTec GmbH. Acetone (99.8%, Carlo Erba) was used for IL dissolution before MOF impregnation. Potassium bromide (KBr; Panreac) was used to prepare the FT-IR tablets. Finally, the gases used in the adsorption/desorption equilibrium measurements, namely, N2 (>99.998%), CH4 (>99.95%), CO2 (99.998%), and He (≥99.999%), were supplied by Air Liquide.
2.2. Samples Preparation
The protocol developed previously for IL@MOF materials production can be found elsewhere [13]. Briefly, 0.45 mmol of IL, vacuumed at 0.1 Pa and 323 K for at least 24 h, was weighed and dissolved in 10 mL of acetone. This IL quantity was applied in all but one composite produced for this work (generically named herein as IL@ZIF-8 (low)). For the composite named [C6MIM][B(CN)4]@ZIF-8 (high), an IL amount of 1.10 mmol was used instead. The IL solution was stirred at room temperature for 15 min. Then, 1 g of ZIF-8 (degassed for 4 h at 373 K) was weighed, and the IL solution was added to the MOF vial. The mixture was then capped and stirred overnight. Afterwards, the cap was removed and to promote acetone evaporation, samples were dried for 4 h at room temperature and then at 338 K. A final degassing step at 373 K was performed for 4 h to remove any traces of volatile components.
2.3. Samples Characterization
2.3.1. Fourier Transform Infrared (FT-IR) Spectroscopy
Infrared spectra of the materials were obtained at room temperature conditions, between 4000 and 450 cm−1 (spectral resolution of 4 cm−1), with a FT-IR Spectrometer Spectrum Two model (PerkinElmer). For neat ILs, an Attenuated Total Reflectance (ATR) modulus was used. For solid samples (ZIF-8 and IL@ZIF-8 composites), spectra were acquired with a Transmittance modulus. In this case, KBr tablets were produced containing some milligrams of solid sample.
2.3.2. Powder X-ray Diffraction (PXRD)
The PXRD diffractograms of the materials were obtained using a MiniFlex II diffractometer (Rigaku), with an X-ray generator of 30 kV voltage and 15 mA current. A copper radiation source was used (radiation wavelength of 1.5406 Å), and analyses were run between 2θ values of 2°and 50° (0.02° step).
2.3.3. Scanning Electron Microscopy (SEM)
SEM micrographs of the materials were obtained with a Zeiss Auriga CrossBeam Workstation SEM-FIB equipment (×50k magnification). To obtain high-quality SEM images, the materials were covered with a layer of gold prior to the analysis.
2.3.4. Textural Properties of ZIF-8 and IL@ZIF-8 Composites
To determine the textural properties of the produced composites, N2 adsorption/desorption isotherms of the materials were obtained at 77 K with a static volumetric apparatus ASAP 2010 (Accelerated Surface Area and Porosimetry System, Micromeritics). Before each measurement, the material was degassed under vacuum for 4 h at 373 K. Different textural properties of the materials, including total pore volume (Vp) and specific BET surface area (ABET), were determined using the BET volumetric method assuming multilayer formation on the solid surface [18,19]. The Dubinin-Radushkevich (D-R) equation [18] was applied to the CO2 adsorption/desorption data at 273 K (considering points between 0–1 bar) to determine the volume of narrow micropores/ultramicropores (Vo), which are pores with a size below 7 Å [19,20,21].
2.4. Gas Adsorption/Desorption Equilibrium Measurements
Adsorption/desorption equilibrium isotherms of CO2, CH4, and N2 were experimentally measured using a fully established standard static gravimetric method, at 303 K and in a pressure range of 0–16 bar [13,22]. For the same pressure range, CO2 isotherms were also obtained at 273 K for both ZIF-8 and the composite [C6MIM][B(CN)4]@ZIF-8 (low).
The main feature of this gravimetric unit is a high accuracy ISOSORP 2000 magnetic-suspension balance (Rubotherm GmbH). About 0.3–0.4 g of the material of interest was used for the measurements. Despite the external degassing of the samples, an in situ degassing was also performed under vacuum at 373 K for 4 h to ensure that the materials were free from moisture or other sorbed impurities. Finally, the temperature was allowed to stabilize to the desired value (273 or 303 K) for the measurements to start. In this work, replicate measurements were done to check data reproducibility. Further details concerning the gravimetric apparatus and methodology employed in the measurements can be found elsewhere [13,22,23,24].
It should be noted that "adsorption" is the prevalent phenomenon in the produced composites, as the quantity of MOF used is much higher than the IL mass itself. This term is used interchangeably herein with the technically correct term "sorption", which encompasses both gas adsorption and absorption phenomena.
The adsorbed amount of a gas can be expressed in different quantities (net, excess, or total). For a gravimetric experiment, and using mole of adsorbed gas per unit mass of adsorbent, the adsorbed amount can be expressed using a net adsorption quantity [25]:
where m is the registered weighed mass, ms is the mass of (degassed) adsorbent material, mh and Vh are the total mass and volume of all the physical parts of the sample holder contributing to buoyancy effects, respectively. Also, ρg is the density of the gas at the equilibrium pressure and temperature, and Mw is the molecular weight of the adsorbed gas. Reporting in net quantity avoids drawbacks regarding using probe molecules to determine the reference state. Nevertheless, most adsorption studies report total adsorption quantity (qt) data. For this purpose, our group usually considers the total pore volume of the material as an approximation to the volume of the adsorbed phase, which cannot be experimentally determined
where Vp is the total pore volume of the material [22]. However, for this work, it was assumed to use the excess adsorption quantity (qexc)
where ρs is the solid matrix density of the material. This density was determined by helium (He) pycnometry.
Isotherms were fitted using the Sips adsorption isotherm model [18]
in which qs is the saturation adsorbed quantity, b is an affinity constant, and n is the system heterogeneity constant.
With these fittings, ideal CO2/CH4 and CO2/N2 selectivities were determined by
considering an equimolar composition, as well as biogas (40:60 vol.% CO2/CH4) [26] and flue gas (15:85 vol.% CO2/N2) [27] compositions.
3. Results and Discussion
3.1. Fourier Transform Infrared (FT-IR) Spectroscopy
Infrared spectroscopy was used to confirm the impregnation of [C6MIM][B(CN)4] into the structure of ZIF-8. Spectra of the neat IL, MOF, and IL@MOF composite were obtained, as shown in Figure 1. A weak IL-related band can be observed in the [C6MIM][B(CN)4]@ZIF-8 (low) spectrum at about 2223 cm−1 (see graph inset), which is related to the C≡N bond found in the IL anion [28]. This confirms the success of the IL impregnation method.
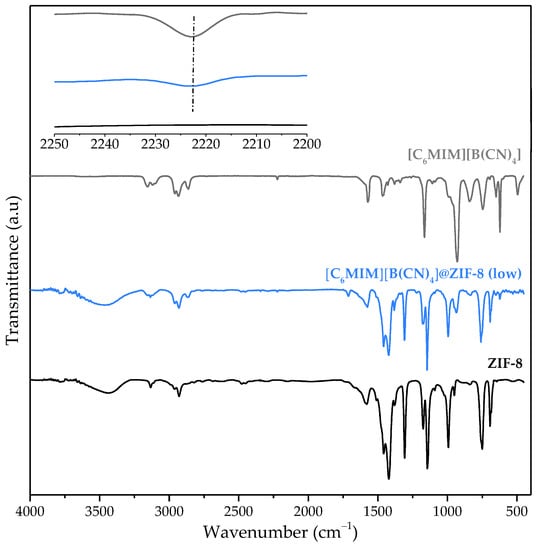
Figure 1.
Infrared spectra of neat [C6MIM][B(CN)4], [C6MIM][B(CN)4]@ZIF-8 (low) and pristine ZIF-8 (the inset details the spectra between 2250 and 2200 cm−1).
3.2. Powder X-ray Diffraction (PXRD)
The PXRD diffractograms of ZIF-8 and [C6MIM][B(CN)4]@ZIF-8 (low), shown in Figure 2, reveal that all the pristine MOF peaks were well-preserved, as they can be found in the composite diffractogram. This means that the IL impregnation does not compromise the MOF structure and that the produced IL@ZIF-8 material is also crystalline. The composites produced in our previous study [13] were also crystalline materials.
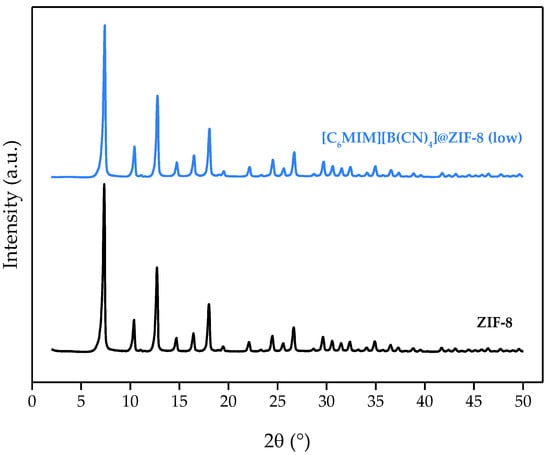
Figure 2.
PXRD diffractograms of [C6MIM][B(CN)4]@ZIF-8 (low) and pristine ZIF-8.
3.3. Scanning Electron Microscopy (SEM)
SEM images were obtained to confirm that the IL impregnation did not significantly affect the morphology of the MOF. As observed in Figure 3, both ZIF-8 and [C6MIM][B(CN)4]@ZIF-8 (low) show similar surface morphologies. It appears that the composite particles are slightly rounder than the ZIF-8 ones [13]. This is due to the presence of the IL in the structure along with the IL impregnation method itself, which uses high rotation speeds. This fact generates particles collisions that can round their edges. The composite SEM image shows that no excess IL is outside the MOF structure, although there will be a loading where the IL entirely blocks the MOF pores, and the textural properties will have negligible values [11].
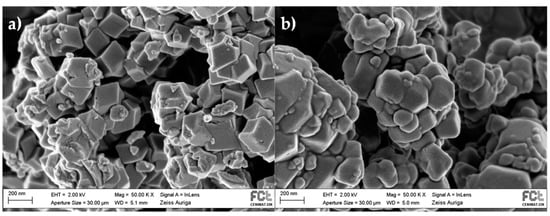
Figure 3.
SEM micrographs (×50k magnification) of: (a) ZIF-8; and (b) [C6MIM][B(CN)4]@ZIF-8 (low).
3.4. Textural Properties of ZIF-8 and IL@ZIF-8 Composites
Up until this point, all the characterization results for [C6MIM][B(CN)4]@ZIF-8 (low) are similar to the other composites previously reported with the same IL molar loading [13]. However, the N2 adsorption/desorption isotherm at 77 K for this material was unexpected. As observed in Figure 4, a Type II isotherm was obtained for this composite (according to IUPAC classification [19]). This result suggests that [C6MIM][B(CN)4]@ZIF-8 (low) is a nonporous material as the intrusion of N2 at 77 K is very low. It should be noted that Type II isotherms are also typical of macroporous materials, but this is not the case as the N2 adsorbed amount is very low. This explains the very low total pore volume (obtained at a relative pressure of 0.95) and BET specific surface area of this composite, shown in Table 1. By contrast, pristine ZIF-8 presented a Type I isotherm, typical of microporous materials. It should be noted that, in our previous study [13], IL@ZIF-8 composites showed Type I isotherms for N2 at 77 K and, consequently, significant textural properties for gas sorption applications.
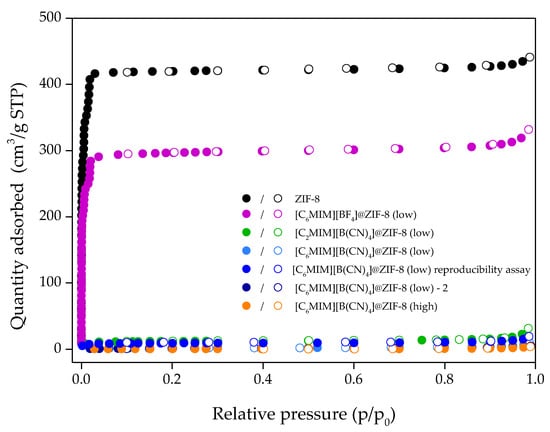
Figure 4.
N2 adsorption/desorption equilibrium isotherms at 77 K of ZIF-8, [C6MIM][BF4]@ZIF-8 (low) and different [CnMIM][B(CN)4]@ZIF-8 composites. Closed and open symbols denote the adsorption and desorption data, respectively.

Table 1.
Total pore volume (Vp), BET specific surface area (ABET), solid matrix density (ρs), and IL mass loading obtained for ZIF-8 and the various IL@ZIF-8 composites. Both Vp and ABET were calculated from N2 adsorption/desorption data at 77 K, while ρs was obtained from He pycnometry at 333 K.
A different sample from this batch was used for a reproducibility assay to exclude possible poor IL dispersion during the preparation of the composite material. As observed in Figure 4 and Table 1, it also showed very low N2 adsorption, which translates into very poor textural properties for a potential adsorbent for gas adsorption applications. No hysteresis was found, which indicates the materials are completely reversible regarding N2 adsorption at 77 K.
The composite [C6MIM][BF4]@ZIF-8 (low) was then produced, given that it contains the similar [BF4]− anion. It presented a Type I isotherm like that of ZIF-8 and significant textural properties as observed in Table 1. This seems to indicate that whatever phenomenon is happening at 77 K with N2, it is associated with the [B(CN)4]− anion of the IL.
A second batch of the case-study composite was produced for reproducibility check and named as [C6MIM][B(CN)4]@ZIF-8 (low)—2. Concerning N2 adsorption/desorption at 77 K, as shown in Figure 4 and Table 1, it also presented a Type II isotherm and similar textural properties to the first batch. Additional composites [C2MIM][B(CN)4]@ZIF-8 (low) and [C6MIM][B(CN)4]@ZIF-8 (high) were produced to study the cation and loading effects, respectively. As observed in Figure 4 and Table 1, these two materials also showed Type II isotherms and very low textural properties.
The textural characterization of MOFs that can show some flexibility, breathing, or gating effects should be taken with care regarding the analysis of their N2 adsorption/desorption isotherms at 77 K. Studies on MOFs like zeolitic imidazolate frameworks (ZIFs) emphasize that ZIF-8 exhibits a “swing effect”, i.e., some flexibility of its framework in the form of a torsional motion of its imidazolate linkers [29]. Molecules larger than the ZIF-8 geometric window size (~3.4 Å) can diffuse through the ZIF-8 framework, a fact that is attributed to the flexibility of the structure. Moreover, ZIF-8 has large cavities interconnected by narrow windows (~11.6 Å of diameter) [30]. These material structural effects and their phase transition between metastable phases can modify the diffusivity of gases through the porous network, and to some extent can influence the N2 adsorption isotherm (at 77 K) and consequently the BET surface area and pore size distribution calculations. Nonetheless, these effects are not seen in the results obtained for pristine ZIF-8. In fact, the interaction of the IL basic anion [B(CN)4]− with the imidazolate linker of ZIF-8 seems to tune the material flexibility effect and directly affect the N2 diffusivity through the porous network, which reveals having an impact on the performance of ZIF-8 upon N2 adsorption at 77 K. It is reported that regarding CO2, [B(CN)4]−-based ILs display an enhanced ability to dissolve CO2 which can be based on weak cation-anion interactions of the ionic liquid [15,16]. However, a deeper understanding of the CO2 solvation in [B(CN)4]− based ILs is required, as this could open an explanation for the uptake behavior on their derived MOF composites and the textural properties of those materials.
To see whether this phenomenon happens in another MOF, the IL [C6MIM][B(CN)4] was impregnated into commercial MIL-53(Al). As shown in Figure 5, the composite has a similar isotherm shape but lower N2 uptake at 77 K when compared with the pristine MIL-53(Al). This meant total pore volume and BET specific surface areas losses of 35% and 61%, respectively. These textural property losses are similar to those obtained in our previous study [13], which considered cations and anions of different nature and size. The composite [C6MIM][B(CN)4]@MIL-53(Al) (low) showed significant textural properties as a potential adsorbent, by contrast with [C6MIM][B(CN)4]@ZIF-8 (low). Therefore the behavior of [CnMIM][B(CN)4]@ZIF-8 composites upon N2 adsorption at 77 K and respective textural properties are exclusive of this system, explained by specific [C6MIM][B(CN)4] interactions with ZIF-8 after impregnation.
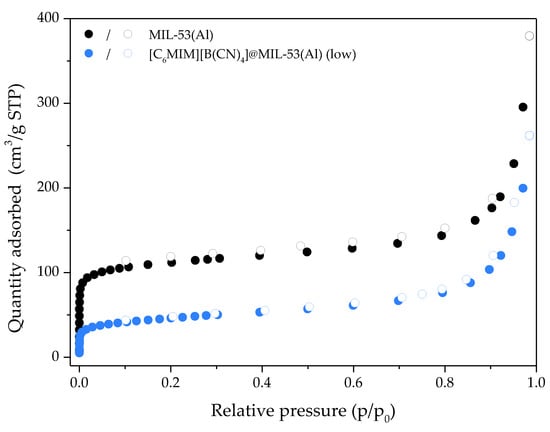
Figure 5.
N2 adsorption/desorption equilibrium isotherms at 77 K of MIL-53(Al) and [C6MIM][B(CN)4]@MIL-53(Al) (low). Closed and open symbols denote the adsorption and desorption data, respectively.
3.5. Gas Adsorption/Desorption Equilibrium Measurements
Solely considering the N2 adsorption/desorption data at 77 K, the produced [CnMIM][B(CN)4]@ZIF-8 composites would never be considered as potential adsorbents for gas sorption applications as they show very low textural properties. However, previous literature [15,16] indicated that [CnMIM][B(CN)4] ILs should show affinity towards CO2. Figure 6 shows Type I CO2 adsorption/desorption isotherms at 303 K for the pristine ZIF-8 and the produced [CnMIM][B(CN)4]@ZIF-8 materials. The composites showed inferior but significant CO2 uptake compared to ZIF-8 due to the IL pore occupation/blockage. Type I isotherms were not expected of these materials, considering the N2 at 77 K data. The collected gas adsorption/desorption for all materials herein can be found in Tables S1–S4 of the Supporting Information.
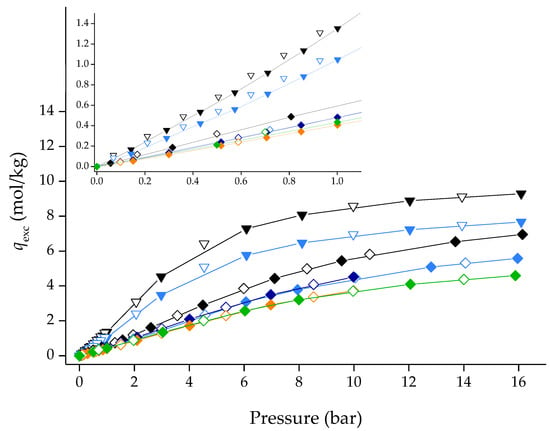
Figure 6.
CO2 adsorption/desorption equilibrium isotherms at 273 K (inverted triangles) and 303 K (diamonds) for ZIF-8 and [CnMIM][B(CN)4]@ZIF-8 composites. Inset for the low-pressure region is highlighted. Closed and open symbols denote the adsorption and desorption data, respectively. Lines are guides to the eye. Symbols: ▼/▽ ZIF-8_273 K; ▼/▽ [C6MIM][B(CN)4]@ZIF-8 (low)_273 K; ◆/◇ ZIF-8_303 K; ◆/◇ [C6MIM][B(CN)4]@ZIF-8 (low)_303 K; ◆/◇ [C6MIM][B(CN)4]@ZIF-8 (low)-2_303 K; ◆/◇ [C2MIM][B(CN)4]@ZIF-8 (low)_303 K; ◆/◇ [C6MIM][B(CN)4]@ZIF-8 (high)_303 K.
The composites produced herein also adsorb in the same order of magnitude as the ones in our previous work [13], which also showed that for [CnMIM][NTf2]@ZIF-8, the shorter the side-alkyl chain, the more the composite would adsorb. Interestingly, for [CnMIM][[B(CN)4]@ZIF-8 composites, the reverse tendency is herein observed. Desorption data indicate that the materials show reversibility, as the desorption branch overlaps the adsorption one (no exhibited hysteresis).
Figure 6 also shows the CO2 adsorption/desorption equilibrium isotherms of pristine ZIF-8 and [C6MIM][B(CN)4]@ZIF-8 (low) at 273 K. By applying the Dubinin-Radushkevich equation to the adsorption/desorption data between 0–1 bar [20,21], it was possible to calculate the ultramicropore volume (Vo) of the two materials. The calculated ultramicropore volume of pristine ZIF-8 and [C6MIM][B(CN)4]@ZIF-8 (low) was 0.283 and 0.227 cm3/g, respectively. Clearly, and in contrast with the results from N2 adsorption at 77 K, CO2 data at 273 K indicates that [C6MIM][B(CN)4]@ZIF-8 (low) has a microporous nature and, consequently, more significant textural properties than previously determined.
Given that [C6MIM][B(CN)4]@ZIF-8 (low) has Type I isotherms for CO2, adsorption/desorption, isotherms of CH4 and N2 were also measured at 303 K for this material and the pristine ZIF-8. As shown in Figure 7, the composite material showed Type I isotherms and gas uptake in the same order of magnitude as those found for ZIF-8. This was notably unexpected for N2; considering that adsorption is favored by low temperatures, [C6MIM][B(CN)4]@ZIF-8 (low) should not adsorb this gas at 303 K.
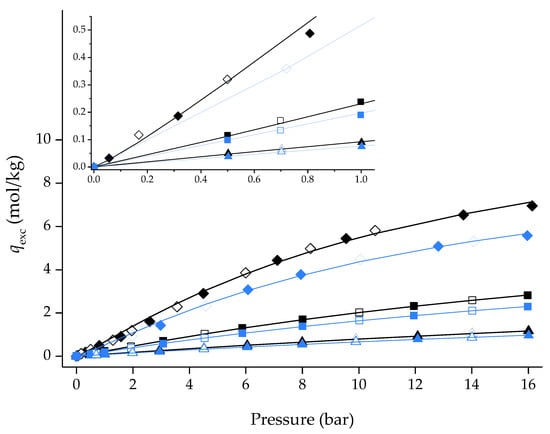
Figure 7.
CO2, CH4 and N2 adsorption/desorption equilibrium isotherms at 303 K for ZIF-8 and [C6MIM][B(CN)4]@ZIF-8 (low) composite (with an inset for the low-pressure region). Closed and open symbols denote the adsorption and desorption data, respectively. Lines represent the Sips adsorption isotherm model fitting [18] to the experimental points. Symbols: ◆/◇ ZIF-8_CO2; ◆/◇ [C6MIM][B(CN)4]@ZIF-8 (low)_CO2; ◼/☐ ZIF-8_CH4; ◼/☐ [C6MIM][B(CN)4]@ZIF-8 (low)_CH4; ▲/△ ZIF-8_N2; ▲/△ [C6MIM][B(CN)4]@ZIF-8 (low)_N2.
A reasonable explanation for the N2 adsorption/desorption data at 77 K could be that the IL is significantly outside the pores and completely blocks the gas from entering the porous volume of the MOF, though this is not verified in the SEM micrographs presented in Figure 3. An IL-free basis was considered for [C6MIM][[B(CN)4]@ZIF-8 (low) adsorption/desorption data at 303 K by normalizing the adsorbed quantity per unit mass of ZIF-8. In an IL-free basis, the composite isotherms should overlap the pristine ZIF-8 ones unless the IL affects the gas uptake (i.e., change the sorption site’s nature). This is not verified, as shown in Figure 8, which indicates the IL influences the adsorption capacity of the composite material. By contrast, in our previous study [13], the IL [P6 6 6 14][NTf2] was used to incorporate ZIF-8 with the same molar loading used herein. In an IL-free structure, the produced composite overlapped the ZIF-8 isotherms. According to molecular simulations studies [31], this IL essentially cannot enter the ZIF-8 porous structure. This means that only ILs found mostly outside the MOF structure will have IL-free isotherms like the original MOF. Considering this relationship, [C6MIM][B(CN)4] is inside the ZIF-8 structure, which agrees with the SEM micrographs previously shown.
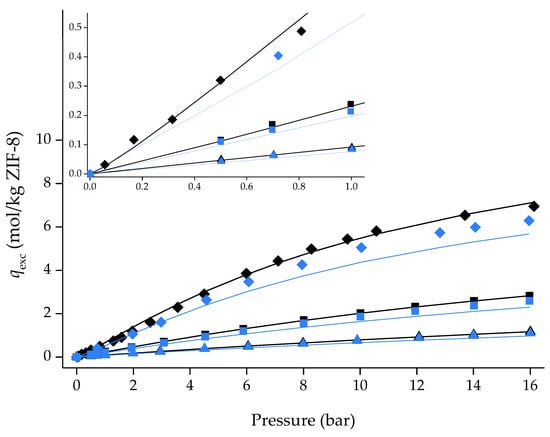
Figure 8.
Single-component adsorption/desorption equilibrium isotherms of CO2, CH4, and N2 on an IL-free basis in pristine ZIF-8 and [C6MIM][B(CN)4]@ZIF-8 (low) at 303 K. Symbols denote both adsorption and desorption data. Lines represent the Sips adsorption isotherm model fitting the experimental non-IL-free data points. Symbols: ◆ ZIF-8_CO2; ◆ [C6MIM][B(CN)4]@ZIF-8 (low)_CO2; ◼ ZIF-8_CH4; ◼ [C6MIM][B(CN)4]@ZIF-8 (low)_CH4; ▲ ZIF-8_N2; ▲ [C6MIM][B(CN)4]@ZIF-8 (low)_N2.
Ideal CO2/CH4 and CO2/N2 selectivities were determined for both pristine ZIF-8 and [C6MIM][B(CN)4]@ZIF-8 (low). Table 2 shows the obtained parameters and the average relative error (ARE) of the Sips global fitting. The qs values for both materials follow the order of less adsorbed gas to most adsorbed (N2 < CH4 < CO2). Due to its higher gas uptakes, ZIF-8 shows higher qs values than its derived composite. Parameter b is also in the expected order for both materials. Gases with higher affinity for the adsorbent are more adsorbed, so the affinity parameter should, and in this case does follow the least to most adsorbed gas order. Finally, the values of parameter n are near or slightly below 1, which indicates homogeneous adsorbent-adsorbate systems.

Table 2.
Sips model fitting parameters for N2, CH4, and CO2 on ZIF-8 and [C6MIM][B(CN)4]@ZIF-8 (low).
The obtained ideal selectivities for ZIF-8 and [C6MIM][B(CN)4]@ZIF-8 (low) are shown in Figure 9. The composite shows inferior selectivity performance than the pristine ZIF-8, for all types of gaseous mixtures and compositions, in the entire pressure range. In our previous study [13], practically all the produced IL@ZIF-8 composites developed with the same IL molar loading as [C6MIM][B(CN)4]@ZIF-8 (low) were more selective than ZIF-8, between 0–1 bar (i.e., adsorbent-adsorbate interactions prevail over the available pore volume in this pressure range). It is not possible to directly compare selectivities between composites, as the adsorption quantity used in that study (qt) is different from the ones used herein (qexc).
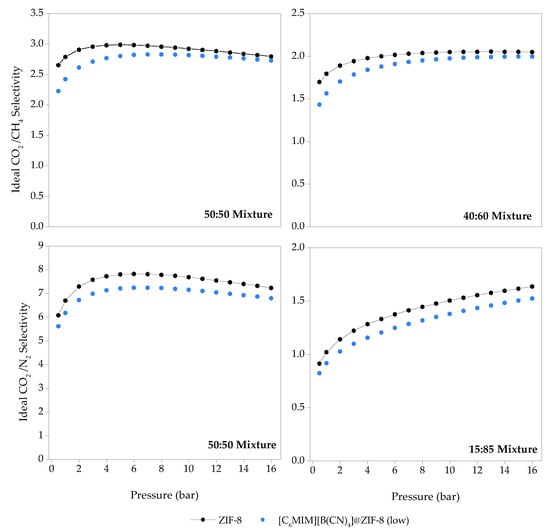
Figure 9.
Ideal CO2/CH4 and CO2/N2 selectivities for the pristine ZIF-8 and [C6MIM][B(CN)4]@ZIF-8 (low) as a function of total pressure, determined from the Sips isotherm model fitting of the single-component adsorption/desorption isotherms, measured at 303 K and in the pressure range of 0.5–16 bar.
Nevertheless, it is possible to compare the CO2 and CH4 adsorption/desorption equilibrium isotherms in excess quantities, qexc. As observed in Figure 10 and Figure 11, [C6MIM][B(CN)4]@ZIF-8 (low) is the second-best composite in terms of gas adsorption capacity, only falling behind [C2MIM][Ac]@ZIF-8, a composite containing a chemisorption-character IL. The CO2 affinity of the [C6MIM][B(CN)4] IL is particularly notorious at high pressure, given that its respective composite almost matches [C2MIM][Ac]@ZIF-8. Surprisingly, [C6MIM][B(CN)4]@ZIF-8 (low) also shows a strong affinity towards CH4 in the entire pressure range. Considering this result and the fact that the calculated ideal selectivities of this composite were inferior to the pristine ZIF-8, it can be assumed that the [C6MIM][B(CN)4] IL will show higher N2 affinity when compared with the other physisorption-character ILs.
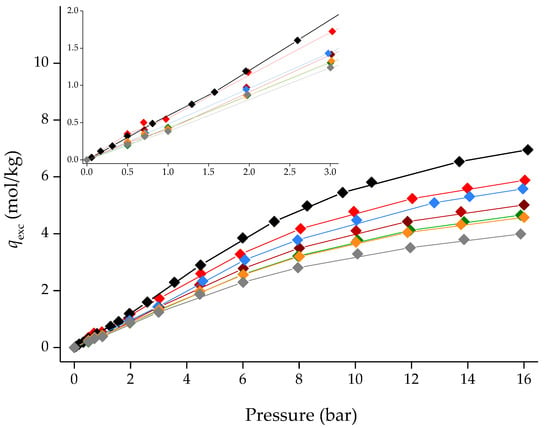
Figure 10.
CO2 adsorption/desorption equilibrium isotherms for ZIF-8 and different IL@ZIF-8 composites containing the same IL molar loading at 303 K. Symbols denote both adsorption and desorption data, respectively. Lines are guides to the eye. Symbols: ◆ ZIF-8; [C6MIM][B(CN)4]@ZIF-8 (low); ◆ [C2MIM][Ac]@ZIF-8 ([13]); ◆ [C6MIM][B(CN)4]@ZIF-8 (low); ◆ [C6MIM][Cl]@ZIF-8 ([13]); ◆ [C6MIM][C(CN)3]@ZIF-8 ([13]); ◆ [C6MIM][N(CN)2]@ZIF-8 ([13]) and ◆ [C6MIM][NTf2]@ZIF-8 ([13]).
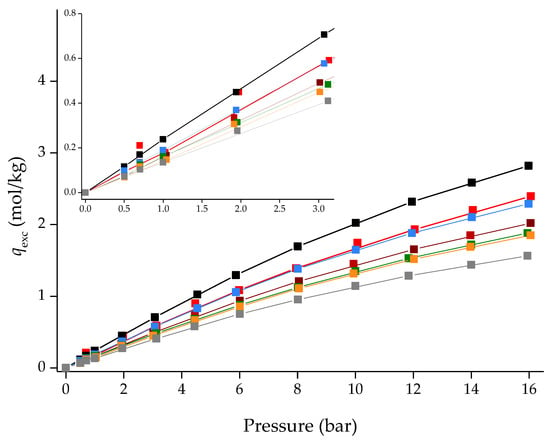
Figure 11.
CH4 adsorption/desorption equilibrium isotherms for ZIF-8 and different IL@ZIF-8 composites containing the same IL molar loading at 303 K. Symbols denote both adsorption and desorption data, respectively. Lines are guides to the eye.Symbols: ◼ ZIF-8; [C6MIM][B(CN)4]@ZIF-8 (low); ◼ [C2MIM][Ac]@ZIF-8 ([13]); ◼ [C6MIM][B(CN)4]@ZIF-8 (low); ◼ [C6MIM][Cl]@ZIF-8 ([13]); ◼ [C6MIM][C(CN)3]@ZIF-8 ([13]); ◼ [C6MIM][N(CN)2]@ZIF-8 ([13]) and ◼ [C6MIM][NTf2]@ZIF-8 ([13]).
4. Conclusions
In this work, different [CnMIM][[B(CN)4]@ZIF-8 composites were produced to determine their potential for CO2 capture/separation. Characterization techniques of the case study [C6MIM][B(CN)4]@ZIF-8 (low) composite confirmed the incorporation of the IL into the structure of the MOF, and that the impregnation did not significantly alter the crystalline structure and morphology of ZIF-8. Unexpected results regarding the textural properties of this and other [CnMIM][[B(CN)4]@ZIF-8 composites were obtained from N2 adsorption/desorption data at 77 K, which indicated that the materials were nonporous. However, gas adsorption isotherms measured at 303 K (and 273 K) indicate that [CnMIM][[B(CN)4]@ZIF-8 composites are microporous, with the potential to be used as sorbents for gas separation/capture applications by adsorption. The authors would like to point out the importance of completely ascertaining the porous nature of the produced IL@MOF materials. Nonporous materials determined by N2 adsorption/desorption equilibrium at 77 K should not be immediately ruled as unsatisfactory materials and have their adsorption capacity/porous nature further tested with closer-to-room-temperature measurements.
Ideal selectivities were calculated for [C6MIM][B(CN)4]@ZIF-8 (low) from the obtained CO2, CH4, and N2 adsorption/desorption equilibrium isotherms. When compared to the pristine ZIF-8, the composite showed inferior selectivity performance. Comparisons drawn with composites produced in a previous study indicate that indeed [C6MIM][B(CN)4 shows enhanced affinity for CO2, but also towards CH4 (and likely N2) when compared with other physisorption ILs. This explains the low selectivities of the [C6MIM][B(CN)4]@ZIF-8 (low) composite.
Supplementary Materials
The following are available online at https://www.mdpi.com/article/10.3390/pr10020247/s1, Table S1: CO2, CH4 and N2 adsorption-desorption equilibrium data at 303 K for pristine ZIF-8, Table S2: CO2, CH4 and N2 adsorption-desorption equilibrium data at 303 K for [C6MIM][B(CN)4]@ZIF-8 (low), Table S3: CO2 adsorption-desorption equilibrium data at 303 K for [CnMIM][B(CN)4]@ZIF-8 materials, Table S4: CO2 adsorption-desorption equilibrium data at 273 K for pristine ZIF-8 and [C6MIM][B(CN)4]@ZIF-8 (low).
Author Contributions
Conceptualization, I.A.A.C.E. and J.M.S.S.E.; methodology, I.A.A.C.E., J.M.S.S.E., T.J.F. and L.M.E.; validation, T.J.F. and L.M.E.; formal analysis, T.J.F., L.M.E., I.A.A.C.E. and J.M.S.S.E.; investigation, T.J.F. and L.M.E.; writing—original draft preparation, T.J.F.; writing—review and editing, I.A.A.C.E., J.M.S.S.E., T.J.F. and L.M.E.; supervision, I.A.A.C.E. and J.M.S.S.E.; funding acquisition, I.A.A.C.E. and J.M.S.S.E. All authors have read and agreed to the published version of the manuscript.
Funding
The authors acknowledge “Fundação para a Ciência e Tecnologia” through the PhD grant SFRH/BD/139627/2018 (T. J. Ferreira). This work was also supported by the Associate Laboratory for Green Chemistry-LAQV (Portugal), which is financed by national funds from FCT/MCTES (UIDB/50006/2020, UIDP/50006/2020, and LA/P/0008/2020), and projects PTDC/CTM-CTM/30326/2017 and IF/01016/2014.
Institutional Review Board Statement
Not applicable.
Informed Consent Statement
Not applicable.
Data Availability Statement
Data is contained in the article and respective Supporting Information.
Conflicts of Interest
The authors declare no conflict of interest.
References
- Solomon, S.; Plattner, G.-K.; Knutti, R.; Friedlingstein, P. Irreversible climate change due to carbon dioxide emissions. Proc. Natl. Acad. Sci. USA 2009, 106, 1704–1709. [Google Scholar] [CrossRef] [PubMed] [Green Version]
- IPCC. Climate Change 2013: The Physical Science Basis. Contribution of Working Group I to the Fifth Assessment Report of the Intergovernmental Panel on Climate Change; IPCC: Cambridge, UK, 2013. [Google Scholar]
- Sifat, N.S.; Haseli, Y. A critical review of CO2 capture technologies and prospects for clean power generation. Energies 2019, 12, 4143. [Google Scholar] [CrossRef] [Green Version]
- Budinis, S.; Krevor, S.; Dowell, N.M.; Brandon, N.; Hawkes, A. An assessment of CCS costs, barriers and potential. Energy Strateg. Rev. 2018, 22, 61–81. [Google Scholar] [CrossRef]
- Aghaie, M.; Rezaei, N.; Zendehboudi, S. A systematic review on CO2 capture with ionic liquids: Current status and future prospects. Renew. Sustain. Energy Rev. 2018, 96, 502–525. [Google Scholar] [CrossRef]
- Aniruddha, R.; Sreedhar, I.; Reddy, B.M. MOFs in carbon capture-past, present and future. J. CO2 Util. 2020, 42, 101297. [Google Scholar] [CrossRef]
- Ozdemir, J.; Mosleh, I.; Abolhassani, M.; Greenlee, L.F.; Beitle, R.R., Jr.; Beyzavi, M.H. Covalent Organic Frameworks for the Capture, Fixation, or Reduction of CO2. Front. Energy Res. 2019, 7, 77. [Google Scholar] [CrossRef] [Green Version]
- Mukherjee, S.; Sikdar, N.; O’Nolan, D.; Franz, D.M.; Gascón, V.; Kumar, A.; Kumar, N.; Scott, H.S.; Madden, D.G.; Kruger, P.E.; et al. Trace CO2 capture by an ultramicroporous physisorbent with low water affinity. Sci. Adv. 2019, 5, eaax9171. [Google Scholar] [CrossRef] [Green Version]
- Ahmed, I.; Jhung, S.H. Composites of metal-organic frameworks: Preparation and application in adsorption. Mater. Today 2014, 17, 136–146. [Google Scholar] [CrossRef]
- Cota, I.; Fernandez Martinez, F. Recent advances in the synthesis and applications of metal organic frameworks doped with ionic liquids for CO2 adsorption. Coord. Chem. Rev. 2017, 351, 189–204. [Google Scholar] [CrossRef]
- Zeeshan, M.; Nozari, V.; Yagci, M.B.; Isık, T.; Unal, U.; Ortalan, V.; Keskin, S.; Uzun, A. Core−Shell Type Ionic Liquid/Metal Organic Framework Composite: An Exceptionally High CO2/CH4 Selectivity. J. Am. Chem. Soc. 2018, 140, 10113–10116. [Google Scholar] [CrossRef] [Green Version]
- Mohamedali, M.; Ibrahim, H.; Henni, A. Incorporation of acetate-based ionic liquids into a zeolitic imidazolate framework (ZIF-8) as efficient sorbents for carbon dioxide capture. Chem. Eng. J. 2018, 334, 817–828. [Google Scholar] [CrossRef]
- Ferreira, T.J.; Ribeiro, R.P.P.L.; Mota, J.P.B.; Rebelo, L.P.N.; Esperança, J.M.S.S.; Esteves, I.A.A.C. Ionic Liquid-Impregnated Metal-Organic Frameworks for CO2/CH4 Separation. ACS Appl. Nano Mater. 2019, 2, 7933–7950. [Google Scholar] [CrossRef]
- Amiri, N.; Benyounes, H.; Lounis, Z.; Shen, W. Design of absorption process for CO2 capture using cyano based anion ionic liquid. Chem. Eng. Res. Des. 2021, 169, 239–249. [Google Scholar] [CrossRef]
- Carvalho, P.J.; Kurnia, K.A.; Coutinho, J.A.P. Dispelling some myths about the CO2 solubility in ionic liquids. Phys. Chem. Chem. Phys. 2016, 18, 14757–14771. [Google Scholar] [CrossRef]
- Zakrzewska, M.E.; Nunes da Ponte, M. Volumetric and phase behaviour of mixtures of tetracyanoborate-based ionic liquids with high pressure carbon dioxide. J. Supercrit. Fluids 2016, 113, 31–38. [Google Scholar] [CrossRef]
- Hasib-ur-Rahman, M.; Siaj, M.; Larachi, F. Ionic liquids for CO2 capture-Development and progress. Chem. Eng. Process. Process Intensif. 2010, 49, 313–322. [Google Scholar] [CrossRef]
- Do, D.D. Adsorption Analysis: Equilibria and Kinetics; Imperial College Press: London, UK, 1998. [Google Scholar]
- Thommes, M.; Kaneko, K.; Neimark, A.V.; Olivier, J.P.; Rodriguez-Reinoso, F.; Rouquerol, J.; Sing, K.S.W. Physisorption of gases, with special reference to the evaluation of surface area and pore size distribution (IUPAC Technical Report). Pure Appl. Chem. 2015, 87, 1051–1069. [Google Scholar] [CrossRef] [Green Version]
- Lozano-Castelló, D.; Cazorla-Amorós, D.; Linares-Solano, A. Usefulness of CO2 adsorption at 273 K for the characterization of porous carbons. Carbon N. Y. 2004, 42, 1233–1242. [Google Scholar] [CrossRef]
- Sevilla, M.; Fuertes, A.B. Sustainable porous carbons with a superior performance for CO2 capture. Energy Environ. Sci. 2011, 4, 1765–1771. [Google Scholar] [CrossRef] [Green Version]
- Esteves, I.A.A.C.; Lopes, M.S.S.; Nunes, P.M.C.; Mota, J.P.B. Adsorption of natural gas and biogas components on activated carbon. Sep. Purif. Technol. 2008, 62, 281–296. [Google Scholar] [CrossRef]
- Camacho, B.C.R.; Ribeiro, R.P.P.L.; Esteves, I.A.A.C.; Mota, J.P.B. Adsorption equilibrium of carbon dioxide and nitrogen on the MIL-53 (Al) metal organic framework. Sep. Purif. Technol. 2015, 141, 150–159. [Google Scholar] [CrossRef]
- Ferreira, T.J.; Vera, A.T.; de Moura, B.A.; Esteves, L.M.; Tariq, M.; Esperança, J.M.S.S.; Esteves, I.A.A.C. Paramagnetic Ionic Liquid/Metal Organic Framework Composites for CO2/CH4 and CO2/N2 Separations. Front. Chem. 2020, 8, 590191. [Google Scholar] [CrossRef] [PubMed]
- Gumma, S.; Talu, O. Net Adsorption: A Thermodynamic Framework for Supercritical Gas Adsorption and Storage in Porous Solids. Langmuir 2010, 26, 17013–17023. [Google Scholar] [CrossRef]
- Surra, E.; Bernardo, M.; Lapa, N.; Esteves, I.A.A.C.; Fonseca, I.; Mota, J.P.B. Biomethane Production Through Anaerobic Co-Digestion with Maize Cob Waste Based on a Biorefinery Concept: A Review. J. Environ. Manag. 2019, 249, 109351. [Google Scholar] [CrossRef] [PubMed]
- Boyd, P.G.; Chidambaram, A.; García-Díez, E.; Ireland, C.P.; Daff, T.D.; Bounds, R.; Gładysiak, A.; Schouwink, P.; Moosavi, S.M.; Maroto-Valer, M.M.; et al. Data-driven design of metal–organic frameworks for wet flue gas CO2 capture. Nature 2019, 576, 253–256. [Google Scholar] [CrossRef] [PubMed] [Green Version]
- Tomé, L.C.; Isik, M.; Freire, C.S.R.; Mecerreyes, D.; Marrucho, I.M. Novel pyrrolidinium-based polymeric ionic liquids with cyano counter-anions: High performance membrane materials for post-combustion CO2 separation. J. Memb. Sci. 2015, 483, 155–165. [Google Scholar] [CrossRef]
- Coudert, F.X. Molecular Mechanism of Swing Effect in ZeoliticImidazolate Framework ZIF-8: C ontinuous Deformation upon Adsorption. ChemPhysChem 2017, 18, 2732–2738. [Google Scholar] [CrossRef] [Green Version]
- Fairen-Jimenez, D.; Moggach, S.A.; Wharmby, M.T.; Wright, P.A.; Parsons, S.; Düren, T. Opening the Gate: Framework Flexibility in ZIF-8 Explored by Experiments and Simulations. J. Am. Chem. Soc. 2011, 133, 8900–8902. [Google Scholar] [CrossRef] [Green Version]
- Costa Gomes, M.; Pison, L.; Červinka, C.; Padua, A. Porous Ionic Liquids or Liquid Metal-Organic Frameworks? Angew. Chem. 2018, 130, 12085–12088. [Google Scholar] [CrossRef]
Publisher’s Note: MDPI stays neutral with regard to jurisdictional claims in published maps and institutional affiliations. |
© 2022 by the authors. Licensee MDPI, Basel, Switzerland. This article is an open access article distributed under the terms and conditions of the Creative Commons Attribution (CC BY) license (https://creativecommons.org/licenses/by/4.0/).