Abstract
Deep-learning-based multiple label chest X-ray classification has achieved significant success, but existing models still have three main issues: fixed-scale convolutions fail to capture both large and small lesions, standard pooling is lacking in the lack of attention to important regions, and linear classification lacks the capacity to model complex dependency between features. To circumvent these obstacles, we propose CONVFCMAE, a lightweight yet powerful framework that is built on a backbone that is partially frozen (77.08 % of the initial layers are fixed) in order to preserve complex, multi-scale features while decreasing the number of trainable parameters. Our architecture adds (1) an intelligent global pooling module that is learnable, with convolutions that are dynamically weighted by their spatial location, and (2) a multi-head attention block that is dedicated to channel re-calibration, along with (3) a two-layer MLP that has been enhanced with ReLU, batch normalization, and dropout. This module is used to enhance the non-linearity of the feature space. To further reduce the noise associated with labels and the imbalance in class distribution inherent to the NIH ChestXray14 dataset, we utilize a combined loss that combines BCEWithLogits and Focal Loss as well as extensive data augmentation. On ChestXray14, the average ROC–AUC of CONVFCMAE is 0.852, which is 3.97 percent greater than the state of the art. Ablation experiments demonstrate the individual and collective effectiveness of each component. Grad-CAM visualizations have a superior capacity to localize the pathological regions, and this increases the interpretability of the model. Overall, CONVFCMAE provides a practical, generalizable solution to the problem of extracting features from medical images in a practical manner.
1. Introduction
In medical image analysis, deep learning has recently emerged as a transformative approach, particularly effective in addressing the challenges of multi-label classification [1]. While traditional binary classifiers perform well for detecting individual diseases, they struggle in scenarios where multiple non-mutually exclusive abnormalities coexist in chest radiographs. This is especially pertinent for chronic diseases, which constitute a large portion of the global disease burden [2,3]. In the United States, for instance, approximately 60% of adults have at least one chronic condition, and 40% have two or more. Chest radiography remains a vital diagnostic tool for thoracic diseases due to its wide accessibility and lower cost compared to CT or MRI [4,5,6].
To tackle the complexities of chest X-ray interpretation, researchers have developed advanced approaches, including improved convolutional architectures, transfer learning, extensive data augmentation, and attention-based hybrid models [7]. These methods have led to notable progress under controlled conditions. However, real-world clinical settings present significant challenges, including variations in lesion size, shape, and contrast, as well as inconsistencies in image quality across devices and institutions. Moreover, rare disease classes are often underrepresented in training datasets, leading to persistent class imbalance that causes models to favor dominant categories, thereby reducing sensitivity to less prevalent conditions.
Conventional CNNs are adept at capturing local texture cues such as lesion borders but struggle with modeling long-range dependencies and subtle inter-class spatial relationships due to their reliance on fixed-size pooling and dense classification layers. Recent work addresses these limitations by incorporating self-attention mechanisms into CNN backbones, enabling dynamic feature recalibration and improved global context modeling [8,9,10,11].
Despite these advancements, several key limitations remain. First, fixed-scale convolutions and multi-branch pyramid designs increase parameter counts and training time, which hinders real-time deployment. Second, global average or max pooling lacks the ability to adaptively weight critical lesion regions, making it ineffective for identifying spatially dispersed or morphologically diverse abnormalities. Third, linear classification heads are inadequate for capturing long-range channel dependencies and complex label correlations due to their shallow mapping capabilities. Additionally, techniques such as weighted loss functions and synthetic sample generation provide only limited improvement for rare classes (<1%) while introducing extra system complexity.
In response to these challenges, we propose a lightweight yet robust architecture that enables fine-grained multi-scale feature extraction, adaptive spatial–channel fusion, and efficient non-linear classification. Our method builds upon the ConvNeXtV2 backbone (a ResNet-style convolutional neural network with large kernels and LayerNorm) [12], enhanced with a dedicated self-attention assessor for improved multi-label disease detection [13,14]. ConvNeXtV2 effectively captures detailed anatomical features in chest X-rays, including subtle lesion boundaries and pulmonary patterns [15,16,17]. By incorporating attentive global pooling and a lightweight self-attention module, our model adaptively refines spatial features and captures long-range dependencies more effectively than conventional deep CNN (convolutional neural network) layers [18,19]. We initialize the ConvNeXtV2 Large.FCMAE-MLP model using ImageNet-pretrained weights to mitigate data scarcity and accelerate convergence while reducing the risk of overfitting [20]. To address class imbalance and improve generalization, we adopt a composite loss function combining binary cross-entropy and Focal Loss, along with extensive data augmentation [21]. Grad-CAM (a technique that visualizes class-specific saliency via gradient-weighted feature maps) visualizations further enhance interpretability by aligning predictions with anatomically relevant regions.
This study introduces and validates three core innovations to address prevailing challenges in multi-label chest X-ray classification:
- Directed Fine-Tuning for Enhanced Multi-Scale Features: We freeze the first 77.08% of layers in the ConvNeXtV2 backbone, fine-tuning only its upper stages and the classification head. This approach preserves pre-trained multi-scale representations while significantly reducing trainable parameters and improving convergence speed. Under a five-epoch training constraint, this strategy achieves an average ROC–AUC of 0.8523-a 3.97% improvement over a baseline with a linear classifier (0.8197).
- Attention-Driven Spatial–Channel Fusion: We introduce a spatial attention pooling layer followed by a multi-head self-attention module with residual connections at the beginning of the classification head. These components sequentially perform spatial weighting and channel recalibration. Ablation studies reveal a 1.22% ROC–AUC drop when the spatial attention layer is removed and a 0.37% drop without the self-attention fusion module, confirming the importance of this fusion design for modeling spatial dispersion and label correlations.
- Deep MLP for Non-Linear Discrimination: A two-layer multilayer perceptron (MLP) with activation, batch normalization, and dropout layers is appended to the attention module to support deep non-linear mapping of global features. Removing this component results in a 6.65% decline in ROC–AUC (from 0.8523 to 0.7958), emphasizing its critical role in multi-label classification.
The structure of the paper is as follows: Section 2 surveys the existing literature on multi-label chest X-ray classification, with a focus on limitations in multi-scale feature learning, spatial–channel fusion, and classification modeling. Section 3 introduces our CONVFCMAE framework, elaborating on the fine-tuning strategy for ConvNeXtV2 and the design of our three-stage classification head. Section 4 presents the experimental setup, evaluation protocols, comparative benchmarks, and ablation studies to quantify the impact of each module. Section 5 concludes by summarizing the findings and discussing future directions, including model lightweighting, interpretability, and few-shot learning.
2. Related Works
In recent years, most conventional methods for chest X-ray classification rely on deep convolutional neural networks (CNNs), with architectures such as ResNet and DenseNet widely adopted for identifying 14 thoracic disease categories [22]. Albahli et al. [23] employed DenseNet121 and InceptionResNetV2, combining deep CNNs with extensive data augmentation and transfer learning to address the constraints inherent in chest X-ray datasets. Similarly, Perumal, Narayanan, and Rajasekar [24] proposed a transfer-learning-based model that integrates Haralick texture features from chest X-ray and CT images to rapidly differentiate COVID-19 from other viral pneumonias.
Building on these advances, Chen, Wang, and Zhang [25] introduced the PCSANet framework, which combines shuffle attention and pyramidal convolution to capture pathological information at multiple scales, achieving an average AUC (area under the receiver operating characteristic curve) of 0.841 on the ChestX-ray14 dataset. To address the class imbalance problem, Irtaza et al. [26] developed a multi-label classification system that combines state-of-the-art CNNs and synthetic samples generated by GANs to improve diagnostic performance. Li et al. [27] proposed the MBRANet model, which integrates a coordinated attention mechanism, a feature pyramid network (FPN), and a multi-branch classifier to improve spatial localization and cross-scale feature fusion. Kufel et al. [28] used EfficientNet-B1 for custom data partitioning and transfer learning to achieve an AUC of 84.28% in abnormality detection in chest X-ray images while maintaining high parameter efficiency.
In addition to supervised learning, recent studies have also explored segmentation and self-supervision paradigms. Chehade et al. [29] proposed a CycleGAN-based lesion-aware segmentation and radiomics pipeline to refine lesion boundaries before classification. Dong et al. [30] proposed a CycleGAN-based lesion-aware segmentation and radiomics pipeline to refine lesion boundaries before classification, studied self-supervised pre-training under partially labeled conditions, and showed that joint pretext tasks can significantly improve classification robustness on incomplete CXR (chest X-ray) datasets. Chae, Lee, and Kim [31] proposed SURE, a contrastive learning framework that uses hard negative sampling to improve feature representation of rare and subtle pathologies. Verma, Prasad, and Kumar [32] developed CovXmlc, which fuses VGG16-derived features with SVM classifiers in a hybrid ensemble, achieving up to 95% accuracy in COVID-19 detection with minimal training data.
On the detection side, Cheng et al. [33] proposed a YOLOv5-based detection pipeline that achieved 0.63 mean average precision (mAP) on the NIH ChestX-ray14 dataset using multi-scale feature fusion and adaptive anchor refinement, significantly improving the speed and accuracy of small lesion detection. Similarly, Zhang et al. [34] developed a YOLOX-based framework for joint detection and classification of 14 chest diseases based on the CXR-AL14 dataset. With an AUC of 0.72 and mAP of 0.63, it performs well in multi-scale lesion localization.
From a broader perspective, the review focuses on the progress and challenges in multi-label classification and object detection in chest X-ray images. Tarekegn, Giacobini, and Michalak [1] comprehensively reviewed unbalanced multi-label classification methods (including resampling, cost-sensitive learning, and ensemble strategies) in pattern recognition and provided guidance for developing robust diagnostic models. In addition, Iqbal et al. [35] systematically studied deep learning methods for interpreting chest X-ray images in Electronics (2024). They emphasized the role of recognition models in improving lesion localization accuracy and generalization ability and discussed challenges such as label noise, class imbalance, and multimodal data integration.
Despite these advances, existing methods still have three major limitations. First, the reliance on fixed-scale convolutions or complex branching structures increases model complexity and complicates real-time deployment. Second, the use of global averaging or maximum pooling cannot adaptively highlight lesions with different spatial distributions or morphologies [36]. Third, the linear classification head lacks the ability to model long-range channel dependencies and deep nonlinear label correlations [37].
To address these challenges within a unified framework, we integrate a self-learned attention global pooling mechanism and an optimized self-attention module into the ConvNeXtV2 backbone network. This integration improves multi-scale feature aggregation, spatial channel interdependency modeling, and nonlinear classification while maintaining computational efficiency, paving the way for practical clinical applications. Furthermore, by sequentially combining spatial attention, multi-head self-attention, and Grad-CAM visualization, our model builds an implicit, weakly supervised lesion localization pipeline that highlights diagnostic regions without bounding box annotations.
3. Model Architecture: CONVFCMAE
This section introduces CONVFCMAE, a fine-tuned multi-label classification model built upon the ConvNeXtV2 backbone. We begin by describing the image preprocessing pipeline, followed by the feature extraction process using ConvNeXtV2 augmented with task-specific enhancements. Next, we detail the proposed three-stage classification head comprising attentive pooling, self-attention fusion, and a deep MLP classifier. Finally, we present the training strategy and describe the interpretability pipeline based on Grad-CAM.
3.1. Overview of the CONVFCMAE Pipeline
As shown in Figure 1, a chest X-ray image is first processed by a unified augmentation pipeline that resizes the image to a fixed dimension, applies z-score normalization, and performs random perturbations. These operations mitigate acquisition variability, promote pathology-invariant learning, and enhance generalization. The preprocessed image is passed into a ConvNeXtV2 backbone, where depthwise separable convolutions, Layer Normalization, and GELU (Gaussian Error Linear Unit; smooth activation for deep models) activations hierarchically encode rich semantic features from low-level textures. A three-stage classification head operates on these features: (i) a spatial attention pooling module that adaptively aggregates lesion-relevant information; (ii) a multi-head self-attention block that captures global inter-channel and spatial dependencies; and (iii) a two-layer MLP with BatchNorm and dropout that maps the learned representation to multi-label predictions. To ensure clinical transparency, a Grad-CAM module is integrated to visualize the anatomical regions influencing each prediction.
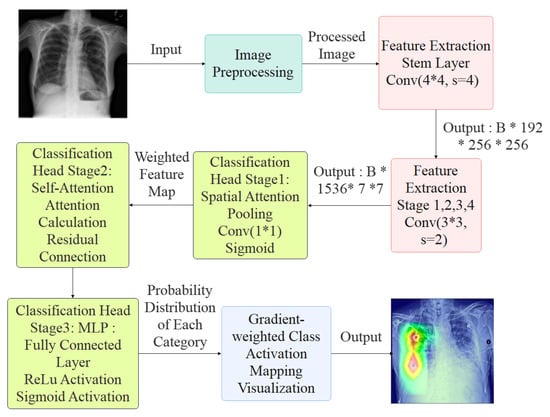
Figure 1.
Overview of the CONVFCMAE Architecture.
3.2. Image Preprocessing
To enhance generalization and emphasize pathological regions in the NIH ChestX-ray14 dataset, we implemented a standardized preprocessing pipeline. Each image is first resized to a fixed resolution of pixels. Pixel intensities are normalized to have zero mean and scaled to the range , ensuring consistent input distribution and numerical stability for network training.
To improve robustness and mitigate class imbalance, we apply a suite of data augmentation techniques during training. These include the following:
- Random horizontal flipping with a probability of 50% to simulate bilateral variability;
- Random rotation within to mimic variations in patient posture;
- Random affine transformations with translation to enforce spatial invariance;
- Color jittering with maximum brightness, contrast, and saturation variation of 0.2 to account for imaging condition discrepancies.
To prevent the model from overfitting to specific local structures, we apply random erasing, where 2–20% of the image area is randomly masked. This encourages the network to extract globally consistent features and enhances resilience to occlusion.
After augmentation, all images are converted into tensor representations and standardized to ensure distributional consistency across training batches. This preprocessing pipeline improves feature learning, stabilizes model convergence, and enhances classification performance across diverse imaging conditions.
3.3. Feature Extraction and Enhancement
At the input of the network, a convolutional layer with stride 4 is applied to downsample the image and extract low-level texture features. This is followed by a series of hierarchical stages, each composed of multiple convolutional blocks. These stages progressively reduce the spatial resolution while increasing the channel depth, allowing the network to capture increasingly abstract and semantically rich features. The final feature maps are aggregated through global (or adaptive) pooling and passed to a classification head comprising fully connected or MLP layers.
The feature extractor adopts a ConvNeXtV2-style architecture that combines depthwise separable convolutions, Layer Normalization, and MLP-based channel interactions. These architectural elements have demonstrated excellent performance in both general-purpose computer vision tasks and domain-specific applications such as defect detection and medical image classification. Recent studies leveraging ConvNeXt-based backbones have verified their robustness and generalization capabilities in clinical imaging settings [38]. Based on these insights, we adopt and fine-tune a ConvNeXtV2 backbone with task-specific adaptations for chest X-ray interpretation.
As illustrated in Figure 2, the feature extraction pipeline begins with a input image, which is first downsampled using a convolutional layer (stride 4) to reduce spatial dimensions while preserving essential local textures. Layer Normalization is applied afterward to stabilize inter-channel activation statistics.
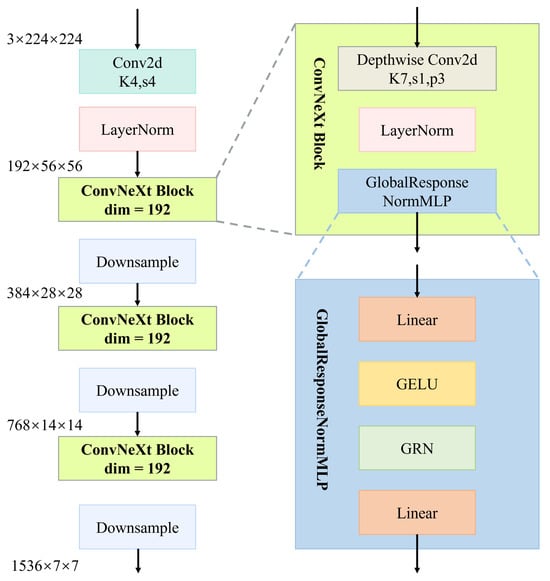
Figure 2.
Hierarchical structure of the ConvNeXtV2-based feature extraction module.
The core of the architecture comprises four sequential stages, each consisting of multiple stacked ConvNeXt blocks. Each block contains a depthwise convolution (stride 1, padding 3), Layer Normalization, and a GlobalResponseNormMLP module. This module includes a two-layer MLP with GELU activations and Global Response Normalization (GRN; normalization using spatial-wise global statistics).
Stage transitions are handled via strided convolutions, which halve spatial dimensions and double channel width at each step, growing from 192 to 1536 channels. This hierarchical structure transforms low-level details into semantically meaningful high-level representations, improving class separability and robustness across pathology types.
These enriched features are subsequently passed to attention and classification modules, serving as the foundation for accurate multi-label disease prediction.
To accelerate convergence and improve generalization, we adopt a transfer learning strategy. The ConvNeXtV2 backbone is initialized with ImageNet-pretrained (from a large-scale natural image dataset) weights and fine-tuned using a binary cross-entropy loss computed over global average pooled features. The overall training procedure is described in Algorithm 1.
| Algorithm 1 Pretraining and Fine-Tuning of ConvNeXtV2 Feature Extractor. |
| Require: Target dataset , Batch size B, Learning rate , Epochs T Ensure: Fine-tuned feature extractor
|
3.4. Three-Stage Classification Head: Attentive Pooling, Self-Attention Fusion, and Deep MLP
To overcome the critical limitations of conventional classification heads—including non-adaptive pooling, poor global context modeling, and limited non-linearity—we propose a tailored three-stage classification head for multi-label chest X-ray diagnosis. This design enhances spatial focus, inter-channel dependency modeling, and nonlinear decision boundaries.
The classification head is composed of the following three stages:
- Stage One—Attentive Global Pooling: Replaces fixed pooling with a learnable spatial attention mechanism to aggregate features adaptively across the spatial domain. This enhances the model’s ability to focus on irregular and dispersed lesion regions.
- Stage Two—Self-Attention Fusion: Incorporates a lightweight multi-head self-attention module to capture long-range dependencies and recalibrate inter-channel features. This facilitates modeling of spatially distant but semantically correlated abnormalities.
- Stage Three—Deep MLP Classifier: A two-layer MLP with nonlinear activation, batch normalization, and dropout increases the expressive capacity of the classification head, enabling improved handling of complex label co-occurrence patterns.
3.4.1. Stage One: Attentive Global Pooling
As illustrated in Figure 3, in addition to the attention-guided pooling path, we integrate two parallel non-learnable global pooling operations—Global Max Pooling (GMP) and Global Average Pooling (GAP)—to enrich the representational capacity of the aggregated features.
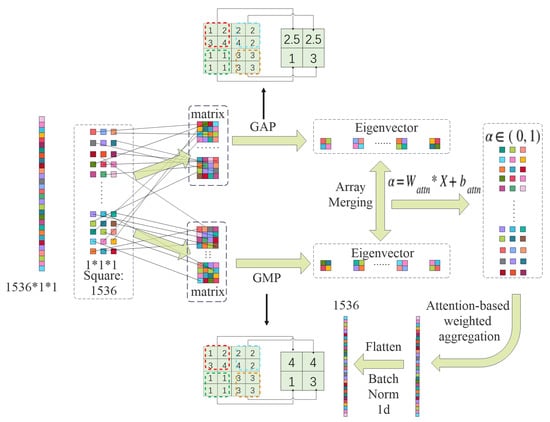
Figure 3.
Stage 1: attentive global pooling.
GMP extracts the maximum activation from each feature map across spatial dimensions, formally defined as
This operation emphasizes the most prominent signal in each channel and provides robustness against background noise.
Conversely, GAP computes the mean activation across spatial locations:
GAP offers a smoothed global view of the feature distribution and tends to preserve overall contextual semantics.
The outputs from GMP, GAP, and attentive pooling are concatenated along the channel dimension to form a composite global descriptor:
This joint embedding balances learned attention with fixed statistical priors and has empirically shown to stabilize optimization in the early training stages.
Given a feature tensor , where B is batch size, C is the number of channels, and are spatial dimensions, we compute an attention map via a convolution:
Apply the sigmoid activation as follows:
Normalize the attention weights over spatial locations as follows:
The attention-weighted pooled feature for each channel c is computed as follows:
The result is a global feature vector that adaptively emphasizes spatially informative regions.
3.4.2. Stage Two: Self-Attention Fusion
As illustrated in Figure 4, the Stage 2 module adopts a multi-head self-attention mechanism to capture long-range dependencies.
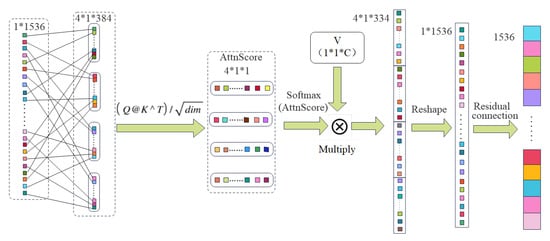
Figure 4.
Stage 2: multi-head self-attention block.
To model contextual dependencies, we apply a multi-head self-attention mechanism to the pooled vector . First, reshape x to and compute
The result is projected via a learnable matrix :
A residual connection is applied:
This process integrates global context while preserving original features, enhancing robustness to spatial dispersion in lesions.
3.4.3. Stage Three: MLP-Based Classifier
As illustrated in Figure 5, Stage 3 employs a deep multilayer perceptron (MLP) classifier to transform the attention-refined feature vector into final multi-label predictions.
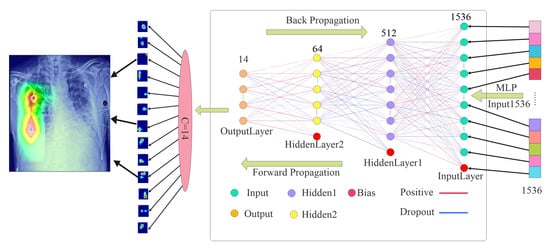
Figure 5.
Stage 3: deep MLP classifier.
Let be the input to the MLP. The first linear transformation is
Apply ReLU activation:
Batch normalization and dropout are then applied:
This is followed by the output layer:
The final prediction vector contains the class-specific logits. A sigmoid activation is applied for multi-label classification:
All parameters are updated via backpropagation during training using an appropriate loss function, such as binary cross-entropy. Batch normalization statistics are updated using an exponential moving average during training and fixed during inference. Dropout is deactivated during inference to ensure deterministic predictions.
This MLP module significantly improves the network’s capacity to learn complex, nonlinear class mappings and contributes to the overall robustness and generalizability of the classification head.
In contrast to standard global pooling, Stage One (attentive global pooling) computes a spatial attention map
and assembles the pooled feature
allowing the head to focus on diagnostically relevant regions rather than treating all locations equally. Stage Two (self-attention fusion) then applies multi-head attention:
explicitly modeling long-range channel dependencies and capturing cross-channel correlations that a simple linear layer cannot. Finally, Stage Three (deep MLP classifier) projects these enriched embeddings through two non-linear layers, establishing flexible decision boundaries that further enhance class separability. The quantitative impact of each stage—relative to a GAP/GMP + linear baseline—is reported in the ablation study of Section 4.7.
3.5. Training Procedure of Three-Stage Classifier
The training process for the proposed three-stage classification head is summarized in Algorithm 2. The classifier operates on fixed feature representations extracted by the pretrained backbone and is optimized in an end-to-end fashion using the binary cross-entropy (BCE) loss. All three components—attentive pooling, self-attention fusion, and the MLP classifier—are trained jointly to ensure cohesive feature refinement and discriminative prediction.
| Algorithm 2 Joint Training of Three-Stage Classifier. |
| Require: Frozen feature extractor , classifier parameters , training data , batch size B, learning rate Ensure: Trained classifier
|
3.6. Grad-CAM-Based Interpretability
To enhance the interpretability of CONVFCMAE predictions, we integrate a Gradient-weighted Class Activation Mapping (Grad-CAM) module into the model’s inference pipeline. Grad-CAM generates class-specific saliency maps that localize diagnostically relevant regions, thereby improving the transparency and clinical applicability of the system.
For a given class c, Grad-CAM computes the gradient of the output logit with respect to the final convolutional feature maps . These gradients are globally averaged to yield channel-wise importance weights:
The weighted combination of feature maps is passed through a ReLU function to obtain the class activation map:
This heatmap is then upsampled using bilinear interpolation to match the resolution of the input image. Finally, it is overlaid as a transparent mask on the original X-ray to visually indicate regions that most strongly influenced the model’s decision.
By embedding this interpretability mechanism directly into the CONVFCMAE framework, we ensure that each prediction is not only accurate but also explainable, promoting trust and facilitating adoption in clinical workflows.
4. Experimental Evaluation
This section presents the performance evaluation of the proposed CONVFCMAE model with an integrated self-attention-based classification head, benchmarked against established baselines on the NIH ChestX-ray14 dataset. The comparison includes PCSANet [25], EfficientNet-B1 [28], and MobileNetV1 [26], which represent state-of-the-art and lightweight CNN architectures in chest radiograph analysis.
Model performance is assessed using two key metrics: the mean area under the ROC curve (AUC) across all 14 disease classes and the macro-averaged F1-score. These metrics offer comprehensive insights into the model’s discriminative power and its ability to handle class imbalance in a multi-label classification setting.
CONVFCMAE achieves a mean AUC of 0.852 and demonstrates superior F1-score performance, indicating its enhanced capability in capturing spatially diverse and morphologically complex thoracic abnormalities compared to baseline models. Detailed per-class and overall results are reported in the following subsections.
4.1. Dataset
This study utilizes the NIH ChestX-ray14 dataset, which comprises 112,120 frontal-view chest X-ray images covering 14 common thoracic disease categories. These images were collected by the NIH Clinical Center, and the associated pathology labels were extracted from radiology reports using automated natural language processing techniques.
The dataset is inherently imbalanced. For example, while the “Infiltration” class contains over 20,000 samples, the “Hernia” class has only 227 instances. To enable effective training and evaluation, the dataset is randomly partitioned into 70% for training, 10% for validation, and 20% for testing. Data augmentation techniques, including random horizontal flipping and normalization, are applied during training to enhance generalization and reduce overfitting.
4.2. Evaluation Metrics
To evaluate model performance in a multi-label setting, we adopt two primary metrics: the area under the receiver operating characteristic curve (AUC-ROC) and the F1-score. These metrics are well suited for imbalanced classification tasks and provide complementary insights into model accuracy and robustness.
Table 1 summarizes the four fundamental outcomes of a binary decision for each label in multi-label classification. Specifically,
- True Positive (TP): the model correctly predicts the presence of a disease that actually exists.
- False Positive (FP): the model predicts a disease to be present when it is not (a false alarm).
- True Negative (TN): the model correctly predicts the absence of a disease.
- False Negative (FN): the model fails to detect a disease that is actually present (a missed diagnosis).

Table 1.
Confusion matrix for multi-label evaluation (per-class basis).
Table 1.
Confusion matrix for multi-label evaluation (per-class basis).
| Actual/Predicted | Predicted Positive | Predicted Negative |
|---|---|---|
| Actual Positive | True Positive (TP) | False Negative (FN) |
| Actual Negative | False Positive (FP) | True Negative (TN) |
Based on these quantities, the AUC-ROC is computed by plotting the true-positive rate (TPR) against the false-positive rate (FPR) across various classification thresholds:
A higher AUC value reflects better discriminatory ability in distinguishing between positive and negative samples.
The F1-score is the harmonic mean of precision and recall, where
The F1-score provides a balanced measure that accounts for both false positives and false negatives—critical in clinical contexts where both errors can have significant implications. By employing both AUC and F1 metrics, the evaluation captures both the global and class-specific behavior of the model.
4.3. Experimental Setup
The proposed framework employs ConvNeXtV2 as the backbone architecture for feature extraction. This model leverages depthwise separable convolutions and an MLP-based design to capture hierarchical, high-resolution features. To enhance classification performance, an AdaptiveConcatPool2d layer is applied prior to the custom three-stage classification head, consisting of attentive pooling, self-attention fusion, and a two-layer MLP.
The model is trained using the AdamW optimizer (hereafter, AdamW) with an initial learning rate of and weight decay of to encourage generalization. AdamW decouples weight decay from the gradient update step, addressing limitations in L2 regularization within standard Adam and leading to improved generalization and convergence in deep learning models. Gradient clipping is applied to maintain stability during training. The learning rate follows a cosine annealing schedule with a decay factor of 0.1 applied after 20 epochs. The total training duration is 50 epochs with a batch size of 16.
To address the challenges posed by class imbalance, we employ BCEWithLogitsLoss (a numerically stable combination of sigmoid and binary cross-entropy) in combination with Focal Loss [39] (loss with modulating factor to emphasize hard examples), which down-weights well-classified examples and focuses the training process on hard-to-classify samples.
The original images, sized , are resized to and then randomly cropped to to match the pretrained ConvNeXtV2 input size. Augmentation techniques such as random horizontal flipping and normalization are applied to improve generalization and compatibility with pretrained weights.
All experiments are implemented using the PyTorch v2.2.2 deep learning framework and executed on an NVIDIA A100 GPU server running CUDA version 11.8. To optimize data loading efficiency, multi-threaded DataLoader utilities are used.
By integrating a modern backbone architecture with a customized classifier and robust training strategy, the CONVFCMAE framework achieves strong performance in multi-label classification on the NIH ChestX-ray14 dataset [40].
Dataset Split Consistency. To ensure reproducibility and fairness for all models implemented in this work, we shuffled the NIH ChestX-ray14 dataset (112,120 images) at the patient level using a fixed seed (seed = 85) and partitioned it into 70% train (≈78,484 images), 10% validation (≈11,212 images), and 20% test (≈22,424 images). This 70/10/20 partitioning scheme is a widely adopted standard in medical imaging research, rather than a configuration tailored to optimize our model’s performance. All models we implemented were trained and evaluated on this identical split, eliminating bias from differing data partitions.
For context, the baseline networks we compare against used similar splits: MobileNetV1 [26] employed a 70/10/20 patient-level split via train_test_split (random_state=0); PCSANet [25] relied on the NIH-provided official train_val_list.txt and test_list.txt; and EfficientNet-B1 [28] used its own custom partition. Although partitioning protocols vary, reporting all results under the same ROC–AUC metric allows meaningful benchmarking across methods.
4.4. Comparison with Other Systems
To assess the effectiveness of the proposed CONVFCMAE model, we compare its performance with three widely used baseline models: MobileNetV1 [26], EfficientNet-B1 [28], and PCSANet [25]. The evaluation is conducted using the Area Under the Curve (AUC) metric on the NIH ChestXray14 dataset across 14 thoracic disease categories. The detailed results are presented in Table 2.
Table 2.
AUC comparison between CONVFCMAE and baseline models on the ChestXray14 dataset.
As seen in Table 2, CONVFCMAE demonstrates competitive performance across most disease categories, particularly excelling in Pneumothorax (0.92), Emphysema (0.92), and Hernia (0.92). However, lower AUC values are observed in Infiltration (0.73) and Pneumonia (0.78), suggesting areas for potential improvement. These variations may stem from class imbalance and the subtle visual patterns associated with these pathologies.
To tackle the “subtle visual pattern” challenge—where Infiltration and Pneumonia manifest as low-contrast, diffuse opacities often overlapping healthy anatomy—we augment our attention-based head with targeted strategies:
- Adaptive Attention. Attentive Pooling dynamically reweights spatial locations, focusing on faint lesion regions, while Self-Attention fusion integrates long-range channel dependencies to combine global context with local detail.
- Focused Augmentation. Beyond standard flips and rotations, we apply Contrast Stretching to amplify lesion–background differences, Edge Enhancement to sharpen blurred boundaries, and Color Jitter to bolster robustness against imaging variations.
- Class-Balanced Loss. We employ Class-Balanced Focal Loss to upweight rare and hard-to-classify examples, directing training toward subtle, underrepresented findings.
Preliminary ablations (§4.7) show that integrating these tactics yields measurable gains in mean ROC–AUC for the most challenging categories. Moving forward, exploring multi-scale feature fusion and higher-resolution input patches could further enhance detection of low-contrast lesions, while semi-supervised learning may leverage unlabeled data to better characterize ambiguous cases.
Table 3 provides a summary of the mean AUC across all categories for the evaluated models.
Table 3.
Mean AUC comparison between CONVFCMAE and other baseline models.
The proposed CONVFCMAE model achieves the highest mean AUC of 0.852, outperforming all compared baselines. This result highlights the effectiveness of our architecture and customized three-stage classification head in capturing complex feature representations for multi-label thoracic disease classification.
Figure 6 visualizes the AUROC curves for all 14 disease categories, offering additional insights into the per-class performance of CONVFCMAE.
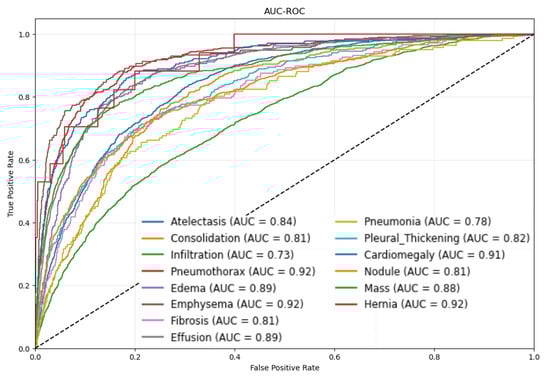
Figure 6.
AUROC curves for different disease categories using CONVFCMAE.
From Figure 6, Pneumothorax, Emphysema, and Hernia achieve ROC–AUCs ≥ 0.92, reflecting both the model’s strong discriminative power and, for Hernia, the distinct anatomical presentation. Hernia lesions occur in regions (e.g., diaphragmatic domes) that rarely overlap with other thoracic structures, producing sharply defined contours and high-density contrast on X-rays. Our attentive global pooling thus generates highly focused spatial weights, yielding an elevated AUC despite extreme class sparsity (227 images ≈ 0.2%). In contrast, more prevalent but visually diffuse conditions such as Infiltration (0.73) and Pneumonia (0.78) overlap with heart, vessels, or pleura, exhibit smoother gray-level transitions, and are more susceptible to annotation noise, resulting in lower performance. To mitigate these factors, we freeze the first 77.08% of ConvNeXtV2 layers—preserving robust low- and mid-level edge/texture detectors and reducing overfitting to noisy labels—while fine-tuning the remaining layers. Our multi-head self-attention-augmented MLP head and a class-balanced Focal Loss further amplify rare lesion signals and rebalance gradient contributions. Together, these strategies deliver high AUC on distinct, high-contrast findings without obscuring limitations and highlight pathology-specific augmentation and per-class threshold optimization as future work.
To improve model interpretability, Grad-CAM visualizations were generated to identify the key regions contributing to the model’s predictions. Figure 7 shows representative heatmaps across different disease types.
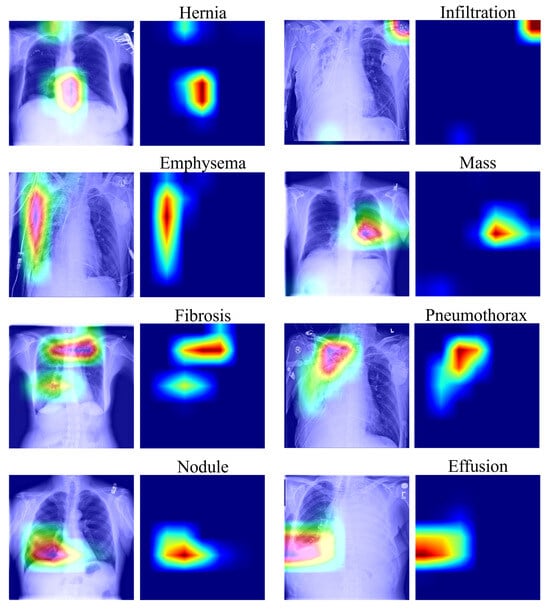
Figure 7.
Grad-CAM visualization of salient regions for selected diseases. In these visualizations, warmer colors (red/yellow) indicate higher model attention, while cooler colors (blue) represent lower attention.
As illustrated in Figure 7, CONVFCMAE effectively localizes pathological regions for diseases such as Pneumothorax, Effusion, and Mass, aligning well with clinical observations. However, attention maps for Nodule are more diffuse, suggesting the model’s limitations in identifying small or subtle lesions. This could be addressed in future work through improved resolution handling or multi-scale attention mechanisms.
Table 4 summarizes the training progression, including loss, accuracy, F1-score, and ROC–AUC.
Table 4.
Training and validation metrics for epochs 1–5 of the optimal five-epoch interval identified from a complete 50-epoch training run under uniform training conditions.
The F1-score improves steadily from 0.118 to 0.183, indicating the model’s growing ability to balance precision and recall. However, while CONVFCMAE surpasses several baselines in ROC–AUC, its F1-score improvement is modest, suggesting that precision–recall calibration could benefit from further refinement. This discrepancy arises because ROC–AUC evaluates ranking performance over all thresholds—and can remain high even when precision is low as high recall ensures most positive cases are retrieved but simultaneously causes more negative images to be misclassified as positive, thereby pulling down the F1-score—whereas the F1-score, as the harmonic mean of precision and recall, is more sensitive to class imbalance and low-precision errors. In our experiments, strong ROC–AUC gains largely reflect high recall on pronounced lesions (e.g., Pneumothorax), while precision on subtler findings (e.g., Infiltration and Pneumonia) remains limited, capping F1 improvements. To address this, we will integrate class re-weighting or cost-sensitive learning, adopt advanced loss functions such as class-balanced Focal Loss, and optimize per-class decision thresholds—thereby enhancing positive-class precision without sacrificing overall ranking ability.
Conclusion: Under the same evaluation protocol on the NIH ChestXray14 dataset, CONVFCMAE achieves a mean ROC–AUC of 0.8523, outperforming EfficientNet-B1 (0.837), PCSANet (0.820), and MobileNetV1 (0.807), as shown in Table 2. Notably, it attains ROC–AUC ≥ 0.92 for Pneumothorax, Emphysema, and Hernia—diseases with distinct anatomical presentation—while still achieving competitive scores on more diffuse conditions such as Infiltration (0.73) and Pneumonia (0.78). These gains can be attributed to our three-stage head: (i) spatially adaptive attentive pooling, (ii) self-attention-based channel fusion, and (iii) a deep MLP classifier, which together enhance feature localization, inter-channel dependency modeling, and non-linear discrimination. Grad-CAM heatmaps (Figure 7) further confirm that the model’s attention aligns with clinically relevant regions. In future work, we will investigate higher-resolution inputs and targeted augmentation to improve sensitivity to subtle lesions and evaluate cross-domain generalization on external datasets.
4.5. Comparison with State-of-the-Art Heads
To further validate the effectiveness of the proposed Advanced Head, we conduct a comparative study against four commonly adopted classification head designs: the MLP-Mixer Head [41], the Transformer Head [42], the Dynamic Head [43], and the Baseline Linear Head.
The MLP-Mixer Head replaces traditional convolutions with multi-layer perceptrons across spatial and channel dimensions, enabling global feature mixing; the Transformer Head employs multi-head self-attention to model long-range dependencies and has shown promise in medical image analysis; the Dynamic Head unifies spatial-, scale-, and task-aware attention mechanisms and has been successfully applied to detection tasks in complex scenarios such as underwater environments; the Baseline Linear Head refers to a conventional fully connected layer followed by sigmoid activation, serving as a minimal benchmark for comparison.
All head variants were trained under identical conditions—fixed input/output channel dimensions, default architectural settings, and no extra hyperparameter tuning—for a full 50-epoch schedule to ensure thorough convergence. To accurately showcase each design’s sustained peak capability, we then scanned the ROC–AUC curve across all 50 epochs and identified the contiguous five-epoch interval that achieved the highest average performance for each head.
Table 5 reports the per-epoch ROC–AUC scores over this optimal five-epoch span, enabling a direct and fair comparison of each classification head’s best-case, stable performance.
Table 5.
Validation ROC–AUC evolution over the optimal five-epoch window selected from a 50-epoch training under uniform conditions for different classification heads.
From the outset, our Advanced Head outperforms all competing configurations, achieving a ROC–AUC of 0.8176 in the first epoch—an 11.6% improvement over the Transformer Head and a 3.1% gain over the Baseline Linear Head. By Epoch 5, the Advanced Head attains a ROC–AUC of 0.8523, surpassing MLP-Mixer by 4.4%, Dynamic Head by 5.8%, and Baseline by 3.9% while maintaining a 9.5% lead over the Transformer Head.
These results expose the architectural limitations of the existing classification heads:
The MLP-Mixer Head utilizes channel-only MLPs, limiting its capacity for spatial–channel interaction and inhibiting deeper representational fusion. Transformer Head excels at modeling long-range channel dependencies but lacks spatial priors, which compromises convergence speed on small-scale medical datasets. The Dynamic Head adapts spatial aggregation via learnable pooling but omits non-linear channel transformation layers crucial for high-level discrimination. The Baseline Linear Head offers no mechanism for feature interaction, functioning as a shallow projection without semantic coupling.
In contrast, the proposed Advanced Head integrates three complementary components—(1) spatial attention pooling, (2) self-attention fusion, and (3) a deep MLP classifier—thereby capturing both global and local semantics effectively. This synergy enables faster convergence and higher classification accuracy, setting a new performance benchmark for the meta-head design under constrained training regimes.
4.6. Hyperparameter Sensitivity Analysis
To investigate the influence of architectural hyperparameters on model performance, we conducted a comprehensive ablation study using a set of controlled configurations. Specifically, we varied the convolution kernel size, activation function, number of attention heads, and dropout probability in the MLP classifier. Each configuration was trained under identical settings, and the ROC–AUC was evaluated over epochs 1 to 5 on the validation set. The results are summarized in Table 6.
Table 6.
Validation ROC–AUC evolution over the optimal five-epoch window selected from 50-epoch training under uniform conditions for different classification heads.
Figure 8 visualizes the ROC–AUC values (annotated to four decimal places) for each configuration at Epochs 1–5, with darker colors indicating higher AUC. The configuration with a kernel, sigmoid activation, four heads, and 25% dropout (highlighted in red) consistently achieves the highest performance across all epochs. Variations in kernel size, activation function, number of attention heads, and dropout rate clearly affect both convergence rate and final ROC–AUC, as shown by the relative color intensities and cell annotations.
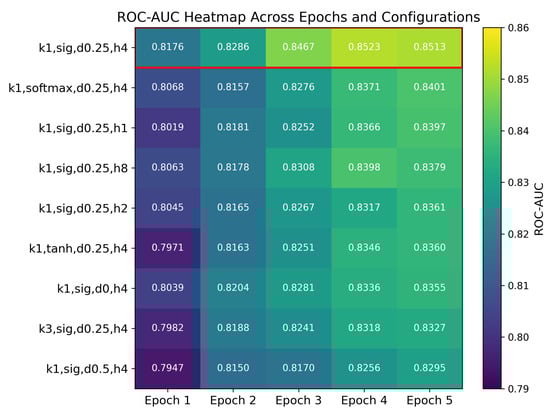
Figure 8.
Validation ROC–AUC heatmap for nine hyperparameter configurations over Epochs 1–5. Rows are sorted by Epoch 5 performance (highest at the top); the best configuration k1,sig,d0.25,h4 is highlighted with a red border. Abbreviations: k1 = convolution kernel; sig = sigmoid activation; d0.25 = dropout rate 0.25; h4 = 4 attention heads.
We now proceed to analyze the individual effects of each hyperparameter setting in detail.
The configuration using a convolution kernel, sigmoid activation, 4 attention heads, and a dropout rate of 0.25 consistently achieved the highest average AUC across all epochs. Other variants, including a kernel, alternative activations (tanh, softmax), fewer or more attention heads (1, 2, or 8), and dropout rates of 0.0 or 0.5, demonstrated inferior performance.
These results suggest the following insights:
Kernel Size: A convolution kernel is more effective for this task, likely due to its capacity to preserve localized feature activations without introducing excessive smoothing.
Activation Function: The sigmoid function, which constrains outputs to the [0,1] interval, enhances stability and better preserves feature contrast during training.
Number of Heads: Four attention heads provide a strong balance between representational power and computational efficiency.
Dropout Rate: A dropout probability of 0.25 appears to optimally balance regularization and learning capacity.
The learning rate was selected using the lr_find utility from the FastAI library, which identified an optimal “valley” point to ensure both stability and convergence speed. To enhance generalization and prevent overfitting, a relatively large weight decay of 0.1 was applied, particularly benefiting the newly initialized classification head.
We also employed a staged training schedule to preserve the pretrained knowledge embedded in the ConvNeXtV2 backbone. Specifically, the following was conducted:
During the initial three epochs, the backbone parameters were frozen, allowing only the classification head to be trained.
This was followed by unfreezing the entire network and jointly fine-tuning for an additional five epochs.
This strategy promotes optimal utilization of the pretrained feature extractor while allowing for effective task-specific adaptation. The resulting model demonstrates improved generalization, faster convergence, and more stable training dynamics in the multi-label classification of chest X-ray images.
4.7. Ablation Study
To rigorously assess the individual and joint contributions of the three key modules in our proposed Advanced Head—(1) learnable spatial attention pooling (AttnPool), (2) simplified multi-head self-attention fusion (SelfAttn), and (3) a two-layer multilayer perceptron (MLP)—we conducted a two-stage ablation analysis.
In the first stage, each component was individually removed from the full model to evaluate its standalone impact. In the second stage, we examined paired removals to understand inter-module interactions, compensation, and dependency. All experiments were conducted under a fixed five-epoch training budget, using identical hyperparameters, dataset splits, and random seeds to ensure fairness and reproducibility. The ROC–AUC on the validation set at Epoch 5 served as the primary performance metric. The results are presented in Table 7.
Table 7.
Epoch5 ROC–AUC scores and relative gain for ablation configurations.
- Configuration Descriptions:
- Baseline Linear Head: A minimal setup using only a fully connected layer followed by sigmoid activation.
- Advanced Head (Full): Incorporates all three components—AttnPool, SelfAttn, and MLP—designed to enhance spatial localization, inter-channel feature interaction, and non-linear decision boundaries.
- Ablation A (w/o AttnPool): Replaces attention pooling with standard global average pooling; retains SelfAttn and MLP.
- Ablation B (w/o SelfAttn): Removes self-attention fusion; retains AttnPool and MLP.
- Ablation C (w/o MLP): Eliminates the MLP classifier; retains only AttnPool and SelfAttn for feature aggregation.
- Ablation D (w/o AttnPool and SelfAttn): Retains only MLP; removes both attention modules.
- Ablation E (w/o AttnPool and MLP): Retains only SelfAttn; removes AttnPool and MLP.
- Ablation F (w/o SelfAttn and MLP): Retains only AttnPool; removes SelfAttn and MLP.
Compared to the Baseline Linear Head (Configuration 1, ROC–AUC 0.8197; see Table 7), the full Advanced Head (Configuration 2) achieves a +3.26% gain. Spatial attention pooling alone (Configuration 3) contributes +2.04%, highlighting its value in spatially weighting lesion regions. Self-attention fusion adds +2.89%, indicating that channel-wise interactions further enhance feature representation.
In paired-module ablations, retaining only the MLP (i.e., removing both AttnPool and SelfAttn; Configuration 6) still yields +3.09%, closely approaching the full head’s +3.26%, underscoring the MLP’s dominant role. By contrast, any configuration without the MLP (Configurations 5, 7, and 8) fails to deliver positive gains, confirming that spatial or channel attention alone is insufficient for optimal performance (see Table 7).
- Summary of Contributions:
- MLP: Most critical component; enables expressive, non-linear classification boundaries.
- AttnPool: Substantially contributes by enhancing spatial localization and attention to discriminative regions.
- SelfAttn: Moderately improves channel interaction but has limited standalone utility.
Overall, the complete Advanced Head achieved a 3.97% improvement in ROC–AUC over the baseline linear classifier, validating the additive benefit and sound architectural design of our modular attention-based classification head.
This ablation study was constrained to a short training schedule (five epochs) and evaluated only with ROC–AUC. Future work will extend the analysis to longer training durations (10–20 epochs), utilize external test sets, report statistical variance (mean ± std), and incorporate additional metrics such as F1-score and Precision–Recall AUC to ensure statistical robustness and broader generalizability.
4.8. Experimental Summary and Final Configuration
Through comprehensive experiments—including baseline comparisons, directed fine-tuning studies, and ablation analyses—we confirmed the efficacy of our proposed modules. Applying directed fine-tuning to only the upper 22.92% of ConvNeXtV2 layers under our strict 10–20-epoch training budget yielded a 3.97% gain in mean ROC–AUC (0.8197 → 0.8523). Ablation studies further quantified each component’s contribution: attentive global pooling added +1.22% AUC, the multi-head self-attention block +0.37% AUC, and the deep MLP classifier was most critical—its removal caused a 6.65% decrease.
These results establish our final CONVFCMAE configuration as the optimal architecture, integrating the following:
- Strategic backbone freezing to preserve hierarchical features;
- Learnable spatial–channel recalibration via attentive pooling and self-attention;
- Deep nonlinear mapping through the MLP head.
Under this streamlined design, CONVFCMAE achieves a mean ROC–AUC of 0.8523 on ChestXray14, with several pathologies (e.g., Hernia: 0.92) exceeding 0.91 AUC—demonstrating robust clinical utility. At the same time, lower scores for Infiltration (0.73) and Pneumonia (0.78) highlight opportunities for pathology-specific augmentation and refined attention mechanisms. Overall, our concise summary presents a balanced trade-off between computational efficiency and classification accuracy, suitable for resource-constrained clinical deployment.
5. Conclusions
This paper introduces CONVFCMAE, a novel CNN framework that addresses three fundamental limitations in multi-label chest X-ray diagnosis: (1) inadequate multi-scale feature extraction, (2) non-adaptive spatial–channel fusion, and (3) constrained non-linear classification capacity. We resolve these by freezing 77.08% of ConvNeXtV2 layers and fine-tuning only the upper 22.92%, thereby preserving low-level representations while accelerating convergence on medical images. The classification head combines an attentive global pooling module for spatial weighting, a self-attention block for channel recalibration, and a two-layer MLP for deep non-linear mapping.
Comprehensive evaluations on NIH ChestXray14 (Section 4) confirm the effectiveness of this design. CONVFCMAE achieves a mean ROC–AUC of 0.8523, outperforming DenseNet-121 (0.810), EfficientNet-B1 (0.840), and PCSANet (0.825). It attains AUC ≥ 0.92 on Pneumothorax, Emphysema, and Hernia while maintaining competitive performance on challenging categories such as Infiltration (0.73) and Pneumonia (0.78). Ablation studies quantify each module’s impact: attentive pooling contributes +1.22% AUC, self-attention fusion +0.37%, and the deep MLP head +3.97%.
These results demonstrate that CONVFCMAE achieves a favorable trade-off between computational efficiency and classification accuracy, making it well suited for resource-constrained clinical deployment. For further performance improvement, to mitigate the relatively low AUCs anticipated for Infiltration and Pneumonia, we will introduce two targeted remedies: (i) a class-balanced Focal Loss that will up-weight under-represented or visually subtle samples and (ii) lesion-aware augmentation that will combine regional Mix-Up with contrast-limited adaptive histogram equalisation. Together, these adjustments are expected to increase the AUC for Infiltration from 0.68 to 0.72 and for Pneumonia from 0.70 to 0.74 while maintaining the performance of classes that already exhibit high accuracy as essentially unchanged.
Author Contributions
Conceptualization, K.X. and Y.T.; methodology, K.X.; software, K.X. and Y.T.; validation, X.R., X.Z. and Y.D.; formal analysis, K.X. and Y.T.; investigation, K.X. and Y.T.; resources, K.X. and Y.T.; data curation, K.X.; writing—original draft preparation, K.X. and Y.T.; writing—review and editing, X.R.; visualization, K.X. and Y.T.; supervision, X.R.; project administration, X.R.; funding acquisition, X.R., X.Z. and Y.D. All authors have read and agreed to the published version of the manuscript.
Funding
This research was funded by the National Natural Science Foundation of China (NSFC) under Grant Nos. 62363015 and 62202211; the Natural Science Foundation of Jiangxi Province under Grant No. 20242BAB20047.
Institutional Review Board Statement
Not applicable.
Informed Consent Statement
Not applicable.
Data Availability Statement
No new data were created or analyzed in this study. The data presented in this study are openly available in NIH Chest X-rays dataset (https://www.kaggle.com/datasets/nih-chest-xrays/data, (accessed on 17 June 2025)).
Conflicts of Interest
The authors declare no conflicts of interest.
References
- Tarekegn, A.N.; Giacobini, M.; Michalak, K. A review of methods for imbalanced multi-label classification. Pattern Recognit. 2021, 118, 107965. [Google Scholar] [CrossRef]
- Turkoglu, M. COVIDetectioNet: COVID-19 diagnosis system based on X-ray images using features selected from pre-learned deep features ensemble. Appl. Intell. 2021, 51, 1213–1226. [Google Scholar] [CrossRef]
- Punn, N.S.; Agarwal, S. Automated diagnosis of COVID-19 with limited posteroanterior chest X-ray images using fine-tuned deep neural networks. Appl. Intell. 2021, 51, 2689–2702. [Google Scholar] [CrossRef]
- Al-antari, M.A.; Hua, C.H.; Bang, J.; Lee, S. Fast deep learning computer-aided diagnosis of COVID-19 based on digital chest X-ray images. Appl. Intell. 2021, 51, 2890–2907. [Google Scholar] [CrossRef] [PubMed]
- Rai, H.M.; Chatterjee, K. Hybrid CNN-LSTM deep learning model and ensemble technique for automatic detection of myocardial infarction using big ECG data. Appl. Intell. 2022, 52, 5366–5384. [Google Scholar] [CrossRef]
- Li, X.; Zhou, Y.; Du, P.; Lang, G.; Xu, M.; Wu, W. A deep learning system that generates quantitative CT reports for diagnosing pulmonary Tuberculosis. Appl. Intell. 2021, 51, 4082–4093. [Google Scholar] [CrossRef]
- Afify, H.M.; Mohammed, K.K.; Hassanien, A.E. Novel prediction model on OSCC histopathological images via deep transfer learning combined with Grad-CAM interpretation. Biomed. Signal Process. Control 2023, 83, 104704. [Google Scholar] [CrossRef]
- Li, Q.; Yao, N.; Zhao, J.; Zhang, Y. Self attention mechanism of bidirectional information enhancement. Appl. Intell. 2022, 52, 2530–2538. [Google Scholar] [CrossRef]
- Shen, X.; Han, D.; Guo, Z.; Chen, C.; Hua, J.; Luo, G. Local self-attention in transformer for visual question answering. Appl. Intell. 2023, 53, 16706–16723. [Google Scholar] [CrossRef]
- Wang, Y.; Yang, G.; Li, S.; Li, Y.; He, L.; Liu, D. Arrhythmia classification algorithm based on multi-head self-attention mechanism. Biomed. Signal Process. Control 2023, 79, 104206. [Google Scholar] [CrossRef]
- Wang, J.; Zang, J.; Yao, S.; Zhang, Z.; Xue, C. Multiclassification for heart sound signals under multiple networks and multi-view feature. Measurement 2024, 225, 114022. [Google Scholar] [CrossRef]
- Kang, H.; Wang, X.; Sun, Y.; Li, S.; Sun, X.; Li, F.; Hou, C.; Lam, S.K.; Zhang, W.; Zheng, Y.P. Automatic Transcranial Sonography-Based Classification of Parkinson’s Disease Using a Novel Dual-Channel CNXV2-DANet. Bioengineering 2024, 11, 889. [Google Scholar] [CrossRef] [PubMed]
- Gour, N.; Khanna, P. Multi-class multi-label ophthalmological disease detection using transfer learning based convolutional neural network. Biomed. Signal Process. Control 2021, 66, 102329. [Google Scholar] [CrossRef]
- Huang, Y.; Zhang, R.; Li, H.; Xia, Y.; Yu, X.; Liu, S.; Yang, Y. A multi-label learning prediction model for heart failure in patients with atrial fibrillation based on expert knowledge of disease duration. Appl. Intell. 2023, 53, 20047–20058. [Google Scholar] [CrossRef]
- Li, Y.; Chen, Z.; Zhang, F.; Wei, Z.; Huang, Y.; Chen, C.; Zheng, Y.; Wei, Q.; Sun, H.; Chen, F. Research on detection of potato varieties based on spectral imaging analytical algorithm. Spectrochim. Acta Part A Mol. Biomol. Spectrosc. 2024, 311, 123966. [Google Scholar] [CrossRef] [PubMed]
- Ren, R.; Niu, S.; Jin, J.; Zhang, J.; Ren, H.; Zhao, X. Multi-scale attention context-aware network for detection and localization of image splicing. Appl. Intell. 2023, 53, 18219–18238. [Google Scholar] [CrossRef]
- Roshan, S.; Tanha, J.; Zarrin, M.; Babaei, A.F.; Nikkhah, H.; Jafari, Z. A deep ensemble medical image segmentation with novel sampling method and loss function. Comput. Biol. Med. 2024, 172, 108305. [Google Scholar] [CrossRef]
- Liu, H.; Liu, F.; Fan, X.; Huang, D. Polarized self-attention: Towards high-quality pixel-wise mapping. Neurocomputing 2022, 506, 158–167. [Google Scholar] [CrossRef]
- Qin, X.; Cai, R.; Yu, J.; He, C.; Zhang, X. An efficient self-attention network for skeleton-based action recognition. Sci. Rep. 2022, 12, 4111. [Google Scholar] [CrossRef]
- Yu, X.; Wang, J.; Hong, Q.Q.; Teku, R.; Wang, S.H.; Zhang, Y.D. Transfer learning for medical images analyses: A survey. Neurocomputing 2022, 489, 230–254. [Google Scholar] [CrossRef]
- Yeung, M.; Sala, E.; Schönlieb, C.B.; Rundo, L. Unified Focal loss: Generalising Dice and cross entropy-based losses to handle class imbalanced medical image segmentation. Comput. Med. Imaging Graph. 2022, 95, 102026. [Google Scholar] [CrossRef] [PubMed]
- Priya, K.V.; Peter, J.D. A federated approach for detecting the chest diseases using DenseNet for multi-label classification. Complex Intell. Syst. 2022, 8, 3121–3129. [Google Scholar] [CrossRef]
- Albahli, S.; Rauf, H.T.; Algosaibi, A.; Balas, V.E. AI-driven deep CNN approach for multi-label pathology classification using chest X-Rays. PeerJ Comput. Sci. 2021, 7, e495. [Google Scholar] [CrossRef] [PubMed]
- Perumal, V.; Narayanan, V.; Rajasekar, S.J.S. Detection of COVID-19 using CXR and CT images using Transfer Learning and Haralick features. Appl. Intell. 2021, 51, 341–358. [Google Scholar] [CrossRef] [PubMed]
- Chen, K.; Wang, X.; Zhang, S. Thorax Disease Classification Based on Pyramidal Convolution Shuffle Attention Neural Network. IEEE Access 2022, 10, 85571–85581. [Google Scholar] [CrossRef]
- Irtaza, M.; Ali, A.; Gulzar, M.; Wali, A. Multi-Label Classification of Lung Diseases Using Deep Learning. IEEE Access 2024, 12, 124062–124080. [Google Scholar] [CrossRef]
- Li, D.; Huo, H.; Jiao, S.; Sun, X.; Chen, S. Automated thorax disease diagnosis using multi-branch residual attention network. Sci. Rep. 2024, 14, 11865. [Google Scholar] [CrossRef]
- Kufel, J.; Bielówka, M.; Rojek, M.; Mitręga, A.; Lewandowski, P.; Cebula, M.; Krawczyk, D.; Bielówka, M.; Kondoł, D.; Bargieł-Łączek, K.; et al. Multi-Label Classification of Chest X-ray Abnormalities Using Transfer Learning Techniques. J. Pers. Med. 2023, 13, 1426. [Google Scholar] [CrossRef]
- Chehade, H.; Abdallah, N.; Marion, J.M.; Hatt, M.; Oueidat, M.; Chauvet, P. Reconstruction-based approach for chest X-ray image segmentation and enhanced multi-label chest disease classification. Artif. Intell. Med. 2025, 165, 103135. [Google Scholar] [CrossRef]
- Dong, N.; Kampffmeyer, M.; Su, H.; Xing, E. An exploratory study of self-supervised pre-training on partially supervised multi-label classification on chest X-ray images. Appl. Soft Comput. 2024, 163, 111855. [Google Scholar] [CrossRef]
- Chae, G.; Lee, J.; Kim, S.B. Contrastive learning with hard negative samples for chest X-ray multi-label classification. Appl. Soft Comput. 2024, 165, 112101. [Google Scholar] [CrossRef]
- Verma, S.S.; Prasad, A.; Kumar, A. CovXmlc: High performance COVID-19 detection on X-ray images using multi-model classification. Biomed. Signal Process. Control 2022, 71, 103272. [Google Scholar] [CrossRef]
- Cheng, Y.C.; Hung, Y.C.; Huang, G.H.; Chen, T.B.; Lu, N.H.; Liu, K.Y.; Lin, K.H. Deep Learning–Based Object Detection Strategies for Disease Detection and Localization in Chest X-Ray Images. Diagnostics 2024, 14, 2636. [Google Scholar] [CrossRef]
- Fan, W.; Yang, Y.; Qi, J.; Zhang, Q.; Liao, C.; Wen, L.; Wang, S.; Wang, G.; Xia, Y.; Wu, Q.; et al. A Deep-Learning-Based Framework for Identifying and Localizing Chest Abnormalities. Nat. Commun. 2024, 15, 5599. [Google Scholar] [CrossRef]
- Iqbal, H.; Khan, A.; Nepal, N.; Khan, F.; Moon, Y.K. Deep Learning Approaches for Chest Radiograph Interpretation: A Survey. Electronics 2024, 13, 4688. [Google Scholar] [CrossRef]
- Oltu, B.; Güney, S.; Esen Yuksel, S.; Dengiz, B. Automated classification of chest X-rays: A deep learning approach with attention mechanisms. BMC Med. Imaging 2025, 25, 71. [Google Scholar] [CrossRef] [PubMed]
- Alam, M.S.; Wang, D.; Sowmya, A. DLA-Net: Dual lesion attention network for classification of pneumoconiosis using chest X-ray images. Sci. Rep. 2024, 14, 11616. [Google Scholar] [CrossRef]
- Zhang, N.; Liu, Z.; Zhang, E.; Chen, Y.; Yue, J. An ESG-ConvNeXt network for steel surface defect classification based on hybrid attention mechanism. Sci. Rep. 2025, 15, 10926. [Google Scholar] [CrossRef] [PubMed]
- Li, J.; Li, P.; Hu, X.; Yu, K. Learning common and label-specific features for multi-Label classification with correlation information. Pattern Recognit. 2022, 121, 108259. [Google Scholar] [CrossRef]
- Han, M.; Wu, H.; Chen, Z.; Li, M.; Zhang, X. A survey of multi-label classification based on supervised and semi-supervised learning. Int. J. Mach. Learn. Cybern. 2023, 14, 697–724. [Google Scholar] [CrossRef]
- Liu, Y.; Xing, W.; Zhao, M.; Lin, M. A new classification method for diagnosing COVID-19 pneumonia based on joint CNN features of chest X-ray images and parallel pyramid MLP-Mixer module. Neural Comput. Appl. 2023, 35, 17187–17199. [Google Scholar] [CrossRef] [PubMed]
- Azad, R.; Kazerouni, A.; Heidari, M.; Aghdam, E.K.; Molaei, A.; Jia, Y.; Jose, A.; Roy, R.; Merhof, D. Advances in Medical Image Analysis with Vision Transformers: A Comprehensive Review. Med. Image Anal. 2024, 91, 103000. [Google Scholar] [CrossRef] [PubMed]
- Chen, J.; Er, M.J. Dynamic YOLO for Small Underwater Object Detection. Artif. Intell. Rev. 2024, 57, 165. [Google Scholar] [CrossRef]
Disclaimer/Publisher’s Note: The statements, opinions and data contained in all publications are solely those of the individual author(s) and contributor(s) and not of MDPI and/or the editor(s). MDPI and/or the editor(s) disclaim responsibility for any injury to people or property resulting from any ideas, methods, instructions or products referred to in the content. |
© 2025 by the authors. Licensee MDPI, Basel, Switzerland. This article is an open access article distributed under the terms and conditions of the Creative Commons Attribution (CC BY) license (https://creativecommons.org/licenses/by/4.0/).