Dread Disease and Cause-Specific Mortality: Exploring New Forms of Insured Loans


Abstract
1. Introduction
2. Standard Insured Loan Contract
Insured Loan: Installment and Actuarial Premium Analysis
3. Cause of Death and Diagnosis Event: Impact on Loan Repayment
- (1)
- if a critical illness is diagnosed, the affected individual could be unable to completely or partially perform the engagements in his working activity, and in the specific case of the onset during the loan duration, this could involve the inability to fulfil the obligation as expected. In the basic critical illness insurance (cf. Haberman and Pitacco 1998), the insurer pays a lump sum upon the occurrence or diagnosis of the pre-specified dread diseases. Typically, the contractual options within the critical illness general scheme are the Stand Alone and the Accelerated. The first covers the insured just in case of diagnosis of illnesses, while the second guarantees payments in case of illness and in case of death.
- (2)
- within the traditional insured loan contract (setting the coverage in case of the borrower’s death), we will study the case of a death-specific cause. In the basic n-year term insurance, insertable in the loan amortization process, the insurer pays the benefit if the insurer dies within the n (or h ≤ n) years of the loan duration, with no specifications about the death cause. In the following, the n-year term insurance will be studied with regard to a specific death cause.
3.1. New Proposals for Insured Loans
4. Numerical Applications
4.1. Data Source
4.2. Actuarial Premiums
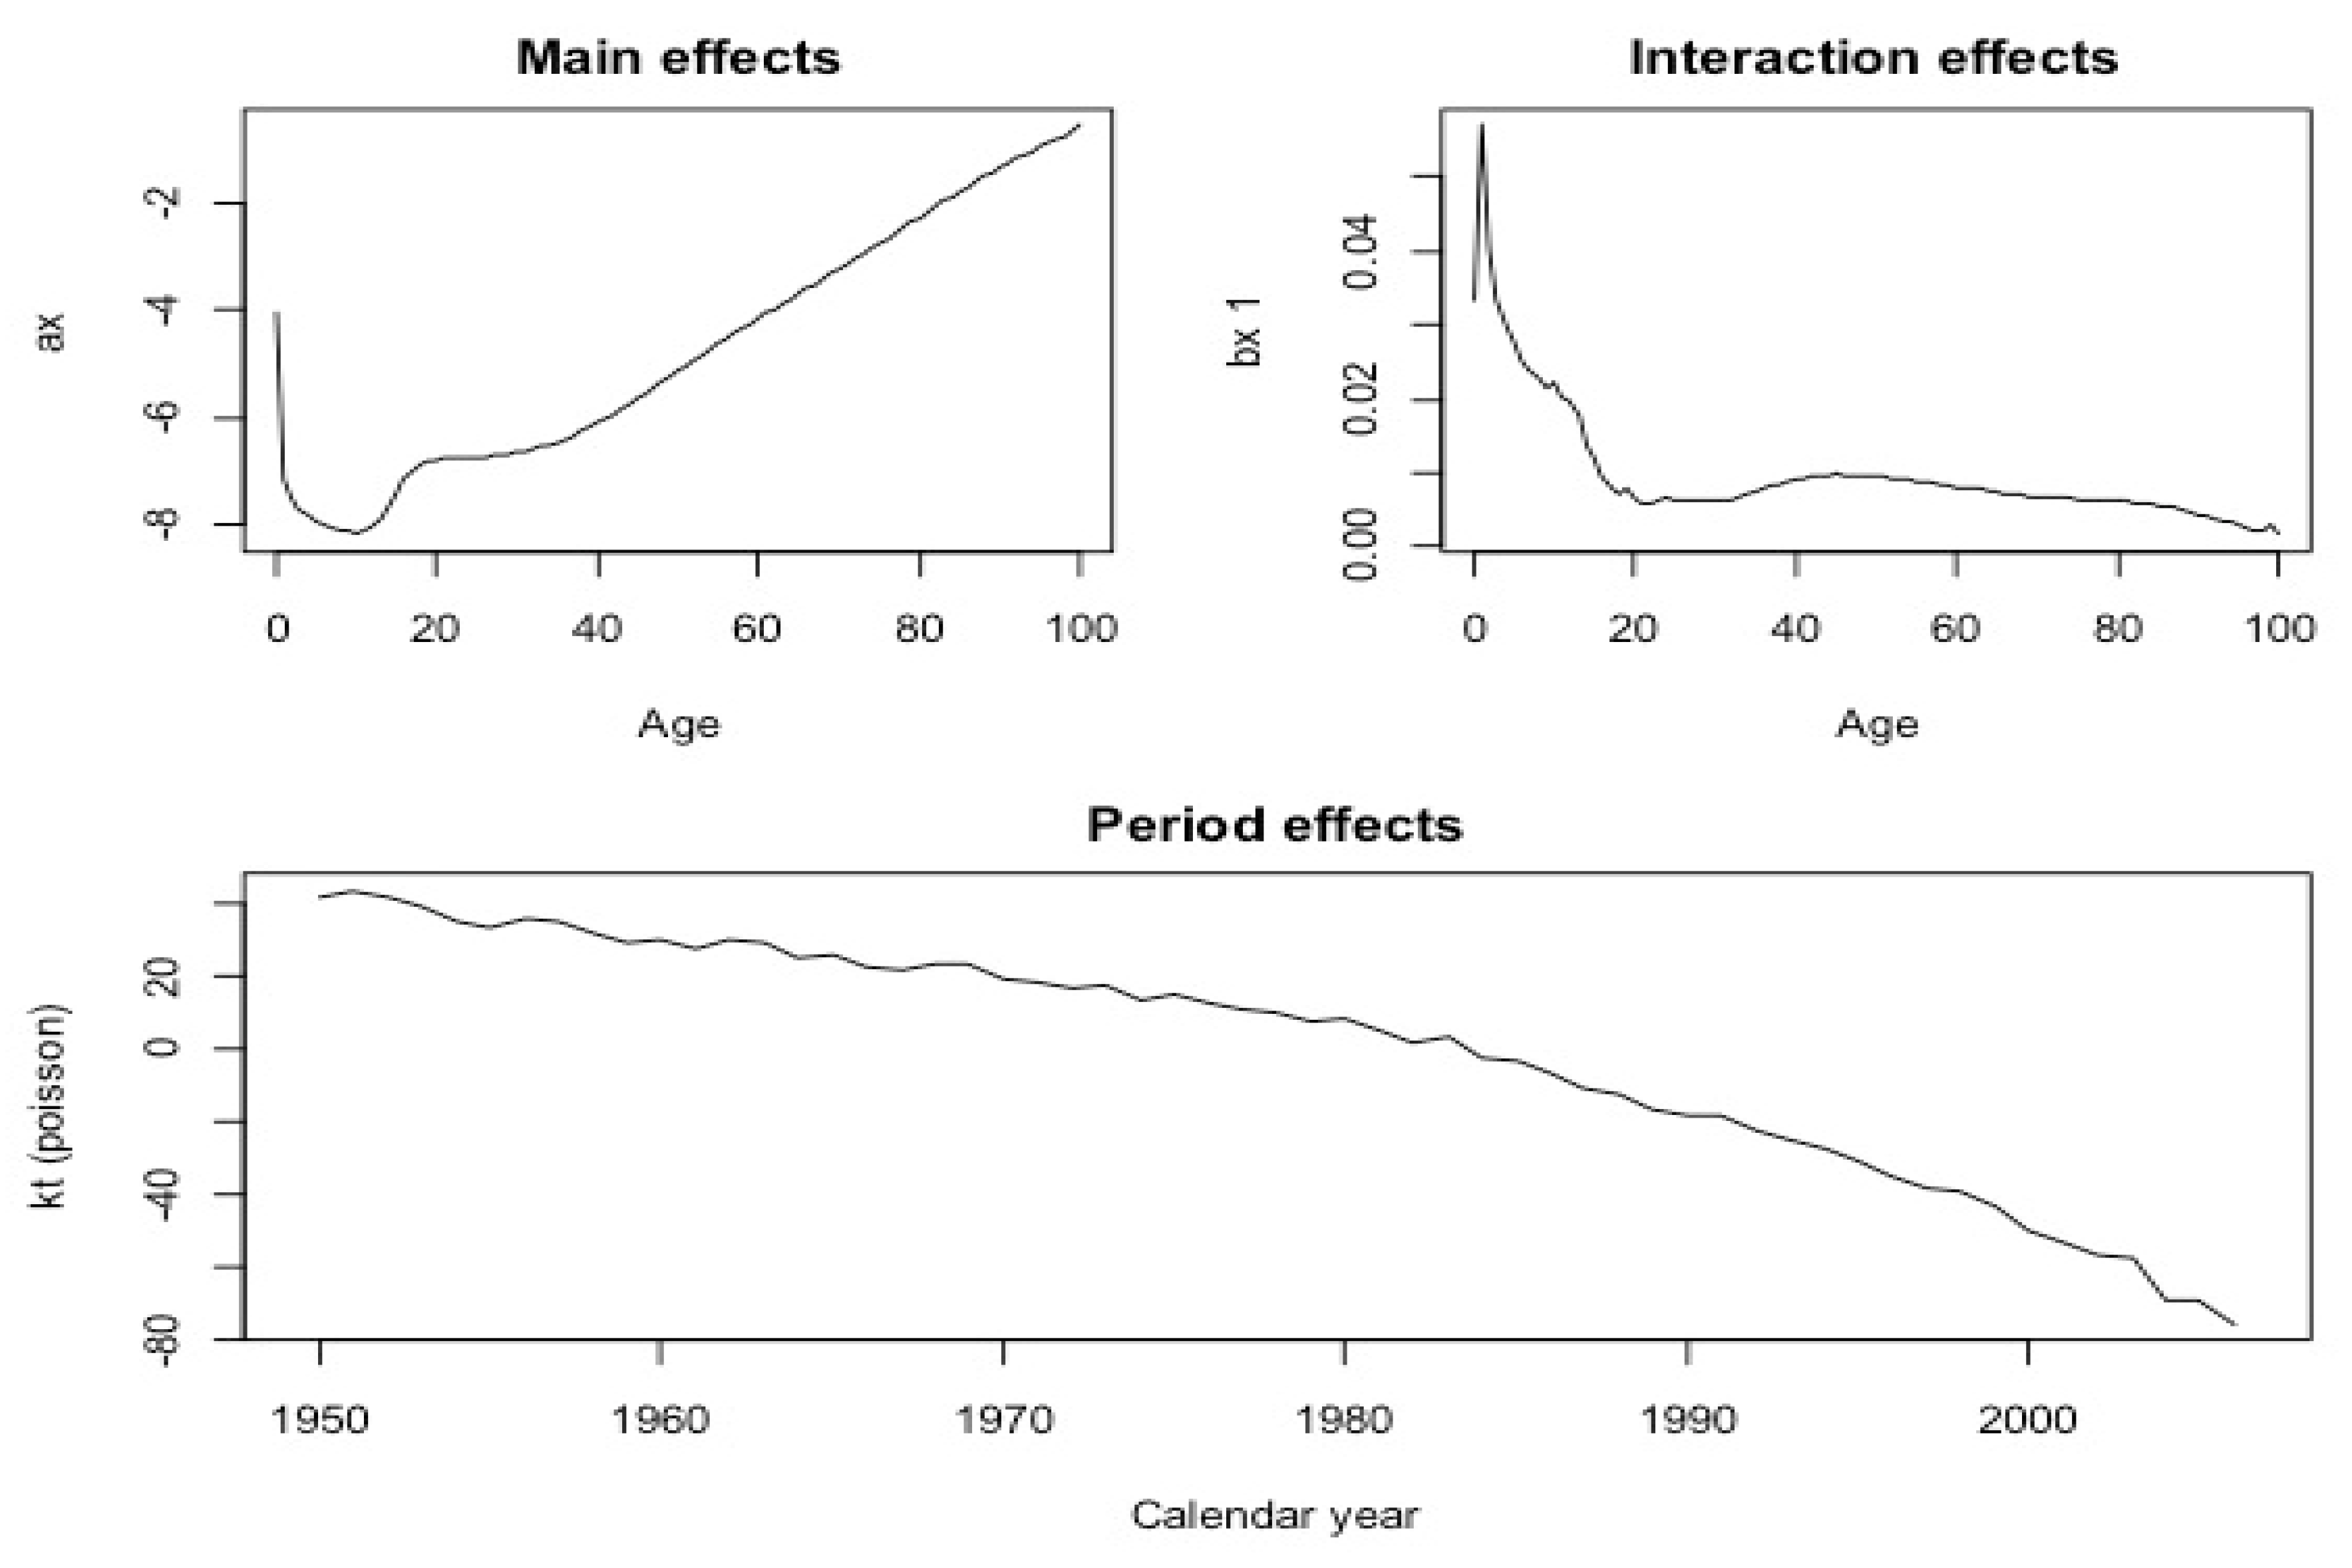
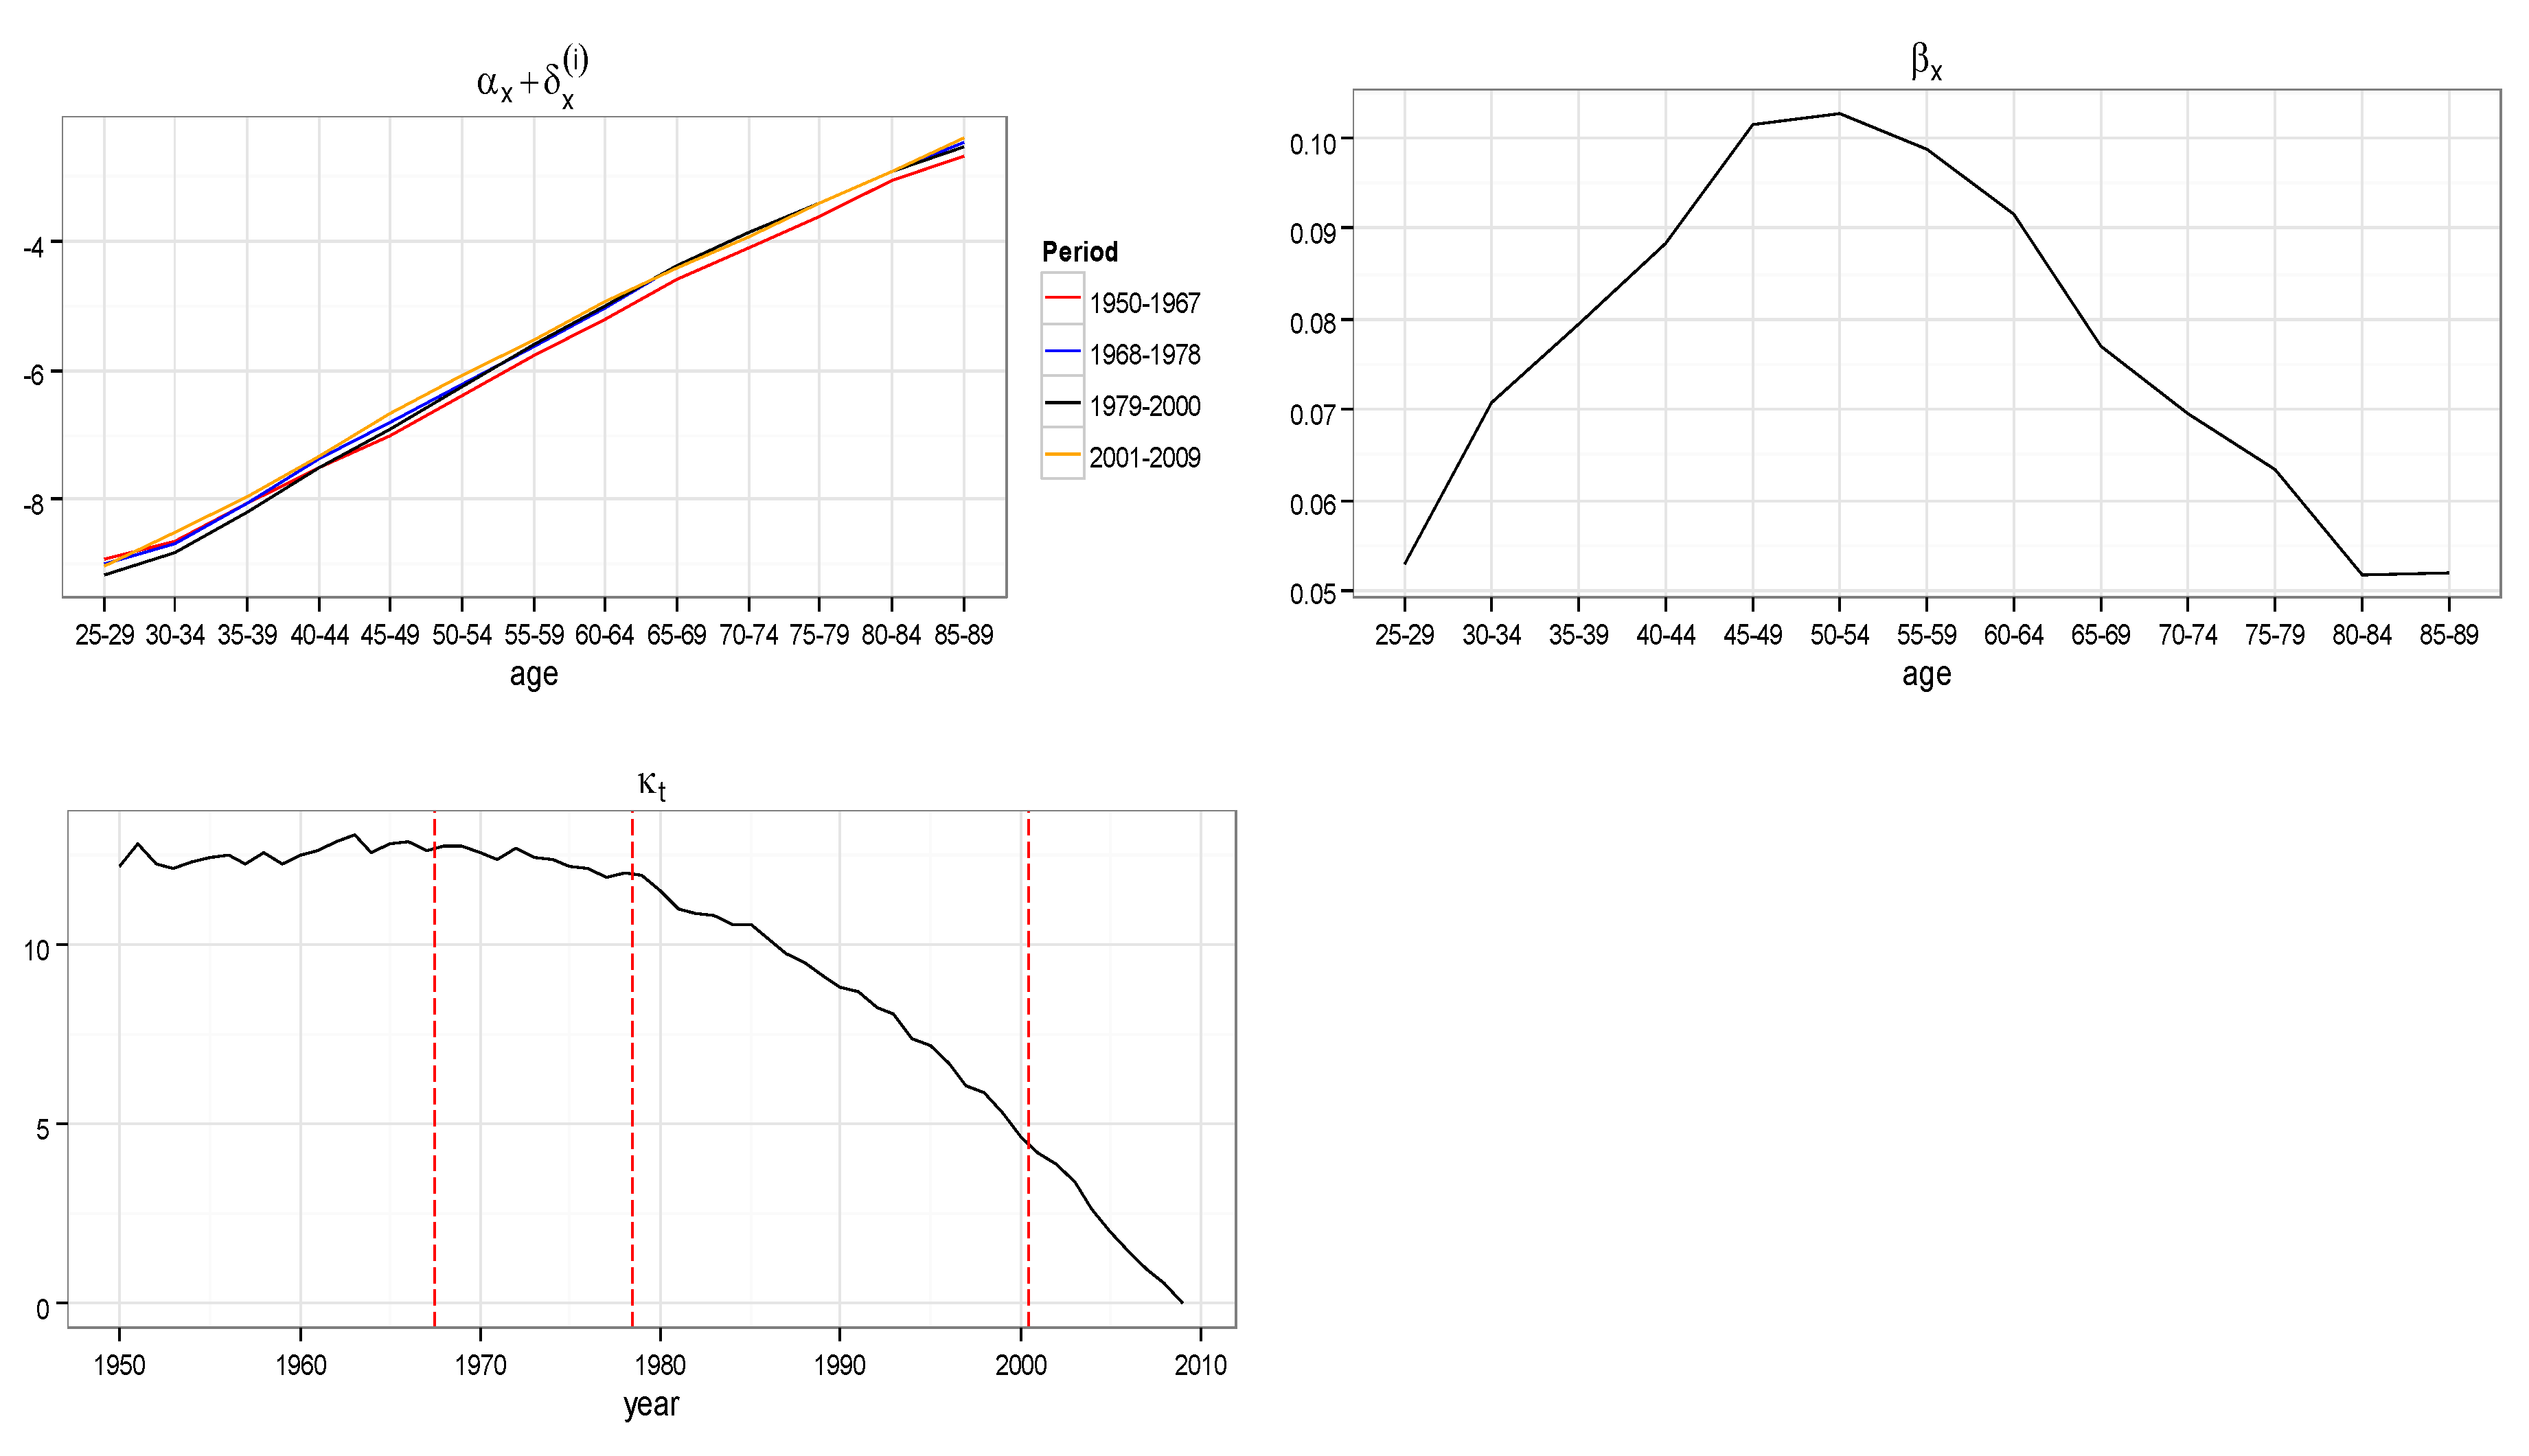
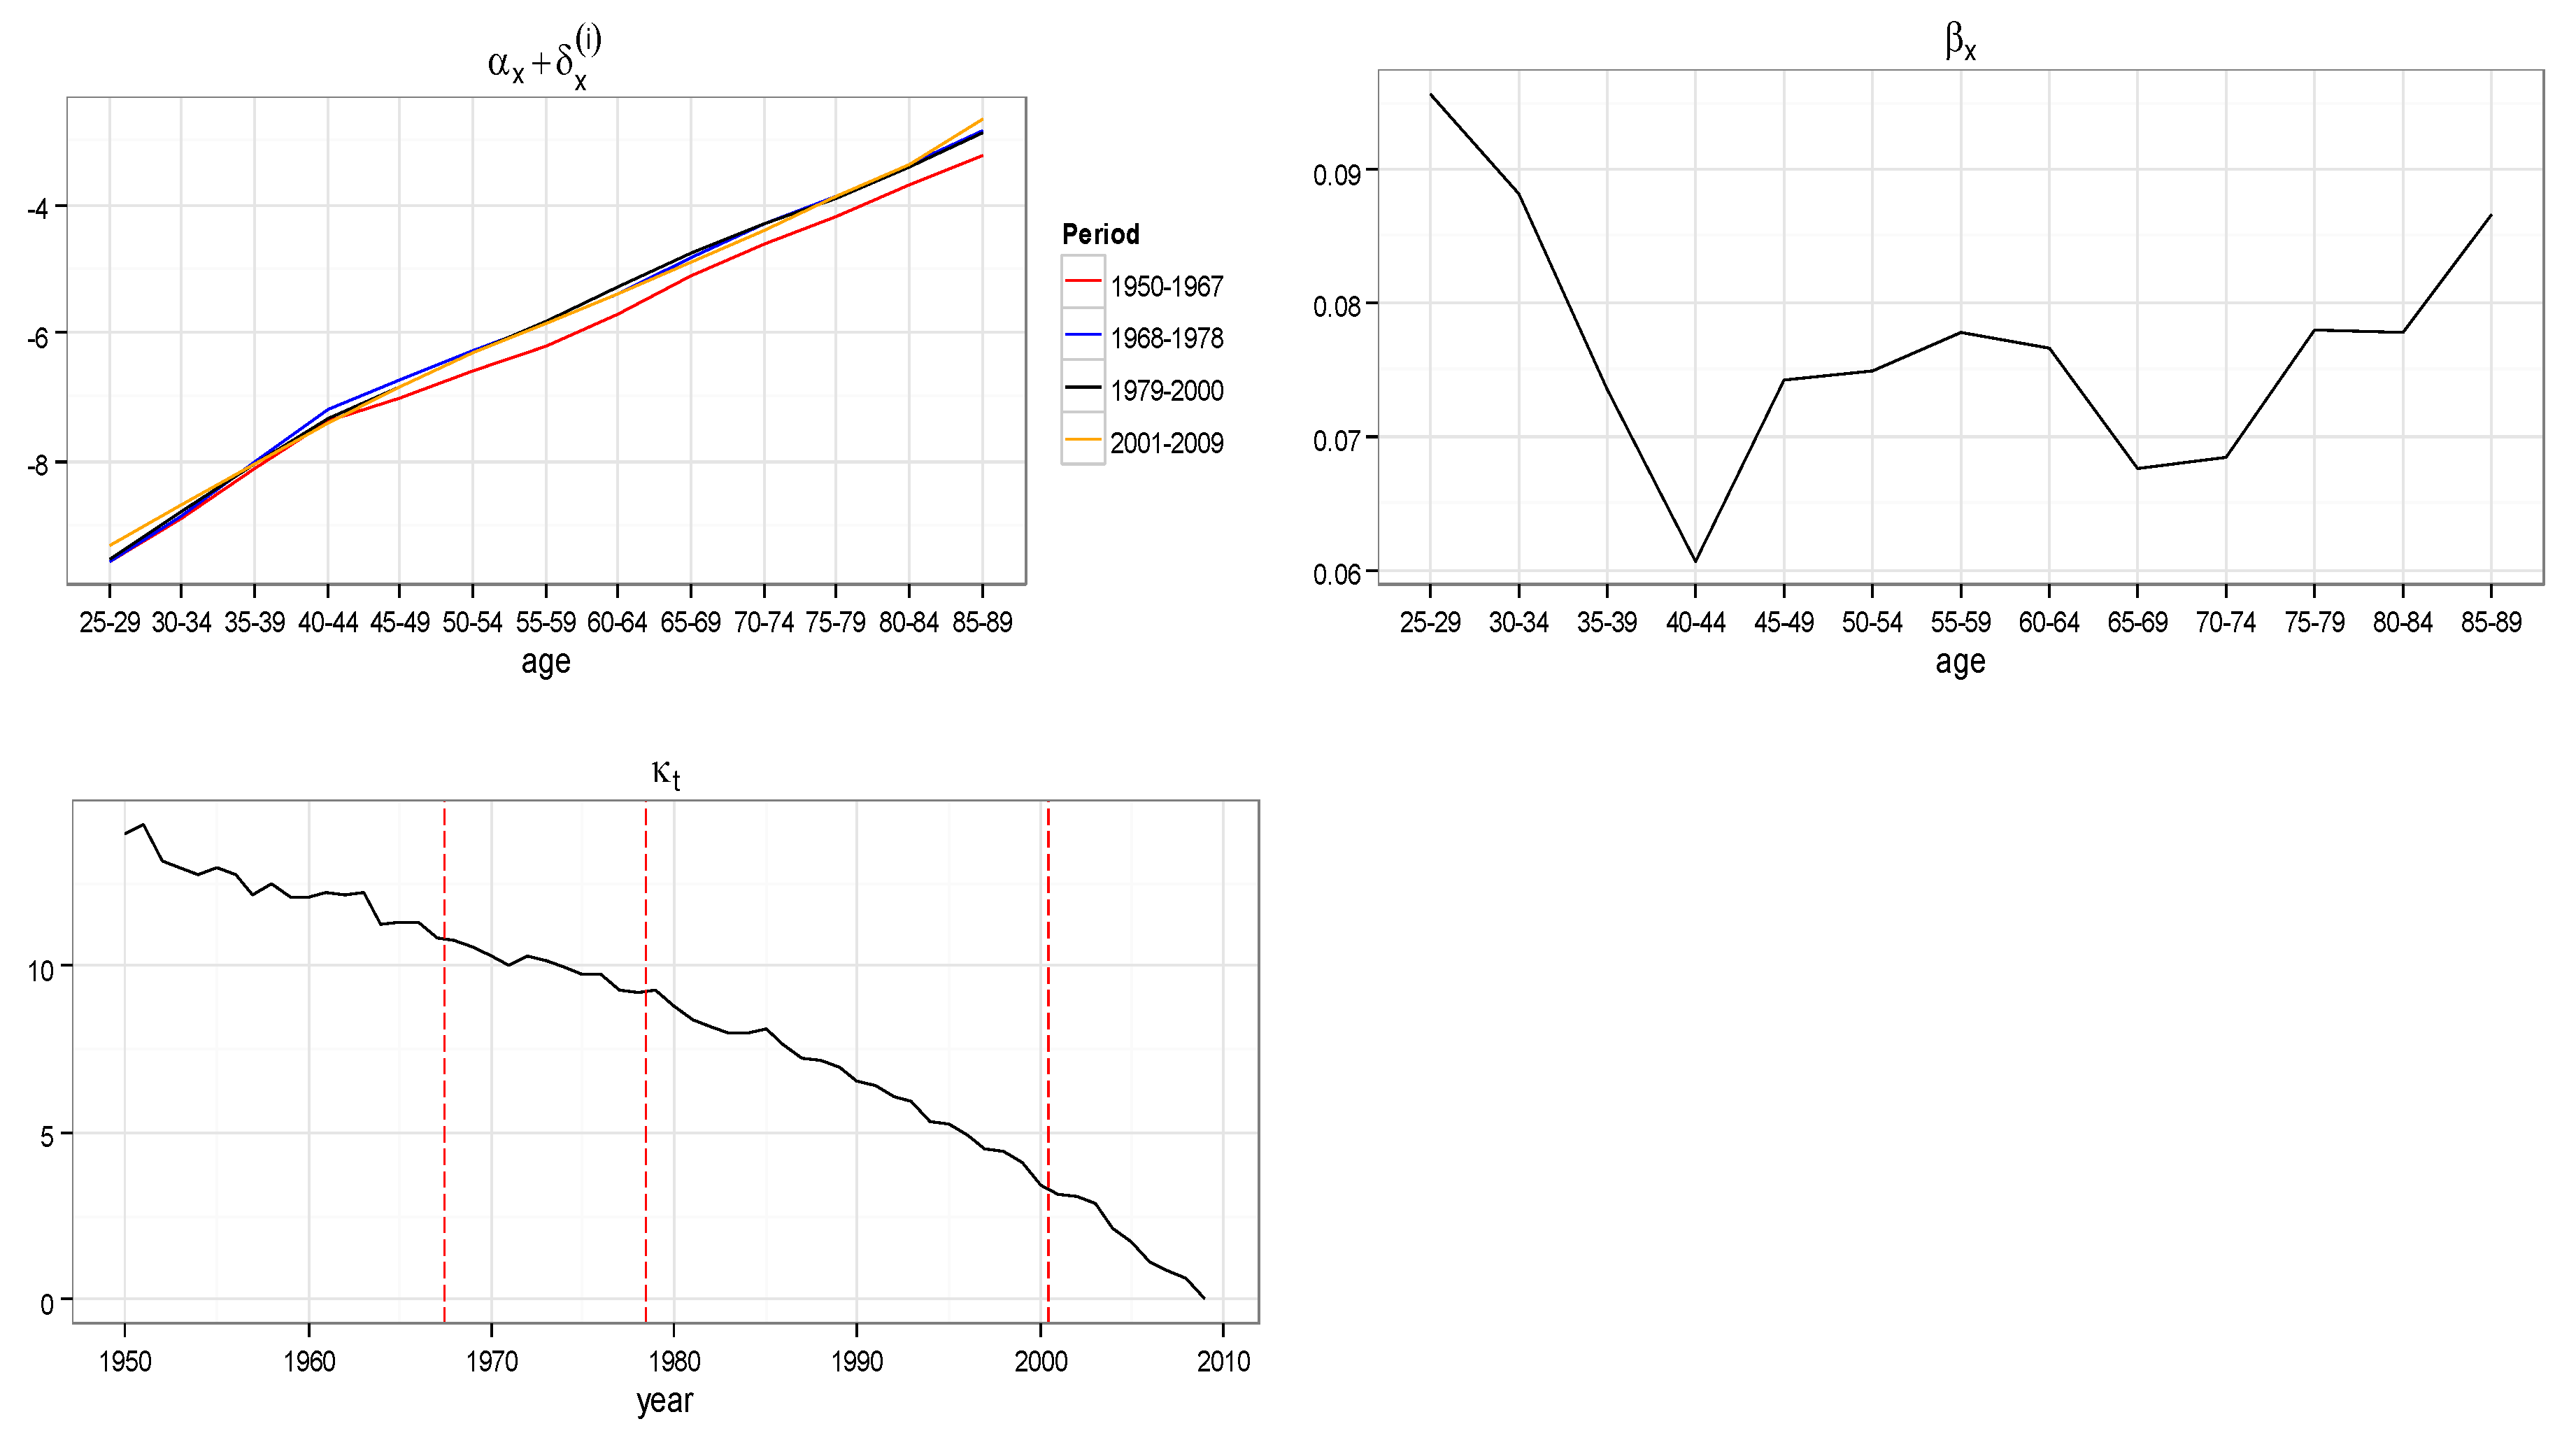
- is the age-specific death rate for age and year
- is the average age-specific mortality
- is the mortality index in year , capturing the underlying mortality trend
- is the deviation in mortality due to changes in the index
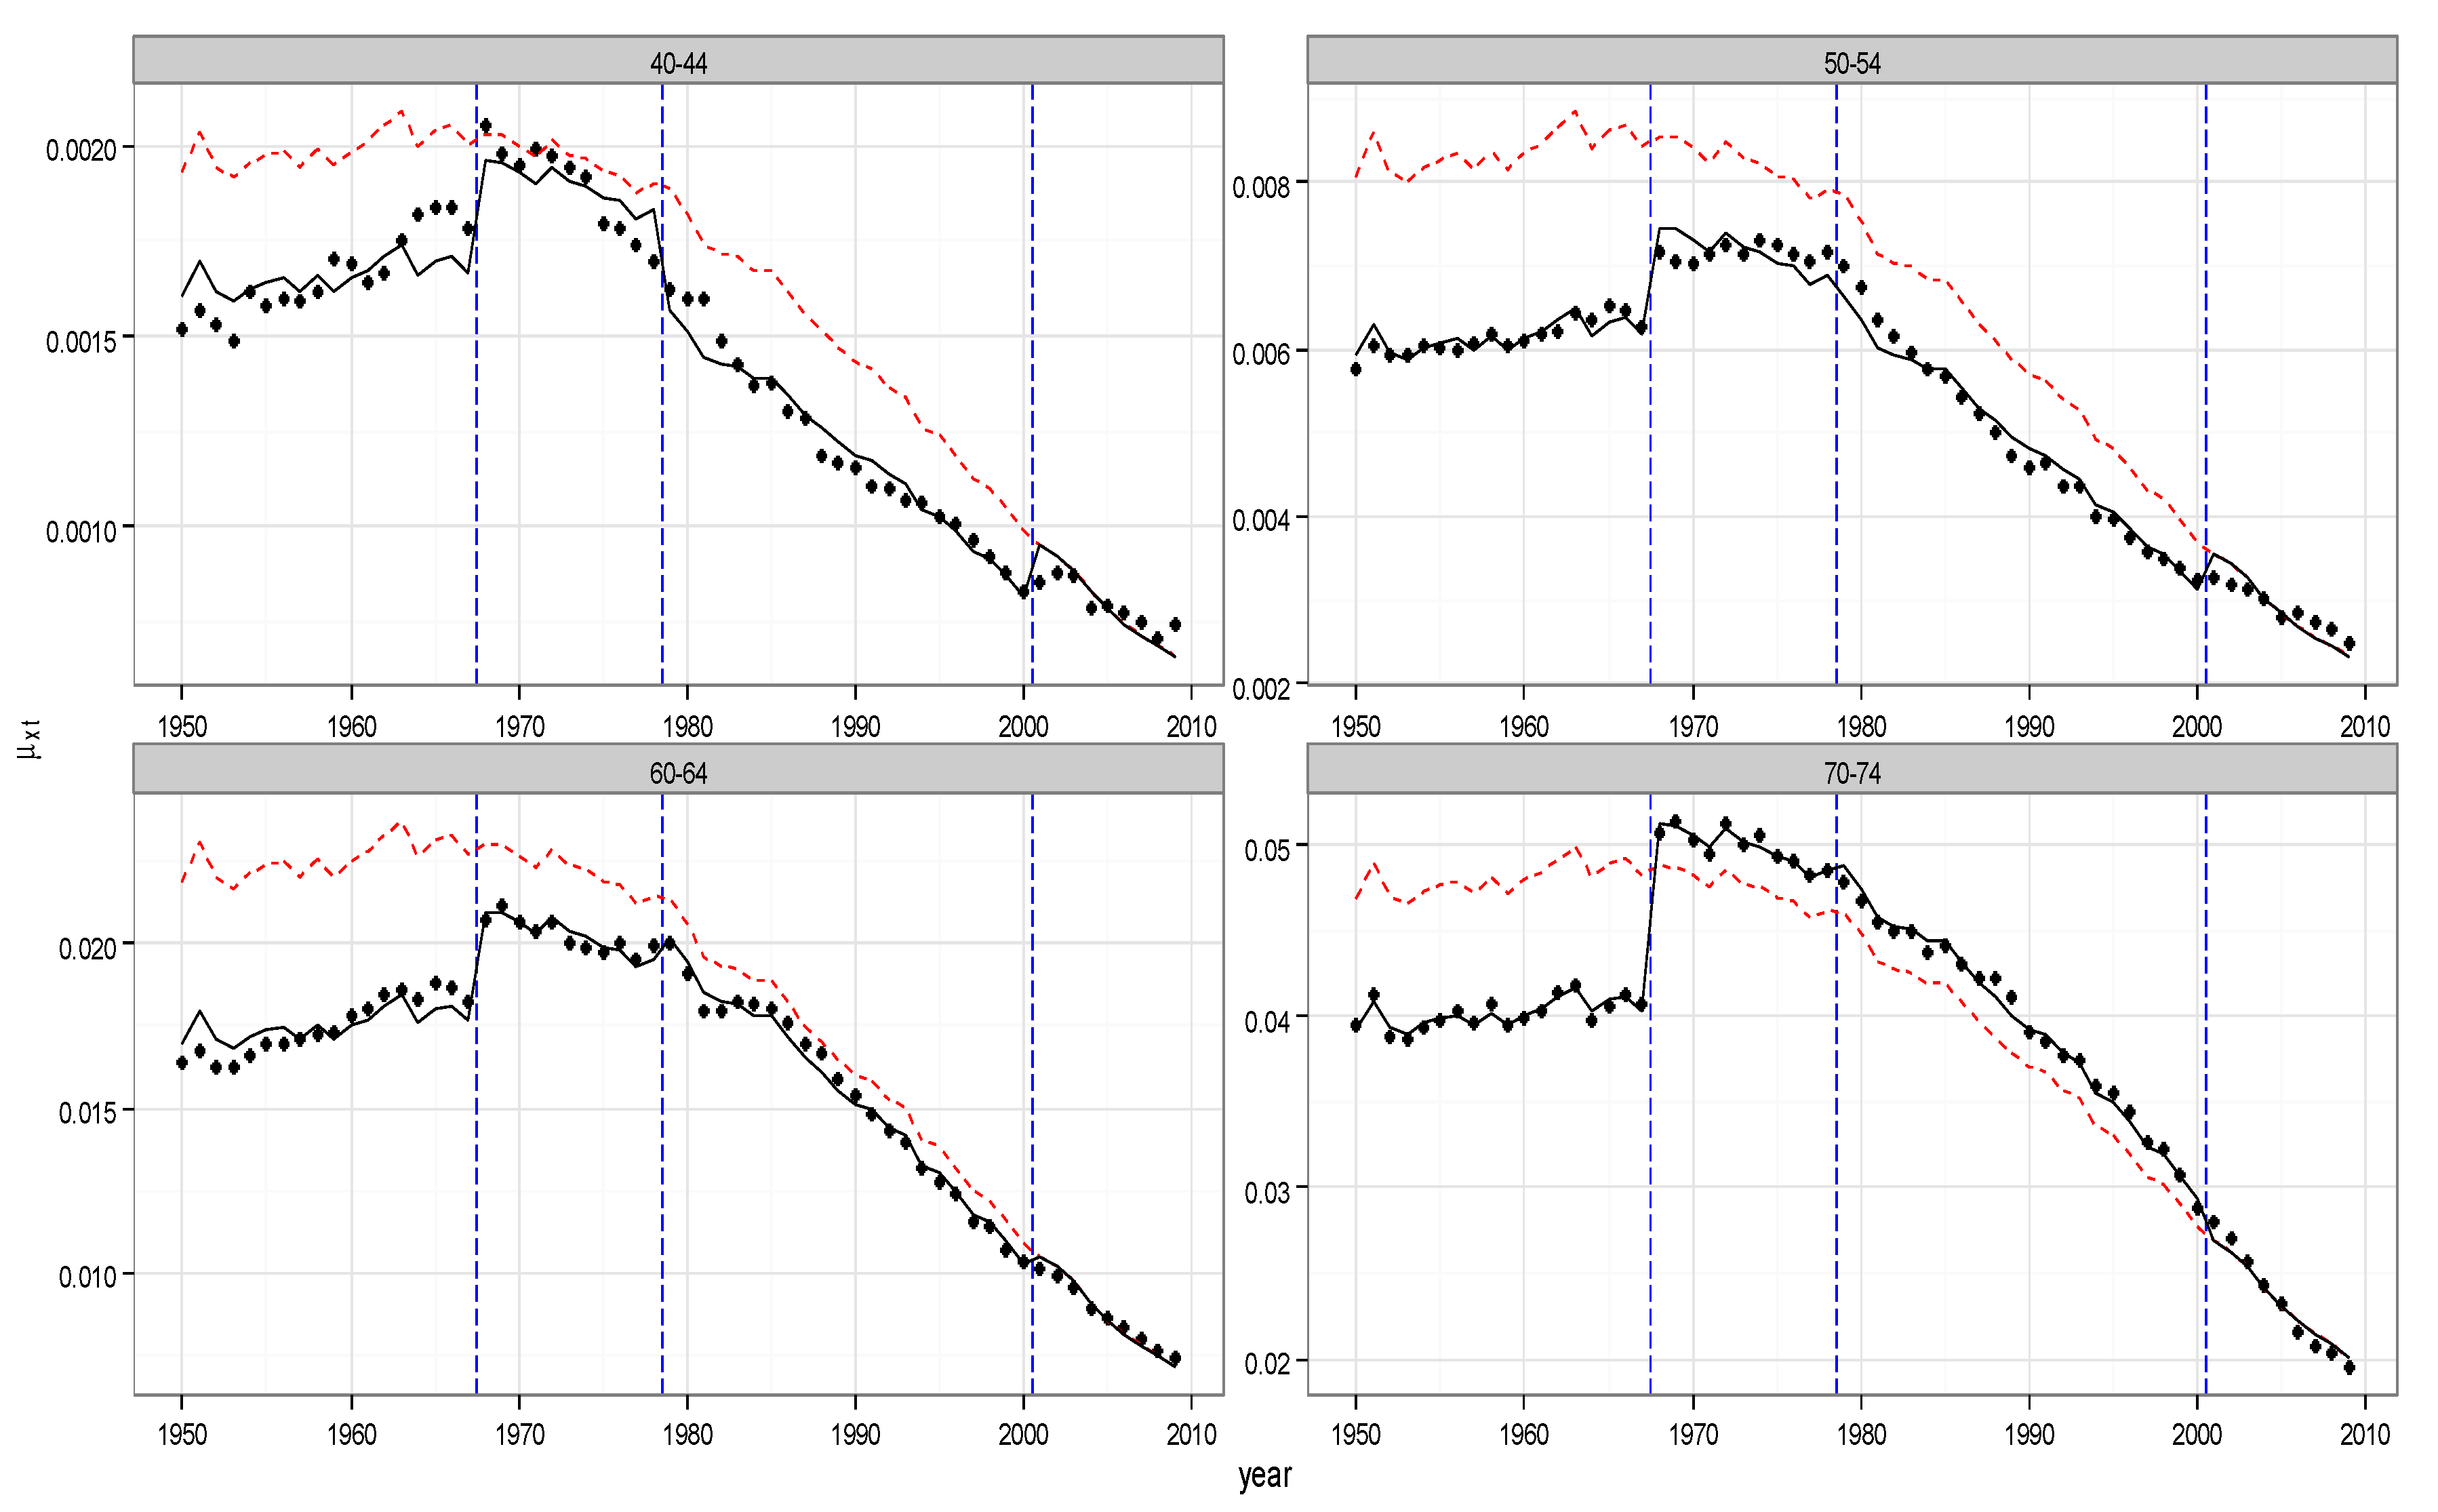
4.3. Empirical Evidence and Illustrations
5. Amortization Schedule
6. Future Developments
7. Conclusions
Author Contributions
Conflicts of Interest
Appendix A

| 2010 | … | 2014 | 2015 | 2016 | 2017 | 2018 | … | 2031 | |
|---|---|---|---|---|---|---|---|---|---|
| 0 | 1 | 1 | 1 | 1 | 1 | 1 | 1 | ||
| 1 | 0.99795810 | 0.99811926 | 0.99819502 | 0.99826773 | 0.99833752 | 0.99840450 | 0.99906537 | ||
| 2 | 0.99788077 | 0.99805063 | 0.99813036 | 0.99820681 | 0.99828012 | 0.99835043 | 0.99904047 | ||
| 3 | 0.99782942 | 0.9980047 | 0.99808692 | 0.99816572 | 0.99824127 | 0.99831367 | 0.99902266 | ||
| 4 | 0.99778646 | 0.99796608 | 0.99805031 | 0.99813102 | 0.99820837 | 0.99828249 | 0.99900709 | ||
| 5 | 0.99775184 | 0.99793496 | 0.99802079 | 0.99810304 | 0.99818183 | 0.99825732 | 0.99899449 | ||
| 6 | 0.99772249 | 0.99790862 | 0.99799584 | 0.99807939 | 0.99815943 | 0.99823610 | 0.99898397 | ||
| 7 | 0.99769303 | 0.99788201 | 0.99797056 | 0.99805537 | 0.9981366 | 0.99821441 | 0.99897281 | ||
| 8 | 0.99766699 | 0.99785847 | 0.99794818 | 0.99803409 | 0.99811637 | 0.99819517 | 0.99896282 | ||
| 9 | 0.99763957 | 0.99783355 | 0.99792442 | 0.99801144 | 0.99809478 | 0.99817459 | 0.99895178 | ||
| 10 | 0.99761075 | 0.99780725 | 0.99789929 | 0.99798743 | 0.99807184 | 0.99815267 | 0.99893967 | ||
| 11 | 0.99758016 | 0.99777923 | 0.99787248 | 0.99796178 | 0.99804729 | 0.99812918 | 0.99892643 | ||
| 12 | 0.99754836 | 0.99775006 | 0.99784454 | 0.99793502 | 0.99802166 | 0.99810463 | 0.99891241 | ||
| 13 | 0.99751107 | 0.99771576 | 0.99781165 | 0.99790347 | 0.99799141 | 0.99807562 | 0.99889559 | ||
| 14 | 0.99747332 | 0.9976811 | 0.99777843 | 0.99787164 | 0.99796091 | 0.99804640 | 0.99887881 | ||
| 15 | 0.99742903 | 0.99764036 | 0.99773936 | 0.99783417 | 0.99792497 | 0.99801192 | 0.99885878 | ||
| 16 | 0.99737869 | 0.99759407 | 0.99769497 | 0.99779161 | 0.99788416 | 0.99797280 | 0.99883613 | ||
| 17 | 0.99731077 | 0.99753134 | 0.99763468 | 0.99773366 | 0.99782847 | 0.99791927 | 0.99880419 | ||
| 18 | 0.99722830 | 0.99745492 | 0.99756112 | 0.99766285 | 0.99776031 | 0.99785366 | 0.99876423 | ||
| 19 | 0.99714271 | 0.99737569 | 0.99748489 | 0.99758951 | 0.99768974 | 0.99778577 | 0.99872315 | ||
| 20 | 0.99705831 | 0.99729773 | 0.99740997 | 0.99751750 | 0.99762054 | 0.99771926 | 0.99868348 | ||
| 21 | 0.99697627 | 0.99722208 | 0.99733733 | 0.99744775 | 0.99755356 | 0.99765494 | 0.99864554 | ||
| 22 | 0.99689338 | 0.99714573 | 0.99726405 | 0.99737743 | 0.99748607 | 0.99759018 | 0.99860761 | ||
| 23 | 0.99681227 | 0.99707111 | 0.99719248 | 0.99730878 | 0.99742023 | 0.99752702 | 0.99857091 | ||
| 24 | 0.99672828 | 0.99699382 | 0.99711834 | 0.99723766 | 0.997352 | 0.99746158 | 0.99853281 | ||
| 25 | 0.99664210 | 0.99691451 | 0.99704225 | 0.99716467 | 0.99728198 | 0.99739440 | 0.99849367 | ||
| 26 | 0.99655018 | 0.99682981 | 0.99696095 | 0.99708662 | 0.99720706 | 0.99732249 | 0.99845146 | ||
| 27 | 0.99644705 | 0.99673452 | 0.99686935 | 0.99699858 | 0.99712244 | 0.99724115 | 0.99840284 | ||
| 28 | 0.99633667 | 0.9966324 | 0.99677112 | 0.99690410 | 0.99703156 | 0.99715374 | 0.99835014 | ||
| 29 | 0.99621751 | 0.99652201 | 0.99666488 | 0.99680184 | 0.99693314 | 0.99705902 | 0.99829257 | ||
| 30 | 0.99608647 | 0.9964004 | 0.99654773 | 0.99668898 | 0.99682442 | 0.99695428 | 0.99822816 | ||
| 31 | 0.99593859 | 0.99626279 | 0.99641498 | 0.99656093 | 0.9967009 | 0.99683513 | 0.99815359 | ||
| 32 | 0.99577290 | 0.99610811 | 0.99626553 | 0.99641654 | 0.99656139 | 0.99670034 | 0.99806744 | ||
| 33 | 0.99558589 | 0.9959333 | 0.99609653 | 0.99625314 | 0.99640342 | 0.99654762 | 0.99796904 | ||
| 34 | 0.99537487 | 0.99573548 | 0.99590499 | 0.99606769 | 0.99622386 | 0.99637376 | 0.99785486 | ||
| 35 | 0.99513320 | 0.99550842 | 0.99568490 | 0.99585436 | 0.99601708 | 0.99617334 | 0.99772134 | ||
| 36 | 0.99485874 | 0.99524996 | 0.99543409 | 0.99561098 | 0.99578092 | 0.99594417 | 0.99756640 | ||
| 37 | 0.99455463 | 0.9949632 | 0.99515564 | 0.99534059 | 0.99551836 | 0.99568922 | 0.99739254 | ||
| 38 | 0.99420388 | 0.99463155 | 0.99483315 | 0.99502701 | 0.99521344 | 0.99539273 | 0.99718670 | ||
| 39 | 0.99381175 | 0.99426049 | 0.99447220 | 0.99467590 | 0.9948719 | 0.99506051 | 0.99695491 | ||
| 40 | 0.99336575 | 0.99383755 | 0.99406034 | 0.99427484 | 0.99448136 | 0.99468021 | 0.99668588 | ||
| 41 | 0.99285110 | 0.99334826 | 0.99358326 | 0.99380967 | 0.99402781 | 0.99423799 | 0.99636780 | ||
| 42 | 0.99225213 | 0.99277684 | 0.99302516 | 0.99326457 | 0.99349541 | 0.99371800 | 0.99598538 | ||
| 43 | 0.99159448 | 0.99215015 | 0.99241340 | 0.99266740 | 0.99291249 | 0.99314899 | 0.99556996 | ||
| 44 | 0.99081453 | 0.99140393 | 0.99168351 | 0.99195348 | 0.9922142 | 0.99246600 | 0.99505818 | ||
| 45 | 0.98992861 | 0.9905546 | 0.99085192 | 0.99113927 | 0.99141701 | 0.99168548 | 0.99446561 | ||
| 46 | 0.98894031 | 0.98960639 | 0.98992315 | 0.99022956 | 0.99052597 | 0.99081274 | 0.99379971 | ||
| 47 | 0.98782421 | 0.98853414 | 0.98887220 | 0.98919949 | 0.98951638 | 0.98982323 | 0.99303823 | ||
| 48 | 0.98656901 | 0.98732712 | 0.98768859 | 0.98803885 | 0.98837828 | 0.98870724 | 0.99217418 | ||
| 49 | 0.98519012 | 0.98600094 | 0.98638802 | 0.98676342 | 0.98712752 | 0.98748068 | 0.99122355 | ||
| 50 | 0.98366870 | 0.98453722 | 0.98495236 | 0.98535529 | 0.98574641 | 0.98612609 | 0.99017169 | ||
| 51 | 0.98190356 | 0.98283487 | 0.98328059 | 0.98371358 | 0.98413423 | 0.98454294 | 0.98892271 | ||
| 52 | 0.97993280 | 0.98092939 | 0.98140698 | 0.98187132 | 0.98232283 | 0.98276190 | 0.98749444 | ||
| 53 | 0.97782204 | 0.97889257 | 0.97940620 | 0.97990596 | 0.9803923 | 0.98086560 | 0.98599321 | ||
| 54 | 0.97547991 | 0.97662921 | 0.97718127 | 0.97771886 | 0.97824239 | 0.97875229 | 0.98430453 | ||
| 55 | 0.97290013 | 0.97413529 | 0.97472925 | 0.97530808 | 0.9758722 | 0.97642204 | 0.98243829 | ||
| 56 | 0.96994278 | 0.97126604 | 0.97190315 | 0.97252451 | 0.97313057 | 0.97372175 | 0.98022474 | ||
| 57 | 0.96679396 | 0.9682163 | 0.96890184 | 0.96957092 | 0.97022399 | 0.97086148 | 0.97790637 | ||
| 58 | 0.96323666 | 0.9647647 | 0.96550201 | 0.96622214 | 0.96692555 | 0.96761268 | 0.97524240 | ||
| 59 | 0.95947439 | 0.96111989 | 0.96191465 | 0.96269139 | 0.96345058 | 0.96419267 | 0.97246654 | ||
| 60 | 0.95522217 | 0.9569942 | 0.95785093 | 0.95868879 | 0.95950826 | 0.96030980 | 0.96928440 | ||
| 61 | 0.95047073 | 0.95237919 | 0.95330281 | 0.95420669 | 0.9550913 | 0.95595712 | 0.96569280 | ||
| 62 | 0.94507434 | 0.9471235 | 0.94811626 | 0.94908848 | 0.95004066 | 0.95097324 | 0.96150779 | ||
| 63 | 0.93946455 | 0.94167678 | 0.94274949 | 0.94380061 | 0.94483063 | 0.94584005 | 0.95728366 | ||
| 64 | 0.93334589 | 0.93573559 | 0.93689532 | 0.93803234 | 0.93914713 | 0.94024020 | 0.95267450 | ||
| 65 | 0.92657832 | 0.92916 | 0.93041393 | 0.93164397 | 0.93285062 | 0.93403438 | 0.94754589 | ||
| 66 | 0.91924913 | 0.92203917 | 0.92339537 | 0.92472639 | 0.92603276 | 0.92731499 | 0.94199659 | ||
| 67 | 0.91082890 | 0.91383141 | 0.91529220 | 0.91672674 | 0.91813553 | 0.91951908 | 0.93542103 | ||
| 68 | 0.90167795 | 0.90491718 | 0.90649447 | 0.90804425 | 0.90956705 | 0.91106338 | 0.92832105 | ||
| 69 | 0.89185340 | 0.89535188 | 0.89705671 | 0.89873266 | 0.90038025 | 0.90200000 | 0.92073958 | ||
| 70 | 0.88104830 | 0.88482782 | 0.88667102 | 0.88848389 | 0.89026697 | 0.89202077 | 0.91237397 | ||
| 71 | 0.86919651 | 0.87327945 | 0.87527213 | 0.87723301 | 0.8791626 | 0.88106143 | 0.90316529 | ||
| 72 | 0.85598530 | 0.86037785 | 0.86252345 | 0.86463597 | 0.86671593 | 0.86876383 | 0.89268634 | ||
| 73 | 0.84187360 | 0.84662331 | 0.84894505 | 0.85123208 | 0.8534849 | 0.85570402 | 0.88170120 | ||
| 74 | 0.82638034 | 0.8315106 | 0.83402026 | 0.83649361 | 0.83893115 | 0.84133336 | 0.86955997 | ||
| 75 | 0.80929585 | 0.81482896 | 0.81753785 | 0.82020895 | 0.82284273 | 0.82543965 | 0.85605208 | ||
| 76 | 0.79076847 | 0.79672358 | 0.79964151 | 0.80252027 | 0.80536032 | 0.80816211 | 0.84129944 | ||
| 77 | 0.77038929 | 0.77678474 | 0.77992122 | 0.78301740 | 0.78607371 | 0.78909054 | 0.82489993 | ||
| 78 | 0.74799462 | 0.75482592 | 0.75817948 | 0.76149212 | 0.76476419 | 0.76799606 | 0.80651527 | ||
| 79 | 0.72380740 | 0.73109609 | 0.73467785 | 0.73821828 | 0.74171767 | 0.74517631 | 0.78657117 | ||
| 80 | 0.69712342 | 0.70485799 | 0.70866322 | 0.71242734 | 0.71615058 | 0.71983316 | 0.76411753 | ||
| 81 | 0.66772006 | 0.67587238 | 0.67988821 | 0.68386399 | 0.68779982 | 0.69169586 | 0.73879752 | ||
| 82 | 0.63545582 | 0.64395923 | 0.64815389 | 0.65231052 | 0.65642918 | 0.66050988 | 0.71014063 | ||
| 83 | 0.60155967 | 0.61042344 | 0.61480215 | 0.61914529 | 0.62345277 | 0.62772452 | 0.67999573 | ||
| 84 | 0.56528931 | 0.57445676 | 0.57899252 | 0.58349601 | 0.58796704 | 0.59240544 | 0.64707466 | ||
| 85 | 0.52770328 | 0.53714656 | 0.54182638 | 0.54647787 | 0.55110071 | 0.55569459 | 0.61266808 | ||
| 86 | 0.48780225 | 0.49740212 | 0.50216796 | 0.50691046 | 0.51162919 | 0.51632372 | 0.57498754 | ||
| 87 | 0.44636057 | 0.45602245 | 0.46082818 | 0.46561635 | 0.47038641 | 0.47513784 | 0.53499785 | ||
| 88 | 0.40406424 | 0.4136591 | 0.41844109 | 0.42321192 | 0.42797096 | 0.43271759 | 0.49303874 | ||
| 89 | 0.36105081 | 0.37042214 | 0.37510264 | 0.37977877 | 0.38444982 | 0.38911512 | 0.44895437 | ||
| 90 | 0.31801456 | 0.32703013 | 0.33154311 | 0.33605858 | 0.34057582 | 0.34509412 | 0.40362342 | ||
| 91 | 0.27546522 | 0.28396717 | 0.28823310 | 0.29250804 | 0.29679128 | 0.30108214 | 0.35724818 | ||
| 92 | 0.23343879 | 0.24120267 | 0.24510735 | 0.24902633 | 0.25295896 | 0.25690461 | 0.30909701 | ||
| 93 | 0.19421147 | 0.2011868 | 0.20470364 | 0.20823917 | 0.21179284 | 0.21536410 | 0.26313644 | ||
| 94 | 0.15789023 | 0.16399508 | 0.16708087 | 0.17018831 | 0.17331696 | 0.17646635 | 0.21908476 | ||
| 95 | 0.12560299 | 0.13081871 | 0.13346195 | 0.13612833 | 0.13881753 | 0.14152919 | 0.17866197 | ||
| 96 | 0.09749861 | 0.10183407 | 0.10403701 | 0.10626314 | 0.10851224 | 0.11078406 | 0.14227245 | ||
| 97 | 0.07340510 | 0.07688715 | 0.07866114 | 0.08045694 | 0.08227445 | 0.08411353 | 0.10991671 | ||
| 98 | 0.05438708 | 0.05714632 | 0.05855604 | 0.05998578 | 0.06143551 | 0.06290518 | 0.08379603 | ||
| 99 | 0.03962151 | 0.04178766 | 0.04289793 | 0.04402637 | 0.045173 | 0.04633787 | 0.06314194 | ||
| 100 | 0.02824857 | 0.02990519 | 0.03075702 | 0.03162463 | 0.03250811 | 0.03340752 | 0.04657583 |
| 2010 | … | 2014 | 2015 | 2016 | 2017 | 2018 | … | 2031 | |
|---|---|---|---|---|---|---|---|---|---|
| 0 | 1 | 1 | 1 | 1 | 1 | 1 | 1 | ||
| 1 | 0.99870336 | 0.99882201 | 0.99887721 | 0.99892982 | 0.99897997 | 0.99902777 | 0.99906537 | ||
| 2 | 0.99866636 | 0.99878965 | 0.99884694 | 0.99890151 | 0.99895349 | 0.99900300 | 0.99904047 | ||
| 3 | 0.99863614 | 0.99876289 | 0.99882175 | 0.99887781 | 0.99893119 | 0.99898202 | 0.99902266 | ||
| 4 | 0.99861148 | 0.99874098 | 0.99880110 | 0.99885834 | 0.99891284 | 0.99896472 | 0.99900709 | ||
| 5 | 0.99859084 | 0.99872262 | 0.99878380 | 0.99884203 | 0.99889745 | 0.99895022 | 0.99899449 | ||
| 6 | 0.99857271 | 0.99870652 | 0.99876862 | 0.99882773 | 0.99888398 | 0.99893752 | 0.99898397 | ||
| 7 | 0.99855303 | 0.99868893 | 0.99875199 | 0.99881200 | 0.99886911 | 0.99892345 | 0.99897281 | ||
| 8 | 0.99853409 | 0.99867195 | 0.99873591 | 0.99879677 | 0.99885469 | 0.99890980 | 0.99896282 | ||
| 9 | 0.99851143 | 0.99865145 | 0.99871642 | 0.99877823 | 0.99883706 | 0.99889304 | 0.99895178 | ||
| 10 | 0.99848787 | 0.99863007 | 0.99869604 | 0.99875883 | 0.99881857 | 0.99887542 | 0.99893967 | ||
| 11 | 0.99846394 | 0.99860831 | 0.99867530 | 0.99873904 | 0.99879970 | 0.99885743 | 0.99892643 | ||
| 12 | 0.99843489 | 0.99858174 | 0.99864988 | 0.99871473 | 0.99877645 | 0.99883519 | 0.99891241 | ||
| 13 | 0.99840072 | 0.99855034 | 0.99861979 | 0.99868589 | 0.99874881 | 0.99880870 | 0.99889559 | ||
| 14 | 0.99835990 | 0.99851275 | 0.99858371 | 0.99865127 | 0.99871558 | 0.99877681 | 0.99887881 | ||
| 15 | 0.99830910 | 0.99846586 | 0.99853867 | 0.99860799 | 0.99867401 | 0.99873687 | 0.99885878 | ||
| 16 | 0.99824027 | 0.99840207 | 0.99847726 | 0.99854888 | 0.99861710 | 0.99868209 | 0.99883613 | ||
| 17 | 0.99812870 | 0.99829787 | 0.99837656 | 0.99845156 | 0.99852306 | 0.99859120 | 0.99880419 | ||
| 18 | 0.99791214 | 0.99809298 | 0.99817727 | 0.99825772 | 0.99833451 | 0.99840781 | 0.99876423 | ||
| 19 | 0.99764150 | 0.99783605 | 0.99792693 | 0.99801380 | 0.99809685 | 0.99817625 | 0.99872315 | ||
| 20 | 0.99738522 | 0.99759358 | 0.99769109 | 0.99778441 | 0.99787374 | 0.99795924 | 0.99868348 | ||
| 21 | 0.99713085 | 0.99735333 | 0.99745761 | 0.99755750 | 0.99765322 | 0.99774494 | 0.99864554 | ||
| 22 | 0.99689312 | 0.99712941 | 0.99724029 | 0.99734659 | 0.99744853 | 0.99754628 | 0.99860761 | ||
| 23 | 0.99666428 | 0.99691419 | 0.99703157 | 0.99714418 | 0.99725223 | 0.99735592 | 0.99857091 | ||
| 24 | 0.99644706 | 0.99671019 | 0.99683387 | 0.99695260 | 0.99706657 | 0.99717600 | 0.99853281 | ||
| 25 | 0.99623804 | 0.99651409 | 0.99664393 | 0.99676861 | 0.99688837 | 0.99700339 | 0.99849367 | ||
| 26 | 0.99601347 | 0.99630282 | 0.99643901 | 0.99656987 | 0.99669560 | 0.99681643 | 0.99845146 | ||
| 27 | 0.99578071 | 0.99608361 | 0.99622628 | 0.99636342 | 0.99649526 | 0.99662201 | 0.99840284 | ||
| 28 | 0.99554034 | 0.99585701 | 0.99600627 | 0.99614981 | 0.99628786 | 0.99642065 | 0.99835014 | ||
| 29 | 0.99528520 | 0.9956161 | 0.99577218 | 0.99592234 | 0.99606683 | 0.99620587 | 0.99829257 | ||
| 30 | 0.99501477 | 0.99536049 | 0.99552367 | 0.99568074 | 0.99583195 | 0.99597752 | 0.99822816 | ||
| 31 | 0.99472612 | 0.99508732 | 0.99525793 | 0.99542224 | 0.99558048 | 0.99573290 | 0.99815359 | ||
| 32 | 0.99442051 | 0.99479771 | 0.99497601 | 0.99514780 | 0.99531333 | 0.99547285 | 0.99806744 | ||
| 33 | 0.99409620 | 0.99449047 | 0.99467696 | 0.99485673 | 0.99503002 | 0.99519710 | 0.99796904 | ||
| 34 | 0.99375177 | 0.99416384 | 0.99435889 | 0.99454699 | 0.99472841 | 0.99490339 | 0.99785486 | ||
| 35 | 0.99338477 | 0.99381571 | 0.99401983 | 0.99421677 | 0.99440680 | 0.99459017 | 0.99772134 | ||
| 36 | 0.99298607 | 0.99343742 | 0.99365135 | 0.99385784 | 0.99405718 | 0.99424963 | 0.99756640 | ||
| 37 | 0.99255416 | 0.99302713 | 0.99325148 | 0.99346813 | 0.99367736 | 0.99387946 | 0.99739254 | ||
| 38 | 0.99208127 | 0.9925776 | 0.99281320 | 0.99304082 | 0.99326075 | 0.99347328 | 0.99718670 | ||
| 39 | 0.99158366 | 0.99210507 | 0.99235273 | 0.99259211 | 0.99282351 | 0.99304721 | 0.99695491 | ||
| 40 | 0.99101421 | 0.99156332 | 0.99182433 | 0.99207673 | 0.99232083 | 0.99255693 | 0.99668588 | ||
| 41 | 0.99036593 | 0.99094554 | 0.99122127 | 0.99148804 | 0.99174618 | 0.99199598 | 0.99636780 | ||
| 42 | 0.98961324 | 0.9902263 | 0.99051820 | 0.99080079 | 0.99107440 | 0.99133932 | 0.99598538 | ||
| 43 | 0.98883219 | 0.98948206 | 0.98979172 | 0.99009165 | 0.99038219 | 0.99066365 | 0.99556996 | ||
| 44 | 0.98790783 | 0.98859817 | 0.98892741 | 0.98924650 | 0.98955578 | 0.98985557 | 0.99505818 | ||
| 45 | 0.98686824 | 0.98760298 | 0.98795372 | 0.98829386 | 0.98862374 | 0.98894370 | 0.99446561 | ||
| 46 | 0.98569311 | 0.98647771 | 0.98685259 | 0.98721637 | 0.98756939 | 0.98791201 | 0.99379971 | ||
| 47 | 0.98434506 | 0.98518449 | 0.98558598 | 0.98597582 | 0.98635439 | 0.98672204 | 0.99303823 | ||
| 48 | 0.98283446 | 0.98373463 | 0.98416558 | 0.98458431 | 0.98499120 | 0.98538661 | 0.99217418 | ||
| 49 | 0.98114174 | 0.98210856 | 0.98257188 | 0.98302235 | 0.98346037 | 0.98388630 | 0.99122355 | ||
| 50 | 0.97922519 | 0.98026655 | 0.98076609 | 0.98125210 | 0.98172497 | 0.98218510 | 0.99017169 | ||
| 51 | 0.97702552 | 0.97814892 | 0.97868838 | 0.97921357 | 0.97972492 | 0.98022282 | 0.98892271 | ||
| 52 | 0.97438310 | 0.9755949 | 0.97617749 | 0.97674514 | 0.97729826 | 0.97783726 | 0.98749444 | ||
| 53 | 0.97158637 | 0.97289798 | 0.97352921 | 0.97414465 | 0.97474474 | 0.97532990 | 0.98599321 | ||
| 54 | 0.96834402 | 0.96976547 | 0.97045030 | 0.97111847 | 0.97177045 | 0.97240665 | 0.98430453 | ||
| 55 | 0.96474628 | 0.96628788 | 0.96703136 | 0.96775726 | 0.96846604 | 0.96915815 | 0.98243829 | ||
| 56 | 0.96040615 | 0.96207507 | 0.96288093 | 0.96366836 | 0.96443784 | 0.96518981 | 0.98022474 | ||
| 57 | 0.95573384 | 0.95754541 | 0.95842110 | 0.95927738 | 0.96011472 | 0.96093359 | 0.97790637 | ||
| 58 | 0.95037649 | 0.95234263 | 0.95329409 | 0.95422515 | 0.95513629 | 0.95602798 | 0.97524240 | ||
| 59 | 0.94458871 | 0.94672569 | 0.94776087 | 0.94877452 | 0.94976714 | 0.95073922 | 0.97246654 | ||
| 60 | 0.93813633 | 0.94045779 | 0.94158346 | 0.94268645 | 0.94376726 | 0.94482639 | 0.96928440 | ||
| 61 | 0.93067373 | 0.9331908 | 0.93441263 | 0.93561070 | 0.93678550 | 0.93793754 | 0.96569280 | ||
| 62 | 0.92201173 | 0.92473029 | 0.92605146 | 0.92734793 | 0.92862020 | 0.92986878 | 0.96150779 | ||
| 63 | 0.91292753 | 0.91587581 | 0.91731007 | 0.91871843 | 0.92010141 | 0.92145950 | 0.95728366 | ||
| 64 | 0.90296158 | 0.90615694 | 0.90771289 | 0.90924173 | 0.91074397 | 0.91222010 | 0.95267450 | ||
| 65 | 0.89187612 | 0.89533664 | 0.89702334 | 0.89868171 | 0.90031225 | 0.90191546 | 0.94754589 | ||
| 66 | 0.87995062 | 0.8836938 | 0.88551996 | 0.88731653 | 0.88908400 | 0.89082289 | 0.94199659 | ||
| 67 | 0.86603850 | 0.87005602 | 0.87201813 | 0.87394980 | 0.87585153 | 0.87772381 | 0.93542103 | ||
| 68 | 0.85101341 | 0.85533131 | 0.85744227 | 0.85952188 | 0.86157063 | 0.86358899 | 0.92832105 | ||
| 69 | 0.83507096 | 0.83970955 | 0.84197947 | 0.84421710 | 0.84642291 | 0.84859735 | 0.92073958 | ||
| 70 | 0.81786786 | 0.82284565 | 0.82528387 | 0.82768890 | 0.83006118 | 0.83240115 | 0.91237397 | ||
| 71 | 0.79899580 | 0.80431457 | 0.80692238 | 0.80949637 | 0.81203696 | 0.81454454 | 0.90316529 | ||
| 72 | 0.77771801 | 0.78335689 | 0.78612467 | 0.78885851 | 0.79155880 | 0.79422591 | 0.89268634 | ||
| 73 | 0.75616850 | 0.76218269 | 0.76513752 | 0.76805796 | 0.77094435 | 0.77379703 | 0.88170120 | ||
| 74 | 0.73311484 | 0.73950948 | 0.74265431 | 0.74576455 | 0.74884047 | 0.75188238 | 0.86955997 | ||
| 75 | 0.70845441 | 0.71523408 | 0.71857164 | 0.72187467 | 0.72514340 | 0.72837807 | 0.85605208 | ||
| 76 | 0.68229987 | 0.6894546 | 0.69298049 | 0.69647231 | 0.69993021 | 0.70335440 | 0.84129944 | ||
| 77 | 0.65460979 | 0.6621378 | 0.66585167 | 0.66953227 | 0.67317969 | 0.67679405 | 0.82489993 | ||
| 78 | 0.62505600 | 0.63292032 | 0.63680464 | 0.64065711 | 0.64447775 | 0.64826660 | 0.80651527 | ||
| 79 | 0.59455190 | 0.60274994 | 0.60680391 | 0.61082776 | 0.61482144 | 0.61878490 | 0.78657117 | ||
| 80 | 0.56217234 | 0.57066306 | 0.57486714 | 0.57904349 | 0.58319198 | 0.58731248 | 0.76411753 | ||
| 81 | 0.52723198 | 0.53592123 | 0.54022971 | 0.54451376 | 0.54877316 | 0.55300769 | 0.73879752 | ||
| 82 | 0.49027289 | 0.49905338 | 0.50341367 | 0.50775358 | 0.51207278 | 0.51637098 | 0.71014063 | ||
| 83 | 0.45356519 | 0.46244026 | 0.46685442 | 0.47125245 | 0.47563396 | 0.47999858 | 0.67999573 | ||
| 84 | 0.41598316 | 0.42486774 | 0.42929398 | 0.43370889 | 0.43811199 | 0.44250284 | 0.64707466 | ||
| 85 | 0.37855622 | 0.3873989 | 0.39181203 | 0.39621896 | 0.40061915 | 0.40501207 | 0.61266808 | ||
| 86 | 0.34058893 | 0.34926287 | 0.35359994 | 0.35793628 | 0.36227131 | 0.36660445 | 0.57498754 | ||
| 87 | 0.30346153 | 0.31189915 | 0.31612651 | 0.32035873 | 0.32459520 | 0.32883532 | 0.53499785 | ||
| 88 | 0.26700312 | 0.27509286 | 0.27915455 | 0.28322663 | 0.28730847 | 0.29139947 | 0.49303874 | ||
| 89 | 0.23099746 | 0.23858626 | 0.24240495 | 0.24623905 | 0.25008798 | 0.25395114 | 0.44895437 | ||
| 90 | 0.19722800 | 0.20426104 | 0.20780850 | 0.21137586 | 0.21496260 | 0.21856818 | 0.40362342 | ||
| 91 | 0.16487781 | 0.17122568 | 0.17443539 | 0.17766835 | 0.18092412 | 0.18420222 | 0.35724818 | ||
| 92 | 0.13453893 | 0.14009243 | 0.14290736 | 0.14574728 | 0.14861184 | 0.15150068 | 0.30909701 | ||
| 93 | 0.10731808 | 0.11206808 | 0.11448195 | 0.11692142 | 0.11938625 | 0.12187618 | 0.26313644 | ||
| 94 | 0.08355544 | 0.08750889 | 0.08952323 | 0.09156249 | 0.09362651 | 0.09571515 | 0.21908476 | ||
| 95 | 0.06382952 | 0.06706389 | 0.06871648 | 0.07039260 | 0.07209223 | 0.07381529 | 0.17866197 | ||
| 96 | 0.04671489 | 0.0492248 | 0.05051056 | 0.05181691 | 0.05314386 | 0.05449142 | 0.14227245 | ||
| 97 | 0.03371610 | 0.03565254 | 0.03664753 | 0.03766047 | 0.03869143 | 0.03974049 | 0.10991671 | ||
| 98 | 0.02334896 | 0.02476536 | 0.02549509 | 0.02623930 | 0.02699811 | 0.02777159 | 0.08379603 | ||
| 99 | 0.01585622 | 0.01687594 | 0.01740284 | 0.01794125 | 0.01849129 | 0.01905306 | 0.06314194 | ||
| 100 | 0.01072913 | 0.0114689 | 0.01185250 | 0.01224541 | 0.01264775 | 0.01305963 | 0.04657583 |
References
- Alho, Juha M. 2000. Discussion of Lee. North American Actuarial Journal 4: 91–93. [Google Scholar] [CrossRef]
- Arnold, Severine, and Michael Sherris. 2013. Forecasting Mortality Trends allowing for Cause-of-Death Mortality Dependence. North American Actuarial Journal 17: 273–82. [Google Scholar] [CrossRef]
- Baione, Fabio, and Susanna Levantesi. 2014. A health insurance pricing model based on prevalence rates: Application to critical illness insurance. Insurance: Mathematics and Economics 58: 174–84. [Google Scholar] [CrossRef]
- Basel Committee on Banking Supervision. 2013. Mortgage Insurance: Market Structure, Underwriting Cycle and Policy Implications. Consultative Document. Available online: http://www.bis.org/publ/joint30.pdf (accessed on 15 February 2017).
- Bowers, Newton L., Hans U. Gerber, James C. Hickman, Donald A. Jones, and Cecil J. Nesbitt. 1997. Actuarial Mathematics. Schaumburg: The Society of Actuaries. [Google Scholar]
- Brett, Paul, and Johann du Toit. 2007. A Critical Table: Pricing critical illness in the U.K. on a new insured lives table. Paper presented at Iaahs Colloquium, Cape Town, South Africa, May 14–18. [Google Scholar]
- Brillinger, David R. 1986. The natural variability of vital rates and associated statistics. Biometrics 42: 693–734. [Google Scholar] [CrossRef] [PubMed]
- Brouhns, Natacha, Michel Denuit, and Jeroen K. Vermunt. 2002. A Poisson log-bilinear regression approach to the construction of projected lifetables. Insurance: Mathematics and Economics 31: 373–93. [Google Scholar] [CrossRef]
- CMI WP 14. 2005. Continuos Mortality Investigation Committee Working Paper-CMI Critical Illness Diagnosis Rates for Accelerated Business, 1999–2002, Institute and Faculty of Actuaries. Available online: https://www.actuaries.org.uk/.../cmi-working-paper-14 (accessed on 23 November 2015).
- CMI WP 18. 2005. Continuos Mortality Investigation Committee Working Paper-CMI Critical Illness Diagnosis Rates for Accelerated Business, 1999–2002, Institute and Faculty of Actuaries. Available online: https://www.actuaries.org.uk/.../cmi-working-paper-18 (accessed on 23 November 2015).
- CMI WP 50. 2011. Continuos Mortality Investigation Committee Working Paper-CMI Critical Illness Diagnosis Rates for Accelerated Business, 2003–2006, Institute and Faculty of Actuaries. Available online: https://www.actuaries.org.uk/.../cmi-working-paper-50 (accessed on 23 November 2015).
- CMI WP 58. 2011. Continuos Mortality Investigation Committee Working Paper-CMI Supplementary Analysis to CMI Critical Illness Diagnosis Rates for Accelerated Business, 2003–2006, Institute and Faculty of Actuaries. Available online: https://www.actuaries.org.uk/.../cmi-working-paper-58 (accessed on 23 November 2015).
- Coppola, Mariarosaria, Valeria D’Amato, and Marilena Sibillo. 2009. Fair value and demographic aspects of the insured loan. Banks and Bank System 1: 19–29. [Google Scholar]
- Doblhammer, G., and J. Kytir. 2001. Compression or expansion of morbidity? Trends in healthylife expectancy in the elderly Austrian population between 1978 and 1998. Social Science and Medicine 52: 385–91. [Google Scholar] [CrossRef]
- EIOPA. 2017. Financial Stability Report June 2017. Available online: https://eiopa.europa.eu/Publications/Reports/Financial_Stability_Report_June_2017.pdf (accessed on 30 September 2017).
- Fellingham, Gilbert W., Athanasios Kottas, and Brian M. Hartman. 2015. Bayesian nonparametric predictive modeling of group health claims. Insurance: Mathematics and Economics 60: 1–10. [Google Scholar] [CrossRef]
- Government of Canada. 2017. Available online: https://www.canada.ca/en.html or https://www.canada.ca/en/financial-consumeragency/services/insurance/credit-loan.html#toc3. (accessed on 27 October 2017).
- Gruenberg, Ernest M. 1977. The failure of success. Milbank Memorial Fund Quarterly—Health and Society 55: 3–24. [Google Scholar] [CrossRef] [PubMed]
- Haberman, Steven, and Ermanno Pitacco. 1998. Actuarial Models for Disability Insurance. Boca Raton: CRC Press. [Google Scholar] [CrossRef]
- Haberman, Steven, and Andres Villegas. 2014. On the Modelling and Forecasting of Socio-economic Mortality Differentials: An Application to Deprivation and Mortality in England, Mortality Thought Leadership. North American Actuarial Journal 18: 168–93. [Google Scholar]
- Hambel, Christoph, Holger Kraft, Lorenz Schendel, and Mogens Steffensen. 2017. Life insurance demand under health shock risk. The Journal of Risk and Insurance 84: 1171–202. [Google Scholar] [CrossRef]
- Lee, Ronalad D., and Lawrence Carter. 1992. Modeling and Forecasting the Time Series of U.S. Mortality. Journal of the American Statistical Association 87: 659–71. [Google Scholar]
- Olshanksy, Jay, Mark A. Rudberg, Bruce A. Carnes, Christine K. Cassel, and Jacob A. Brody. 1991. Trading off longer life for worsening health. Journal of Aging and Health 3: 194–216. [Google Scholar] [CrossRef]
- Pitacco, Ermanno. 2016. Premiums for Long-Term-Care Insurance Packages; sensitivity with respect to biometric assumptions. Risks 4: 3. [Google Scholar] [CrossRef]
- Renshaw, Arthur E., and Steven Haberman. 2003. Lee-Carter mortality forecasting with age specific enhancement. Insurance: Mathematics and Economics 33: 255–72. [Google Scholar] [CrossRef]
- Schoder, Johannes, and Peter Zweifel. 2011. Flat-of-the-curve medicine: A new perspective on the production of health. Health Economics Review 1: 2. [Google Scholar] [CrossRef] [PubMed]
- Villegas, Ramirez Andres. 2015. Mortality: Modelling Socio-Economic Differences and Basis Risk. Ph.D. thesis, Cass Business School, London, UK. Available online: http://openaccess.city.ac.uk/13574/1/Villegas-Ramirez,%20A..pdf (accessed on 15 May 2016).
- WHO. 2009. WHO Mortality Database. January. Available online: http://www.who.int/whosis/mort/download/en/index.html (accessed on 23 November 2015).
- Wilmoth, John R., Magali Barbieri, and Vladimir Shkolnikov. n.d. The Human Mortality Database. Available online: http://www.mortality.org/ (accessed on 23 November 2015).


| Age at Entry/Duration | 40 | 60 |
|---|---|---|
| a. Standard Insured Loan—SIL | ||
| 10 | 90.19 | 749.04 |
| 20 | 175.95 | 1320.07 |
| b. Specific Insured Loan—SpeIL | ||
| 10 | 62.65 | 532.64 |
| 20 | 120.72 | 981.14 |
| Age at Entry/Duration | 40 | 60 |
|---|---|---|
| a. Standard Critical Illness Loan (Stand Alone)—SCILsa | ||
| 10 | 262.38 | 831.53 |
| 20 | 422.28 | 1198.74 |
| b. Standard Critical Illness Loan (Accelerated)—SCILa | ||
| 10 | 285.62 | 925.37 |
| 20 | 456.98 | 1424.16 |
| Age at Entry/Duration | 40 | 60 |
|---|---|---|
| a. Standard Critical Illness Loan (Stand Alone)—SCILsa | ||
| 10 | 213.79 | 805 |
| 20 | 273.18 | 925.80 |
| b. Standard Critical Illness Loan (Accelerated)—SCILa | ||
| 10 | 352.21 | 1304.30 |
| 20 | 580.70 | 2034.17 |
| Age at Entry/Duration | 40 | 60 |
|---|---|---|
| a. Standard Insured Loan—SIL | ||
| 10 | 108.23 | 1251.55 |
| 20 | 231.06 | 2106.08 |
| b. Specific Insured Loan—SpeIL | ||
| 10 | 64.87 | 746.67 |
| 20 | 129.59 | 1440.78 |
| Age at Entry/Duration | 40 | 60 |
|---|---|---|
| a. Standard Critical Illness Loan (Stand Alone)—SCILsa | ||
| 10 | 218.68 | 1339.71 |
| 20 | 429.84 | 2049.66 |
| b. Standard Critical Illness Loan (Accelerated)—SCILa | ||
| 10 | 260.27 | 1515.15 |
| 20 | 498.18 | 2373.22 |
| Age at Entry/Duration | 40 | 60 |
|---|---|---|
| a. Standard Critical Illness Loan (Stand Alone)—SCILsa | ||
| 10 | 440.72 | 2378 |
| 20 | 834.17 | 3590.64 |
| b. Standard Critical Illness Loan (Accelerated)—SCILa | ||
| 10 | 547.70 | 2975 |
| 20 | 1035.35 | 4686.70 |
| Maturity | Financial Instalment | Payment Due in Case of Insolvency | |||
| a. Amortization Schedule. Issue Time 2014, r = 7%, C = 200,000, n = 10 | |||||
| 1 | 28,475.5 | 214,000 | |||
| 2 | 28,475.5 | 198,511.2 | |||
| 3 | 28,475.5 | 181,938.2 | |||
| 4 | 28,475.5 | 164,205.1 | |||
| 5 | 28,475.5 | 145,230.7 | |||
| 6 | 28,475.5 | 124,928 | |||
| 7 | 28,475.5 | 103,204.2 | |||
| 8 | 28,475.5 | 79,959.72 | |||
| 9 | 28,475.5 | 55,088.1 | |||
| 10 | 28,475.5 | 28,475.5 | |||
| Maturity | Financial Instalment | Payment Due in Case of Insolvency | Maturity | Financial Instalment | Payment Due in Case of Insolvency |
| b. Periodic Amortization Schedule. Issue Time 2014, r = 7%, C = 200,000, n = 20 | |||||
| 1 | 18,878.59 | 214,000 | 11 | 18,878.59 | 141,877 |
| 2 | 18,878.59 | 208,779.9 | 12 | 18,878.59 | 131,608.3 |
| 3 | 18,878.59 | 203,194.4 | 13 | 18,878.59 | 120,620.8 |
| 4 | 18,878.59 | 197,218 | 14 | 18,878.59 | 108,864.1 |
| 5 | 18,878.59 | 190,823.1 | 15 | 18,878.59 | 96,284.51 |
| 6 | 18,878.59 | 183,980.7 | 16 | 18,878.59 | 82,824.33 |
| 7 | 18,878.59 | 176,659.2 | 17 | 18,878.59 | 68,421.95 |
| 8 | 18,878.59 | 168,825.3 | 18 | 18,878.59 | 53,011.41 |
| 9 | 18,878.59 | 160,443 | 19 | 18,878.59 | 36,961.41 |
| 10 | 18,878.59 | 151,473.9 | 20 | 18,878.59 | 18,878.59 |
| Age at Entry/Duration | 40 | 60 |
|---|---|---|
| a. Global annual obligation. Insured Loan and Stand Alone—SCILsa Female non-smokers, C = 200,000, i = 7%, r = 2% | ||
| 10 | 28,738.88 | 29,307.03 |
| 20 | 19,300.87 | 20,077.33 |
| b. Global annual obligation. Standard Insured Loan—SIL Female non-smokers, C = 200,000, i = 7%, r = 2% | ||
| 10 | 28,565.69 | 29,224.54 |
| 20 | 19,054.54 | 20,198.66 |
| c. Global annual obligation. Specific Insured Loan—SpeIL Female non-smokers, C = 200,000, i = 7%, r = 2% | ||
| 10 | 28,538.15 | 29,008.14 |
| 20 | 18,999.31 | 19,859.73 |
| d. Global annual obligation. Insured Loan and Accelerated—SCILa Female non-smokers, C = 200,000, i = 7%, r = 2% | ||
| 10 | 28,761.12 | 29,400.87 |
| 20 | 19,335.57 | 20,302.75 |
© 2018 by the authors. Licensee MDPI, Basel, Switzerland. This article is an open access article distributed under the terms and conditions of the Creative Commons Attribution (CC BY) license (http://creativecommons.org/licenses/by/4.0/).
Share and Cite
D’Amato, V.; Di Lorenzo, E.; Sibillo, M. Dread Disease and Cause-Specific Mortality: Exploring New Forms of Insured Loans. Risks 2018, 6, 13. https://doi.org/10.3390/risks6010013
D’Amato V, Di Lorenzo E, Sibillo M. Dread Disease and Cause-Specific Mortality: Exploring New Forms of Insured Loans. Risks. 2018; 6(1):13. https://doi.org/10.3390/risks6010013
Chicago/Turabian StyleD’Amato, Valeria, Emilia Di Lorenzo, and Marilena Sibillo. 2018. "Dread Disease and Cause-Specific Mortality: Exploring New Forms of Insured Loans" Risks 6, no. 1: 13. https://doi.org/10.3390/risks6010013
APA StyleD’Amato, V., Di Lorenzo, E., & Sibillo, M. (2018). Dread Disease and Cause-Specific Mortality: Exploring New Forms of Insured Loans. Risks, 6(1), 13. https://doi.org/10.3390/risks6010013