Abstract
Global biodiversity decreased by 69% from 1970 to 2022, representing a key risk to economic activity. However, the link between nature, biodiversity and finance has received little attention within the field of sustainable finance. This paper attempts to fill this gap. Nature finance aims to avoid biodiversity loss and promote nature-positive activities, such as the conservation and protection of biodiversity through market-based solutions with the proper measurement of impact. Measuring biodiversity impact remains a challenge for most companies and banks, with a fragmented landscape of nature frameworks. We conduct a bibliometric analysis of the literature on biodiversity finance and analyze a unique market dataset of five global investment funds as well as all corporate bonds issued in Brazil, the country with the largest biodiversity assets. First, we find that the literature on nature finance is recent with a tipping point in 2020, with the three most common concepts being ecosystem services, nature-based solutions and circular economy. Second, we find that sovereigns and two corporate sectors (food production, pulp & paper) represent the vast majority of issuers that currently incorporate biodiversity considerations into funding structures, suggesting an opportunity to expand accountability for biodiversity impacts across a greater number of sectors. Third, we find a disconnect between science and finance. Out of a catalogue of 158 biodiversity metrics proposed by the IFC, just 33 have been used in bond issuances and 32 by fund managers, suggesting an opportunity for technical assistance for companies and to simplify catalogs to create a common language. Lack of consensus around metrics, complexity, and cost explain this gap. Fourth, we identify a distinction between liquid markets and illiquid markets in their application of biodiversity impact management and measurement. Illiquid markets, such as private equity, bilateral lending, voluntary carbon markets or investment funds can develop complex bespoke mechanisms to measure nature, leveraging detailed catalogues of metrics. Liquid markets, including bonds, exhibit a preference for simpler metrics such as preserved areas or forest cover.
1. Introduction
The World Wildlife Fund has reported an average decrease of 69% in global biodiversity since 1970 (WWF 2022). Changes in biodiversity can be driven by either natural patterns based on seasonal changes or man-made ecological disturbances. Anthropogenic influences have had a severe impact on climate, species and their natural habitats (Bernhardt et al. 2020). The UN reports that, with over 70 percent of ice-free land affected by human activities, the utilization of land for anthropogenic activities poses a threat to multiple species. Moreover, climate change is a key driver of biodiversity loss. This has led to a reduction in the abundance of species, increased vulnerability to diseases, and widespread mortality among plants and animals (United Nations 2023). The resolution by the 2023 Conference of the Parties 28 under the UNFCCC states that “continued loss and degradation of nature increases climate vulnerability, contributes to significant greenhouse gas emissions, and impedes sustainable development” (United Nations 2024).
Safeguarding nature and biological diversity are crucial for the planet, human society, and the global economy, according to an extensive research body (Dasgupta 2021; Deutz et al. 2020; Malhi et al. 2008; Naeem et al. 1994). The economic reliance on natural diversity is explained as many activities depend on either directly extracting resources from the land or oceans or benefiting from ecosystem services. The analysis from the World Economic Forum of 163 industry sectors and their supply chains showcased that more than half of global GDP relies to a moderate or high extent on nature and its services. Construction, agriculture, and food and beverages are the most vulnerable industries that depend on nature, including pollination, water quality, and disease control (World Economic Forum 2020). Biodiversity contributes to climate stabilization, improves food supplies, and supports economic and social needs among others. Experts conclude that nature is “a crucial foundation for a competitive and resilient economy” (European Commission 2025).
If climate change represents a “tragedy of the horizon” (Carney 2015), biodiversity loss too represents a historic challenge, as nature loss is understood to “be a major driver of economic losses and financial risks” (European Commission 2025). The majority of nature services functions as public goods, meaning their consumption is synergetic and available to everyone in a given region (Flammer et al. 2023). Solving the biodiversity crisis requires collective action as well as policymaking that creates incentives for economic agents to place a value on biodiversity and consider the biodiversity effects of their activities.
In the context of a dramatic decrease in biodiversity and considering its negative impact for the global economy, the private sector can play a material role, in particular, corporates and financial institutions. Either because of rising regulatory requirements (Alamillos and de Mariz 2022), fiduciary duty (de Mariz et al. 2024b), reputational considerations, or to better manage risks and opportunities, corporate and financial institutions have dedicated increasing resources to the topic. The Taskforce on Nature-related Financial Disclosures (TNFD), modeled after the Taskforce on Climate-related Financial Disclosures (TCFD), was launched in 2021. It published its final disclosure recommendations in September 2023. The Network for Greening the Financial System published in 2023 a framework to help central banks and supervisors identify and assess sources of nature-related transition and physical risks (NGFS 2023).
Despite the large and growing body of literature on sustainable finance, activities linked to climate mitigation, adaptation and transitioning to a low-carbon economy have attracted most of the focus. The link between biodiversity, nature and finance has received less attention by academics (Karolyi and Tobin-de la Puente 2023). Nature finance, as an incipient field within sustainable finance, can help define appropriate financial mechanisms to attract funding for biodiversity, with the proper measurement of impact. This paper is an attempt to fill part of the gap, with a focus on the metrics required for reliable measurement of biodiversity impact in a financial context.
Financial mechanisms considering nature are rare and “ecosystem services remain difficult to monetise and are not adequately reflected in market price signals” (European Commission 2025). The Nature Conservancy Group estimates an annual funding need ranging from $722 to $967 billion in global projects to reverse the decline of biodiversity (The Nature Conservancy 2020). By contrast, estimates suggest investments in nature-based solutions totaled approximately $200 billion in 2022 (UNEP 2023).
Our study analyzes the current developments in biodiversity finance, building on the seminal reports and catalogs by the Global Impact Investing Network’s IRIS+ Catalogue of Metrics related to biodiversity (GIIN n.d.), the Taskforce for Nature-related Financial Disclosure (TNFD 2023), or global multilateral institutions, such as the IFC (IFC 2023). While there is no shortage of nature frameworks and catalogs of metrics, we find that defining and disclosing nature metrics remains a challenge for corporates and banks, starting with the definition of metrics, measurement, reporting and verification. Nature remains largely invisible in sustainable finance transactions, illustrating the need to consolidate frameworks and create a consensus around robust metrics.
We find a gap between metrics suggested by science and metrics actually used in financial markets, providing strong support for the simplification effort supported by ICMA among others, with a practitioner’s guide for nature bonds proposing “core indicators”, and “additional indicators” (ICMA 2025). The core indicators are meant to “facilitate comparison of project results”, with issuers being encouraged to “report on at least a limited number of sector specific core indicators for projects included in their green bond programmes.”
While this paper focuses on measuring and disclosing nature metrics, most frameworks, in particular TNFD, highlight the importance of robust governance and effective risk management around impact. The definition of metrics and targets represents just one pillar of the framework. Together with measurement, best practices highlight the importance of independent verification of both measurement and management in a context where the sustainable investing market is “becoming more sophisticated in its approach to measuring and managing impact” (Bluemark 2025). In this paper, we highlight how companies have been disclosing biodiversity, including both negative and nature positive impacts in the context of financial instruments.
Our approach consists of a comprehensive review of the literature of biodiversity finance and economics of biodiversity. We review the biodiversity metrics commonly recommended in the literature, especially the reference guidelines defined by the IFC (IFC 2023). We complement our bibliographic review with a detailed analysis of market data and biodiversity metrics. We focus on two datasets: a group of five global investment funds that have a core focus on nature as well as data on all sustainable bond issuances to date in Brazil, the country with the largest biodiversity assets globally, representing a sample of 49 bonds. This methodology allows us to answer our research question: how can biodiversity finance help bridge the gap between science and capital markets? We ask whether there is a disconnect between science and finance, between metrics recommended by scientific bodies and multilateral organizations and what corporates and financial intermediaries actually report and use. Subsidiary questions include how the financial sector can incorporate biodiversity considerations.
Our findings are fourfold. First, we find that the literature on nature is recent, with a tipping point reached in 2020. We find 15 common concepts in the academic literature with the three most common being ecosystem services, nature-based solutions, circular economy.
Second, we find that the sovereign and two corporate sectors (food production, pulp & paper) represent the vast majority of issuers that currently incorporate biodiversity considerations into their funding and investment structures. Other sectors are emerging, such as water and sanitation, disaster prevention services, and cosmetics. This suggests an opportunity to expand accountability for biodiversity impacts across a greater number of sectors.
Third, we find a disconnect between science and finance, between recommended metrics by scientific bodies and multilaterals and metrics used in practice by funds and bond issuers. In fact, out of a total catalogue of 158 metrics recommended by the IFC, just 33 have been used in bond issuance and 32 used by fund managers. Preferred used metrics relate to nature restoration and conservation, adoption of sustainable agricultural and production practices, and species monitored. We see this as an opportunity to develop technical assistance for corporates and financial intermediaries to understand the most appropriate metrics and to streamline and simplify catalogs and frameworks of metrics to create a common language.
Fourth, we propose an essential distinction between liquid markets and illiquid markets. Illiquid markets, such as private equity, voluntary carbon markets or closed-end funds can develop more complex bespoke mechanisms to measure biodiversity. In liquid markets, such as bonds, there is a preference for simpler metrics aligned with nature preservation.
Following this introduction, Section 2 focuses on a review of the literature, defining the relevant terms, frameworks and methodology. We conduct a quantitative review of academic literature to illustrate the most popular biodiversity topics over time. We analyze the recommended biodiversity metrics in the scientific literature. In Section 3, we use a unique global dataset of biodiversity disclosures from capital markets, including investment funds and bond issuances, and assessed their disclosures against recommended metrics. We end with a conclusion.
2. Biodiversity Finance: Definition and Key Metrics
There are multiple definitions of biodiversity. From an ecological perspective, biodiversity is the number of species in a given area resulting in so-called species richness (NIH 1999). A more thorough definition follows:
“Biodiversity is an attribute of an area and specifically refers to the variety within and among living organisms, assemblages of living organisms, biotic communities, and biotic processes, whether naturally occurring or modified by humans. Biodiversity can be measured in terms of genetic diversity and the identity and number of different types of species, assemblages of species, biotic communities, and biotic processes, and the amount (e.g., abundance, biomass, cover, rate) and structure of each. It can be observed and measured at any spatial scale ranging from microsites and habitat patches to the entire biosphere.”(Swingland 2001)
Apart from the definition itself, the accounting and measurement framework behind the term, and the factor modified by humans play a crucial role in the following analysis. The Center for Biodiversity and Conservation at the American Museum of Natural History emphasizes the inclusion of humans and cultural factors within the concept of biodiversity. It defines the term “biocultural” to characterize the changing relationship between humans and the natural environment. This perspective acknowledges the interrelation of social and biological dimensions with biodiversity and emphasizes that human activities, knowledge, and understanding shape the surrounding ecological systems. The intrinsic connection and economic reliance between individuals and their environment are becoming more relevant in today’s scientific literature, government reports, and corporate business disclosure (AMNH 2023).
Biodiversity describes the variety of life on earth and the natural pattern it forms. It is understood in terms of a wide variety of plants, animals and microorganisms. Fragmentation, degradation, and outright loss of forests, wetlands, coral reefs, and other ecosystems pose the gravest threat to biological diversity (ICMA 2020). According to the Convention on Biological Diversity (CBD), three dimensions are key to biodiversity:
- The conservation of biological diversity (genetic diversity, species diversity and habitat diversity).
- The sustainable use of biological diversity.
- The fair and equitable sharing of the benefits arising out of the utilization of genetic resources (CBD 1993).
Sukhdev notes three levels in biodiversity, consisting of ecosystem, species and genetic level (Table 1).

Table 1.
Schematic definition of biodiversity.
Biodiversity finance focuses on banking, asset management or capital markets activities that are organized into the following two main categories. First, investments that generate biodiversity co-benefits by financing to halt and reverse biodiversity loss related to economic activities (land/sea use change; pollution; overexploitation of resources; and invasive species). Second, investments that target biodiversity conservation and restoration: financing to support nature conservation or restoration and related services as a primary objective of investment. In that second category, we find investments in nature-based solutions: financing to support the integration of nature-based solutions into larger projects to provide infrastructure services and displace or complement gray infrastructure.
The financial sector, especially via its asset management and investment banking arms, has led important innovations in instruments bringing additional capital to projects that presented a positive contribution to people and planet. Green bonds have been the most popular, but labels have grown to help classify projects by type, raise awareness on underfunded sectors and ultimately attract more funding. Labelled bonds have grown hand in hand with concerns of greenwashing risk (ICMA 2023) and fueled a debate on how to warrant investor trust, promoting real-world impact (ICMA 2024) on one hand and justifying a premium on the other hand. Innovative financial instruments have included blended finance (Flammer and de Mariz 2025), blue bonds, sustainability-linked bonds (de Mariz et al. 2024a), social impact bonds (de Mariz and Savoia 2018), and debt-for-nature swaps among others. The idea to attract financing to enterprises that have a positive social or environmental impact is not novel, as evidenced by the rise in a commercial microfinance industry two decades ago and its challenges to secure stable funding sources and measure its positive social impact (O’Donohoe et al. 2009; O’Donohoe et al. 2010; de Mariz et al. 2011; Glisovic et al. 2012). In that same vein, there is a recent and incipient literature on the use of private capital to finance biodiversity conservation and restoration (Flammer et al. 2023). Blended finance has experienced rising interest with its ability to crowd in private capital thanks to concessionary or catalytic funding to increase impact. Catalytic capital can be defined as “debt, equity, guarantees, and other investments that accept disproportionate risk and/or concessionary returns relative to a conventional investment in order to generate positive impact and enable third-party investment that otherwise would not be possible” (Tideline 2019). Meanwhile, research shows the need to better map existing sources of catalytic capital, reduce the cost to structure those transactions and increase awareness and understanding of blended finance (Flammer and de Mariz 2025).
The IFC published in 2023 a Biodiversity Finance Reference Guide, “designed to provide expanded guidance on impact reporting for eligible biodiversity finance activities”. The reference guide builds on established recommendations, such as the Green Bond Principles and Green Loan Principles defined by the International Capital Market Association. The guide provides “indicative investment activities and project components eligible for biodiversity finance” and offers “indicative metrics for each eligible biodiversity finance activity”. The guide addresses the rising demand from markets for guidance on biodiversity reporting by providing a list of investment activities that contribute to the protection, maintenance, or enhancement of biodiversity and ecosystem services, as well as the sustainable management of living natural resources.
Through human interaction with nature, biodiversity offers an economic value that is essential for providing various ecosystem services, such as food production, water purification, climate regulation, and recreational opportunities. Sukhdev emphasizes the economic invisibility of nature (Sukhdev et al. 2014), noting that biodiversity is the “living fabric of this planet” and its economic reflection is termed natural capital. Biodiversity includes quality and quantity dimension across three strata: ecosystem level, species level and genetic level.
Biodiversity finance involves mobilizing funds to support activities that promote the conservation and restoration of biodiverse ecosystems and reduce the harm to nature caused by economic activities that are highly dependent on nature. Historically, this has been achieved through public funding and private philanthropy, where organizations and governments allocate resources to protect critical habitats, species, and ecosystems (OECD 2022). Over the last decade, various financial instruments have been employed to connect the activity of conservation with financial products and incentives, for example, debt-for-nature swaps (Olsen and de Mariz 2025), foreign development investment, biodiversity bonds, payments for ecosystem services, and biodiversity offsets (Seidl et al. 2020; IFC 2023).
Biodiversity finance represents a comprehensive and evolving strategy, intertwining economic theory, scientific evidence, and financial innovation to combat biodiversity loss. However, despite these efforts, there remains a substantial financing gap in the segment. This opportunity has attracted funds and private investors who seek financial returns while contributing to ecological conservation. Theoretical frameworks and metric systems quantify the value of diversity within ecosystems and financial interactions.
Yet, a universal system on biodiversity measurement and reporting remains to be defined. Identifying suitable metrics remains a hurdle for the integration of biodiversity considerations into environmentally responsible investments (Rossberg et al. 2023; OECD 2021). By investing in the transformation from biodiversity loss to gain, multiple socio-economic benefits might be accessible. A sustainable investment shift in food, land, and ocean use, infrastructure, the built environment, and energy might unlock annual business opportunities worth $10.1 trillion, create 395 million new jobs by 2030, and offer substantial prospects for income diversification and growth for local economies, according to the IFC (IFC 2023).
2.1. Methodology
We base our analysis on a unique dataset stemming from two sources. The first corresponds to trend analysis thanks to an engine search (google) on key biodiversity concepts from 1995 to 2002. The other source is linked to capital markets. It consists of the comprehensive list of labelled bond issuances from companies headquartered in Brazil, the country with the largest biodiversity assets globally. We use the most complete timeframe available, which is 2015 to 2024, from the publicly available database compiled by sustainability consulting company ERM-NINT, last checked on 15 January 2025. The dataset covers 49 transactions, for a total volume of $31 billion. Labelled bonds follow two formats. 29 transactions are use-of-proceeds, and the other 20 transactions are sustainability-linked bond (SLB). Use-of-proceeds bonds consider transaction where funds are allocated or earmarked for a list of predefined eligible projects that present a positive social and/or environmental contribution. SLBs, in contrast, do not imply funds to be directed to specific metrics but require the company as a whole to commit to ambitious sustainability targets in the future. 48 transactions were issued in USD and the remaining one in EUR. Labelled bonds are fixed-income issuances for issuers that make claims of positive contribution for society and or the environment, in accordance with principles defined by the International Capital Markets Association (ICMA). The 49 transactions in our sample correspond to 27 unique issuers, since several issuers have issued more than one labelled bond. The number of unique company frameworks—a document that explains the company’s rationale for issuing a labelled instrument—is 36, considering that two frameworks are not publicly available and that the same issuer may have updated its framework.
For use-of-proceeds labelled bonds, we analyze the sustainable finance frameworks published ahead of transactions to list the metrics described in the impact disclosure set forth in the pre-issuance framework of the issuer. The most common type of use-of-proceeds instruments is a green bond, and we also include in our sample bonds labelled as sustainability. We do not include bonds labelled as social or transition. According to ICMA principles, those metrics need to be stated in the section related to disclosure, representing the fourth pillar of the principles.
For sustainability-linked bonds, we analyze the key performance indicators (KPIs) described in second party opinion reports analyzing the pre-issuance framework. According to ICMA principles, those indicators need to be stated by issuers in the KPI section, representing the first pillar of the principles.
For both datasets, we conduct a detailed analysis of metrics that are used to report on biodiversity impacts. In particular, we compare actual metrics used to measure biodiversity impacts against the set of metrics recommended by the IFC. This allows us to estimate the gap between biodiversity measurement approaches in science and those prevailing in finance.
2.2. Biodiversity Finance: Literature Review
In the following section, we categorize 15 environmental constructs following the correlation of economic and environmental dimensions. We selected the constructs that appeared with the highest frequency in the literature on biodiversity finance. Our analysis suggests that biodiversity finance grew rapidly in recent years, having reached a tipping point in 2020.
The literature analysis, sourced from the Web of Science platform, concentrates on key scientific constructs that have been prominent in sustainable and biodiversity finance from 1990 to 2024 (Table 2). The research process involves the database to quantify the specific term found in scientific articles, papers, books, public meeting abstracts, news items, public notes and similar sources. This process provides a comprehensive trend analysis rather than a complete assessment of global publications, illustrating how the terms have gained attention in scientific literature and public discourse. They provide insight into the underlying ideological concepts of each construct and suggest their presence in today’s public discourse and attention.
Table 2.
Key Biodiversity-Related Concepts and Their Frequency in Academic Literature (total volume 1990–2024 registered under the Web of Science platform).
Some constructs with economic biases, such as ESG, Circular Economy, or Payment for Ecosystem Services, represent the relationship between economic models and nature-based concepts. Environmental terms like Nature Positive or Biodiversity Hotspots highlight the intrinsic value of ecosystems and their connection to human activities. The permeable boundaries between categories are evident in concepts like Biodiversity Finance and Reforestation, where environmental restoration aligns with economic objectives.
The table describes the concept, providing its definitions and the number of publications recorded within the specified timeframe. The increased use of these constructs signifies a societal shift toward integrating environmental considerations into economic frameworks and activities over the last three decades.
For example, concepts like ecosystem services, nature-based solutions and circular economy are the three most mentioned concepts in publications. This increased visibility and attention may be related to factors such as scientific comprehensiveness, the age of the concept, or its current trend. On the other hand, Nature Positive, Eco Certification, or Biodiversity Finance are more sporadic, potentially due to their novelty or limited relevance in public attention.
How has the popularity of nature metrics evolved over time? The dataset categorizes multiple publications for each concept based on the timescale and quantity. The diagrams help to visually present and assess the developmental trends, offering insights into the evolution and significance of each concept within the scientific or public literature, based on the assessed Web of Science database.
Figure 1 offers relevant insights into the existence and relevance of the concepts in the space of scientific literature. In general, all concepts exhibit a mostly linear growth rate from 1995 to 2015, experiencing exponential growth afterwards. Some terms like Nature Positive, Biodiversity Hotspots, Ecological Resilience, or Reforestation follow a similar trajectory, with substantial publications earlier in the last decade. Other concepts, like, for example, Nature-based Solutions, Ecosystem Services, Biodiversity Offsets, Payment for Ecosystem Services were barely or not at all registered before but suddenly gained attention between 2008 and 2014, growing above average. Although Nature-positive and ESG were mentioned in some publications earlier, they suddenly grew from the same tipping point onward (Figure 1). Lastly, Biodiversity Finance is a more recent concept, having gained relevance and scientific attention only in the last few years and still experiencing large variation in publications.
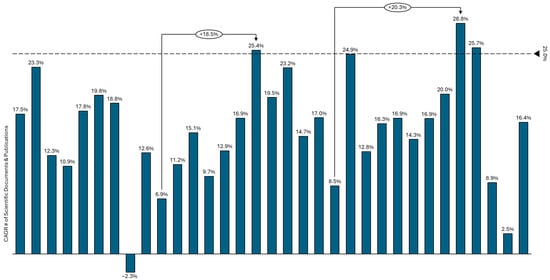
Figure 1.
Evolving Momentum of Biodiversity Metrics in Scientific Literature (yoy growth). (Annual volume of nature- and biodiversity-related concepts in Web of Science).
Today’s scientific perspectives on key concepts surrounding biodiversity are diverse, following various paradigms, trends, and frameworks. A comprehensive and universally applicable understanding of all these concepts guiding ecological and economic decision-making may not be available today. Nevertheless, this analysis has highlighted some key terms, showcasing their growing significance in the scientific field. As an outlook, the future trajectory of biodiversity finance and the factors shaping it need more scientific attention and literature analysis (Figure 2).
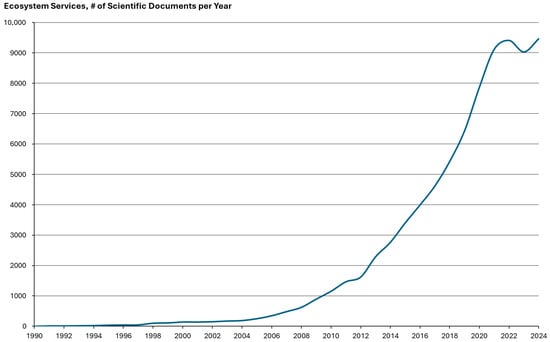
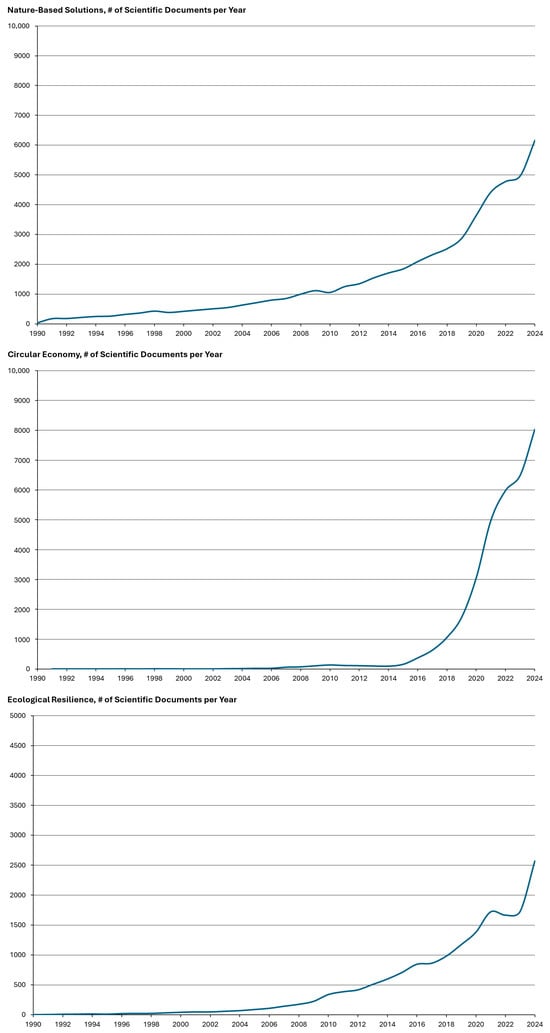
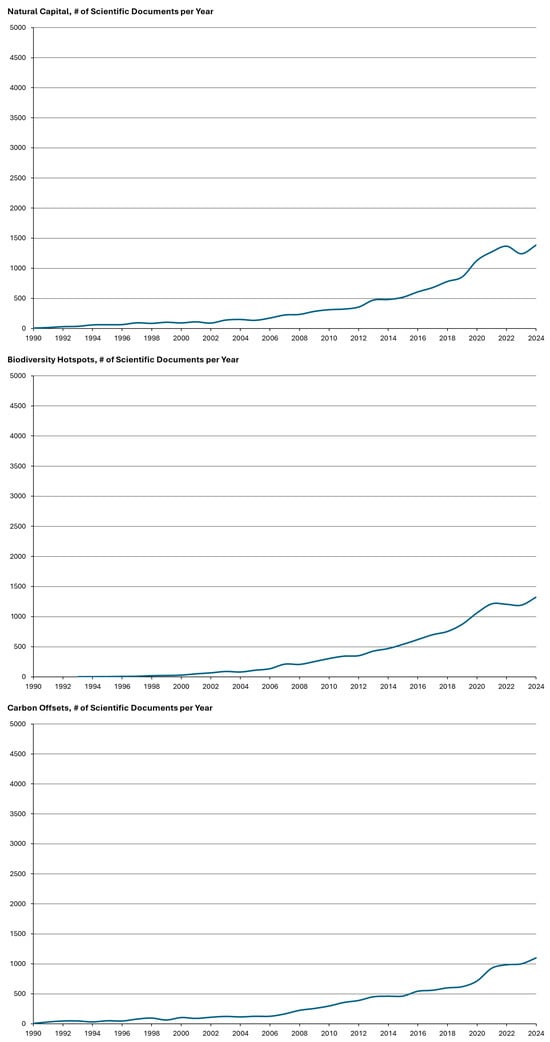
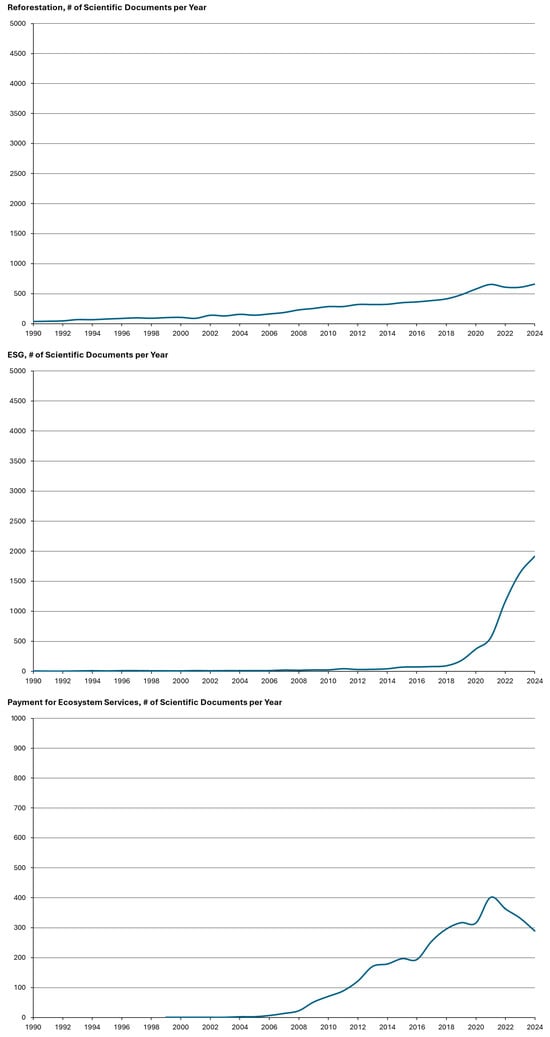
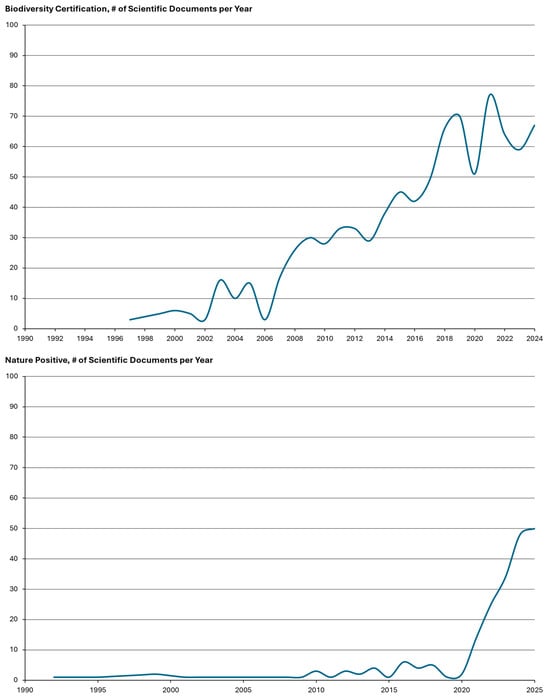
Figure 2.
List of nature- and biodiversity-related concepts. Source: Key search terms based on the author’s research during the E3B Workshop on biodiversity finance under the guidance of Dr. Shahid Naeem, presenting a quantitative literature review on defined concepts and their number of scientific documentation and focus publications related to the publication year based on the Web of Science—Columbia University Libraries.
2.3. Recommended Biodiversity Metrics in the Scientific Literature
The process of quantifying biodiversity to measure possible loss or growth is relevant for financial institutions. Unlike CO2e, there is currently no consensus on common metrics for biodiversity impact assessment, leading to multiple indexes measuring the same aspect. The IFC notes that the “TNFD does not currently specify one metric as there is no single metric that will capture all relevant dimensions of changes to the state of nature and a consensus is still developing” (IFC 2023, p. 61). In this section, we detail the most widely used metrics together with their meanings, measurements, and interpretation (Goedkoop et al. 2023; Seidl et al. 2020).
While there is no consensus yet in academia on what is the proper metric to measure, MSA (mean species abundance) and PDF (potentially disappeared fraction) are the most commonly cited. PDF directly measures species richness and response to environmental pressures. MSA directly measures species abundance and current conditions. Prof. Milner-Gulland, Director of the Interdisciplinary Centre for Conservation Science, Oxford, defends that no single biodiversity metric is the “holy grail”, but that for the practical purpose of advancing corporate measurement and action for biodiversity, “PDF is the right starting point” (Sukhdev 2024; Damiani et al. 2023).
Quantitative information on biodiversity is often complemented by qualitative information, adding information and a meaningful context such as baseline situation and the improvement attributable to a given project.
We detail below the five most cited metrics to approach biodiversity.
- Mean Species Abundance (MSA): The metric measures the intactness of local biodiversity in a given area. MSA focuses on measuring ecosystem functioning. The index compares the abundance of individual species under a specific pressure indicator to an undisturbed reference situation (GLOBIO n.d.; Damiani et al. 2023). MSA measures the relative abundance of native species. A score of 1 indicates a fully intact species assemblage, while a score of 0 implies the local extinction of all original species. More precisely, an area with an MSA of 0 percent has completely lost its native biodiversity (or is exclusively colonized by invasive species), whereas one with an MSA of 100 percent is considered equal in biodiversity to an ecosystem undisturbed by human activities and pressures.
- Potentially Disappeared Fraction of Species (PDF): The PDF presents a footprint metric based on a Life Cycle Assessment for biodiversity, highlighting the potential species loss caused by various impacts like land occupation, anthropogenic activities, climate change, and other impact drivers. It does not quantify final extinction but rather assesses the potential influence on species, considering that footprint changes are typically modest compared to global extinction drivers (Biodiversity Metrics n.d.).
- Living Planet Index (LPI): The World Wildlife Fund employs the Living Planet Index to track the pace of species extinction. It was adopted during the Convention on Biological Diversity and measures biological diversity based on population trends of vertebrate species from terrestrial, freshwater, and marine habitats. The organization utilizes a global dataset measuring the evolution of 5268 species and 38,427 populations. The index is based on trends from thousands of population time series collected from monitored sites around the world, measuring the increase or decrease in population and species diversity, which is essential to quantifying biodiversity loss (WWF n.d.).
- Range Size Rarity (RSR): This approach evaluates the impacts of small-scale impacts on local ecosystem ranges and species population development. The index divides species into grid cell and includes weights that reflect species’ range sizes, calculating the species range extent. It focuses on assessing changes relative to the local system, rather than national or global extinction levels (Voskamp et al. 2023).
- Species Threat Abatement and Recovery (STAR): The STAR metric assesses the impact of financial investments on mitigating the risk of species extinction and reversing biodiversity loss in a given environment. It identifies initiatives that yield benefits for threatened species and proposes actions towards threat abatement and habitat restoration, ultimately leading to safeguarding diversity in an ecosystem. Hereby, it helps various public and private stakeholders’ direct investments and efforts toward achieving conservation goals and aligning with environmental policy objectives (IUCN n.d.).
These metrics are useful for general guidance in measuring biodiversity, but the lack of standardized metrics and frameworks for assessing biodiversity impact poses major limitations to biodiversity finance (CISL 2020). The Cambridge Institute for Sustainability Leadership states:
There is no shortage of targets and indicators that measure biodiversity that are being used or proposed. However, many of these are difficult for companies to apply at a local level or to aggregate over all of their operations and value chains. Businesses require metrics which are credible, practical to use, easy to understand and relevant to their industry.(CISL 2020)
Companies have proactively challenged current metric systems and frameworks, constructing their own measurement tools. Drawing an analogy with the green bond market, companies have been developing their own internal systems to categorize and track projects that are deemed “green”, based on an accepted taxonomy or methodology of classification.
3. Biodiversity Finance: Analyzing a Unique Dataset from Capital Markets
3.1. Which Biodiversity Metrics Are Actually Used in Biodiversity Funds?
After analyzing biodiversity metrics recommended in a scientific context, as well as recommendations on reporting biodiversity finance, we now turn to an analysis of a unique dataset from capital markets. We analyzed a set of biodiversity funds with a global footprint as well as a complete dataset of bond issuances from Brazil, the country with the largest biodiversity assets.
We constructed and categorized the disclosure practices based on three segments: Impact, Governance and Framework. In this context, impact describes a certain action or initiative targeting biodiversity, which can often be quantified and measured in conventional metric systems, such as reduced CO2 emissions or the preservation of protected forests or wetlands in hectares. Governance describes the internal organizational processes related to statements of leadership motives towards the conservation of species and the ecosystem, charitable activities aimed at the conservation of biodiversity, or supporting communities reliant on certain ecosystem services. Lastly, the framework includes following internal as well as international biodiversity guidance systems, like, for example, the recommendations of the Taskforce on Nature-related Financial Disclosures, compliance with United Nations Sustainable Development Goal Nr. 15, or the red list of the International Union for Conservation of Nature. We selected five global funds, with a global and diversified footprint and which focus on natural capital. We analyzed their biodiversity disclosures on impact, governance, and frameworks (Table 3).
Table 3.
Review of biodiversity metrics used by investment funds.
In most cases, the biodiversity impact is measured in terms of the protection and restoration of ecosystems quantified in hectares, the reduction in carbon emissions measured in tons, and the mobilization of funding capital.
While some funds introduce unique KPIs, like agricultural yield, species abundance, or chemical indicators of soil and water quality, none of them discloses conventional biodiversity metrics related to species development, loss, or extinction, as discussed previously (LPI, MSA, PDF, etc.).
The projects and initiatives within the funds concentrate less on species developments and rather on environmental conservation and sustainable management in the given ecosystem (CISL 2020).
The majority of funds incorporated social impact indicators, emphasizing the quantification of job creation, gender equality, or local community engagement. This shift away from the main biodiversity frameworks aligns with the definition of biodiversity by Swingland, where humans are recognized as playing a vital role in biodiversity and its preservation.
Biodiversity funds include a broader range of ESG factors beyond a sole focus on biodiversity metrics and their conventional systems. Apart from ESG, many concepts identified in the literature review can be found in the disclosure reports, significantly influencing the fund’s engagement with biodiversity.
The research demonstrated further that the funds share a similar governance structure, presenting statements and information about their management and staff advocating for biodiversity restoration and protection but lacking quantifiable data and details. Some fund organizations incorporate a dedicated structure or internal due diligence team to ensure correct resource investment, control mechanisms, and risk management. The disclosed frameworks often reveal overlapping similarities, aligning with international organizations and their biodiversity measurement systems, such as TNFG, UNEP, or OPEC (OECD 2021). Many funds have strong ties to national or international public organizations and governmental agencies. This may be attributed to the fact that most frameworks for biodiversity finance are currently only published and supported by these organizations, or that the system of blended finance is predominant as private investments are still associated with high risk (Filho et al. 2018).
3.2. Which Biodiversity Metrics Are Actually Used in Bond Markets
As mentioned in the methodology section, we rely on a unique capital markets dataset for Brazilian issuances. We choose Brazil as it is the country with the largest biodiversity assets globally (World Economic Forum 2024; Guayasamin et al. 2024), suggesting corporates headquartered in Brazil could potentially have a higher incentive to integrate biodiversity considerations, as nature represents a higher risk and opportunity for their operations. Brazil presents a strong potential for sustainable finance (de Mariz 2022), even though disclosure remains a key issue (Yamahaki et al. 2025).
We analyze the complete sample of bonds issued by Brazilian companies, which represents 49 unique transactions for a total volume of $31 billion, over a time period spanning nine years from 2015 to 2024. Out of those 49 total transactions, 29 are use-of-proceeds labelled bonds, that is where funds are raised to be allocated to a predefined list of eligible projects with environmental and social benefits. The other 20 transactions are sustainability-linked bonds, where raised funds can be freely used and where the company commits to medium-term sustainability targets, leading to a higher cost of funding if targets are not met. 100% of the sample integrates metrics that to some extent impact biodiversity. CO2 emission reduction is the most common metric.
Two sectors—pulp & paper, food production—as well as the sovereign issuer represent the vast majority of transactions that carry biodiversity considerations, including companies such as BRF, Klabin, Suzano, Amaggi. Other issuers with a robust catalogue of biodiversity related metrics include Natura and Ambipar.
Preferred metrics by corporates relate to nature protection. Popular metrics include area of land restored or protected, certifications of production and suppliers (Bonsucro, green buildings or low-carbon sustainable agriculture), avoided amount of plastic used, projects related to resilience and disaster risk reduction, water and wastewater projects, or species monitored (see Appendix A for full list).
While the IFC in its seminal report on biodiversity metrics suggested a total catalogue of 339 biodiversity-related metrics, representing 158 unique metrics (some metrics were repeated across sectors such as CO2e emissions), our findings show the full sample of bond issuance relied on just 33 biodiversity-related metrics and fund managers relied on 32 metrics (Figure 3).
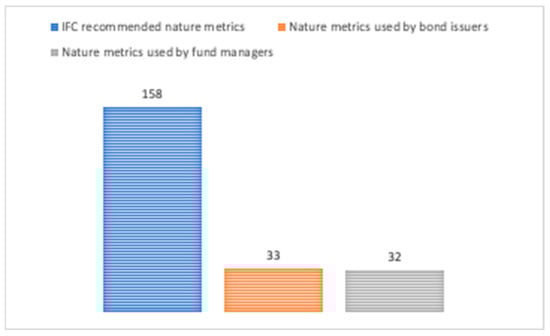
Figure 3.
Gap between science and capital markets: overlap between recommended and used metrics. Source: Authors, based on a full sample of bond issuances from companies headquartered in Brazil, from 2015 to 2024, available at NINT-ERM, and a global selection of five investment funds.
More metrics is not necessarily a good thing for the purpose of disclosure. That said, the gap between the long catalogs of metrics and the limited use cases suggests that either catalogs could be materially simplified, unified and streamlined and/or users could diversify their indicators.
On the flip side, some metrics that were deeply connected with biodiversity and nature did not appear on the IFC catalogue. This was almost exclusively the case for metrics reported by one issuer: the Republic of Brazil. Indicators listed on the country’s sustainability bond framework that are not considered in the IFC guidelines include:
- -
- Demarcated indigenous areas (ha);
- -
- Number of environmental inspection actions carried out annually;
- -
- Number of financed bio-inputs and biofertilizer production units;
- -
- Tract of land regularized (ha);
- -
- Wildfires (Number of hired fire brigades);
- -
- Number of rural properties compliant with the forestry code.
The metrics have a clear relationship with conformity to domestic regulations and are therefore well suited for a government entity. This highlights the potential to expand the IFC catalogue to sovereign issuers.
This also served to confirm the complete and exhaustive nature of the IFC catalogue when applied to corporates.
3.3. Discussion on the Nature Metrics Used in Liquid and Illiquid Markets
The analysis of liquid (bonds) and illiquid (funds) financial instruments highlight the diverse focus and level of complexity of nature and biodiversity metrics. Market participants for liquid instruments such as bonds, public equities, or exchange-traded funds denote a preference for clear, verifiable, trustworthy, comparable metrics. The preference is most likely due to a large number of participants and diverse investor profile, which makes a consensus on nature metrics more complex. Indicators are clearly quantified, in hectares or cubic meters, for example.
Forest cover and sustainable agriculture are the most common categories. Nature metrics on liquid markets include forest cover, preserved area, certification standards, or basic species monitoring.
Illiquid instruments like private equity, closed-end funds, or voluntary carbon markets involve longer time commitments for investors, they require a longer maturation for origination and structuring and typically involve a much smaller number of investors. Those structuring characteristics suggest that more tailored, complex metrics can be agreed upon, which may lack comparability and simplicity but may fit better with the project specificities and investors objectives. We count a similar number of indicators for illiquid markets (32) and liquid markets (33), even though the comparison has its limitation considering the difference in size and geographical scope of the two sets. Importantly, we find that indicators for illiquid markets such as funds emphasize social metrics and co-benefits and give a higher focus to projects (Table 4 and Table 5).
Table 4.
Summary of assessed metrics in illiquid funds.
Table 5.
Summary of assessed metrics in liquid bonds.
Sustainable agriculture, biodiversity and social co-benefits are the most common categories. Nature metrics on illiquid markets include emissions reduced through sustainable agricultural practices, species abundance, jobs created by projects.
4. Conclusions: The Path Forward for Biodiversity Finance
The global crisis of biodiversity loss has gained increasing attention in recent years. Currently, human activities, and the related effects of climate change, pose a significant threat to species, habitats, and biodiversity, affecting ecosystems worldwide. Consensus exists on the interconnectedness between biodiversity, climate change, and sustainable economic development. Economic sectors, such as construction, agriculture, and food and beverage production, heavily rely on nature and its services. Biodiversity loss not only affects the stability of ecosystems but also poses risks to industries and financial prosperity. To bridge the financing gap for biodiversity conservation, biodiversity finance has emerged as a strategy, integrating economic theory, practical applications, and diverse funding mechanisms.
The literature review revealed the increasing significance of terms, such as Natural Capital, Nature-Based Solutions, and Ecosystem Services, in the discourse on sustainable and biodiversity finance. The literature suggests a tipping point in 2020, when biodiversity considerations became more pervasive in academic literature. That being said, the literature on nature finance remains limited and presents a growing field of research.
The lack of widely accepted, science-based metrics for biodiversity impact assessment hinders effective measurement, implementation, and disclosure supporting nature-related projects and financial initiatives. While the IFC in its seminal report on biodiversity metrics suggested a total catalogue of 158 unique metrics, our findings show the full sample of bond issuance relied on just 33 biodiversity-related metrics and fund managers relied on 32 metrics. This gap between metrics suggested by science and metrics actually used in financial markets provide a strong support for the simplification effort supported by ICMA and others, with a practitioner’s guide for nature bonds proposing core indicators and additional indicators for projects.
More metrics is not necessarily a good thing for the purpose of disclosure. That said, the gap between the long catalogs of metrics and the limited use cases suggests that either catalogs could be materially simplified, unified and streamlined and/or users could diversify their indicators. A lack of consensus around metrics, complexity, and cost of measurement largely explain the gap between metrics developed by scientific bodies and multilaterals, and indicators relied upon by markets.
For standard-setting organizations, we find a potential to develop technical assistance for corporates and banks on the appropriate use of nature metrics. We also suggest market participants and corporates be involved in collaborative efforts to streamline those catalogs. There is also a potential to incorporate metrics dedicated to sovereign issuers in the catalogs.
For issuers and investors, we found a strong potential to increase the number of sectors that incorporate biodiversity-related metrics. Currently, sovereign issuers and corporates in two sectors (pulp & paper, food production) comprise the majority of sustainable finance instruments directly incorporating biodiversity considerations. Other sectors are emerging, such as water and sanitation, disaster prevention services, and cosmetics.
We also highlighted the importance to distinguish between illiquid financial instruments, which can rely on customized metrics, and liquid instruments, such as bonds, which rely on more standardized preservation-related metrics.
While our dataset relied on a global selection of funds and a complete set of issuances from the country with the largest nature assets, the limited number of funds and the analysis of one country only represent a limitation to our research. Future research may explore a wider set of issuances and private funds to generalize the conclusions.
Author Contributions
Conceptualization, F.S.-W. and F.d.M.; methodology, F.S.-W. and F.d.M.; formal analysis, F.S.-W., F.d.M. and C.L.; data curation, F.S.-W. and F.d.M.; writing—original draft preparation, F.S.-W. and F.d.M.; writing—review and editing, F.S.-W., F.d.M. and C.L.; supervision, F.d.M. All authors have read and agreed to the published version of the manuscript.
Funding
This research received no external funding.
Data Availability Statement
The original contributions presented in this study are included in the article. Further inquiries can be directed to the corresponding author.
Acknowledgments
The authors would like to thank Victor Hazell Laudisio for his comments on an earlier version of this article.
Conflicts of Interest
The authors declare no conflict of interest.
Appendix A
Table A1.
List of unique metrics recommended by IFC.
Table A1.
List of unique metrics recommended by IFC.
| Additional production per hectare (t/ha·y) |
| Ambient noise reduction (in decibels and % of baseline) |
| Amount spent on and insured by parametric insurance schemes for green/blue infrastructure (in $) |
| Annual absolute (gross) waste collected and treated (including composted) (in t/y and % of total waste; increase in %) |
| Area afforested with native or naturalized species (in ha and % of total area; increase in %) |
| Area covered by native or naturalized seed varieties (in ha and % of total area; increase in %) |
| Area covered by nature-based solution (in ha and % of total area under land management practices and/or infrastructure area; increase in %) |
| Area covered by services for restoration of natural habitats (in ha and % of total area; increase in %) |
| Area covered by sustainable land and water resources management practices (in ha and % of total area; increase in %) |
| Area covered by technologies that improve land-use and agricultural practices (in ha and % of total area; increase in %) |
| Area cultivated by precision agriculture (in ha and % of acreage farmed; increase in %) |
| Area cultivated with drought-resistant seeds (in ha and % of acreage farmed; increase in %) |
| Area cultivated with more resilient native or naturalized species (in ha and % of acreage farmed; increase in %) |
| Area of coral reefs covered by parametric insurance schemes for green/blue infrastructure (in ha) |
| Area of coral reefs created, rehabilitated, or restored (in ha and % of total area; increase in %) |
| Area of coral reefs under conservation practices or recognized as legally protected (in ha and % of total area; increase in %) |
| Area of land restored or rehabilitated (in ha and % of total area; increase in %) |
| Area of land under conservation practices (above legislation requirements) or recognized as legally protected (in ha and % of total area; increase in %) |
| Area of mangroves created, rehabilitated, or restored (in ha and % of total area; increase in %) |
| Area of mangroves under conservation practices or recognized as legally protected (in ha and % of total area; increase in %) |
| Area of natural forest regenerated (in ha and % of total area; increase in %) |
| Area of wetlands created, rehabilitated, or restored (in ha and % of total area; increase in %) |
| Area of wetlands under conservation practices or recognized as legally protected (in ha and % of total area; increase in %) |
| Area reforested with native or naturalized species (in ha and % of total area; increase in %) |
| Area under certified organic or sustainable agriculture (in ha and % of acreage farmed; increase in %) |
| Area under certified sustainable forest management (in ha and % of total area; increase in %) |
| Area under diverse cropping systems (in ha and % of total area farmed; increase in %) |
| Area under monitoring for biodiversity protection (in ha; increase in %) |
| Area under public-private partnership set aside for conservation (in buffer zones of protected areas) (in ha and % of total; increase in %) |
| Area under REDD+ ventures (in ha and % of total; increase in %) |
| Area under soil conservation/regenerative agricultural practices, including increased cover crop coverage, complex crop rotation, crop diversity practices, maintaining living roots/permanent soil coverage, and/or crop and livestock integration (in ha and % of acreage farmed; increase in %) |
| Area under wildlife- friendly management practices (in ha and % of acreage farmed; increase in %) |
| Area with climate adaptation resilience measure implemented (in ha and % of total area; increase in %) |
| Avoided amount of plastic used (in t/y and % of total; increase in %) |
| Avoided and/or sequestered GHG emissions (tCO2e/y) |
| Avoided fishery loss (in t/y; increase in %) |
| Avoided plastic and/or solid waste runoff to freshwater and marine habitats (in t/y; increase in %) |
| Biodegradable fishing gear (in t and % of total gear; increase in %) |
| Biodiversity credits generated, with description of type and environmental asset behind (in number and $) |
| Capacity of ballast water treatment (in m3/s; increase in %) |
| Capacity of bilge water treatment (in m3/s; increase in %) |
| Capacity of cold storage (in t/y; increase in %) |
| Capacity of membrane bioreactor-type water treatment (in m3/s; increase in %) |
| Capacity of storage or facility (in t/y; increase in %) |
| Capacity of the nature-based structure (in m3/s or m3 and % of total capacity if combined with gray infrastructure; increase in %) |
| Carbon credits generated, with description of type and environmental asset behind (in number and $) |
| Certified sustainable seafood products produced/traded/retailed (in t/y and % of total; increase in %) |
| Changes in the CO2, nutrient, and/or pH levels for coral reefs (in %) |
| Compostable and/or biodegradable products manufactured/traded/retailed (in t/y and % of total; increase in %) |
| Conservation workers (for example, game wardens, rangers, and natural park officials) trained in biodiversity conservation (number and % of workforce; increase in %) |
| Conversion of agricultural land to more diverse cropping systems (for example, agroforestry) (in ha and % of acreage farmed) |
| Description of biodiversity significance and main species included |
| Description of key species using the wildlife crossings/corridors created |
| Description of type of natural or ecological infrastructure used |
| Description of types of technologies adopted |
| Distinct crops/plant families farmed (in number/ha) |
| Enabled ecosystem services (for example, water recharge in m3/y) |
| Farmland covered by native species with low water consumption (in ha and % of acreage farmed; increase in %) |
| Farmland covered by new or rehabilitated efficient irrigation (in ha and % of acreage farmed; increase in %) |
| Farmland covered by sustainable agricultural practices/varieties/technology and/or infrastructure that increases crop yields/quality on existing land without increasing the environmental footprint (in ha and % of acreage farmed; increase in %) |
| Feedstock/feed supply chain certification coverage (% of total feedstock/feed volume; increase in %) |
| Fisheries by-catch (in t/y and % of total catch; reduction in %) |
| Fishery production covered by parametric insurance schemes for green/blue infrastructure (in t/y; increase in %) |
| Forestry personnel trained in biodiversity conservation (in number and % of workforce; increase in %) |
| Improvement in the Species Threat Abatement and Restoration (STAR) score |
| Improvements in site-specific physical, chemical, and/or biological indicators of soil quality |
| Improvements in water quality indicators |
| Increase in area under integrated pest management (in ha and % of acreage farmed) |
| Increase in plastic materials reused or repurposed (as absolute amount and % of the total material of the project) |
| Increase in species richness and relative abundance of priority biodiversity species (in number) |
| Increase in the biotope area factor (in number and %) |
| Increase in the Ecosystem Integrity Index |
| Increase in the Ecosystem Integrity Index |
| Increase in the Forest Landscape Integrity Index |
| Increase in the share of circular materials used as a % of the total material use of the project (in %) |
| Increase in the share of revenues generated or share of nutrients sold from plant-based products as beef alternatives (in %) |
| Increase in water recycled and/or reused per hectare or per tonne of production (in m3/ha·y or m3/t·y and %) |
| Increase of afforested production buffer area (in ha and % of total area) |
| Investment in mechanisms and conservation trust funds that support payment for ecosystem services (in $; increase in %) |
| Investment in research and innovative technology related to biodiversity (in $; increase in %) |
| Investment in research and innovative technology related to recycling plastics (in $; increase in %) |
| Investment in technologies to avoid transportation of invasive species (in $; increase in %) |
| Length of coastal area covered by parametric insurance schemes for green/blue infrastructure (in km; increase in %) |
| Low-carbon and/or biodegradable fibers manufactured/traded/retailed (in t/y and % of total; increase in %) |
| Low-impact fishing gear by type of catch (in % of operations covered; increase in %) |
| Marine and/or terrestrial vehicles retrofitted to avoid transportation of invasive species (in number; increase in %) |
| Marine area rehabilitated or restored (in ha and % of total area; increase in %) |
| Marine area under conservation practices or recognized as legally protected (in ha and % of total area; increase in %) |
| Native non-timber products in the project (in absolute number; increase in %) |
| Native or naturalized seed varieties conserved/produced (in absolute number and t/y; increase in %) |
| Number of measures adopted to reduce temperatures of used water discharged |
| Number of native species integrated in green/blue urban infrastructure |
| Number of wetlands created, financed, rehabilitated, restored, or under conservation practices (in number; increase in %) |
| Nutrient credits generated, with description of type (in number and $) |
| On-farm compost produced and applied to farmland (in t/y; increase in %) |
| Payment for ecosystem services (description and amount in $; increase in %) |
| People and/or enterprises (such as companies or farms) benefiting from measures to mitigate the consequences of floods (in number; increase in %) |
| People and/or enterprises (such as companies or farms) benefiting from measures to mitigate the consequences of floods and droughts (in number; increase in %) |
| People and/or enterprises (such as companies or farms) benefiting from parametric insurance schemes for green/blue infrastructure (in number; increase in %) |
| People from local communities employed (in number and % of workforce; increase in %) |
| People/households benefiting from sanitation (in number; increase in %) |
| People/households benefiting from wastewater treatment (in number; increase in %) |
| Plastic waste that is prevented, minimized, repurposed, reused, or recycled (in t/y and % of total waste; increase in %) |
| Private landowners participating in the public-private partnership mechanism (in number; increase in %) |
| Processing capacity of the plastic recycling facility (in t/y; increase in %) |
| Product water flow rate compared with standard water flow rate (in liters per minute and % of reduction) |
| Production covered by organic or sustainable agriculture certification (in t/y and % of total production; increase in %) |
| Production covered by regenerative agriculture certification (in t/y and % of total production; increase in %) |
| Production covered by regenerative aquaculture certification (in t/y and % of total production; increase in %) |
| Production covered by sustainable aquaculture certification (in t/y and % of total production; increase in %) |
| Production covered by sustainable fishery certification (in t/y and % of total; increase in %) |
| Production of native non-timber forest products (in t/y and % of total; increase in %) |
| Production of sustainable wood and wood products (in t/y and % of total production; increase in %) |
| Production/retail covered by an internationally recognized eco-label, eco-efficiency, or other relevant environmental certification (in t/y and % of total; increase in %) |
| Production/supply covered by traceability mechanisms, data, and technologies (in t/y and % of total production/supply; increase in %) |
| Products awarded an internationally recognized eco-label, eco-efficiency, or other relevant environmental certification (in number; increase in %) |
| Products produced from recycled plastic (in number of different products and in t/y of each type) |
| Rainwater capture capacity of the structure (in m3/y; increase in %) |
| Reduction in antibiotic use (in % of the total used) |
| Reduction in flood damage costs (in $ and %) |
| Reduction in land loss from inundation and/or coastal erosion (in ha) |
| Reduction in operating days lost to floods (in number) |
| Reduction in pesticide use (in kg/ha and % of total pesticide used) |
| Reduction in repair costs due to storms (to all kinds of infrastructure and assets) (in $ and %) |
| Reduction in synthetic fertilizer in total fertilizer used (in %) |
| Reduction in synthetic fertilizer use intensity (in kg/ha) |
| Reduction in temperatures of used water discharged (in °C and %) |
| Reduction in the annual absolute (gross) water use (in m3/y and %) |
| Reduction in the annual absolute (gross) water use per hectare or per tonne of production (in m3/ha·y or m3/t·y and %) |
| Reduction in the number of wildfires and/or in the area damaged by wildfires (in number and/or ha) |
| Reduction or removal of harmful substances (persistent, carcinogenic, mutagenic, reprotoxic) used (in % in comparison to the original design and/or in t/y) |
| Road, rail, or other infrastructure retrofitted (in km; increase in %) |
| Share of annual revenues derived from tools and services enabling traceability (in %; increase in %) |
| Share of annual revenues derived from water conservation products for residential and commercial use (in %; increase in %) |
| Share of business/assets covered by certification (in %; increase in %) |
| Share of business/assets covered by sustainable tourism or eco-tourism certification (in %; increase in %) |
| Share of fleet with noise reduction technology (in %; increase in %) |
| Share of revenues directly contributing to conservation and/or supporting local communities (in %; increase in %) |
| Share of solar panels with cooling system totally based on nature-based solutions (in %; increase in %) |
| Share of sustainable material (such as timber and bamboo) used as construction material (in %) |
| Species under monitoring (in number; increase in %) |
| Sustainable seafood production of bivalves and seaweed (in t/y; increase in %) |
| Technologies deployed in operations to avoid the transportation of invasive species (description and number) |
| Technologies related to biodiversity developed and demonstrated (in number; increase in %) |
| Technologies related to recycling plastics developed and demonstrated (in number; increase in %) |
| Used water discharged with reduced temperature (in m3/y; increase in %) |
| Vessels with ballast water treatment systems installed (in number and % of fleet; increase in %) |
| Vessels with bilge water treatment systems installed (in number and % of fleet; increase in %) |
| Vessels with by-catch exclusion devices and other fishing gear modification programs (in number and % of fleet; increase in %) |
| Vessels with membrane bioreactor-type water treatment systems installed (in number and % of fleet; increase in %) |
| Vessels with navigation systems that include biodiversity-protection technology (in number and % of fleet; increase in %) |
| Waste that is prevented, minimized, repurposed, reused, or recycled (in t/y and % of total waste; increase in %) |
| Wastewater treatment capacity of the structure (in m3/y; increase in %) |
| Water conservation products developed/manufactured (in number; increase in %) |
| Water recycled and/or reused per hectare or per tonne of production (in m3/ha·y or m3/t·y; increase in %) |
| Water treated, reused, or recycled (in m3/y; increase in %) |
| Wetlands created, financed, rehabilitated, restored, or under conservation practices (in number; increase in %) |
| Wildlife crossings/corridors created (in number and ha; increase in %) |
Source: IFC (2023).
Table A2.
List of unique metrics used by bond issuers.
Table A2.
List of unique metrics used by bond issuers.
| Issuer | Date of Issuance | Metric | Mapping (Corresponding Metric in IFC Catalog) |
|---|---|---|---|
| Amaggi | Dec-2020 | Number of researches and implementations of innovative agricultural | Farmland covered by sustainable agricultural practices/varieties/technology and/or infrastructure that increases crop yields/quality on existing land without increasing the environmental footprint (in ha and % of acreage farmed; increase in %) |
| Amaggi | Dec-2020 | Area monitored and registered at ORIGINAR system (hectares) | Product water flow rate compared with standard water flow rate (in liters per minute and % of reduction) |
| Amaggi | Dec-2020 | Sustainable agriculture (production on new farms) | Production covered by organic or sustainable agriculture certification (in t/y and % of total production; increase in %) |
| Amaggi | Dec-2020 | Traceability of direct suppliers in the priority jurisdictions (%) | Production/supply covered by traceability mechanisms, data, and technologies (in t/y and % of total production/supply; increase in %) |
| Ambipar | Jan-2024 | Increased proportion of circular materials produced. | Increase in the share of circular materials used as a % of the total material use of the project (in %) |
| Brasil | Sep-2023 | Reforested area (ha) | Area afforested with native or naturalized species (in ha and % of total area; increase in %) |
| Brasil | Sep-2023 | Area of planted forests | Area covered by native or naturalized seed varieties (in ha and % of total area; increase in %) |
| Brasil | Sep-2023 | Area under natural regeneration | Area of natural forest regenerated (in ha and % of total area; increase in %) |
| Brasil | Sep-2023 | Projects/initiatives supported by the Program “ABC” that guarantee the preservation, management and sustainable use of natural resources, recovery of endemic species | Area under certified organic or sustainable agriculture (in ha and % of acreage farmed; increase in %) |
| Brasil | Sep-2023 | Area of adoption of Crop-Livestock-Forest Integration (iLPF) | Conservation workers (for example, game wardens, rangers, and natural park officials) trained in biodiversity conservation (number and % of workforce; increase in %) |
| Brasil | Sep-2023 | Area of adoption of irrigated systems | Farmland covered by native species with low water consumption (in ha and % of acreage farmed; increase in %) |
| Brasil | Sep-2023 | Disaster risk management (actions to raise roads and infrastructure) | Reduction in flood damage costs (in $ and %) |
| Brasil | Sep-2023 | Disaster risk management (reduce land loss and coastal erosion in km2) | Reduction in operating days lost to floods (in number) |
| Brasil | Sep-2023 | Clean transportation. Railways | Road, rail, or other infrastructure retrofitted (in km; increase in %) |
| Brasil | Sep-2023 | Number of species monitored | Species under monitoring (in number; increase in %) |
| Brasil | Sep-2023 | Volume of effluents treated annually and proportion relative to total | Wastewater treatment capacity of the structure (in m3/y; increase in %) |
| Brasil | Sep-2023 | Number of sponsored projects related to waterbodies protection | Wetlands created, financed, rehabilitated, restored, or under conservation practices (in number; increase in %) |
| BRF | 2016 | Forests with sustainable management (hectares) | Area covered by sustainable land and water resources management practices (in ha and % of total area; increase in %) |
| BRF | 2016 | Packaging materials consumption reduced (t) | Plastic waste that is prevented, minimized, repurposed, reused, or recycled (in t/y and % of total waste; increase in %) |
| BTG Pactual | Oct-2020 | Number of people provided access to improved sanitation facilities | People/households benefiting from sanitation (in number; increase in %) |
| Klabin | Aug-2017 | Forest Productivity (m3/ha/year) | Area covered by technologies that improve land-use and agricultural practices (in ha and % of total area; increase in %) |
| Klabin | Aug-2017 | Effectiveness of adaptation actions, where feasible | Area with climate adaptation resilience measure implemented (in ha and % of total area; increase in %) |
| Klabin | 30-Aug-2017 | Water consumption reduced/avoided (m3 or m3/adt) | Water recycled and/or reused per hectare or per tonne of production (in m3/ha·y or m3/t·y; increase in %) |
| Klabin | 30-Aug-2017 | Water consumption (m3 or m3/adt) | Water treated, reused, or recycled (in m3/y; increase in %) |
| LDC | Sep-2024 | Area with restoration in progress (Number of trees/seedlings/shrubs planted and/or bought from certified forests) | Area of land restored or rehabilitated (in ha and % of total area; increase in %) |
| LDC | Sep-2024 | Reduction in the number of wildfires, and/or in the area damaged by wildfires in km2 | Reduction in the number of wildfires and/or in the area damaged by wildfires (in number and/or ha) |
| LDC | Sep-2024 | Wastewater avoided, reused or minimized at source | Waste that is prevented, minimized, repurposed, reused, or recycled (in t/y and % of total waste; increase in %) |
| Natura | Apr-2021 | PCR plastic used in plastic packaging (%) | Avoided amount of plastic used (in t/y and % of total; increase in %) |
| Raizen | Sep-2024 | Certification of biofuel (suppliers that are certified Elos, Bonsucro, or equivalent) | Feedstock/feed supply chain certification coverage (% of total feedstock/feed volume; increase in %) |
| Suzano | Jun-2016 | Number of HCV areas identified and maintained | Area of land under conservation practices (above legislation requirements) or recognized as legally protected (in ha and % of total area; increase in %) |
| Suzano | Jun-2016 | Tons of fossil fuel saved/reduced | Avoided and/or sequestered GHG emissions (tCO2e/y) |
| Suzano | Jun-2016 | Number of research studies developed at Parque das Neblinas | Description of biodiversity significance and main species included |
| Suzano | Jun-2016 | Number of ecotourists at Parque das Neblinas | Share of business/assets covered by sustainable tourism or eco-tourism certification (in %; increase in %) |
Source: Authors, based on unique dataset of issuers headquartered in Brazil, available at ERM-NINT, for the years 2015–2024.
References
- Alamillos, Rocío Redondo, and Frédéric de Mariz. 2022. How Can European Regulation on ESG Impact Business Globally? Journal of Risk and Financial Management 15: 291. [Google Scholar] [CrossRef]
- AMNH. 2023. What Is Biodiversity? Why Is It Important? American Museum of Natural History. Available online: www.amnh.org/research/center-for-biodiversity-conservation/what-is-biodiversity (accessed on 20 September 2025).
- Bernhardt, Joey R., Mary I. O’Connor, Jennifer M. Sunday, and Andrew Gonzalez. 2020. Life in fluctuating environments. Philosophical Transactions of the Royal Society B 375: 20190454. [Google Scholar] [CrossRef] [PubMed]
- Biodiversity Metrics. n.d. Understanding Biodiversity Metrics. Available online: www.biodiversity-metrics.org/understanding-biodiversity-metrics.html (accessed on 20 October 2025).
- Bluemark. 2025. Making the Mark. Available online: https://bluemark.co/app/uploads/2025/05/making-the-mark-vi-2025-vf.pdf (accessed on 20 September 2025).
- Carney, Mark. 2015. Available online: https://www.bankofengland.co.uk/speech/2015/breaking-the-tragedy-of-the-horizon-climate-change-and-financial-stability (accessed on 20 October 2025).
- CBD. 1993. Convention on Biological Diversity. Available online: https://www.un.org/ldcportal/content/convention-biological-diversity-and-its-protocols (accessed on 20 October 2025).
- CISL. 2020. Measuring Business Impacts on Nature: A Framework to Support Better Stewardship of Biodiversity in Global Supply Chains. Cambridge: University of Cambridge Institute for Sustainability Leadership. [Google Scholar]
- Damiani, Mattia, Taija Sinkko, Carla Caldeira, Davide Tosches, Marine Robuchon, and Serenella Sala. 2023. Critical review of methods and models for biodiversity impact assessment and their applicability in the LCA context. Environmental Impact Assessment Review 101: 107134. [Google Scholar] [CrossRef]
- Dasgupta, Partha. 2021. The Economics of Biodiversity: The Dasgupta Review. London: HM Treasury. [Google Scholar]
- de Mariz, Frederic. 2022. The Promise of Sustainable Finance: Lessons From Brazil. Georgetown Journal of International Affairs 23: 185–90. [Google Scholar] [CrossRef]
- de Mariz, Frederic, and José Roberto Ferreira Savoia. 2018. Financial innovation with a social purpose: The growth of Social Impact Bonds. In Research Handbook of Investing in the Triple Bottom Line. Cheltenham: Edward Elgar Publishing, pp. 292–313. Available online: https://ssrn.com/abstract=3306818 (accessed on 20 October 2025).
- de Mariz, Frederic, Laura Aristizábal, and Daniela Andrade Álvarez. 2024a. Fiduciary duty for directors and managers in the light of anti-ESG sentiment: An analysis of Delaware Law. Applied Economics 57: 4309–4320. [Google Scholar] [CrossRef]
- de Mariz, Frederic, Pieter Bosmans, Daniel Leal, and Saumya Bisaria. 2024b. Reforming Sustainability-Linked Bonds by Strengthening Investor Trust. Journal of Risk and Financial Management 17: 290. [Google Scholar] [CrossRef]
- de Mariz, Frederic, Xavier Reille, and Daniel Rozas. 2011. Discovering Limits. Global Microfinance Valuation Survey 2011. Global Microfinance Valuation Survey. Available online: https://ssrn.com/abstract=2654041 (accessed on 20 October 2025). [CrossRef]
- Deutz, Andrew, Geoffrey M. Heal, Rose Niu, Eric Swanson, Terry Townshend, Li Zhu, Alejandro Delmar, Alqayam Meghji, Suresh A. Sethi, and John Tobin-de la Puente. 2020. Financing Nature: Closing the Global Biodiversity Financing Gap. Chicago: The Paulson Institute. Arlington: The Nature Conservancy. New York: The Cornell Atkinson Center for Sustainability. 256p. [Google Scholar] [CrossRef]
- European Commission. 2025. Roadmap Towards Nature Credits. Available online: https://eur-lex.europa.eu/legal-content/EN/TXT/?uri=celex:52025DC0374 (accessed on 20 October 2025).
- Filho, Walter Leal, Diana Mihaela Pociovălișteanu, Paulo Roberto Borges de Brito, and Ismar Borges de Lima. 2018. Towards a Sustainable Bioeconomy: Principles, Challenges and Perspectives. Berlin and Heidelberg: Springer International Publishing. [Google Scholar]
- Flammer, Caroline, and Frederic de Mariz. 2025. Case Studies on Blended Finance and Sustainable Investing in Brazil. Available online: https://ssrn.com/abstract=5317840 (accessed on 25 October 2025). [CrossRef]
- Flammer, Caroline, Thomas Giroux, and Geoffrey M. Heal. 2023. Biodiversity Finance. Journal of Financial Economics 164: 103987. [Google Scholar] [CrossRef]
- GIIN. n.d. IRIS+ Catalog of Metrics. Available online: https://iris.thegiin.org/metrics/?search=biodiversity&sortby= (accessed on 25 October 2025).
- Glisovic, Jasmina, Henry González, Yasemin Saltuk, and Frederic de Mariz. 2012. Volume Growth and Valuation Contraction Global Microfinance Equity Valuation Survey 2012. Available online: https://ssrn.com/abstract=2625221 (accessed on 25 October 2025). [CrossRef]
- GLOBIO—Global Biodiversity Model for Policy Support. n.d. The Mean Species Abundance (MSA) Metric. Available online: www.globio.info (accessed on 31 July 2025).
- Goedkoop, Mark, Axel G. Rossberg, and Henri Dumont. 2023. Bridging the Gap Between Biodiversity Footprint Metrics and Biodiversity State Indicator Metrics. Fact based Sustainability—Sustainability Prè. Available online: http://www.biodiversity-metrics.org/uploads/1/2/7/5/127509512/bridging_the_gap_between_biodiversity_footprint_and_biodiversity_state_indicator_metrics_2e.pdf (accessed on 20 October 2025).
- Guayasamin, Juan M., Camila C. Ribas, Ana C. Carnaval, Juan D. Carrillo, Carina Hoorn, Lúcia G. Lohmann, Douglas Riff, Carmen Ulloa Ulloa, and James S. Albert. 2024. Evolution of Amazonian biodiversity: A review. Acta Amazonica 54: e54bc2136. [Google Scholar] [CrossRef]
- ICMA. 2020. The GBP Impact Reporting Working Group—Suggested Impact Reporting Metrics for Biodiversity Projects. April. Available online: https://www.icmagroup.org/assets/documents/regulatory/green-bonds/standalone-biodiversity-impact-metrics-april-2020-200420.pdf (accessed on 20 October 2025).
- ICMA. 2023. Market Integrity and Greenwashing Risks in Sustainable Finance. Available online: https://www.icmagroup.org/assets/documents/Sustainable-finance/Market-integrity-and-greenwashing-risks-in-sustainable-finance-October-2023.pdf (accessed on 20 October 2025).
- ICMA. 2024. Impact Disclosure Guidance. Available online: https://www.icmagroup.org/assets/documents/Sustainable-finance/Impact-Disclosure-Guidance-October-2024-181024.pdf (accessed on 20 October 2025).
- ICMA. 2025. Sustainable Bonds for Nature: A Practitioner’s Guide. Available online: https://www.icmagroup.org/assets/documents/Sustainable-finance/2025-updates/Sustainable-Bonds-for-Nature-A-Practitioners-Guide-June-2025.pdf (accessed on 20 October 2025).
- IFC. 2023. Biodiversity Finance Reference Guide—Building on the Green Bond Principle and Green Loan Principles. IFC The World Bank Group. Available online: https://www.ifc.org/content/dam/ifc/doc/mgrt/biodiversity-finance-reference-guide.pdf (accessed on 20 October 2025).
- IUCN. n.d. Species Threat Abatement and Restoration (STAR) Metric. International Union for Conservation of Nature. Available online: www.iucn.org/resources/conservation-tool/species-threat-abatement-and-restoration-star-metric (accessed on 20 October 2025).
- Karolyi, G. Andrew, and John Tobin-de la Puente. 2023. Biodiversity Finance a Call for Research into Financing Nature. Financial Management 52: 231–51. [Google Scholar] [CrossRef]
- Malhi, Yadvinder, J. Timmons Roberts, Richard A. Betts, Timothy J. Killeen, Wenhong Li, and Carlos A. Nobre. 2008. Climate change, deforestation, and the fate of the Amazon. Science 319: 169–72. [Google Scholar] [CrossRef] [PubMed]
- Montreal Agreement. 2022. COP15: Nations Adopt Four Goals, 23 Targets for 2030 in Landmark UN Biodiversity Agreement. Available online: https://www.cbd.int/article/cop15-cbd-press-release-final-19dec2022 (accessed on 25 October 2025).
- Naeem, Shahid, Lindsey J. Thompson, Sharon P. Lawler, John H. Lawton, and Richard M. Woodfin. 1994. Declining biodiversity can alter the performance of ecosystems. Nature 368: 734–37. [Google Scholar] [CrossRef]
- NGFS. 2023. Nature-Related Financial Risks: A Conceptual Framework to Guide Action by Central Banks and Supervisors. Network for Greening the Financial System (NGFS). Available online: https://www.ngfs.net/sites/default/files/medias/documents/ngfs_conceptual-framework-on-nature-related-risks.pdf (accessed on 20 October 2025).
- NIH. 1999. What is Biodiversity? National Research Council (US) Committee on Noneconomic and Economic Value of Biodiversity. Perspectives on Biodiversity: Valuing Its Role in an Everchanging World. Washington, DC: National Academies Press (US). [Google Scholar]
- O’Donohoe, Nick, Frederic de Mariz, Elizabeth Littlefield, Xavier Reille, and Christoph Kneiding. 2009. Shedding Light on Microfinance Equity Valuation: Past and Present. Available online: https://ssrn.com/abstract=2619149 (accessed on 20 October 2025). [CrossRef]
- O’Donohoe, Nick, Frederic de Mariz, Xavier Reille, and Christoph Kneiding. 2010. All Eyes on Asset Quality: Microfinance Global Valuation Survey 2010. Available online: https://ssrn.com/abstract=2625241 (accessed on 20 October 2025). [CrossRef][Green Version]
- OECD. 2021. Biodiversity, Natural Capital and the Economy: A Policy Guide for Finance, Economic and Environment Ministers. OECD Environmental Policy Paper No 26. Paris: Organization for Economic Cooperation and Development. [Google Scholar][Green Version]
- OECD. 2022. A Comprehensive Overview of Global Biodiversity Finance. Final Report. Paris: Organization for Economic Cooperation and Development. [Google Scholar][Green Version]
- Olsen, Lauren, and Frederic de Mariz. 2025. Attracting More Capital for Biodiversity Finance: The Case of Debt-for-Nature Instruments. Commodities 4: 7. [Google Scholar] [CrossRef]
- Rossberg, Axel G., Jacob D. O’Sullivan, Svetlana Malysheva, and Nadav M. Shnerb. 2023. A metric for tradable biodiversity credits linked to the Living Planet Index and global species conservation. Journal of Industrial Ecology 28: 1009–21. [Google Scholar] [CrossRef]
- Seidl, Andrew, Kelvin Mulungu, Marco Arlaud, Onno van den Heuvel, and Massimiliano Riva. 2020. Massimiliano Riva. Finance for nature: A global estimate of public biodiversity investments. Ecosystem Services 46: 101216. [Google Scholar] [CrossRef]
- Sukhdev, Pavan. 2024. Presented at Sustainability Conference, Sao Paulo, Brazil, December 2–3. Available online: https://www.cityandfinancialglobal.com/sustainability-reporting-summit-2024?i= (accessed on 1 September 2025).
- Sukhdev, Pavan, Heidi Wittmer, and Dustin Miller. 2014. The Economics of Ecosystems and Biodiversity (TEEB): Challenges and Responses. In Nature in the Balance: The Economics of Biodiversity. Edited by D. Helm and C. Hepburn. Oxford: Oxford University Press. [Google Scholar]
- Swingland, Ian R. 2001. Biodiversity, definition of. Encyclopedia of Biodiversity 1: 377–91. [Google Scholar]
- The Nature Conservancy. 2020. Closing the Nature Funding Gap: A Finance Plan for the Planet. Available online: www.nature.org/en-us/what-we-do/our-insights/perspectives/closing-nature-funding-gap-global-biodiversity-finance (accessed on 20 October 2025).
- Tideline. 2019. Catalytic Capital. Unlocking More Investment and Impact. Available online: https://tideline.com/wp-content/uploads/2020/11/Tideline_Catalytic-Capital_Unlocking-More-Investment-and-Impact_March-2019.pdf (accessed on 20 October 2025).
- TNFD. 2023. Recommendations of the Taskforce on Nature-Related Financial Disclosures. Taskforce on Nature-related Financial Disclosures (TNFD). Available online: https://tnfd.global/wp-content/uploads/2023/08/Recommendations_of_the_Taskforce_on_Nature-related_Financial_Disclosures_September_2023.pdf (accessed on 20 October 2025).
- UNEP. 2023. Global Annual Finance Flows of $7 Trillion Fueling Climate, Biodiversity, and Land Degradation Crises. Available online: https://www.unep.org/news-and-stories/press-release/global-annual-finance-flows-7-trillion-fueling-climate-biodiversity#:~:text=Dubai%2C%209%20December%202023%20–%20Close,and%20healthy%20land%20and%20nature (accessed on 10 September 2025).
- United Nations. 2023. Biodiversity—Our Strongest Natural Defense Against Climate Change. Available online: www.un.org/en/climatechange/science/climate-issues/biodiversity (accessed on 20 October 2025).
- United Nations. 2024. COP28 Joint Statement on Climate, Nature and People. Available online: www.cop28.com/en/joint-statement-on-climate-nature (accessed on 20 October 2025).
- Voskamp, Alke, Susanne A. Fritz, Valerie Köcke, Matthias F. Biber, Timo Nogueira Brockmeyer, Bastian Bertzky, Matthew Forrest, Allie Goldstein, Scott Henderson, Thomas Hickler, and et al. 2023. Utilizing multi-objective decision support tools for protected area selection. One Earth 6: 1143–56. [Google Scholar] [CrossRef]
- World Economic Forum. 2020. Half of World’s GDP Moderately or Highly Dependent on Nature, Says New Report. Available online: https://www.weforum.org/press/2020/01/half-of-world-s-gdp-moderately-or-highly-dependent-on-nature-says-new-report/ (accessed on 20 October 2025).
- World Economic Forum. 2024. Available online: https://www.weforum.org/stories/2024/06/environment-day-biodiversity-world-megadiverse-countries/ (accessed on 20 October 2025).
- WWF. 2022. Living Planet Report 2022. Available online: www.wwf.de/living-planet-report (accessed on 20 October 2025).
- WWF. n.d. Living Planet Index. World Wildlife Fund. ZSL Let’s Work for Wildlife. Available online: https://www.livingplanetindex.org (accessed on 20 October 2025).
- Yamahaki, Camila, Frederic de Mariz, and Annelise Vendramini. 2025. Are Thematic Bond Issuers Keeping Their Promises? A Contribution to the Greenwashing Analysis. Available online: https://ssrn.com/abstract=5160616 (accessed on 20 October 2025). [CrossRef]
Disclaimer/Publisher’s Note: The statements, opinions and data contained in all publications are solely those of the individual author(s) and contributor(s) and not of MDPI and/or the editor(s). MDPI and/or the editor(s) disclaim responsibility for any injury to people or property resulting from any ideas, methods, instructions or products referred to in the content. |
© 2025 by the authors. Licensee MDPI, Basel, Switzerland. This article is an open access article distributed under the terms and conditions of the Creative Commons Attribution (CC BY) license (https://creativecommons.org/licenses/by/4.0/).