Abstract
One perspective suggests that firms heavily involved in innovation may face increased risks. It is essential to know the suitable proxies in measuring innovation related to risk taking. Many studies use research-and-development intensity (RDI) and research-and-development spending (RDS) as proxies for innovation related to risk taking. However, little evidence shows that positive association with risk taking. This study addresses this gap by using RDI and RDS as metrics for measuring innovation and assessing innovation-related risks. This study incorporated performance as a potential factor affecting the interaction between these variables. It is essential to consider the risks associated with innovation and allocate the RDI and RDS effectively to maximize revenue. We used a dataset of 3955 firm-year observations obtained from 548 listed firms in the Indonesian stock exchange for 2012–2021. We found that RDI and RDS positively affect risk taking. The test results show that the interaction between innovation and firm performance negatively affects risk taking. Thus, firm performance may mitigate the risks associated with innovation. Therefore, firms must balance their innovation projects with improved performance to minimize risks and achieve long-term success.
1. Introduction
The Indonesian Stock Exchange (IDX) has demonstrated its commitment to innovative firms by launching the new economy board in late 2022. This board is dedicated to firms that achieve strong revenue growth and employ technology to develop innovative products or services, resulting in enhanced productivity and economic growth while also delivering social benefits. Along with the main board, the new economy board offers significant opportunities to eligible firms. The new economy board is a listing board equivalent to the main board. Companies can be listed on the new economy board if the company fulfils the requirements for being listed on the main board and has special characteristics determined by the exchange. The main board is a trading board for large-scale issuers and has a reasonably long track record. At least, the company has run an operational period (recorded operating income) for three years with a net tangible asset value of IDR 100 billion or more.
Several studies have indicated the importance of innovation for long-term firm success. Innovation enhances competitiveness and customer value and generates new revenue streams (Farida and Setiawan 2022; Han et al. 2016). To achieve success, a firm requires a systematic approach involving planning, development, testing, and process improvement (Wellalage and Fernandez 2019). It is essential to recognize that pursuing innovation involves funding and carries potential risks due to uncertainty regarding future profitability.
Considering the firm risks associated with innovation is crucial because they influence stock price variations. One perspective suggests that firms heavily involved in innovation may face increased risks. da Silva et al. (2018) found that undervalued firms exhibit high R&D intensity (RDI), indicating increased firm risk. In contrast, another perspective argues that actively innovative firms face lower risk (Kothari et al. 2002; Pandit et al. 2011). Research supports the idea that innovation can increase stock returns and reduce firm risk.
Previous studies have established R&D cost as a proxy for innovation, and these costs were linked to firm risk taking (Chrisman and Patel 2012; Gentry and Shen 2012). Innovation can be assessed using RDI and R&D spending (RDS). However, the extent to which RDI and RDS effectively proxy innovation in relation to risk has not yet been extensively explored. Both measures can be used when they positively affect firm risk. Bromiley et al. (2016) found no positive relationship between RDI and RDS, indicating that they represent distinct constructs explained by different theories. Klepper (1997) showed the superiority of RDI over RDS by employing RDI as an innovation proxy (da Silva et al. 2018; Duppati et al. 2022).
This study addresses this gap by using RDI and RDS as metrics for measuring innovation and assessing innovation-related risks. The literature has primarily focused on the effect of innovation on risk without considering other influencing factors. This research aims to fill this gap, and this study incorporated performance as a potential factor affecting the interaction between these variables. It is essential to consider the risks associated with innovation and allocate the RDI and RDS effectively to maximize revenue growth. Previous research has supported the idea that RDI improves firm performance, potentially reducing risk (Yeh et al. 2010; Knecht 2013; Alam et al. 2020). This concept suggests that a strong-performing firm can target R&D efficiency to mitigate risks. Therefore, this study examines firm performance as a moderating variable in the relationship between innovation and risk.
The paper is structured as follows. Section 2 presents a literature review and the hypotheses development. Section 3 identifies the research methodology with details of the sample, data, variables, and model analysis. Section 4 presents the research results and a descriptive statistic, hypotheses analysis, and robustness test. Section 5 presents a discussion based on the research results and prior studies. Finally, Section 6 summarizes the main findings.
2. Literature Review and Hypotheses Development
2.1. Literature Review
2.1.1. Firm Risk
Firm risk is an important factor in investment decisions because it affects potential returns and stock risk. The capital-asset pricing model (CAPM) is widely used for assessing firm risk. The firm risk can be determined by calculating the standard deviation from the CAPM equation.
2.1.2. Innovation
Innovation involves systematic planning, development, testing, and process improvement (Wellalage and Fernandez 2019). Prior research indicates that innovation can be assessed using proxies such as R&D expenses. This proxy is associated with a firm’s risk-taking behaviour (Chrisman and Patel 2012; Gentry and Shen 2012). Additionally, R&D expenses can be assessed using two common measures: RDI and RDS (Bromiley et al. 2016). RDI is the ratio of R&D expenses to sales (Mazzucato and Tancioni 2008; Duppati et al. 2022). It measures the efficiency of firm innovation by linking R&D expenses with sales. RDS represents the cost of conducting R&D activities (Bromiley et al. 2016). RDS provides valuable information on the financial investments required for innovation.
2.1.3. Firm Performance
Firm performance reflects the achievement of a firm’s objectives and is often assessed based on factors such as profitability, measured through metrics such as return on equity (ROE) or return on assets (ROA). In this study, the ROE is used as a proxy for firm performance, indicating operational performance (Wei and Zhang 2006; Domingues 2016). Hanlon (2005) found a negative relationship between operational performance and idiosyncratic risk. This suggests that declining operational performance increases the likelihood of higher risk (Rajgopal and Venkatachalam 2011; Mitra 2016). This study anticipates that strong firm performance will help achieve a balance between research cost allocation and potential risks.
2.1.4. Innovation and Risk Taking
Many studies show an association between innovation and risk taking, but show mixed results. Innovative firms face higher risks (Mazzucato and Tancioni 2008; Duppati et al. 2022). A higher risk is associated with companies that invest more in R&D (Chan et al. 2001). Besides that, innovation is related to lower risk. A firm with more significant investments in R&D and patents, indicating that less business risks (Pandit et al. 2011). Firms with high R&D intensity are less risky than those with low R&D intensity (da Silva et al. 2018).
These findings show an association between innovation and risk taking mixed results caused by different innovation measurements. R&D activity is an essential part of a strategy adopted in innovation (Ciftci et al. 2011; da Silva et al. 2018). Previous studies have established R&D cost as a proxy for innovation (Chrisman and Patel 2012; Gentry and Shen 2012). Innovation can be assessed using RDI and (RDS). Association RDI or RDS and risk taking show a mixed result, meaning two proxies show different constructs (Bromiley et al. 2016). This proxy is associated with firms’ risk-taking behaviour (Chrisman and Patel 2012; Gentry and Shen 2012). Whether RDI and RDS are appropriate for risk-taking proxies becomes an important question.
2.1.5. Performance as Moderating Innovation and Risk Taking
Some studies suggest that innovation has a positive effect on performance, whereas others indicate a negative association (Yeh et al. 2010; Knecht 2013; Kothari et al. 2002; Pandit et al. 2011). Firms with strong performance allocate resources efficiently, leading to increased revenue. By contrast, unstable performance exposes firms to higher levels of risk (Ketchen et al. 2013). This study provides empirical evidence supporting the positive association between instability in ROA and elevated risk, consistent with Bromiley et al. (2016) findings. R&D is more strongly associated with the volatility of future profitability, indicating higher risk (Kothari et al. 2002).
Hanlon (2005) found a negative relationship between operational performance and idiosyncratic risk. This result suggests that declining operational performance increases the likelihood of higher risk (Rajgopal and Venkatachalam 2011; Mitra 2016). Additionally, Alam et al. (2020) found no significant relationship between innovation and performance. These findings show that a research gap is an association between innovation and risk depending on firm performance. Managers tend to behave as risk averse, thus balancing potential risks by improving firm performance.
2.2. Hypothesis Development
Firm risk is associated with various policies, including innovation. Several studies have indicated the importance of innovation for long-term firm success. It is essential to recognize that pursuing innovation involves funding and carries potential risks (Wellalage and Fernandez 2019). The same findings were documented in research by Nguyen and Dang (2022) and Nguyen and Dang (2023), a firm that develops technology has the potential to reduce financial instability, which has the potential to increase risk. It is indicated that companies with high innovation show risk taking.
These findings indicated they employed strategies, methods, and projects to grow rapidly. However, this pursuit risks failure, leading to significant financial losses (Shaikh and O’Connor 2020). This underscores the uncertainty of successful innovation implementation, which exposes firms to heightened risks. (Mazzucato and Tancioni 2008; Duppati et al. 2022). Based on this discussion, the following conclusions were drawn.
H1.
Innovation positively affects firm risk.
The active pursuit of innovation is associated with lower risk for firms. A firm with more significant investments in R&D and patents, indicating that less business risks (Pandit et al. 2011). This research also documented a negative relationship between innovative capacity and operating performance volatility. Firms with high R&D intensity are less risky than those with low R&D intensity (da Silva et al. 2018). The study by Lev et al. (2006) documented that leader companies whose R&D investment is less associated with future volatility indicate less risk than follower companies. Research conducted on banks that develop FinTech shows that there is cost efficiency so that it can increase the required funding sources and have the potential to reduce business risk (Murinde et al. 2022). These findings further support this notion by showing that firms’ innovation development can reduce overall risk. Based on this discussion, the following conclusions were drawn.
H2.
Innovation negatively affects firm risk.
Previous research has yielded diverse findings on the relationship between innovation and firm performance. Some studies suggest that innovation positively affects performance, whereas others indicate a negative association (Yeh et al. 2010; Knecht 2013; Kothari et al. 2002; Pandit et al. 2011). Additionally, Alam et al. (2020) found no significant relationship between innovation and performance.
Firms with strong performance allocate resources efficiently, leading to increased revenue. By contrast, unstable performance exposes firms to higher levels of risk (Ketchen et al. 2013). This study provides empirical evidence supporting the positive association between instability in ROA and elevated risk, consistent with Bromiley et al. (2016) findings. The existing literature has indicated that firm performance plays an influential role in shaping the relationship between innovation and risk levels. The level of risk depends on RDI and RDS effectively to maximize firm performance. Managers tend to behave as risk averse, thus trying to balance potential risks by improving financial performance. Based on this discussion, the following hypotheses are proposed:
H3.
Firm performance negatively moderates the effect of innovation on firm risk.
2.3. Conceptual Framework
Figure 1 illustrates the conceptual framework employed in this study and highlights the interplay between innovation development and potential risks. As a management strategy to achieve long-term success, innovation development is closely intertwined with inherent risks. To explore this relationship, this study adopts the RDI and RDS as proxies for quantifying the risk level. By doing so, this study also aims to address the inconsistencies in the existing literature and provide a more cohesive understanding of the association between innovation development and the resulting risks.
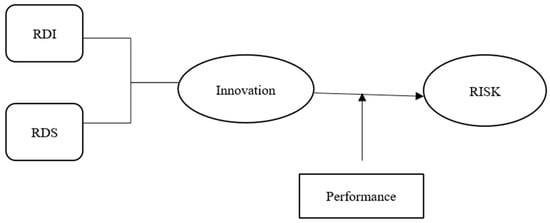
Figure 1.
Conceptual framework.
This study uses Prospect Theory to explain the relationship between innovation and risk taking. Prospect theory is a theory of human behaviour that explains decision-making by individuals in uncertain conditions (Kahneman and Tversky 1979). Decision-making behaviour is in the form of risk aversion behaviour (behaviour to avoid risk) and risk-seeking behaviour (behaviour facing risk). We expected the test results to demonstrate a positive relationship between innovation and risk. Furthermore, increasing risk encourages firms to allocate innovation resources efficiently, prompting the need to improve performance to mitigate potential risks.
3. Method
3.1. Data
This study uses a dataset of 3955 firm-year observations of 548 non–finance firms listed on the Indonesian Stock Exchange between 2012 and 2021. 2012 was chosen because that period was the beginning of the adoption of International Financial Reporting Standards (IFRS) in Indonesia. It is hoped that the data used is in accordance with IFRS so that it can improve the accuracy of the test results. The sample represents approximately 72% of 766 registered firms as of December 2021. This dataset is comprised of an unbalanced panel covering a 10-year period and is analysed using an Eviews 12 software. The sample comprises firms that disclose their R&D costs as a measure of innovation activities. Furthermore, the analysis includes both the entire sample and firms with high R&D costs to comprehensively and rigorously investigate the relationship between innovation and firm performance.
3.2. Variables
The dependent variable uses firm risk based on the standard error value of the CAPM equation model:
where Rit is the stock return of securities, calculated based on a change in stock price. Rmt is the market return, calculated based on changes in the Indonesian Composite Stock Price Index. rft is the risk-free rate based on the Bank of Indonesia certificate rate. eit is the idiosyncratic risk, calculated based on the standard deviation of residuals from Equation (1). The empirical analysis uses the standard deviation of residuals and the absolute standard deviation of residuals as robustness tests.
Rit = αit + βi (Rmt − rft) + eit
The independent variables use RDI and RDS. RDI is the ratio of R&D expenses to sales, and RDS represents the actual cost of doing R&D. This study uses company performance as measured by the return on equity. The control variables that use firm fundamental information are LEV, GROWTH, and BM. LEV (leverage) is the ratio of debt to assets, GROWTH is the total assets of period t, reduction in total assets in period t-1 divided by assets t-1, and BM is the book value ratio to a market equity value. The firm fundamentals information was chosen because it can potentially affect idiosyncratic risk. Previous research shows that idiosyncratic risk is closely related to firm fundamental information (Mitra 2016; Zhou et al. 2017).
3.3. The Model
The equation to test the effect of innovation on firm risk:
FRit = α0 + α1RDIit + α2RDSit + α3LEVit + α4GROWTHit + α5BMit + eit
The equation examines the impact of performance on innovation and firm risk:
FRit = α0 + α1RDIit + α2RDSit + α3ROEit + α4RDIit × ROEit + α5RDSit × ROEit + α6LEVit + α7GROWTHit+ α8BMit + eit
FR is a firm risk, and it calculates the standard error value of the CAPM by Equation (1). RDI is the R&D Intensity, which calculates by the ratio of R&D expenses to sales. RDS is R&D spending, representing the actual cost of doing R&D. ROE is a ratio return on equity. LEV is leverage, and it is the ratio of debt to assets. GROWTH is the total assets of period t, the reduction in total assets in period t-1 divided by assets t-1, and BM is the ratio book value ratio to a market equity value.
4. Results
4.1. Descriptive Statistics
This study employs a dataset of 3955 firm-year observations obtained from 548 firms during 2012–2021. Table 1 presents a comprehensive summary of the data. Firm risk was assessed using two metrics derived from the CAPM: the standard deviation (FR) and absolute value (FR_abs). The analysis examined daily security and market returns, which were then transformed into monthly and annual data for further investigation.

Table 1.
Summary statistics of the variables.
This study measured innovation using two variables: RDI and RDS. The testing phase involved the use of ROE as a performance proxy, controlling for leverage (LEV), GROWTH, and book-to-market ratio (BM). Interaction tests are conducted to assess the effective management of substantial innovation effects on firms with varying ROE levels. The results were expected to show that firms with high ROE could effectively manage substantial R&D costs, potentially reducing firm risk. The test examined the interaction between the innovation variables (RDI and RDS) and ROE.
Table 2 presents the mean and quartile values of firm risk based on the RDI (Panel A) and RDS (Panel B) levels. The data show a clear and consistent relationship between innovation level (RDI and RDS) and firm risk. Firms with high RDI exhibit greater risk (FR and FR_abs) than those with low or zero RDI. Similarly, firms with high RDS show higher risk (FR and FR_abs) than those with low or zero RDS. This finding strongly indicates that innovative firms can increase their overall risks.
Table 2.
Firm Risk and R&D.
We tested the regression model to encounter multicollinearity problems. Table 3 shows that variance inflation factor (VIF) < 10 indicates a regression model multicollinearity absence.
Table 3.
Multicollinearity Test.
Multicollinearity problems can also be known from the correlation values between variables. Table 4 indicates a weak relationship between the variables, suggesting the absence of multicollinearity. Both RDI and RDS indicate a positive relationship, establishing a direct link between innovation and firm risk. The ROE exhibits a negative relationship, suggesting that a highly profitable firm can mitigate risk. GROWTH shows a positive relationship, indicating that significant growth can also elevate firm risk. However, LEV and BM do not have a significant relationship with firm risk.
Table 4.
Correlation.
4.2. Innovation and Firm Risk
Table 5 presents the results of a test examining the effect of innovation on risk for all firms and for a specific group of innovative firms (high RDI and RDS). The overall test results indicate a positive effect of RDI and RDS on risk. These findings are reinforced by an analysis of a subgroup of firms with high RDI and RDS, consistently showing their potential to increase firm risk.
Table 5.
Innovation and firm risk (FR).
4.3. Effect of Performance on Innovation and Firm Risk
Table 6 presents the test results for the impact of performance on innovation and firm risk. This study used ROE as a performance indicator. The inclusion of ROE consistently showed a positive effect of RDI and RDS on risk, while the variable had a negative effect on risk. Interaction tests between ROE and RDI as well as between ROE and RDS confirmed these negative effects. These findings indicate that strong firm performance can mitigate the effects of innovation on risk.
Table 6.
Effect of Performance on Innovation and Firm Risk.
4.4. Robustness Test
The robustness test assesses firm risk using the absolute value of the standard deviation obtained from the CAPM equation. Both the least squares and the generalized method of moments (GMM) were employed for the analysis. The model selection specification test determined that the fixed-effects model was appropriate. The GMM specification test using Arellano–Bond showed the consistency of the model, with a probability of AR(2) > 0.05. Furthermore, the Sargan test confirmed the validity of the chosen model as the J-statistic value was not significant.
Table 7 shows the effect of RDI on firm risk using both the least squares and GMM methodologies. These results consistently indicated a positive effect. Additional testing of subgroups of high-RDI firms supports the finding that RDI has the potential to increase firm risk.
Table 7.
Effect of RDI on Firm Risk (FR_abs).
Table 8 presents the analysis results of the RDS effect on firm risk using both the least squares and GMM methodologies. These findings consistently demonstrate a positive effect. Further testing of subgroups of firms with a high RDS also supports the notion that a high RDS has the potential to increase firm risk.
Table 8.
Effect of RDS on Firm Risk (FR_abs).
Table 9 presents the robustness test that examines the effect of innovation and performance on firm risk, measured by the absolute standard error derived from the CAPM equation. These consistent results indicate that the RDI and RDS can potentially increase firm risk. Moreover, good firm performance is found to mitigate the increases caused by the RDI and RDS.
Table 9.
Effect of Performance on Innovation and Firm Risk (FR_abs).
5. Discussion
A positive relationship was observed between RDI and RDS, indicating their alignment as innovation measures. Additionally, RDI and RDS positively affect firm risk, further supporting their effectiveness in capturing innovation and reflecting firm risk. These findings support previous research that showed innovative firms face higher risks (Mazzucato and Tancioni 2008; Duppati et al. 2022). The underscores the uncertainty of successful innovation implementation, which exposes firms to heightened risks. These findings did not align with Bromiley et al. (2016), which suggested a lack of relationship between RDI and RDS. The active pursuit of innovation is associated with lower risk for firms (Kothari et al. 2002; Pandit et al. 2011). Research further supports this notion by showing that firms with intensive innovation can improve stock returns and reduce overall risk.
A performance variable was included to strengthen the analysis. Furthermore, strong firm performance mitigates firm risk. Importantly, the incorporation of a performance variable did not disrupt the consistent positive effects of the RDI and RDS on firm risk. This finding indicates that, while innovation development may amplify risk, strong firm performance effectively counterbalances it. These findings support previous research in which unstable performance exposes firms to higher levels of risk (Ketchen et al. 2013). This study provides empirical evidence supporting the positive association between instability in ROA and elevated risk, consistent with Bromiley et al. (2016) findings. The existing literature has indicated that firm performance plays an influential role in shaping the relationship between innovation and risk levels. Firms with strong performance allocate resources efficiently, leading to increased revenue. Our test has limitations. The measurement of firm performance does not consider the potential for earnings management to determine the level of ROE we use to measure performance. Earnings management can potentially occur in high-innovation firms (Shust 2015).
The results of this study can have theoretical implications for innovation and firm risk, in which RDI and RDS can be used as proxies to estimate innovation and risk taking. For managerial implication, firms must balance their innovation projects with improved performance to minimize risks and achieve long-term success.
6. Conclusions
This study examined the effect of innovation, measured by the RDI and RDS, on firm risk. The consistent findings indicate that increasing RDI and RDS correlate with higher firm risk, aligning with existing research emphasizing the positive effect of innovation on risk (Mazzucato and Tancioni 2008; Duppati et al. 2022). These findings fill the research gap, documenting a negative relationship between innovation and risk (Chan et al. 2001; Kothari et al. 2002; Pandit et al. 2011; da Silva et al. 2018). The negative association show that balanced firm performance can mitigate firm risk. By incorporating performance as a variable, this study shows that a strongly performing firm has the potential to reduce the risks associated with innovation development.
6.1. Implications
6.1.1. Theoretical Implications
These findings contribute to the existing literature on innovation and risk, which mixed results. This research shows that companies that innovate have the potential to increase risk. Innovation measured by RDI and RDS shows a positive effect on risk. These findings support the research showing that innovation positively affects risk (Chan et al. 2001; Mazzucato and Tancioni 2008; Duppati et al. 2022). This research uses company performance as a moderating variable to explain that innovation can potentially reduce risk (Kothari et al. 2002; Yeh et al. 2010; Pandit et al. 2011; Knecht 2013). The companies can balance allocating innovation costs with company performance to reduce risk. These findings indicate that the influence of innovation and risk can be influenced by the performance of the company itself. It is complementing prior research by Kothari et al. (2002), Yeh et al. (2010), Pandit et al. (2011), Knecht (2013), Mazzucato and Tancioni (2008), and Duppati et al. (2022). These findings also support that RDI and RDS are appropriate proxies to measure innovation (Bromiley et al. 2016). Both show the same relationship to risk taking.
6.1.2. Managerial Implications
The results offer valuable recommendations for strategic management to facilitate a firm’s success in innovation for generating new revenue streams. Managers must balance innovation projects with improved performance to ensure the efficiency and productivity of R&D investment (Alam et al. 2020). Managers can require innovation with a systematic approach involving planning, development, testing, and process improvement (Wellalage and Fernandez 2019). It is essential to recognize that pursuing innovation minimizes risks and achieves long-term success.
6.2. Limitations and Future Research
6.2.1. Limitations
This study has several limitations. First, the measurement of risk taking is only based on specific stock price variability in the short term. Second, this research uses performance focuses only on return on equity as a profitability measurement.
6.2.2. Future Research
The first direction for future research can extend the period to know the effect of innovation on the variations in risk in the short and long term. Second, future research could consider additional indicators, such as the importance of female CEO (Prabowo and Setiawan 2021), human capital (Latifah et al. 2022), leverage levels and other firm characteristics, as potential innovation effects.
Author Contributions
Conceptualization, Y.P.N.W. and D.S.; methodology, E.G.; software, Y.A.A.; validation, D.S.; formal analysis, Y.P.N.W.; investigation, Y.A.A.; resources, E.G.; data curation, Y.P.N.W.; writing—original draft preparation, Y.P.N.W.; writing—review and editing, Y.P.N.W.; visualization, Y.A.A.; supervision, D.S.; project administration, Y.P.N.W. All authors have read and agreed to the published version of the manuscript.
Funding
The authors acknowledge financial support from the directorate general of higher education, Ministry of Education, Culture, Research and Technology, Republic of Indonesia, under grant no. 055/E5/PG.02.00.PL/2023.
Institutional Review Board Statement
Not applicable.
Informed Consent Statement
Not applicable.
Data Availability Statement
Not applicable.
Conflicts of Interest
The authors declare no conflict of interest.
References
- Alam, Ashraful, Moshfique Uddin, Hassan Yazdifar, Sujana Shafique, and Theophilus Lartey. 2020. R&D investment, firm performance and moderating role of system and safeguard: Evidence from emerging markets. Journal of Business Research 106: 94–105. [Google Scholar] [CrossRef]
- Bromiley, Philip, Devaki Rau, and Yu Zhang. 2016. Is R&D Risky. Strategic Management Journal 38: 876–91. [Google Scholar]
- Chan, Louis K. C., Josef Lakonishok, and Theodore Sougiannis. 2001. The Stock Market Valuation of Research and Development Expenditures. The Journal of Finance 56: 2431–56. [Google Scholar] [CrossRef]
- Chrisman, James J., and Pankaj C. Patel. 2012. Variations in R&D investments of family and nonfamily firms: Behavioral agency and myopic loss aversion perspectives. Academy of Management Journal 55: 976–97. [Google Scholar] [CrossRef]
- Ciftci, Mustafa, Baruch Lev, and Suresh Radhakrishnan. 2011. Is research and development mispriced or properly risk adjusted? Journal of Accounting, Auditing and Finance 26: 81–116. [Google Scholar] [CrossRef]
- da Silva, Raphael Braga, Marcelo Cabus Klotzle, Antonio Carlos Figueiredo Pinto, and Luiz Felipe Jacques da Motta. 2018. R&D investment and risk in Brazil. Global Finance Journal 35: 106–14. [Google Scholar] [CrossRef]
- Domingues, Ana. 2016. Idiosyncratic Volatility and Earnings Quality: Evidence from United Kingdom. Available online: https://hdl.handle.net/10216/86687 (accessed on 10 May 2023).
- Duppati, Geeta, Ploypailin Kijkasiwat, Ahmed Imran Hunjra, and Chee Yoong Liew. 2022. Do institutional ownership and innovation influence idiosyncratic risk? Global Finance Journal 56: 100770. [Google Scholar] [CrossRef]
- Farida, Ida, and Doddy Setiawan. 2022. Business strategies and competitive advantage: The role of performance and innovation. Journal of Open Innovation: Technology, Market, and Complexity 8: 163. [Google Scholar] [CrossRef]
- Gentry, Richard J., and Wei Shen. 2012. The impacts of performance relative to analyst forecasts and analyst coverage on firm R&D intensity. Strategic Management Journal 34: 121–30. [Google Scholar] [CrossRef]
- Han, Kyuhong, Vikas Mittal, and Yan Zhang. 2016. Relative Strategic Emphasis and Firm Idiosyncratic Risk: The Moderating Role of Relative Performance and Demand Instability. Journal of Marketing 81: 1–54. [Google Scholar]
- Hanlon, Michelle. 2005. The Persistence and Pricing of Earnings, Accruals, and Cash Flows When Firms Have Large Book-Tax Differences. The Accounting Review 80: 137–66. Available online: http://www.jstor.org/stable/4093164 (accessed on 10 May 2023). [CrossRef]
- Kahneman, Daniel, and Amos Tversky. 1979. Prospect Theory: An Analysis of Decision under Risk. Econometrica 47: 263–91. [Google Scholar] [CrossRef]
- Ketchen, David J., R. Duane Ireland, and La Kami T. Baker. 2013. The Use of Archival Proxies in Strategic Management Studies:Castles Made of Sand? Organizational Research Methods 16: 32–42. [Google Scholar] [CrossRef]
- Klepper, Steven. 1997. Industry Life Cycles. Industrial and Corporate Change 6: 145–81. [Google Scholar] [CrossRef]
- Knecht, Matthias. 2013. Diversification, industry dynamism, and economic performance. In The Impact of Dynamic-Related Diversification on the Multi-Business Firm, 1st ed. Wiesbaden: Springer Gabler. [Google Scholar]
- Kothari, S. P., Ted E. Laguerre, and Andrew J. Leone. 2002. Capitalization versus expensing: Evidence on the uncertainty of future earnings from capital expenditures versus R&D outlays. Review of Accounting Studies 7: 355–82. [Google Scholar] [CrossRef]
- Latifah, Lina, Doddy Setiawan, Y. Anni Aryani, Isfenti Sadalia, and M. Nur Rianto Al Arif. 2022. Human capital and open innovation: Do social media networking and knowledge sharing matter? Journal of Open Innovation: Technology, Market, and Complexity 8: 116. [Google Scholar] [CrossRef]
- Lev, Baruch, Suresh Radhakrishnan, and Mustafa Ciftci. 2006. The Stock Market Valuation of R & D Leaders. NYU Working Paper. Available online: http://hdl.handle.net/2451/27475 (accessed on 10 May 2023).
- Mazzucato, Mariana, and Massimiliano Tancioni. 2008. Innovation and idiosyncratic risk: An industry- and firm-level analysis. Industrial and Corporate 17: 779–811. [Google Scholar]
- Mitra, Ranjan Kumar. 2016. The association between earnings quality and firm-specific return volatility Evidence from Japan. Review of Accounting and Finance 15: 294–316. [Google Scholar] [CrossRef]
- Murinde, Victor, Efthymios Rizopoulos, and Markos Zachariadis. 2022. The impact of the FinTech revolution on the future of banking: Opportunities and risks. International Review of Financial Analysis 81: 102103. [Google Scholar] [CrossRef]
- Nguyen, Quang Khai, and Van Cuong Dang. 2022. The effect of FinTech development on financial stability in an emerging market: The role of market discipline. Research in Globalization 5: 100105. [Google Scholar]
- Nguyen, Quang Khai, and Van Cuong Dang. 2023. The impact of FinTech development on stock price crash risk and the role of corporate social responsibility: Evidence from Vietnam. Business Strategy & Development. [Google Scholar] [CrossRef]
- Pandit, Shail, Charles E. Wasley, and Tzachi Zach. 2011. The effect of R&D inputs and outputs on the relation between the uncertainty of future operating performance and R&D expenditures. Journal of Accounting, Auditing and Finance 26: 145–49. [Google Scholar] [CrossRef]
- Prabowo, Rony, and Doddy Setiawan. 2021. Female CEOs and corporate innovation. International Journal of Social Economics 48: 709–23. [Google Scholar] [CrossRef]
- Rajgopal, Shiva, and Mohan Venkatachalam. 2011. Financial reporting quality and idiosyncratic return volatility. Journal of Accounting and Economics 51: 1–20. [Google Scholar] [CrossRef]
- Shaikh, Ibrahim A., and Gina Colarelli O’Connor. 2020. Understanding the motivations of technology managers in radical innovation decisions in the mature R&D firm context: An Agency theory perspective. Journal of Engineering and Technology 55: 101553. [Google Scholar] [CrossRef]
- Shust, Efrat. 2015. Does research and development activity increase accrual-based earnings management? Journal of Accounting, Auditing and Finance 30: 373–401. [Google Scholar] [CrossRef]
- Wei, Steven X., and Chu Zhang. 2006. Why did individual stocks become more volatile? Journal of Business 79: 259–92. [Google Scholar] [CrossRef]
- Wellalage, Nirosha Hewa, and Viviana Fernandez. 2019. Innovation and SME finance: Evidence from developing countries. International Review of Financial Analysis 66: 101370. [Google Scholar] [CrossRef]
- Yeh, Ming Liang, Hsiao Ping Chu, Peter J. Sher, and Yi Chia Chiu. 2010. R&D intensity, firm performance and the identification of the threshold: Fresh evidence from the panel threshold regression model. Applied Economics 42: 389–401. [Google Scholar] [CrossRef]
- Zhou, Ting, Jun Xie, and Xiaolin Li. 2017. Financial Reporting Quality and Idiosyncratic Return Volatility: Evidence from China. Emerging Markets Finance and Trade 53: 835–47. [Google Scholar]
Disclaimer/Publisher’s Note: The statements, opinions and data contained in all publications are solely those of the individual author(s) and contributor(s) and not of MDPI and/or the editor(s). MDPI and/or the editor(s) disclaim responsibility for any injury to people or property resulting from any ideas, methods, instructions or products referred to in the content. |
© 2023 by the authors. Licensee MDPI, Basel, Switzerland. This article is an open access article distributed under the terms and conditions of the Creative Commons Attribution (CC BY) license (https://creativecommons.org/licenses/by/4.0/).