
Variation in Alanine Aminotransferase in Children with Non-Alcoholic Fatty Liver Disease


 ,
,
Abstract
:1. Introduction
2. Methods
2.1. Cohort
2.2. Liver Disease Case Definition
2.3. Patient Characteristics
2.4. Alanine Aminotransferase (ALT)
2.5. Statistical Analysis
3. Results
3.1. Study Population
3.2. Patient Characteristics by Receipt of Biopsy
3.3. Patient Characteristics by Peak ALT Category
3.4. Liver Histology
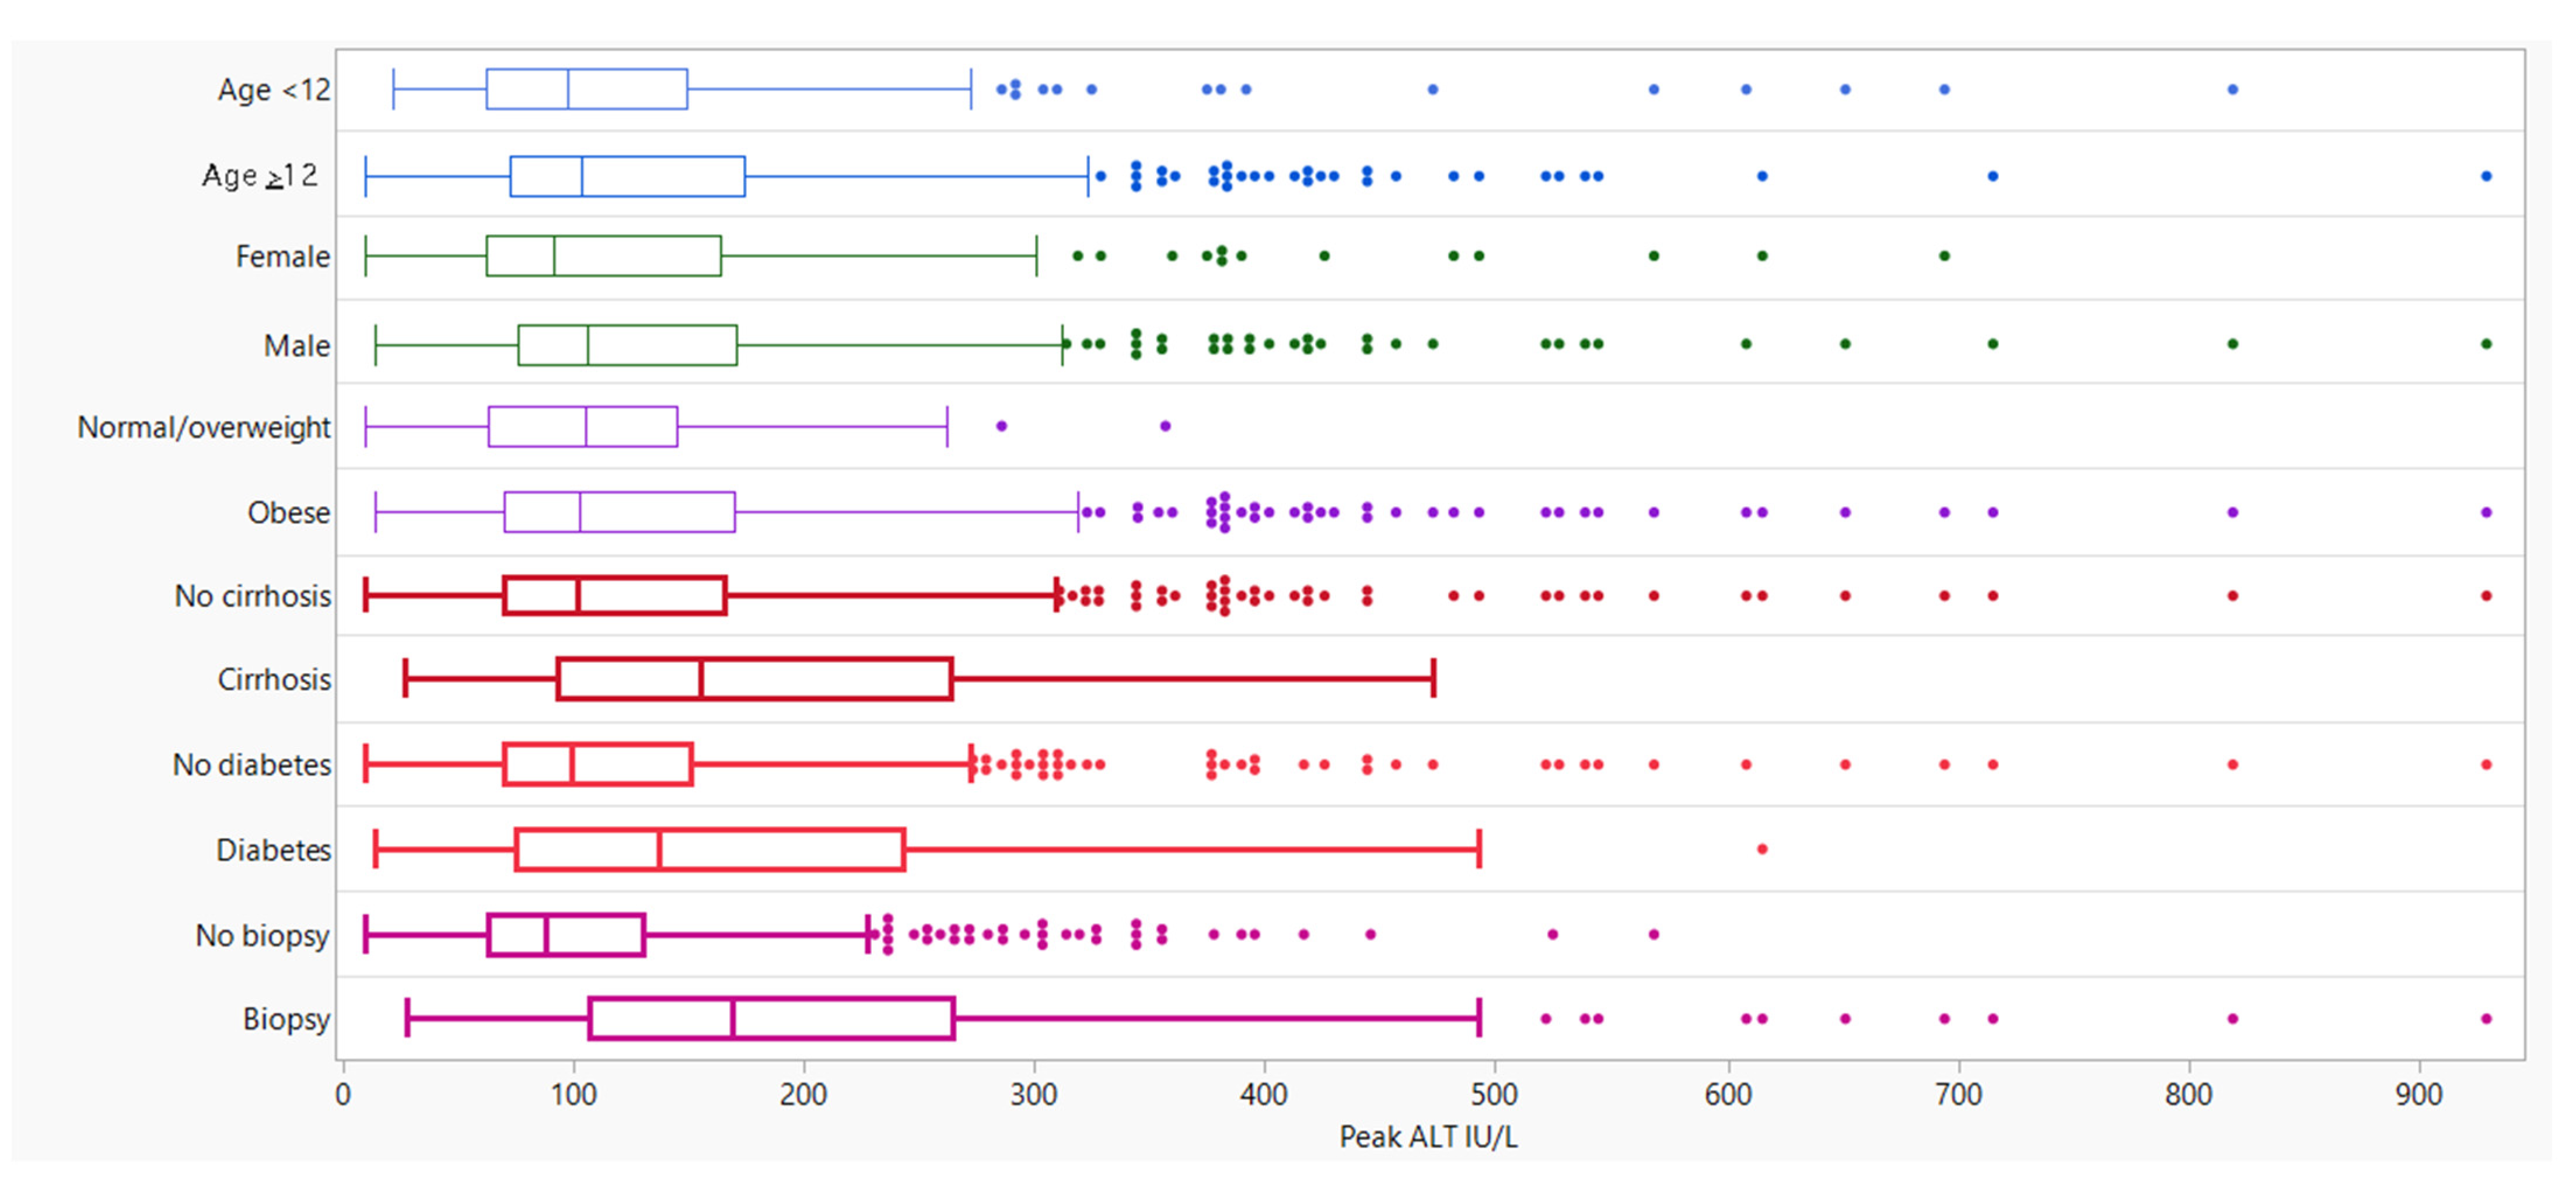
3.5. Peak ALT by Patient Characteristics
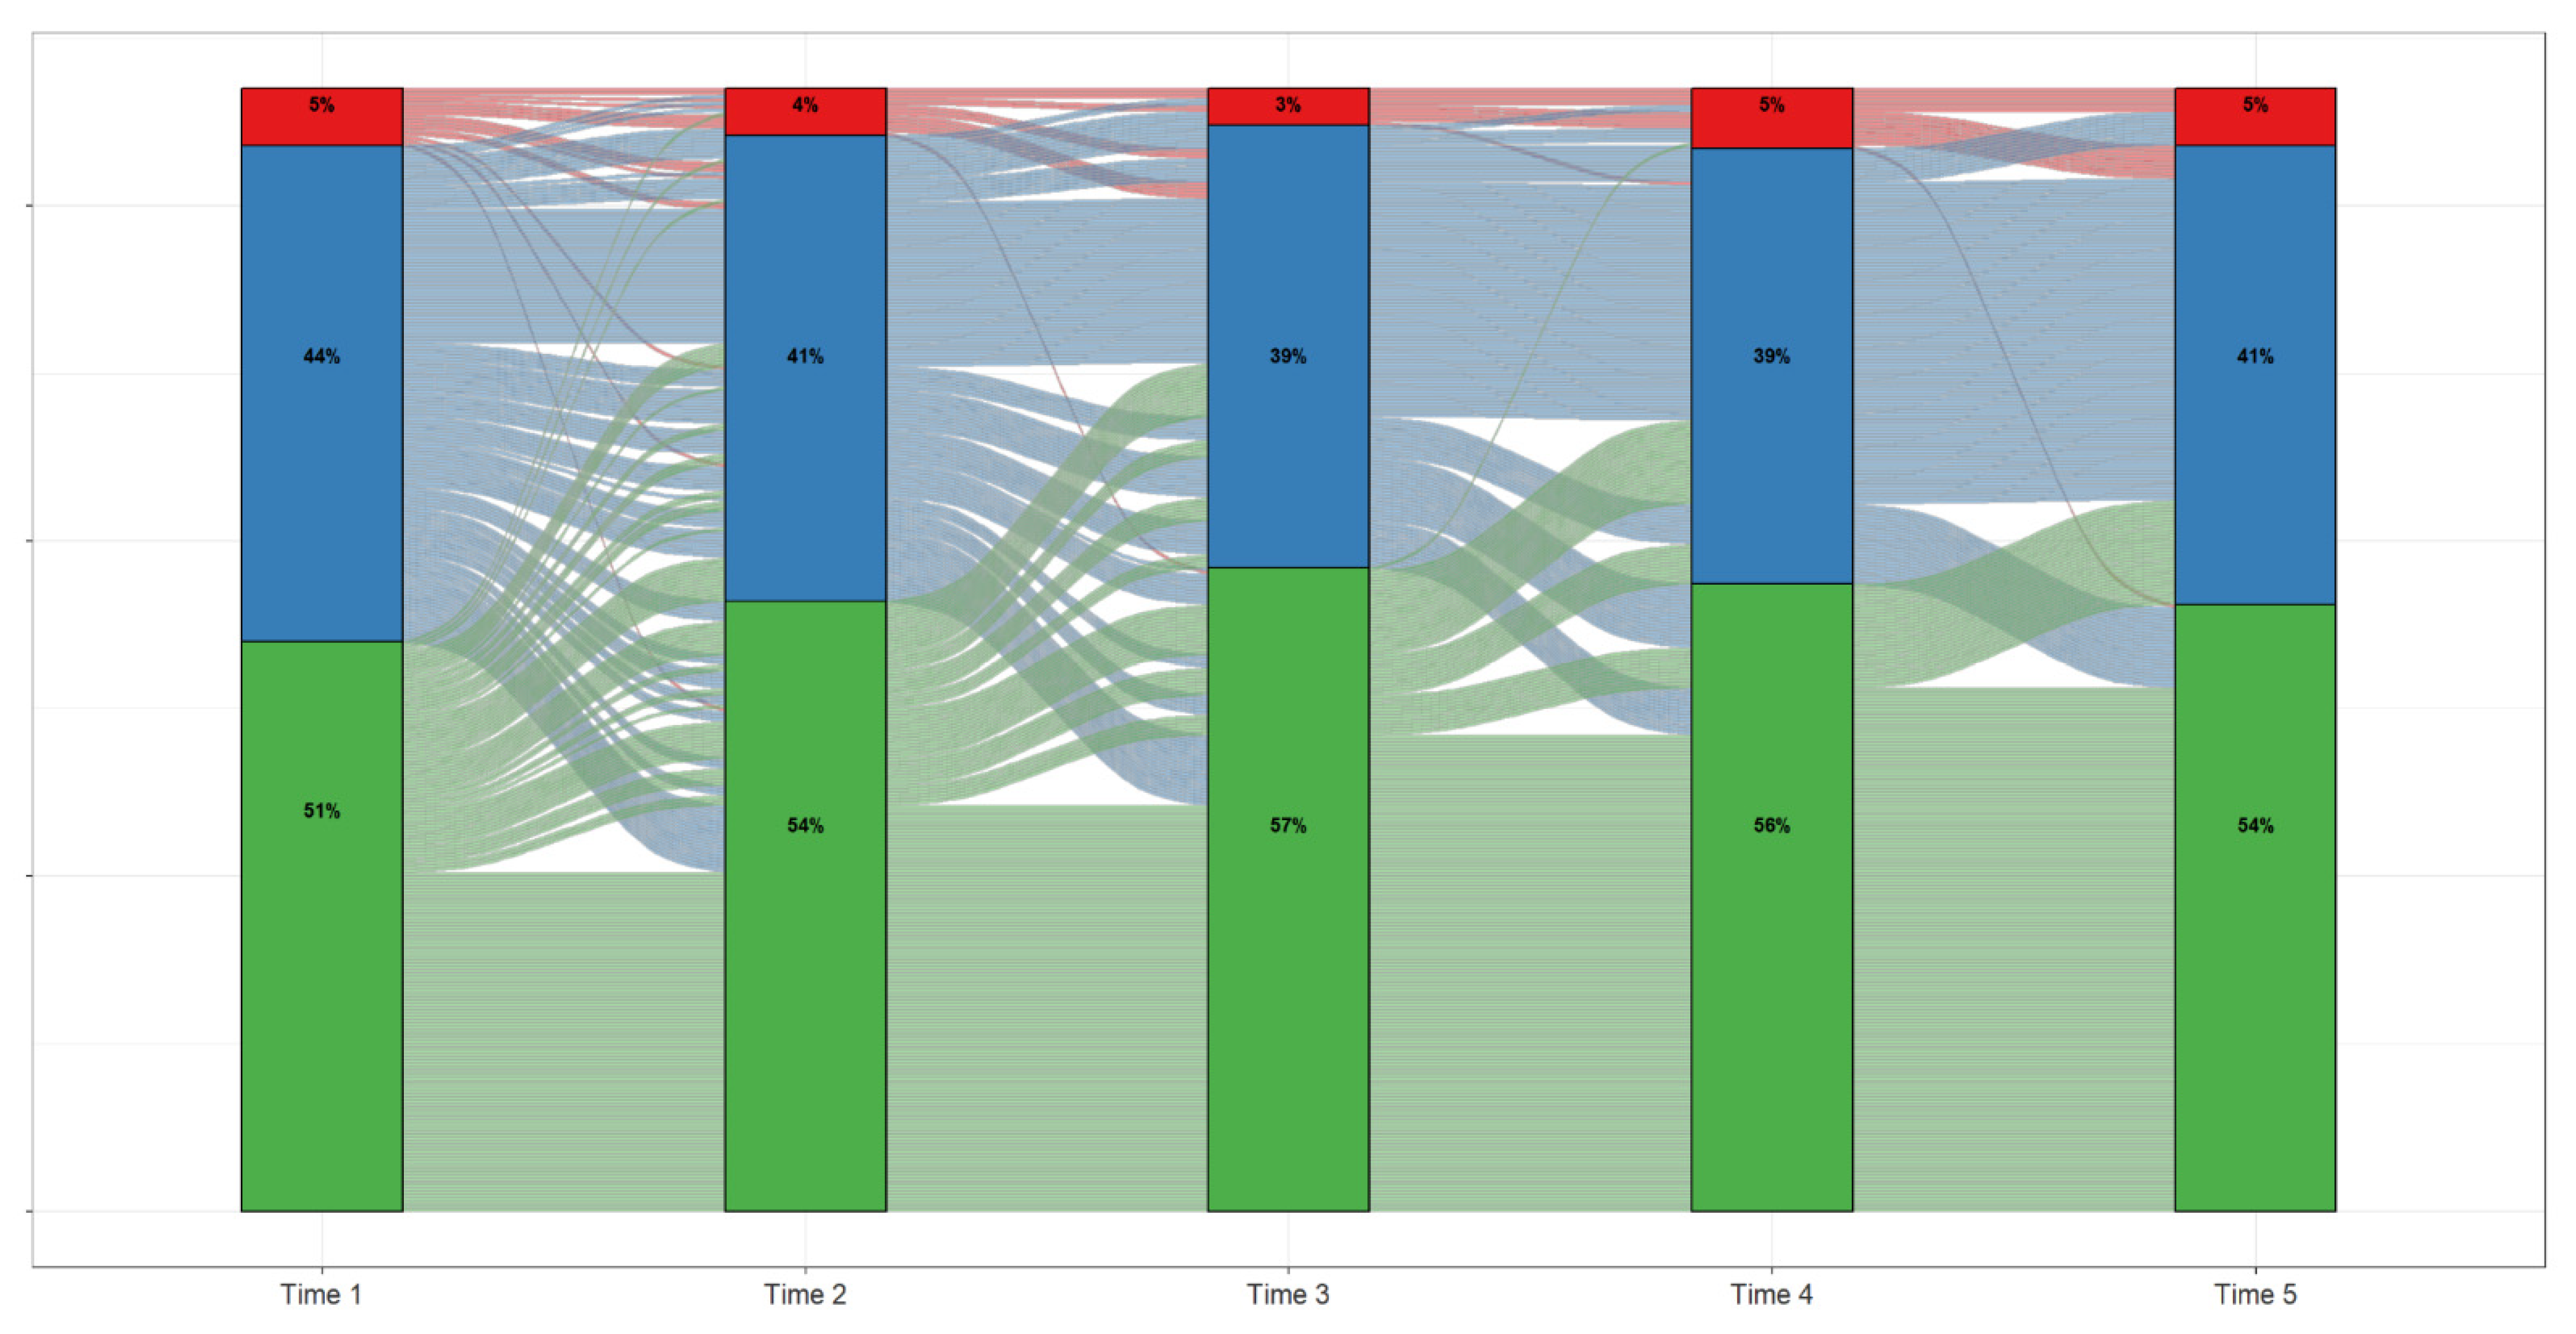
3.6. ALT over Time
4. Discussion
Author Contributions
Funding
Institutional Review Board Statement
Informed Consent Statement
Data Availability Statement
Acknowledgments
Conflicts of Interest
Appendix A

| Number of Patients (n = 660) | Mean (SD) | Median (Min–Max) | p-Value 1 | |
|---|---|---|---|---|
| Liver Biopsy | <0.001 | |||
| Yes | 187 | 211.2 (150.7) | 169.0 (28–929) | |
| No | 473 | 110.5 (77.21) | 88.0 (10–568) | |
| NAS Total Score | 0.668 | |||
| 0 | 1 | 72.0 (-) | 72.0 (72–72) | |
| 1 | 5 | 131.2 (100.3) | 87.0 (28–280) | |
| 2 | 10 | 184.3 (196.1) | 117.5 (43–694) | |
| 3 | 20 | 199.7 (147.5) | 147.5 (65–651) | |
| 4 | 48 | 206.3 (151.4) | 157.0 (61–819) | |
| 5 | 54 | 232.1 (130.1) | 196.5 (54–608) | |
| 6 | 23 | 235.3 (132.1) | 234.0 (95–715) | |
| Steatohepatitis on Brunt and/or NAS 2,3 | 0.002 | |||
| Yes | 153 | 227.0 (156.3) | 175.0 (31–929) | |
| No | 27 | 128.7 (75.74) | 109.0 (28–286) | |
| Fibrosis 3,4 | ||||
| Yes | 127 | 230.4 (163.6) | 183.0 (31–929) | 0.011 |
| No | 60 | 170.7 (109.5) | 130.5 (28–552) | |
| Advanced Fibrosis 3,5 | 0.756 | |||
| Yes | 28 | 219.4 (144.0) | 175.0 (31–715) | |
| No | 159 | 209.8 (152.3) | 169.0 (28–929) |
| Peak ALT | All Participants (n = 660) | p-Values 4 | |||
|---|---|---|---|---|---|
| Summary | ≤70 IU/L | 71 to 250 IU/L | >250 IU/L | ||
| (n = 164) | (n = 415) | (n = 81) | |||
| Liver Histology | |||||
| Participant with Biopsy, n (%) | 12 (7.3%) | 123 (29.6%) | 52 (64.2%) | 187 (28.3%) | -- |
| Steatosis–Brunt and/or NAS | |||||
| Steatohepatitis on Brunt and/or NAS 1 | <0.001 | ||||
| No | 6 (50.0%) | 18 (15.3%) | 3 (6.0%) | 27 (15.0%) | |
| Yes | 6 (50.0%) | 100 (84.7%) | 47 (94.0%) | 153 (85.0%) | |
| Not Available | 0 | 5 | 2 | 7 | |
| Fibrosis Stage–Brunt or NAS | |||||
| Fibrosis, n (%) 2 | 0.372 | ||||
| No | 5 (41.7%) | 42 (34.1%) | 13 (25.0%) | 60 (32.1%) | |
| Yes | 7 (58.3%) | 81 (65.9%) | 39 (75.0%) | 127 (67.9%) | |
| Not Available | 0 | 0 | 0 | 0 | |
| Advanced Fibrosis, n (%) 3 | 0.848 | ||||
| No | 11 (91.7%) | 104 (84.6%) | 44 (84.6%) | 159 (85.0%) | |
| Yes | 1 (8.3%) | 19 (15.4%) | 8 (15.4%) | 28 (15.0%) | |
| Not Available | 0 | 0 | 0 | 0 | |
| Brunt Scoring | |||||
| Steatohepatitis status, n (%) | 0.033 | ||||
| Not Steatohepatitis | 3 (37.5%) | 11 (11.7%) | 2 (4.9%) | 16 (11.2%) | |
| Steatohepatitis | 5 (62.5%) | 83 (88.3%) | 39 (95.1%) | 127 (88.8%) | |
| Not Available | 2 | 21 | 7 | 30 | |
| Inflammation Grade, n (%) | 0.585 | ||||
| 0 | 2 (20.0%) | 6 (6.5%) | 4 (9.5%) | 12 (8.3%) | |
| 1 | 7 (70.0%) | 69 (74.2%) | 31 (73.8%) | 107 (73.8%) | |
| 2 | 0 (0.0%) | 13 (14.0%) | 5 (11.9%) | 18 (12.4%) | |
| 3 | 1 (10.0%) | 5 (5.4%) | 2 (4.8%) | 8 (5.5%) | |
| Not Available | 0 | 22 | 6 | 28 | |
| Fibrosis Stage, n (%) | 0.589 | ||||
| 0 | 5 (50.0%) | 37 (32.2%) | 12 (25.0%) | 54 (31.2%) | |
| 1 | 3 (30.0%) | 40 (34.8%) | 14 (29.2%) | 57 (32.9%) | |
| 2 | 1 (10.0%) | 19 (16.5%) | 14 (29.2%) | 34 (19.7%) | |
| 3 | 1 (10.0%) | 16 (13.9%) | 8 (16.7%) | 25 (14.5%) | |
| 4 | 0 (0.0%) | 3 (2.6%) | 0 (0.0%) | 3 (1.7%) | |
| Not Available | 0 | 0 | 0 | 0 | |
| NAS Scoring | |||||
| Steatosis Grade, n (%) | 0.113 | ||||
| 0 | 0 (0.0%) | 2 (1.8%) | 0 (0.0%) | 2 (1.2%) | |
| 1 | 6 (50.0%) | 17 (15.5%) | 10 (20.0%) | 33 (19.2%) | |
| 2 | 4 (33.3%) | 35 (31.8%) | 15 (30.0%) | 54 (31.4%) | |
| 3 | 2 (16.7%) | 56 (50.9%) | 25 (50.0%) | 83 (48.3%) | |
| Not Available | 0 | 6 | 1 | 7 | |
| Lobular Inflammation Grade, n (%) | 0.051 | ||||
| 0 | 4 (40.0%) | 10 (9.8%) | 4 (8.7%) | 18 (11.4%) | |
| 1 | 6 (60.0%) | 65 (63.7%) | 28 (60.9%) | 99 (62.7%) | |
| 2 | 0 (0.0%) | 27 (26.5%) | 14 (30.4%) | 41 (25.9%) | |
| Not Available | 2 | 14 | 5 | 21 | |
| Hepatocyte Ballooning Grade, n (%) | 0.856 | ||||
| 0 | 4 (44.4%) | 31 (30.4%) | 12 (26.7%) | 47 (30.1%) | |
| 1 | 5 (55.6%) | 59 (57.8%) | 28 (62.2%) | 92 (59.0%) | |
| 2 | 0 (0.0%) | 12 (11.8%) | 5 (11.1%) | 17 (10.9%) | |
| Not Available | 3 | 14 | 6 | 23 | |
| NAS Total Score, n (%) | 0.043 | ||||
| 0 | 0 (0.0%) | 1 (0.9%) | 0 (0.0%) | 1 (0.6%) | |
| 1 | 1 (11.1%) | 3 (2.8%) | 1 (2.2%) | 5 (3.1%) | |
| 2 | 4 (44.4%) | 4 (3.7%) | 2 (4.3%) | 10 (6.2%) | |
| 3 | 1 (11.1%) | 14 (13.1%) | 5 (10.9%) | 20 (12.3%) | |
| 4 | 2 (22.2%) | 32 (29.9%) | 14 (30.4%) | 48 (29.6%) | |
| 5 | 1 (11.1%) | 36 (33.6%) | 17 (37.0%) | 54 (33.3%) | |
| 6 | 0 (0.0%) | 16 (15.0%) | 7 (15.2%) | 23 (14.2%) | |
| 7 | 0 (0.0%) | 1 (0.9%) | 0 (0.0%) | 1 (0.6%) | |
| Not Available | 3 | 9 | 5 | 17 | |
| NAS Total Score Grouped, n (%) | 0.009 | ||||
| 0–3 | 6 (66.7%) | 22 (20.8%) | 8 (17.4%) | 36 (22.4%) | |
| 4–6 | 3 (33.3%) | 84 (79.2%) | 38 (82.6%) | 125 (77.6%) | |
| Not Available | 3 | 10 | 5 | 18 | |
| NAS Total Score | 0.001 | ||||
| Median (n) | 2.0 (9) | 4.0 (107) | 5.0 (46) | 4.0 (162) | |
| Min–Max | 1–5 | 0–7 | 1–6 | 0–7 | |
| Fibrosis Stage, n (%) | 0.321 | ||||
| 0 | 0 (0.0%) | 5 (55.6%) | 0 (0.0%) | 5 (35.7%) | |
| 1 | 1 (50.0%) | 2 (22.2%) | 2 (66.7%) | 5 (35.7%) | |
| 2 | 1 (50.0%) | 2 (22.2%) | 1 (33.3%) | 4 (28.6%) | |
| Not Available | 10 | 107 | 48 | 165 | |
| Timepoint 2 | ||||
| Timepoint 1 | ALT ≤ 70 IU/L | ALT 71 to 250 IU/L | ALT > 250 IU/L | Participant Count |
| ALT ≤ 70 IU/L | 79.4% | 20.0% | 0.6% | 170 (50.7%) |
| ALT 71–250 IU/L | 31.1% | 65.5% | 3.4% | 148 (44.2%) |
| ALT > 250 IU/L | 5.9% | 47.05% | 47.05% | 17 (5.1%) |
| Participant Count | 182 (54.3%) | 139 (41.4%) | 14 (4.1%) | |
| Timepoint 3 | ||||
| Timepoint 2 | ALT ≤ 70 IU/L | ALT 71 to 250 U/L | ALT > 250 IU/L | Participant Count |
| ALT ≤ 70 IU/L | 82.4% | 17.6% | 0% | 182 (54.3%) |
| ALT 71–250 IU/L | 29.5% | 66.2% | 4.3% | 139 (41.4%) |
| ALT > 250 IU/L | 7.1% | 57.1% | 39.4% | 14 (4.1%) |
| Participant Count | 192 (57.3%) | 132 (39.4%) | 11 (3.2%) | |
| Timepoint 4 | ||||
| Timepoint 3 | ALT ≤ 70 IU/L | ALT 71 to 250 U/L | ALT > 250 IU/L | Participant Count |
| ALT ≤ 70 IU/L | 80.2% | 19.3% | 0.5% | 192 (57.3%) |
| ALT 71–250 IU/L | 25.0% | 69.7% | 5.3% | 132 (39.4%) |
| ALT >250 IU/L | 0% | 0.1% | 90.9% | 11 (3.2%) |
| Participant Count | 187 (55.8%) | 130 (38.8%) | 18 (5.4%) | |
| Timepoint 5 | ||||
| Timepoint 4 | ALT ≤ 70 IU/L | ALT 71 to 250 U/L | ALT > 250 IU/L | Participant Count |
| ALT ≤ 70 IU/L | 83.4% | 16.6% | 0% | 187 (55.8%) |
| ALT 71–250 IU/L | 18.5% | 73.9% | 7.7% | 130 (38.8%) |
| ALT > 250 IU/L | 5.6% | 55.6% | 38.9% | 18 (5.4%) |
| Participant Count | 181 (54.0%) | 137 (40.9%) | 17 (5.1%) | |
| The Co-Authors would Like to Thank the Members of the TARGET-NASH Consortium: |
|---|
| Manal Abdelmalek (Duke/Durham, NC, USA) |
| Humberto Aguilar (Louisiana Research Center/Shreveport, LA, USA) |
| Aijaz Ahmed (Stanford University/Palo Alto, CA, USA) |
| Alina Allen (Mayo Clinic/Rochester, MN, USA) |
| Sarah Barlow (UT Southwestern Children’s Health/Dallas, TX, USA) |
| Sid Barritt (University of North Carolina Chapel Hill/Chapel Hill, NC, USA) |
| David Bernstein (Northwell Health/Manhasset, NY, USA) |
| Kaylan Bhamidimarri (University of Miami/Miami, FL, USA) |
| Liana Billings (Northshore University Health System/Skokie, IL, USA) |
| Kyle Brown (University of Iowa Hospitals and Clinics/Iowa City, IA, USA) |
| Robert Brown (Weill Cornell Medical College/New York, NY, USA) |
| Karen Corbin (Advent Health Diabetes Institute/Orlando, FL, USA) |
| Kenneth Cusi (University of Florida Health Division of Endocrinology/Gainsville, FL, USA) |
| Andrew deLemos (Center for Liver Disease and Transplant at CMC/Charlotte, NC, USA) |
| Karan Emerick (Connecticut Children’s Hospital/Hartford, CT, USA) |
| Roberto Firpi-Morell (University of Florida Hepatology Research/Gainsville, FL, USA) |
| Maged Adel Ghali (University of Florida–Jacksonville/Jacksonville, FL, USA) |
| Zachary Henry (University of Virginia/Charlottesville, VA, USA) |
| Whitney Jackson (University of Colorado/Aurora, CO, USA) |
| Sujit Janardhan (Rush University Medical Center/Chicago, IL, USA) |
| Mohammad Kabbany (Cleveland Clinic Children’s/Cleveland, OH, USA) |
| Nyingi Kemmer (Tampa General Medical Group/Tampa, FL, USA) |
| David Koch (MUSC/Charleston, SC, USA) |
| Justin Kupec (West Virginia University/Morgantown, WV, USA) |
| Charles Landis (Harborview Medical Center/Seattle, WA, USA) |
| Mary Katherine Lawrence (Carteret Medical Center/Morehead City, NC, USA) |
| Cynthia Levy (Schiff Center for Liver Disease–University of Miami/Miami, FL, USA) |
| Steven Lidofsky (University of Vermont Medical Center/Burlington, VT, USA) |
| Anna Lok (University of Michigan/Ann Arbor, MI, USA) |
| Velimir Luketic (Virginia Commonwealth University/Richmond, VA, USA) |
| Enrique Martinez (Atlanta Gastro/Atlanta, GA, USA) |
| Craig McClain (University of Louisville/Louisville, KY, USA) |
| Patrick McKiernan (UPMC Children’s Hospital of Pittsburgh/Pittsburgh, PA, USA) |
| Ellen Mitchell (St. Christopher’s Hospital for Children/Philadelphia, PA, USA) |
| Mazen Noureddin (California Liver Research Institute/Pasadena, CA, USA) |
| Sirish Palle (University of Oklahoma/Oklahoma City, OK, USA) |
| Yen Pham (Baylor College of Medicine/Houston, TX, USA) |
| David Pound (Indianapolis Gastroenterology Research Foundation/Indianapolis, IN, USA) |
| Rajender Reddy (University of Pennsylvania/Philadelphia, PA, USA) |
| Fredric Regenstein (Tulane/New Orleans, LA, USA) |
| Mary Rinella (Northwestern University/Chicago, IL, USA) |
| Fedja Rochling (University of Nebraska Medical Center/Omaha, NE, USA) |
| Bryan Rudolph (Children’s Hospital at Montefiore/Bronx, NY, USA) |
| Vinod Rustgi (Rutgers, Robert Wood Johnson Medical School/New Brunswick, NJ, USA) |
| Adnan Said (University of Wisconsin Madison/Madison, WI, USA) |
| Niharika Samala (Indiana University/Indianapolis, IN, USA) |
| Souvik Sarkar (University of California Davis/Sacramento, CA, USA) |
| Kenneth Sherman (University of Cincinnati Health LLC/Cincinnati, OH, USA) |
| Mitchell Shiffman (Bon Secours Liver Institute of Virginia–MIH/Richmond, VA, USA) |
| Coleman Smith (Georgetown University, Medstar/Washington DC, USA) |
| Jawahar Taunk (Advance Gastroenterology Associates, LLC/Palm Harbor, FL, USA) |
| Brent Tetri (St. Louis University/St. Louis, MO, USA) |
| Paul Thuluvath (Mercy Medical Center/Baltimore, MD, USA) |
| Huy Trinh (Silicon Valley Research Institute/San Jose, CA, USA) |
| Elizabeth Verna (Columbia University Medical Center/New York, NY, USA) |
| Miriam Vos (Emory/Atlanta, GA, USA) |
| L. Michael Weiss (Gastro Florida/Clearwater, FL, USA) |
| Mark Wong (Banner University Medical Center/Phoenix, AZ, USA) |
| Kathleen Wyne (Ohio State University/Columbus, OH, USA) |
| Stavra Xanthakos (Cincinnati Children’s Hospital/Cincinnati, OH, USA) |
References
- Anderson, E.L.; Howe, L.; Jones, H.; Higgins, J.; Lawlor, D.; Fraser, A. The Prevalence of Non-Alcoholic Fatty Liver Disease in Children and Adolescents: A Systematic Review and Meta-Analysis. PLoS ONE 2015, 10, e0140908. [Google Scholar] [CrossRef] [PubMed] [Green Version]
- Schwimmer, J.B.; Ugalde-Nicalo, P.; Welsh, J.A.; Angeles, J.E.; Cordero, M.; Harlow, K.E. Effect of a Low Free Sugar Diet vs Usual Diet on Nonalcoholic Fatty Liver Disease in Adolescent Boys: A Randomized Clinical Trial. JAMA 2019, 321, 256–265. [Google Scholar] [CrossRef] [PubMed] [Green Version]
- Suri, A.; Song, E.; van Nispen, J.; Voigt, M.; Armstrong, A.; Murali, V.; Jain, A. Advances in the Epidemiology, Diagnosis, and Management of Pediatric Fatty Liver Disease. Clin. Ther. 2021, 43, 438–454. [Google Scholar] [CrossRef] [PubMed]
- Welsh, J.A.; Karpen, S.; Vos, M.B. Increasing Prevalence of Nonalcoholic Fatty Liver Disease Among United States Adolescents, 1988–1994 to 2007–2010. J. Pediatr. 2013, 162, 496–500.e1. [Google Scholar] [CrossRef] [Green Version]
- Lobstein, T.; Jackson-Leach, R.; Moodie, M.L.; Hall, K.D.; Gortmaker, S.L.; Swinburn, B.A.; James, W.P.T.; Wang, Y.F.; McPherson, K. Child and adolescent obesity: Part of a bigger picture. Lancet 2015, 385, 2510–2520. [Google Scholar] [CrossRef] [Green Version]
- Van Dommelen, P.; Schönbeck, Y.; Van Buuren, S.; HiraSing, R.A. Trends in a life threatening condition: Morbid obesity in Dutch, Turkish and Moroccan children in The Netherlands. PLoS ONE 2014, 9, e94299. [Google Scholar] [CrossRef]
- Nobili, V.; Bedogni, G.; Canani, R.B.; Brambilla, P.; Cianfarani, S.; Pietrobelli, A.; Agostoni, C. The potential role of fatty liver in paediatric metabolic syndrome: A distinct phenotype with high metabolic risk? Pediatr. Obes. 2012, 7, e75–e80. [Google Scholar] [CrossRef]
- Patton, H.M.; Yates, K.; Unalp-Arida, A.; Behling, C.A.; Huang, T.T.-K.; Rosenthal, P.; Sanyal, A.J.; Schwimmer, J.; Lavine, J.E. Association Between Metabolic Syndrome and Liver Histology Among Children With Nonalcoholic Fatty Liver Disease. Am. J. Gastroenterol. 2010, 105, 2093–2102. [Google Scholar] [CrossRef] [Green Version]
- Holterman, A.L.; Guzman, G.; Fantuzzi, G.; Wang, H.; Aigner, K.; Browne, A.; Holterman, M. Nonalcoholic fatty liver disease in severely obese adolescent and adult patients. Obesity 2013, 21, 591–597. [Google Scholar] [CrossRef] [Green Version]
- Vos, M.B.; Abrams, S.H.; Barlow, S.E.; Caprio, S.; Daniels, S.R.; Kohli, R.; Mouzaki, M.; Sathya, P.; Schwimmer, J.B.; Sundaram, S.S.; et al. NASPGHAN Clinical Practice Guideline for the Diagnosis and Treatment of Nonalcoholic Fatty Liver Disease in Children: Recommendations from the Expert Committee on NAFLD (ECON) and the North American Society of Pediatric Gastroenterology, Hepatology and Nutrition (NASPGHAN). J. Pediatr. Gastroenterol. Nutr. 2017, 64, 319–334. [Google Scholar] [CrossRef] [Green Version]
- Angulo, P.; Kleiner, D.E.; Dam-Larsen, S.; Adams, L.A.; Björnsson, E.S.; Charatcharoenwitthaya, P.; Mills, P.R.; Keach, J.C.; Lafferty, H.D.; Stahler, A.; et al. Liver Fibrosis, but No Other Histologic Features, Is Associated With Long-term Outcomes of Patients With Nonalcoholic Fatty Liver Disease. Gastroenterology 2015, 149, 389–397.e10. [Google Scholar] [CrossRef] [PubMed] [Green Version]
- Barritt, A.; Gitlin, N.; Klein, S.; Lok, A.S.; Loomba, R.; Malahias, L.; Powell, M.; Vos, M.B.; Weiss, L.M.; Cusi, K.; et al. Design and rationale for a real-world observational cohort of patients with nonalcoholic fatty liver disease: The target-nash study. Contemp. Clin. Trials 2017, 61, 33–38. [Google Scholar] [CrossRef] [PubMed]
- Barritt, A.S.; Watkins, S.; Gitlin, N.; Klein, S.; Lok, A.S.; Loomba, R.; Schoen, C.; Reddy, K.R.; Trinh, H.N.; Mospan, A.R.; et al. Patient Determinants for Histologic Diagnosis of NAFLD in the Real World: A target-nash Study. Hepatol. Commun. 2021, 5, 938–946. [Google Scholar] [CrossRef]
- Newton, K.P.; Hou, J.; Crimmins, N.A.; LaVine, J.E.; Barlow, S.E.; Xanthakos, S.A.; Africa, J.; Behling, C.; Donithan, M.; Clark, J.M.; et al. Prevalence of Prediabetes and Type 2 Diabetes in Children with Nonalcoholic Fatty Liver Disease. JAMA Pediatr. 2016, 170, e161971. [Google Scholar] [CrossRef] [PubMed]
- Schwimmer, J.B.; Dunn, W.; Norman, G.; Pardee, P.E.; Middleton, M.S.; Kerkar, N.; Sirlin, C. SAFETY Study: Alanine Aminotransferase Cutoff Values Are Set Too High for Reliable Detection of Pediatric Chronic Liver Disease. Gastroenterology 2010, 138, 1357–1364.e2. [Google Scholar] [CrossRef] [Green Version]
- Molleston, J.P.; Schwimmer, J.; Yates, K.P.; Murray, K.F.; Cummings, O.W.; Lavine, J.E.; Brunt, E.M.; Scheimann, A.O.; Unalp-Arida, A. Histological Abnormalities in Children with Nonalcoholic Fatty Liver Disease and Normal or Mildly Elevated Alanine Aminotransferase Levels. J. Pediatr. 2014, 164, 707–713.e3. [Google Scholar] [CrossRef] [Green Version]
- Goldner, D.; Lavine, J.E. Nonalcoholic Fatty Liver Disease in Children: Unique Considerations and Challenges. Gastroenterology 2020, 158, 1967–1983.e1. [Google Scholar] [CrossRef]
- Marzuillo, P.; Del Giudice, E.M.; Santoro, N. Pediatric fatty liver disease: Role of ethnicity and genetics. World J. Gastroenterol. 2014, 20, 7347–7355. [Google Scholar] [CrossRef]
- Harwood, J.; Bishop, P.; Liu, H.; Nowicki, M. Safety of Blind Percutaneous Liver Biopsy in Obese Children A Retrospective Analysis. J. Clin. Gastroenterol. 2010, 44, e253–e255. [Google Scholar] [CrossRef]
- Matos, H.; Noruegas, M.J.; Gonçalves, I.; Sanches, C. Effectiveness and safety of ultrasound-guided percutaneous liver biopsy in children. Pediatr. Radiol. 2012, 42, 1322–1325. [Google Scholar] [CrossRef]
- Draijer, L.G.; Feddouli, S.; Bohte, A.E.; Slootweg, O.V.B.; Rijcken, T.H.P.; Benninga, M.A.; Stoker, J.; Koot, B.G.P. Comparison of diagnostic accuracy of screening tests ALT and ultrasound for pediatric non-alcoholic fatty liver disease. Eur. J. Pediatr. 2019, 178, 863–870. [Google Scholar] [CrossRef] [PubMed] [Green Version]
- Arsik, I.; Frediani, J.K.; Frezza, D.; Chen, W.; Ayer, T.; Keskinocak, P.; Jin, R.; Konomi, J.V.; Barlow, S.E.; Xanthakos, S.A.; et al. Alanine Aminotransferase as a Monitoring Biomarker in Children with Nonalcoholic Fatty Liver Disease: A Secondary Analysis Using TONIC Trial Data. Children 2018, 5, 64. [Google Scholar] [CrossRef] [PubMed] [Green Version]
- Lavine, J.E.; Schwimmer, J.B.; Van Natta, M.L.; Molleston, J.P.; Murray, K.F.; Rosenthal, P. Effect of vitamin E or metformin for treatment of nonalcoholic fatty liver disease in children and adolescents: The TONIC randomized controlled trial. JAMA 2011, 305, 1659–1668. [Google Scholar] [CrossRef] [PubMed] [Green Version]
- Rudolph, B. Diagnostic and Treatment Dilemmas in Pediatric NAFLD. Clin. Liver Dis. 2021, 18, 37–39. [Google Scholar] [CrossRef] [PubMed]
- Feldstein, A.E.; Charatcharoenwitthaya, P.; Treeprasertsuk, S.; Benson, J.T.; Enders, F.; Angulo, P. The natural history of non-alcoholic fatty liver disease in children: A follow-up study for up to 20 years. Gut 2009, 58, 1538–1544. [Google Scholar] [CrossRef] [PubMed]
- Mouzaki, M.; Trout, A.T.; Arce-Clachar, A.C.; Bramlage, K.; Kuhnell, P.; Dillman, J.R.; Xanthakos, S. Assessment of Nonalcoholic Fatty Liver Disease Progression in Children Using Magnetic Resonance Imaging. J. Pediatr. 2018, 201, 86–92. [Google Scholar] [CrossRef]
- Pacifico, L.; Celestre, M.; Anania, C.; Paolantonio, P.; Chiesa, C.; Laghi, A. MRI and ultrasound for hepatic fat quantification:relationships to clinical and metabolic characteristics of pediatric nonalcoholic fatty liver disease. Acta Paediatr. 2007, 96, 542–547. [Google Scholar] [CrossRef]
- Harrison, S.A.; Rinella, M.E.; Abdelmalek, M.F.; Trotter, J.F.; Paredes, A.H.; Arnold, H.L.; Kugelmas, M.; Bashir, M.R.; Jaros, M.J.; Ling, L.; et al. NGM282 for treatment of non-alcoholic steatohepatitis: A multicentre, randomised, double-blind, placebo-controlled, phase 2 trial. Lancet 2018, 391, 1174–1185. [Google Scholar] [CrossRef]

| Summary | Any Biopsy Reported | All Participants (n = 660) | p-Values | |
|---|---|---|---|---|
| Biopsy | No Biopsy | |||
| (n = 187) | (n = 473) | |||
| Clinical Characteristics | ||||
| Age at Study Entry (years) † | 0.557 | |||
| Median (n) | 14.0 (187) | 13.0 (473) | 13.0 (660) | |
| Mean (SD) | 13.6 (2.81) | 13.4 (3.02) | 13.5 (2.96) | |
| Min–Max | 7–21 | 4–20 | 4–21 | |
| Age Categories, n (%) | 0.428 | |||
| Age < 12 | 45 (24.1%) | 128 (27.1%) | 173 (26.2%) | |
| Age ≥ 12 | 142 (75.9%) | 345 (72.9%) | 487 (73.8%) | |
| Gender, n (%) | 0.358 | |||
| Female | 61 (32.6%) | 137 (29.0%) | 198 (30.0%) | |
| Race, n (%) | White vs. Non-White Overall: 0.697 | |||
| White | 122 (65.2%) | 319 (67.4%) | 441 (66.8%) | |
| Black or African American | 3 (1.6%) | 16 (3.4%) | 19(2.9%) | |
| American Indian or Alaska Native | 5 (2.7%) | 11 (2.3%) | 16 (2.4%) | |
| Asian | 5 (2.7%) | 5 (1.1%) | 10 (1.5%) | |
| Native Hawaiian or other Pacific Islander | 1 (0.5%) | 2 (0.4%) | 3 (0.5%) | |
| Other | 34 (18.2%) | 82 (17.3%) | 116 (17.6%) | |
| Not Reported | 17 (9.1%) | 38 (8.0%) | 55 (8.3%) | |
| Ethnicity, n (%) | 0.016 | |||
| Hispanic or Latino | 126 (67.4%) | 269 (56.9%) | 395 (59.8%) | |
| Not Hispanic or Latino | 61 (32.6%) | 201 (42.5%) | 262 (39.7%) | |
| Not Reported | 0 (0.0%) | 3 (0.6%) | 3 (0.5%) | |
| Insurance Type, n (%) | 187 (100.0%) | 473 (100.0%) | 660 (100.0%) | Participants have more than one insurance type so p-values are not presented. |
| Medicaid/Medicare | 149 (79.6%) | 326 (68.9%) | 475 (71.9%) | |
| Private | 36 (19.3%) | 133 (28.1%) | 169 (25.6%) | |
| Other | 6 (3.2%) | 15 (3.1%) | 21 (3.2%) | |
| Uninsured | 0 (0.0%) | 2 (0.4%) | 2 (0.3%) | |
| Percentile for Most Recent BMI | 0.223 | |||
| Median (n) | 99.17 (185) | 99.05 (467) | 99.09 (652) | |
| Min–Max | 87.5–99.9 | 48.5–100.0 | 48.5–100.0 | |
| Z-Score for Most Recent BMI | 0.158 | |||
| Median (n) | 2.40 (185) | 2.35 (467) | 2.36 (652) | |
| Min–Max | 1.1–3.3 | 0.0–4.5 | 0.0–4.5 | |
| Cirrhosis, n (%) | 18 (9.6%) | 6 (1.3%) | 24 (3.6%) | <0.001 |
| Diabetes, n (%) ‡ | 51 (27.3%) | 72 (15.2%) | 123 (18.6%) | <0.001 |
| Laboratory Parameters | ||||
| Lowest Platelets (103/uL) | 0.167 | |||
| Median (n) | 264.0 (187) | 274.0 (452) | 272.0 (639) | |
| Min–Max | 12–450 | 3–571 | 3–571 | |
| Lowest Albumin (g/dL) | 0.016 | |||
| Median (n) | 4.1 (187) | 4.3 (468) | 4.2 (655) | |
| Min–Max | 2–5 | 1–5 | 1–5 | |
| Lowest Hemoglobin (g/dL) | 0.006 | |||
| Median (n) | 13.2 (187) | 13.4 (449) | 13.3 (636) | |
| Min–Max | 7–17 | 6–18 | 6–18 | |
| Highest ALT (U/L) | <0.001 | |||
| Median (n) | 169.0 (187) | 88.0 (473) | 103.0 (660) | |
| Min–Max | 28–929 | 10–568 | 10–929 | |
| Highest AST (U/L) | <0.001 | |||
| Median (n) | 91.0 (187) | 52.0 (473) | 59.0 (660) | |
| Min–Max | 18–486 | 20–374 | 18–486 | |
| Highest ALP (U/L) | 0.049 | |||
| Median (n) | 293.0 (187) | 266.0 (467) | 273.5 (654) | |
| Min–Max | 57–637 | 43–830 | 43–830 | |
| Highest Total Bilirubin (mg/dl) | 0.272 | |||
| Median (n) | 0.6 (187) | 0.5 (466) | 0.5 (653) | |
| Min–Max | 0.2–16.0 | 0.2–16.0 | 0.2–16.0 | |
| Medication Use | ||||
| Any Metformin Use, n (%) | 48 (25.7%) | 63 (13.3%) | 111 (16.8%) | <0.001 |
| Any Vitamin E Use, n (%) | 67 (35.8%) | 30 (6.3%) | 97 (14.7%) | <0.001 |
| Follow-up | ||||
| Time from First ALT to Last ALT (mon) § | <0.001 | |||
| Median (n) | 34.9 (187) | 26.2 (453) | 28.5 (640) | |
| Min–Max | 1.4–66.4 | 1.3–68.6 | 1.3–68.6 | |
| Peak ALT | All Participants (n = 660) | p-Values | |||
|---|---|---|---|---|---|
| Summary | ≤70 IU/L | 71 to 250 IU/L | >250 IU/L | ||
| (n = 164) | (n = 415) | (n = 81) | |||
| Clinical Characteristics | |||||
| Age at Study Entry (years) † | Overall: 0.017 | ||||
| Median (n) | 13.0 (164) | 14.0 (415) | 14.0 (81) | 13.0 (660) | Low vs. High: 0.097 |
| Mean (SD) | 12.9 (3.04) | 13.7 (2.97) | 13.6 (2.62) | 13.5 (2.96) | Med vs. High: 0.766 |
| Min–Max | 4–18 | 7–21 | 7–20 | 4–21 | Low vs. Med: 0.005 |
| Age Categories, n (%) | Overall: 0.119 | ||||
| Age < 12 | 53 (32.3%) | 102 (24.6%) | 18 (22.2%) | 173 (26.2%) | Low vs. High: 0.097 |
| Age ≥ 12 | 111 (67.7%) | 313 (75.4%) | 63 (77.8%) | 487 (73.8%) | Med vs. High: 0.648 |
| Low vs. Med: 0.061 | |||||
| Gender, n (%) | Overall: 0.002 | ||||
| Female | 67 (40.9%) | 107 (25.8%) | 24 (29.6%) | 198 (30.0%) | Low vs. High: 0.084 |
| Med vs. High: 0.477 | |||||
| Low vs. Med: 0.001 | |||||
| Race, n (%) | White vs. Non-White | ||||
| White | 119 (72.6%) | 272 (65.5%) | 50 (61.7%) | 441 (66.8%) | Overall: 0.432 |
| Black or African American | 5 (3.0%) | 13 (3.1%) | 1 (1.2%) | 19 (2.9%) | Low vs. High: 0.312 |
| American Indian or Alaska Native | 3 (1.8%) | 10 (2.4%) | 3 (3.7%) | 16 (2.4%) | Med vs. High: 0.818 |
| Asian | 0 (0.0%) | 9 (2.2%) | 1 (1.2%) | 10 (1.5%) | Low vs. Med: 0.231 |
| Native Hawaiian or other Pacific Islander | 1 (0.6%) | 2 (0.5%) | 0 (0.0%) | 3 (0.5%) | |
| Other | 27 (16.5%) | 73 (17.6%) | 16 (19.8%) | 116 (17.6%) | |
| Not Reported | 9 (5.5%) | 36 (8.7%) | 10 (12.3%) | 55 (8.3%) | |
| Ethnicity, n (%) | Overall: 0.264 | ||||
| Hispanic or Latino | 99 (60.4%) | 241 (58.1%) | 55 (67.9%) | 395 (59.8%) | Low vs. High: 0.272 |
| Not Hispanic or Latino | 64 (39.0%) | 172 (41.4%) | 26 (32.1%) | 262 (39.7%) | Med vs. High: 0.105 |
| Not Reported | 1 (0.6%) | 2 (0.5%) | 0 (0.0%) | 3 (0.5%) | Low vs. Med: 0.600 |
| Insurance Type, n (%) | 164 (100.0%) | 415 (100.0%) | 81 (100.0%) | 660 (100.0%) | Participants have more than one insurance type so p-values are not presented. |
| Medicaid | 118 (72.0%) | 285 (68.7%) | 58 (71.6%) | 461 (69.8%) | |
| Private | 40 (24.4%) | 109 (26.3%) | 20 (24.7%) | 169 (25.6%) | |
| Medicare | 3 (1.8%) | 9 (2.2%) | 2 (2.5%) | 14 (2.1%) | |
| Unknown | 4 (2.4%) | 9 (2.2%) | 1 (1.2%) | 14 (2.1%) | |
| Other | 0 (0.0%) | 4 (1.0%) | 1 (1.2%) | 5 (0.8%) | |
| Supplemental | 0 (0.0%) | 1 (0.2%) | 1 (1.2%) | 2 (0.3%) | |
| Uninsured | 0 (0.0%) | 2 (0.5%) | 0 (0.0%) | 2 (0.3%) | |
| Most Recent BMI (kg/m2) | Overall: 0.328 | ||||
| Median (n) | 34.0 (164) | 34.0 (413) | 34.0 (79) | 34.0 (656) | Low vs. High: 0.215 Med vs. High: 0.139 Low vs. Med: 0.897 |
| Mean (SD) | 35.0 (7.6) | 34.9 (6.9) | 36.2 (7.6) | 35.1 (7.2) | |
| Min–Max | 20–61 | 23–64 | 22–59 | 20–64 | |
| Percentile for Most Recent BMI | Overall: 0.098 | ||||
| Median (n) | 99.09 (164) | 99.05 (410) | 99.20 (78) | 99.09 (652) | Low vs. High: 0.046 |
| Min–Max | 48.5–100.0 | 52.0–100.0 | 92.5–99.9 | 48.5–100.0 | Med vs. High: 0.328 |
| Low vs. Med: 0.095 | |||||
| Z-Score for Most Recent BMI | 2.36 (164) | 2.35 (410) | 2.41 (78) | 2.36 (652) | Overall: 0.326 |
| Median (n) | −0.0–4.5 | 0.1–3.3 | 1.4–3.1 | −0.0–4.5 | Low vs. High: 0.244 |
| Min–Max | Med vs. High: 0.135 | ||||
| Low vs. Med: 0.790 | |||||
| Cirrhosis, n (%) | 2 (1.2%) | 14 (3.4%) | 8 (9.9%) | 24 (3.6%) | Overall 6: 0.005 |
| Low vs. High 6: 0.003 Med vs. High: 0.020 | |||||
| Low vs. Med 6: 0.123 | |||||
| Diabetes, n (%) ‡ | 27 (16.5%) | 67 (16.1%) | 29 (35.8%) | 123 (18.6%) | Overall: <0.001 |
| Low vs. High: <0.001 Med vs. High: <0.001 | |||||
| Low vs. Med: 0.925 | |||||
| Laboratory Parameters | |||||
| Highest ALT (U/L) | - | ||||
| Median (n) | 53.0 (164) | 114.0 (415) | 329.0 (81) | 103.0 (660) | |
| Min–Max | 10–70 | 71–250 | 252–929 | 10–929 | |
| Highest AST (U/L) | Overall: <0.001 | ||||
| Median (n) | 35.0 (164) | 64.0 (415) | 185.0 (81) | 59.0 (660) | Low vs. High: <0.001 |
| Min–Max | 18–135 | 28–374 | 81–486 | 18–486 | Med vs. High: <0.001 |
| Low vs. Med: <0.001 | |||||
| Highest ALP (U/L) | Overall: 0.272 | ||||
| Median (n) | 274.5 (164) | 266.0 (410) | 308.5 (80) | 273.5 (654) | Low vs. High: 0.122 |
| Min–Max | 56–541 | 43–830 | 71–620 | 43–830 | Med vs. High: 0.143 |
| Low vs. Med: 0.733 | |||||
| Lowest Hemoglobin (g/dL) | Overall: 0.002 | ||||
| Median (n) | 13.0 (161) | 13.4 (397) | 13.2 (78) | 13.3 (636) | Low vs. High: 0.287 |
| Min–Max | 8–18 | 6–17 | 6–16 | 6–18 | Med vs. High: 0.003 |
| Low vs. Med: 0.016 | |||||
| Highest Total Bilirubin (mg/dl) | Overall: 0.190 | ||||
| Median (n) | 0.5 (163) | 0.5 (410) | 0.6 (80) | 0.5 (653) | Low vs. High: 0.131 |
| Min–Max | 0.2–16.0 | 0.2–16.0 | 0.3–12.0 | 0.2–16.0 | Med vs. High: 0.071 |
| Low vs. Med: 0.874 | |||||
| Medication Use | |||||
| Any Metformin Use, n (%) | Overall: 0.001 | ||||
| 26 (15.9%) | 59 (14.2%) | 26 (32.1% | 111 (16.8%) | Low vs. High: 0.004 | |
| Med vs. High: <0.001 | |||||
| Low vs. Med: 0.618 | |||||
| Any Vitamin E Use, n (%) | Overall: <0.001 | ||||
| 10 (6.1%) | 62 (14.9%) | 25 (30.9%) | 97 (14.7%) | Low vs. High: <0.001 | |
| Med vs. High: 0.001 | |||||
| Low vs. Med: 0.002 | |||||
| Follow-up | |||||
| Time from First ALT to Last ALT (mon) § | Overall: 0.152 | ||||
| Median (n) | 28.0 (155) | 28.3 (405) | 31.1 (80) | 28.5 (640) | Low vs. High: 0.085 |
| Min–Max | 1.6–68.6 | 1.4–68.3 | 1.3–65.6 | 1.3–68.6 | Med vs. High: 0.496 |
| Low vs. Med: 0.103 | |||||
| Number of Patients (n = 660) | Mean (SD) | Median (Min–Max) | p-Value | |
|---|---|---|---|---|
| Age at enrollment (yrs) | ||||
| Age < 12 | 173 | 133.3 (122.3) | 98.0 (22–819) | 0.44 |
| Age ≥ 12 | 487 | 141.1 (109.4) | 104.0 (10–929) | |
| Sex | 0.186 | |||
| Female | 198 | 130.2 (110.8) | 92.0 (10–694) | |
| Male | 462 | 142.8 (113.7) | 106.5 (14–929) | |
| Race | 0.327 † | |||
| White | 441 | 133.1 (108.6) | 98.0 (14–929) | |
| Black or African American | 19 | 94.9 (58.5) | 78.0 (29–257) | |
| American Indian or Alaska Native | 16 | 160.8 (97.1) | 125.0 (46–360) | |
| Asian | 10 | 145.8 (101.8) | 98.0 (73–383) | |
| Native Hawaiian or other Pacific Islander | 3 | 74.0 (28.1) | 76.0 (45–101) | |
| Other Race | 116 | 149.4 (123.1) | 112.0 (10–715) | |
| Ethnicity | 0.018 | |||
| Hispanic or Latino | 395 | 147.7 (123.3) | 106.0 (19–929) | |
| Not Hispanic or Latino | 262 | 126.4 (94.5) | 98.5 (10–819) | |
| Body Mass Index, Percentile ‡ | 0.167 | |||
| ≤95 th | 47 | 116.8 (71.05) | 105.0 (10–357) | |
| >95 th | 605 | 140.4 (115.2) | 103.0 (14–929) | |
| Cirrhosis | 0.018 | |||
| Yes | 24 | 192.8 (125.0) | 155.5 (27–473) | |
| No | 636 | 137.0 (120.0) | 102.0 (10–929) | |
| History of Type 2 diabetes | 0.004 | |||
| Yes | 123 | 171.2 (121.8) | 137.0 (14–615) | |
| No | 537 | 131.7 (109.5) | 99.0 (10–929) | |
| Any Metformin Use | 0.003 | |||
| Yes | 111 | 167.7 (122.6) | 130.0 (14–615) | |
| No | 549 | 133.2 (110.0) | 100.0 (10–929) | |
| Any Vitamin E Use | <0.001 | |||
| Yes | 97 | 204.7 (158.7) | 162.0 (26–929) | |
| No | 563 | 127.7 (98.9) | 98.0 (10–715) | |
| Biopsy | <0.001 | |||
| Yes | 187 | 211.2 (150.7) | 169.0 (28–929) | |
| No | 473 | 110.5 (77.21) | 88.0 (10–568) |
Publisher’s Note: MDPI stays neutral with regard to jurisdictional claims in published maps and institutional affiliations. |
© 2022 by the authors. Licensee MDPI, Basel, Switzerland. This article is an open access article distributed under the terms and conditions of the Creative Commons Attribution (CC BY) license (https://creativecommons.org/licenses/by/4.0/).
Share and Cite
Castillo-Leon, E.; Morris, H.L.; Schoen, C.; Bilhartz, J.; McKiernan, P.; Miloh, T.; Palle, S.; Kabbany, M.N.; Munoz, B.; Mospan, A.R.; et al. Variation in Alanine Aminotransferase in Children with Non-Alcoholic Fatty Liver Disease. Children 2022, 9, 374. https://doi.org/10.3390/children9030374
Castillo-Leon E, Morris HL, Schoen C, Bilhartz J, McKiernan P, Miloh T, Palle S, Kabbany MN, Munoz B, Mospan AR, et al. Variation in Alanine Aminotransferase in Children with Non-Alcoholic Fatty Liver Disease. Children. 2022; 9(3):374. https://doi.org/10.3390/children9030374
Chicago/Turabian StyleCastillo-Leon, Eduardo, Heather L. Morris, Cheryl Schoen, Jacob Bilhartz, Patrick McKiernan, Tamir Miloh, Sirish Palle, Mohammad Nasser Kabbany, Breda Munoz, Andrea R. Mospan, and et al. 2022. "Variation in Alanine Aminotransferase in Children with Non-Alcoholic Fatty Liver Disease" Children 9, no. 3: 374. https://doi.org/10.3390/children9030374
APA StyleCastillo-Leon, E., Morris, H. L., Schoen, C., Bilhartz, J., McKiernan, P., Miloh, T., Palle, S., Kabbany, M. N., Munoz, B., Mospan, A. R., Rudolph, B., Xanthakos, S. A., Vos, M. B., & TARGET-NASH Investigators. (2022). Variation in Alanine Aminotransferase in Children with Non-Alcoholic Fatty Liver Disease. Children, 9(3), 374. https://doi.org/10.3390/children9030374