Highlights
What are the main findings?
- Using CT-based finite element analysis of the tibia, this study found that higher intensity physical activity during late adolescence and emerging adulthood is associated with stronger bone structure.
What is the implication of the main finding?
- Advanced imaging and biomechanical modeling improve bone health estimation.
- High-intensity physical activity during late adolescence and emerging adulthood improves bone strength.
Abstract
Objective: This study investigated associations between physical activity (PA) during late adolescence and emerging adulthood and bone strength in emerging adulthood by utilizing advanced finite element analysis of computed tomography (CT/FEA) technology beyond the traditional dual-energy X-ray absorptiometry (DXA) method. Methods: This study included 266 participants (152 females) from the Iowa Bone Development Study. PA volume (average acceleration) and intensity (intensity gradient) metrics were calculated from ActiGraph accelerometer data collected at ages 17, 19, 21, and 23 years. Compressive modulus and compressive stiffness of the tibia were estimated at age 23 via CT/FEA of the tibia. Sex-specific linear regression models were used to evaluate associations between PA metrics and bone outcomes, adjusting for age, height, weight, musculoskeletal fitness, and calcium intake. Results: Intensity gradient averaged over 17–23 years of age was positively associated with compressive stiffness at age 23 years in both females and males (p < 0.01). Intensity gradient was positively associated with compressive modulus in females (p < 0.01), but not in males. No significant associations were found between average acceleration and either compressive stiffness or modulus in either sex (p > 0.05). Conclusions: Using a state-of-the-art CT/FEA method, this study suggests that high-intensity PA during late adolescence and emerging adulthood improves bone strength.
1. Introduction
Early adulthood marks the culmination of bone mass accrual, with peak bone mass typically attained during this period [1,2]. Low peak bone mass increases long-term risk for skeletal fragility and bone fractures [3,4,5,6,7,8,9,10,11,12]. A one standard deviation increase in bone mineral density is associated with approximately a 50% reduction in fracture risk among young adults aged 20–29 years [13]. However, fracture risk depends on more than just densitometry-measured bone mass, since the resistance of a specific bone to deformation is determined by a combination of material and structural properties [14,15]. Clinically, bone health has often been evaluated using imaging modalities such as dual-energy X-ray absorptiometry (DXA) and peripheral quantitative computed tomography (pQCT), which provide measures of bone mineral content, microarchitecture, and volumetric density [16]. These imaging-derived metrics serve as useful proxies for the combined effects of bone material and structure during deformation. However, it is stress during deformation, not bone mass or quality alone, that most closely predicts bone strength and fracture risk [17]. An advanced computer technique for structural stress analysis using 3-dimensional CT scan data, finite element analysis (FEA), enables estimation of internal stress and strain distributions, offering a more precise measurement of bone’s mechanical integrity and fracture risk [17]. Unlike DXA and pQCT which provide indirect estimates of bone strength based on density and geometry, CT-based FEA (CT/FEA) offers a direct biomechanical assessment by simulating how bone responds to mechanical loading, thereby providing a more functionally relevant measure of fracture resistance [18]. CT/FEA has been shown to provide more reliable surrogates of bone strength, compared to traditional densitometric measures, such as bone mineral content, bone mineral density, and areal bone mineral density [19,20,21,22]. CT/FEA-derived bone strength calculations have been used to estimate fracture risk and monitor treatment efficacy in osteoporosis [17].
Prior reports, including those from the Iowa Bone Development Study (IBDS), have consistently shown positive associations between physical activity (PA) and DXA- and pQCT-derived bone parameters in childhood through early adulthood [23,24,25,26]. Using the IBDS’s final follow-up data at age 23 years, Rowlands et al. [24] reported that both PA intensity and volume from ages 17 to 23 were positively associated with DXA-derived total body bone mineral content and hip bone mineral density at age 23 among females and males. To our knowledge, no prior human studies have investigated CT/FEA-derived bone strength measures in relation to free-living PA in young populations [27]. This present study builds on the prior work [24] by utilizing compressive modulus and stiffness measures, derived from CT-based FEA of the tibia (CT/FEA), to more directly quantify bone strength. CT/FEA-derived compressive modulus is a material-level property reflecting the elastic response of the bone tissue itself to compressive loading [28]. CT/FEA-derived compressive stiffness is a structural-level property that captures the overall resistance of the entire bone segment to compression [29].
This present study aimed to confirm and extend previous IBDS findings by linking accelerometer-based PA intensity and volume measures with these advanced CT/FEA-based bone strength measures. We hypothesized that both PA intensity and volume would be independently associated with bone compressive modulus and stiffness, with sex-specific effects. This article is a revised and expanded version of a paper entitled “High-magnitude physical activity and musculoskeletal fitness in youth predict young adult bone strength: Iowa Bone Development Study”, which was presented at the 2024 North American Society for Pediatric Exercise Medicine Conference in Louisville, Kentucky, USA, in August 2024. This study has important implications for sports scientists aiming to optimize training regimens for bone health, as well as public health professionals designing youth PA guidelines.
2. Materials and Methods
2.1. Study Sample
Participants were drawn from the IBDS, a longitudinal cohort study that included a subset of the Iowa Fluoride birth cohort study. The Iowa Fluoride Study recruited 1882 full-term newborns recruited from 8 hospital postpartum wards in Iowa, USA, between 1992 and 1995. Of them, 890 were recruited for the IBDS at approximate age 5 years. Approximately 95% of IBDS participants were non-Hispanic white. Approximately 70% of mothers had a 4-year college degree. IBDS conducted study assessments every 2–3 years from ages 5 through 23. Over 18 years of the follow-up period, 562 of 890 participants (63.1%) were lost to follow up and 328 (36.9%) participated in a study visit at age 23. For this report, we included 266 participants (29.9%) who completed a CT scan at age 23 and had measurements available for all considered explanatory variables. Those who were included in this analysis had similar demographic distributions, specifically in race/ethnicity, sex, and maternal education attainment, as well as similar PA levels at age 5, compared to those who were excluded.
2.2. Physical Activity Exposure
Exposure variables were accelerometer-measured average acceleration (PA volume indicator) and intensity gradient (PA intensity indicator) during late adolescence through emerging adulthood. Average acceleration is the mean acceleration across the 24-h day (mg) and intensity gradient is the distribution of intensity across the 24-h day [30]. Average acceleration and intensity gradient metrics have been used as summary metrics of a 24-h activity profile [31,32]. They are useful to explore the independent effects of PA volume and intensity [33]. To assess PA, participants were asked to wear a three-axis ActiGraph GT3X+ accelerometer (Pensacola, FL, USA) on the hip for five days, including both weekend days, at ages 17, 19, 21, and 23 years. At ages 17, 19, and 21 years, participants were instructed to wear the monitor during a waking day. At age 23 years, a 24-h wear was optional. Accelerometer data were processed to derive average acceleration and intensity gradient metrics using previously established protocols from IBDS analyses [24]. Briefly, accelerometer files were processed using R-package GGIR (version 1.9-4) [34] to detect non-wear (defined as at least 60 consecutive minutes of acceleration below a threshold, allowing up to 2 min of short interruptions) [35] and to calculate the average magnitude of dynamic acceleration using the Euclidean Norm Minus One (ENMO) metric [34,35]. Non-wear was imputed using the average at similar time points on different days of the week (default setting in GGIR). We calculated an average of all available values from four assessments under the assumption of missing at random [24] to represent cumulative PA exposure across late adolescence and early adulthood.
2.3. Bone Strength Outcomes
Outcome variables were tibial CT/FEA-derived compressive modulus and compressive stiffness. CT/FEA is a computational modeling technique that integrates high-resolution CT imaging with biomechanical simulations to estimate bone mechanical behavior under specific loading conditions [17,36,37]. FEA simulates the physical phenomenon of a specific mechanical loading condition on a target object using a finite network of mesh elements [38]. This method enables a non-invasive, subject-specific assessment of bone strength by simulating the mechanical response of bone tissue to forces that mimic physiological loading [39]. Among CT/FEA-derived bone strength metrics, we used compressive modulus and stiffness that represent functional properties of bone quality and fracture resistance. Compressive modulus characterizes its ability to resist deformation per unit stress and provides insight into the microstructural quality of the bone. Therefore, compressive modulus is useful for assessing bone quality and bone fragility at a microstructural level [40]. Higher compressive modulus values indicate stiffer, more mineralized bone tissue. Compressive stiffness quantifies the total resistance of the bone segment to axial deformation under compressive forces [29]. As such, compressive stiffness is a functional indicator of whole-bone mechanical competence and is directly related to fracture resistance under physiological loading [17]. Higher compressive stiffness values reflect greater structural integrity and an enhanced ability of bone to resist mechanical deformation. These two metrics together offer a comprehensive biomechanical assessment of bone strength beyond traditional bone density measurements alone [17]: compressive modulus informs on the quality of the bone matrix at the tissue level, while compressive stiffness provides an integrated measure of bone’s structural and functional performance.
At age 23, participants underwent pQCT imaging of the distal tibia at 4–6% metaphyseal region using a Siemens SOMATOM Force scanner (120 kV, 100 mAs; Forchheim, Germany). The region of interest was chosen for its high trabecular content and relevance to lower limb loading. The imaging protocol employed a voxel resolution of 170 μm in-plane and a 200 μm slice thickness, optimized for precise representation of bone geometry and density. A calibration phantom was used to convert CT intensity numbers in Hounsfield units into volumetric bone mineral density values [38]. Voxel-based nonlinear continuum FEA was performed using the ANSYS software (ANSYS Mechanical 2019 R2, Ansys Inc., South Pointe, PA, USA; Figure 1). The inferior surface of the cylindrical volume of interest (VOI) was fully constrained, while a uniform displacement was applied in the z-axis to each node on the superior surface to simulate physiological axial compressive loading. A Poisson’s ratio of 0.3 was assumed. Trabecular bone modulus was calculated as the ratio of the average von Mises stress (MPa) across elements on the top surface to the applied displacement [38]. Compressive stiffness was derived by dividing total reaction force by applied displacement (kN/mm). Our prior experiments demonstrated that continuum FEA-derived metrics showed high reliability (intraclass correlation coefficient = 0.98) and strong correlations with microstructural reference values at in vivo imaging resolution (r ≥ 0.87) [38].
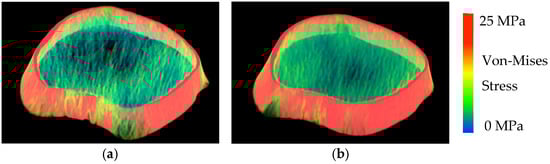
Figure 1.
FEA-modeled images of the distal tibia from two female participants. (a). Stiffness: 451 kN/mm and Modulus: 2991 MPa. (b). Stiffness: 652 kN/mm and Modulus: 4409 MPa.
2.4. Other Measurements
To ascertain associations between PA volume and intensity metrics and bone structure metrics, we considered age, weight, height, and calcium intake (estimated from Diet History Questionnaire II) [41] measured at age 23. Additionally, we accounted for the effect of musculoskeletal fitness based on prior evidence linking musculoskeletal fitness to bone outcomes [42,43,44,45]. To assess musculoskeletal fitness, participants completed a vertical jump test and a handgrip strength test during assessment visits at ages 17, 19, and 23 years [46,47]. We used a Vertec (Questek Corp., Elgin, IL, USA) to measure vertical jump height in centimeters (cm). For the jump test, participants performed a squat jump by bending their knees and moving their arms behind them until their knuckles faced the floor, holding this squat position momentarily so as to eliminate countermovement momentum. They then jumped as high as possible while reaching up and hitting the Vertec vanes with the dominant arm. This test was repeated three times per person per wave and three jump height values (cm) were averaged. Then, jump power (Watts) was calculated by 60.7 × jump height (cm) + 45.3 × body mass (kg) − 2055 [48]. For handgrip strength, we used a Jamar hand dynamometer (Creative Health Products, Plymouth, MI, USA), following a standard protocol. Participants were seated with their elbow flexed at 90°, forearm in a neutral position and wrist between 0° and 30° dorsiflexion. Each hand was tested twice, and the maximum value in kilograms from each hand was recorded. The highest value from either hand was used as the final handgrip strength measure to reflect maximal voluntary contraction.
2.5. Statistical Analysis
All analysis was stratified by sex. Descriptive analyses, including frequency and distribution analyses, were conducted. Multivariable linear regression models were used to evaluate associations between PA volume and intensity and compressive modulus and stiffness outcomes. These models were adjusted for potential confounders measured at age 23: age, weight, height, and calcium intake (estimated from Diet History Questionnaire II) [41]. Musculoskeletal fitness was also included as a covariate, represented by average handgrip strength (kg) and vertical jump power (Watts) across ages 17, 19, and 23. Model assumptions and residuals were tested for model diagnosis. All analyses were performed in R version 4.4.
3. Results
Among the 266 participants (152 females) included in the analysis, the means of daily average acceleration across the four assessments were 15.0 mg (range of 4.1 to 25.9) for females and 15.8 mg (range of 7.1 to 28.1) for males (Table 1). The means of intensity gradient were −2.93 (range of −3.50 to −2.24) for females and −2.90 (range of −3.39 to −2.45) for males.

Table 1.
Means and standard deviations (SD) of study variables by sex.
As presented in Table 2, in adjusted models, intensity gradient averaged over 17–23 years of age was positively associated with compressive modulus in females (p < 0.01), but not in males. Average acceleration was not associated with compressive modulus among either females or males.
Table 2.
Multivariable linear regression models for compressive modulus (MPa) by sex.
As shown in Table 3, in adjusted models, intensity gradient averaged over 17–23 years of age was positively associated with compressive stiffness at age 23 years in both females and males (p < 0.01). No significant associations were found between average acceleration and compressive stiffness among either females or males.
Table 3.
Multivariable linear regression models for compressive stiffness (KN/mm) by sex.
Figure 2 presents partial residual plots derived from the multivariable linear regression models. These plots illustrate a linear positive relationship between intensity gradient and both compressive modulus and stiffness among females and between intensity gradient and compressive stiffness among males.
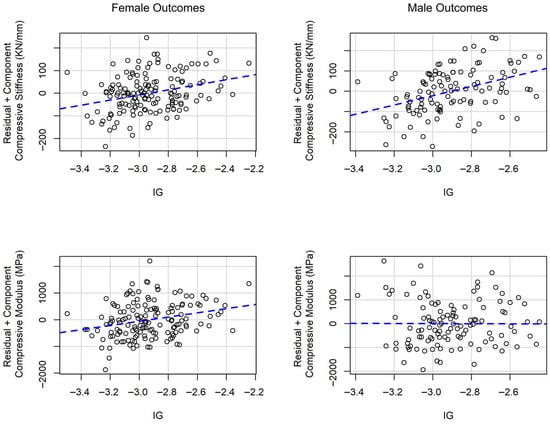
Figure 2.
Partial residual plots for the relationship between intensity gradient (IG) and compressive modulus and stiffness in multivariable linear regression models.
4. Discussion
Summary of Findings. Using advanced CT/FEA of the tibia, the study found that PA intensity during late adolescence through emerging adulthood was positively associated with compressive stiffness in emerging adulthood among both females and males. PA intensity was also positively associated with compressive modulus among females, but not among males. In contrast, PA volume showed no significant association with either bone strength outcomes.
Consistency with prior IBDS findings and the broader literature. These findings extend the substantial body of evidence from the IBDS, which has consistently demonstrated positive effects of youth PA, especially vigorous-intensity PA on bone outcomes using increasingly sophisticated measurement approaches [25,26]. More recently, Rowlands et al. [24] extended these findings to age 23 years by showing positive associations between both PA intensity and volume and DXA-derived hip bone mineral density and total body bone mineral content at age 23 in the IBDS sample. The study [24] also found that PA volume, but not intensity, was positively associated with DXA-derived hip geometry outcomes such as cross-sectional area and section modulus.
By incorporating a tibial CT/FEA method, the present study advances research by directly estimating bone strength under simulated mechanical loading. The study results showed the positive association between PA intensity and bone strength among young people. Specifically, this study highlights the importance of high-intensity PA during late adolescence through emerging adulthood, rather than total PA volume, on improving bone mechanical competence, as measured by compressive stiffness and modulus. Notably, in both females and males, PA intensity was positively associated with compressive stiffness, which is a clinically meaningful metric that directly reflects the bone’s ability to resist deformation and potential fracture [49]. The positive association between PA intensity and compressive modulus observed only in females, but not in males, may be partly explained by sex-specific differences in skeletal adaptation; specifically, testosterone-driven periosteal expansion in males could attenuate detectable effects on tissue-level properties such as modulus. This divergence from earlier DXA-based findings by Rowlands et al. [24] may reflect the greater sensitivity of FEA-derived bone strength metrics to mechanical loading characteristics, which are more directly influenced by activity intensity than total activity volume. High-intensity loading likely induces greater osteogenic stimuli by exceeding the mechanical thresholds necessary to trigger bone formation, particularly during the critical window of adolescence and emerging adulthood, thereby more effectively enhancing the structural and material bone properties captured by FEA. These findings support the role of high-intensity PA in stimulating bone mechanoadaptation [50,51] and align with recent evidence from systematic review [50] indicating that vigorous-intensity PA produces greater benefits for bone health than lower-intensity PA in youth. Taken together, our findings reinforce the concept that activity intensity and loading magnitude are key drivers of bone strength development.
Implications. These findings suggest that high-intensity PA, particularly movements that involve dynamic, high-magnitude loading, may be more effective in promoting bone strength and preventing future fractures rather than increasing PA volume. While musculoskeletal fitness (e.g., handgrip strength, jump power) remains important [42,43,44,45], our results emphasize the added value of bone-targeted loading patterns through high-intensity PA. Practical implications may include encouraging high-intensity physical activity that significantly elevate heart rate, such as school-based plyometrics, vigorous sports and dance, and running, during late adolescence. Future interventions aimed at optimizing skeletal health in youth and young adults should prioritize high-impact or high-intensity PA, rather than focusing on overall PA volume. These strategies may offer a more direct pathway to improve long-term bone strength.
Limitations. While the CT/FEA method is highly innovative, it is also sensitive to modeling assumptions, including boundary conditions, loading direction, and software-specific parameters, which may have influenced the absolute values of computed bone strength estimates. Residual confounding from unmeasured confounders, such as genetic predisposition, early-life PA exposure, or baseline bone health, may have biased the observed associations. Attrition over the two-decade study period could have introduced selection bias, limiting generalizability to the broader IBDS cohort. The predominantly non-Hispanic White sample from a Midwestern U.S. region also limits generalizability to racially, ethnically, or geographically diverse populations.
5. Conclusions
This study adds to the field by using CT/FEA to quantify functional bone strength metrics in emerging adults. Using high-resolution imaging and advanced biomechanical modeling, this study provides strong evidence that high-intensity PA during late adolescence and emerging adulthood is beneficial for bone strength. These findings support youth high-intensity PA as a critical component of evidence-based strategies to optimize bone strength.
Author Contributions
S.K. drafted the manuscript. K.F.J. and E.D.S. contributed to manuscript writing and revisions. I.G., A.V.R. and P.K.S. contributed to study measure development and data interpretation. O.R. and C.P. performed statistical data analysis. S.M.L. secured funding and provided oversight of the Iowa Bone Development Study. All authors have read and agreed to the published version of the manuscript.
Funding
This research was supported by National Institute of Child Health and Development (R03HD100657), the National Institute of Dental and Craniofacial Research (R01-DE12101, R01-DE09551), and the National Center for Research Resources (UL1 RR024979, M01-RR00059).
Institutional Review Board Statement
The study was conducted in accordance with the Declaration of Helsinki and approved by the Institutional Review Board of University of Iowa (IRB ID#199112665; 30 April 2020).
Informed Consent Statement
Informed consent was obtained from all subjects involved in the study.
Data Availability Statement
The original contributions presented in this study are included in the article. Further inquiries can be directed to the corresponding author.
Acknowledgments
The authors are grateful to the parents, children, and staff of the Iowa Bone Development Study and the Iowa Fluoride Study.
Conflicts of Interest
The authors declare no conflicts of interest. The funders had no role in the design of the study; in the collection, analyses, or interpretation of data; in the writing of the manuscript; or in the decision to publish the results.
Abbreviations
The following abbreviations are used in this manuscript:
| CI | confidence interval |
| CT | computed tomography |
| CT/FEA | computed tomography-based finite element analysis |
| DXA | dual-energy X-ray absorptiometry |
| FEA | finite element analysis |
| IBDS | Iowa Bone Development Study |
| PA | physical activity |
| pQCT | peripheral quantitative computed tomography |
References
- Xue, S.; Kemal, O.; Lu, M.; Lix, L.M.; Leslie, W.D.; Yang, S. Age at attainment of peak bone mineral density and its associated factors: The National Health and Nutrition Examination Survey 2005–2014. Bone 2020, 131, 115163. [Google Scholar] [CrossRef]
- Lindgren, E.; Rosengren, B.E.; Karlsson, M.K. Does peak bone mass correlate with peak bone strength? Cross-sectional normative dual energy X-ray absorptiometry data in 1052 men aged 18–28 years. BMC Musculoskelet. Disord. 2019, 20, 404. [Google Scholar] [CrossRef] [PubMed]
- Reid, K.F.; Fielding, R.A. Skeletal muscle power: A critical determinant of physical functioning in older adults. Exerc. Sport Sci. Rev. 2012, 40, 4–12. [Google Scholar] [CrossRef] [PubMed]
- Dulloo, A.G.; Bosy-Westphal, A.; Muller, M.J. Diagnosis of obesity based on body composition-associated health risks—Time for a change in paradigm. Obes. Rev. 2021, 22, e13190. [Google Scholar] [CrossRef]
- Stephen, W.C.; Janssen, I. Sarcopenic-obesity and cardiovascular disease risk in the elderly. J. Nutr. Health Aging 2009, 13, 460–466. [Google Scholar] [CrossRef]
- Zamboni, M.; Mazzali, G.; Fantin, F.; Rossi, A.; Di Francesco, V. Sarcopenic obesity: A new category of obesity in the elderly. Nutr. Metab. Cardiovasc. Dis. 2008, 18, 388–395. [Google Scholar] [CrossRef]
- Lee, J.-H.; Kim, S.-Y.; Kim, D.-I. Association of muscle strength and body mass index with risk factors for metabolic syndrome and its prevalence in Korean adult women. BMC Public Health 2022, 22, 2060. [Google Scholar] [CrossRef]
- Kim, Y.H.; So, W.-Y. A low arm and leg muscle mass to total body weight ratio is associated with an increased prevalence of metabolic syndrome: The Korea National Health and Nutrition Examination Survey 2010–2011. Technol. Health Care 2016, 24, 655–663. [Google Scholar] [CrossRef]
- Kim, S.; Valdez, R. Metabolic risk factors in U.S. youth with low relative muscle mass. Obes. Res. Clin. Pract. 2015, 9, 125–132. [Google Scholar] [CrossRef]
- Peterson, M.D.; Zhang, P.; Saltarelli, W.A.; Visich, P.S.; Gordon, P.M. Low Muscle Strength Thresholds for the Detection of Cardiometabolic Risk in Adolescents. Am. J. Prev. Med. 2016, 50, 593–599. [Google Scholar] [CrossRef]
- Kim, J.-H.; Park, Y.S. Low muscle mass is associated with metabolic syndrome in Korean adolescents: The Korea National Health and Nutrition Examination Survey 2009–2011. Nutr. Res. 2016, 36, 1423–1428. [Google Scholar] [CrossRef] [PubMed]
- Zembura, M.; Matusik, P. Sarcopenic Obesity in Children and Adolescents: A Systematic Review. Front. Endocrinol. 2022, 13, 914740. [Google Scholar] [CrossRef] [PubMed]
- Melton, L.J.; Atkinson, E.J.; O’Connor, M.K.; O’Fallon, W.M.; Riggs, B.L. Bone Density and Fracture Risk in Men. J. Bone Miner. Res. 1998, 13, 1915–1923. [Google Scholar] [CrossRef] [PubMed]
- Armas, L.A.G.; Lappe, J.M.; Heaney, R.P. Calcium, Bone Strength and Fractures, 2nd ed.; Nova Science Publishers: New York, NY, USA, 2010; pp. 235–241. [Google Scholar]
- Seeman, E.; Delmas, P.D. Bone Quality—The Material and Structural Basis of Bone Strength and Fragility. N. Engl. J. Med. 2006, 354, 2250–2261. [Google Scholar] [CrossRef]
- Stagi, S.; Cavalli, L.; Cavalli, T.; de Martino, M.; Brandi, M.L. Peripheral quantitative computed tomography (pQCT) for the assessment of bone strength in most of bone affecting conditions in developmental age: A review. Ital. J. Pediatr. 2016, 42, 88. [Google Scholar] [CrossRef]
- Imai, K. Computed tomography-based finite element analysis to assess fracture risk and osteoporosis treatment. World J. Exp. Med. 2015, 5, 182–187. [Google Scholar] [CrossRef]
- Dall’Ara, E.; Pahr, D.; Varga, P.; Kainberger, F.; Zysset, P. QCT-based finite element models predict human vertebral strength in vitro significantly better than simulated DEXA. Osteoporos. Int. 2012, 23, 563–572. [Google Scholar] [CrossRef]
- Zysset, P.K.; Dall’Ara, E.; Varga, P.; Pahr, D.H. Finite element analysis for prediction of bone strength. BoneKEy Rep. 2013, 2, 386. [Google Scholar] [CrossRef]
- Viceconti, M. Predicting bone strength from CT data: Clinical applications. Morphologie 2019, 103, 180–186. [Google Scholar] [CrossRef]
- Wang, X.; Sanyal, A.; Cawthon, P.M.; Palermo, L.; Jekir, M.; Christensen, J.; Ensrud, K.E.; Cummings, S.R.; Orwoll, E.; Black, D.M.; et al. Prediction of new clinical vertebral fractures in elderly men using finite element analysis of CT scans. J. Bone Miner. Res. 2012, 27, 808–816. [Google Scholar] [CrossRef]
- Allaire, B.T.; Lu, D.; Johannesdottir, F.; Kopperdahl, D.; Keaveny, T.M.; Jarraya, M.; Guermazi, A.; Bredella, M.A.; Samelson, E.J.; Kiel, D.P.; et al. Prediction of incident vertebral fracture using CT-based finite element analysis. Osteoporos. Int. 2019, 30, 323–331. [Google Scholar] [CrossRef]
- Logan, K.; Lloyd, R.S.; Schafer-Kalkhoff, T.; Khoury, J.C.; Ehrlich, S.; Dolan, L.M.; Shah, A.S.; Myer, G.D. Youth sports participation and health status in early adulthood: A 12-year follow-up. Prev. Med. Rep. 2020, 19, 101107. [Google Scholar] [CrossRef] [PubMed] [PubMed Central]
- Rowlands, A.V.; Edwardson, C.L.; Dawkins, N.P.; Maylor, B.D.; Metcalf, K.M.; Janz, K.F. Physical Activity for Bone Health: How Much and/or How Hard? Med. Sci. Sports Exerc. 2020, 52, 2331–2341. [Google Scholar] [CrossRef]
- Metcalf, K.M.; Letuchy, E.M.; Levy, S.M.; Janz, K.F. An 8-Year Longitudinal Analysis of Physical Activity and Bone Strength From Adolescence to Emerging Adulthood: The Iowa Bone Development Study. Pediatr. Exerc. Sci. 2020, 32, 58–64. [Google Scholar] [CrossRef] [PubMed] [PubMed Central]
- Janz, K.F.; Letuchy, E.M.; Burns, T.L.; Eichenberger Gilmore, J.M.; Torner, J.C.; Levy, S.M. Objectively measured physical activity trajectories predict adolescent bone strength: Iowa Bone Development Study. Br. J. Sports Med. 2014, 48, 1032–1036. [Google Scholar] [CrossRef] [PubMed]
- Troy, K.L.; Mancuso, M.E.; Butler, T.A.; Johnson, J.E. Exercise Early and Often: Effects of Physical Activity and Exercise on Women’s Bone Health. Int. J. Environ. Res. Public Health 2018, 15, 878. [Google Scholar] [CrossRef] [PubMed]
- Bayraktar, H.H.; Morgan, E.F.; Niebur, G.L.; Morris, G.E.; Wong, E.K.; Keaveny, T.M. Comparison of the elastic and yield properties of human femoral trabecular and cortical bone tissue. J. Biomech. 2004, 37, 27–35. [Google Scholar] [CrossRef]
- Cole, J.H.; van der Meulen, M.C.H. Whole Bone Mechanics and Bone Quality. Clin. Orthop. Relat. Res. 2011, 469, 2139–2149. [Google Scholar] [CrossRef]
- Rowlands, A.V.; Edwardson, C.L.; Davies, M.J.; Khunti, K.; Harrington, D.M.; Yates, T. Beyond cut points: Accelerometer metrics that capture the physical activity profile. Med. Sci. Sports Exerc. 2018, 50, 1323–1332. [Google Scholar] [CrossRef] [PubMed]
- Fairclough, S.J.; Clifford, L.; Brown, D.; Tyler, R. Characteristics of 24-hour movement behaviours and their associations with mental health in children and adolescents. J. Act. Sedentary Sleep Behav. 2023, 2, 11. [Google Scholar] [CrossRef]
- Schwendinger, F.; Knaier, R.; Wagner, J.; Infanger, D.; Lichtenstein, E.; Hinrichs, T.; Rowlands, A.; Schmidt-Trucksäss, A. Relative and absolute intensity accelerometer metrics decipher the effects of age, sex, and occupation on physical activity. BMC Public Health 2025, 25, 885. [Google Scholar] [CrossRef] [PubMed]
- Rowlands, A.V.; Fairclough, S.J.; Yates, T.O.M.; Edwardson, C.L.; Davies, M.; Munir, F.; Khunti, K.; Stiles, V.H. Activity Intensity, Volume, and Norms: Utility and Interpretation of Accelerometer Metrics. Med. Sci. Sports Exerc. 2019, 51, 2410–2422. [Google Scholar] [CrossRef] [PubMed]
- Migueles, J.H.; Rowlands, A.V.; Huber, F.; Sabia, S.v.; van Hees, V.T. GGIR: A Research Community?Driven Open Source R Package for Generating Physical Activity and Sleep Outcomes From Multi-Day Raw Accelerometer Data. J. Meas. Phys. Behav. 2019, 2, 188–196. [Google Scholar] [CrossRef]
- van Hees, V.T.; Gorzelniak, L.; Dean León, E.C.; Eder, M.; Pias, M.; Taherian, S.; Ekelund, U.; Renström, F.; Franks, P.W.; Horsch, A.; et al. Separating movement and gravity components in an acceleration signal and implications for the assessment of human daily physical activity. PLoS ONE 2013, 8, e61691. [Google Scholar] [CrossRef] [PubMed] [PubMed Central]
- Imai, K. Analysis of Vertebral Bone Strength, Fracture Pattern, and Fracture Location: A Validation Study Using a Computed Tomography-Based Nonlinear Finite Element Analysis. Aging Dis. 2015, 6, 180–187. [Google Scholar] [CrossRef]
- Crawford, R.P.; Cann, C.E.; Keaveny, T.M. Finite element models predict in vitro vertebral body compressive strength better than quantitative computed tomography. Bone 2003, 33, 744–750. [Google Scholar] [CrossRef]
- Guha, I.; Zhang, X.; Rajapakse, C.S.; Chang, G.; Saha, P.K. Finite element analysis of trabecular bone microstructure using CT imaging and continuum mechanical modeling. Med. Phys. 2022, 49, 3886–3899. [Google Scholar] [CrossRef]
- Bessho, M.; Ohnishi, I.; Matsumoto, T.; Ohashi, S.; Matsuyama, J.; Tobita, K.; Kaneko, M.; Nakamura, K. Prediction of proximal femur strength using a CT-based nonlinear finite element method: Differences in predicted fracture load and site with changing load and boundary conditions. Bone 2009, 45, 226–231. [Google Scholar] [CrossRef]
- Morgan, E.F.; Unnikrisnan, G.U.; Hussein, A.I. Bone Mechanical Properties in Healthy and Diseased States. Annu. Rev. Biomed. Eng. 2018, 20, 119–143. [Google Scholar] [CrossRef]
- Millen, A.E.; Midthune, D.; Thompson, F.E.; Kipnis, V.; Subar, A.F. The National Cancer Institute Diet History Questionnaire: Validation of Pyramid Food Servings. Am. J. Epidemiol. 2006, 163, 279–288. [Google Scholar] [CrossRef]
- Janz, K.F.; Baptista, F.; Ren, S.; Zhu, W.; Laurson, K.R.; Mahar, M.T.; Pavlovic, A.; Welk, G.J. Associations among Musculoskeletal Fitness Assessments and Health Outcomes: The Lisbon Study for the Development and Evaluation of Musculoskeletal Fitness Standards in Youth. Meas. Phys. Educ. Exerc. Sci. 2022, 26, 297–305. [Google Scholar] [CrossRef]
- Janz, K.F.; Laurson, K.R.; Baptista, F.; Mahar, M.T.; Welk, G.J. Vertical Jump Power Is Associated with Healthy Bone Outcomes in Youth: ROC Analyses and Diagnostic Performance. Meas. Phys. Educ. Exerc. Sci. 2022, 26, 315–323. [Google Scholar] [CrossRef]
- Macdonald, H.; Kontulainen, S.; Petit, M.; Janssen, P.; McKay, H. Bone strength and its determinants in pre- and early pubertal boys and girls. Bone 2006, 39, 598–608. [Google Scholar] [CrossRef] [PubMed]
- Saint-Maurice, P.F.; Laurson, K.; Welk, G.J.; Eisenmann, J.; Gracia-Marco, L.; Artero, E.G.; Ortega, F.; Ruiz, J.R.; Moreno, L.A.; Vicente-Rodriguez, G.; et al. Grip strength cutpoints for youth based on a clinically relevant bone health outcome. Arch. Osteoporos. 2018, 13, 92. [Google Scholar] [CrossRef] [PubMed]
- Ward, R.C.; Janz, K.F.; Letuchy, E.M.; Peterson, C.; Levy, S.M. Contribution of High School Sport Participation to Young Adult Bone Strength. Med. Sci. Sports Exerc. 2018, 51, 1064–1072. [Google Scholar] [CrossRef]
- Janz, K.F.; Letuchy, E.M.; Burns, T.L.; Francis, S.L.; Levy, S.M. Muscle Power Predicts Adolescent Bone Strength: Iowa Bone Development Study. Med. Sci. Sports Exerc. 2015, 47, 2201–2206. [Google Scholar] [CrossRef]
- Sayers, S.P.; Harackiewicz, D.V.; Harman, E.A.; Frykman, P.N.; Rosenstein, M.T. Cross-validation of three jump power equations. Med. Sci. Sports Exerc. 1999, 31, 572–577. [Google Scholar] [CrossRef]
- Cheuk, K.Y.; Lam, T.P.; Wong, L.L.N.; Hung, A.L.H.; Mak, A.F.T.; Lee, K.M.; Ng, B.K.W.; Cheng, J.C.Y. Evaluating bone strength with finite element analysis for Adolescent Idiopathic Scoliosis (AIS): A case-control study with HR-pQCT. Scoliosis 2015, 10, O20. [Google Scholar] [CrossRef][Green Version]
- Brailey, G.; Metcalf, B.; Lear, R.; Price, L.; Cumming, S.; Stiles, V. A comparison of the associations between bone health and three different intensities of accelerometer-derived habitual physical activity in children and adolescents: A systematic review. Osteoporos. Int. 2022, 33, 1191–1222. [Google Scholar] [CrossRef]
- Brailey, G.; Metcalf, B.; Price, L.; Cumming, S.; Stiles, V. Raw Acceleration from Wrist- and Hip-Worn Accelerometers Corresponds with Mechanical Loading in Children and Adolescents. Sensors 2023, 23, 6943. [Google Scholar] [CrossRef]
Disclaimer/Publisher’s Note: The statements, opinions and data contained in all publications are solely those of the individual author(s) and contributor(s) and not of MDPI and/or the editor(s). MDPI and/or the editor(s) disclaim responsibility for any injury to people or property resulting from any ideas, methods, instructions or products referred to in the content. |
© 2025 by the authors. Licensee MDPI, Basel, Switzerland. This article is an open access article distributed under the terms and conditions of the Creative Commons Attribution (CC BY) license (https://creativecommons.org/licenses/by/4.0/).