Article

Augmented Ouabain-Induced Vascular Response Reduces Cardiac Efficiency in Mice with Migraine-Associated Mutation in the Na+, K+-ATPase α2-Isoform

by
Rajkumar Rajanathan
1,*,
Tina Myhre Pedersen
1,
Halvor Osterby Guldbrandsen
1,
Lenette Foldager Olesen
1,
Morten B. Thomsen
2,
Hans Erik Bøtker
3 and
Vladimir V. Matchkov
1
1
Department of Biomedicine, Aarhus University, 8000 Aarhus, Denmark
2
Department of Biomedical Sciences, University of Copenhagen, 1165 Copenhagen, Denmark
3
Department of Cardiology, Aarhus University Hospital, 8000 Aarhus, Denmark
*
Author to whom correspondence should be addressed.
Biomedicines 2023, 11(2), 344; https://doi.org/10.3390/biomedicines11020344
Submission received: 13 December 2022 / Revised: 22 January 2023 / Accepted: 23 January 2023 / Published: 25 January 2023
(This article belongs to the Special Issue The Role of Na,K-ATPase in Human Health: From Structure to Function)

Abstract

:
Heterozygous mice (α2+/G301R mice) for the migraine-associated mutation (G301R) in the Na+,K+-ATPase α2-isoform have decreased expression of cardiovascular α2-isoform. The α2+/G301R mice exhibit a pro-contractile vascular phenotype associated with decreased left ventricular ejection fraction. However, the integrated functional cardiovascular consequences of this phenotype remain to be addressed in vivo. We hypothesized that the vascular response to α2-isoform-specific inhibition of the Na+,K+-ATPase by ouabain is augmented in α2+/G301R mice leading to reduced cardiac efficiency. Thus, we aimed to assess the functional contribution of the α2-isoform to in vivo cardiovascular function of wild-type (WT) and α2+/G301R mice. Blood pressure, stroke volume, heart rate, total peripheral resistance, arterial dP/dt, and systolic time intervals were assessed in anesthetized WT and α2+/G301R mice. To address rate-dependent cardiac changes, cardiovascular variables were compared before and after intraperitoneal injection of ouabain (1.5 mg/kg) or vehicle during atrial pacing. The α2+/G301R mice showed an enhanced ouabain-induced increase in total peripheral resistance associated with reduced efficiency of systolic development compared to WT. When the hearts were paced, ouabain reduced stroke volume in α2+/G301R mice. In conclusion, the ouabain-induced vascular response was augmented in α2+/G301R mice with consequent suppression of cardiac function.

Graphical Abstract

1. Introduction

Since its discovery in 1957, the Na+,K+-ATPase has been extensively studied [1,2,3]. The Na+,K+-ATPase transports three Na+ ions across the cell membrane to the extracellular milieu, in return, two K+ ions are transported into the cell [4]. This electrogenic ion transport is crucial for many cellular functions including stabilization of the membrane potential, control of cell volume, and maintaining electrochemical gradients important for the secondary active transport of other ions and substrates across the cell membrane [4]. Recently, the Na+,K+-ATPase has also been described to be involved in intracellular signaling [5,6]. The importance of the Na+,K+-ATPase is evident by its ubiquitous expression in all eucaryotic cells [7].
The Na+,K+-ATPase is a heterodimer transporter that consists of at least an α and a β subunit, and it can also include other regulatory and accessory subunits, e.g., FXYD proteins [8]. The α-subunit is highly conserved across species, and it is responsible for the catalytic and ion-transporting functions of the Na+,K+-ATPase [8].
So far, four Na+,K+-ATPase α-isoforms have been identified, i.e., the α1-, α2-, α3-, and α4-isoforms [2,3]. The α-β dimer containing the α1-isoform is commonly expressed in nearly all cell membranes and is generally thought to have a housekeeping role in controlling transmembrane ion homeostasis [3]. The α2-isoform is co-expressed with the α1-isoform in several cell types including muscle tissues, e.g., cardiomyocytes, skeletal, and vascular smooth muscle cells [2,3,9,10,11].
Changes in the Na+,K+-ATPase function are implicated in different pathologies including cardiovascular diseases [2,3,9,10,11,12,13,14,15]. In cardiomyocytes and in vascular smooth muscle cells, the Na+,K+-ATPase is also important for intracellular Ca2+ control and, thus, cardiac and smooth muscle cell contractility [16]. Canonically, the Na+,K+-ATPase generates the Na+ gradient required for the Na+/Ca2+ exchanger to extrude Ca2+ [16]. However, the isoform-specificity of this Ca2+ regulation has been heavily debated. Moreover, the molecular mechanisms underlying the association between isoform-specific functions and cardiovascular pathology remain unclear [3,17,18].
Familial hemiplegic migraine type 2 (FHM2) is a severe form of inherited migraine with aura [19]. Because FHM2 is associated with mutations in the gene encoding the Na+,K+-ATPase α2-isoform [20], this specific disarray offers an avenue for investigation of the α2-isoform-specific function in the cardiovascular system. Thus, this study used mice heterozygous for an FHM2-associated mutation (G301R), i.e., α2+/G301R mice [21]. The G301R mutation leads to decreased expression of the Na+,K+-ATPase α2-isoform in both vascular and heart tissues [9,10,11]. In contrast, the expression of the α1-isoform is increased in the hearts of α2+/G301R mice [11]. This inverse relationship between the expressions of the α1- and α2-isoforms has also been reported for other mouse models [15,22]. The α2+/G301R mouse model is characterized by a changed vascular phenotype [9,10] and an age-dependent (>8 months old) dilation of the ventricles with an associated reduced left ventricular ejection fraction [11].
Cardiac glycosides are a group of molecules that are synthesized by plants and some amphibians [23]. Chemically, they may be characterized by a lactone ring and a steroid ring together with a sugar moiety [23]. The primary mechanism underlying the pharmacodynamics of cardiac glycosides is thought to be their inhibition of the Na+,K+-ATPase [23,24,25,26]. Cardiac glycosides are known in the clinic for their inotropic and chronotropic properties [27]. However, in research, cardiac glycosides may be used as a tool to characterize the functional contribution of the Na+,K+-ATPase to physiological and pathophysiological functions [3,17]. Ouabain is the cardiac glycoside most often used in basic research, and in rodents, ouabain inhibits the isoforms of the Na+,K+-ATPase differently in a concentration-dependent manner [3,17,28]. At low concentrations (below 1–10 µM), ouabain inhibits the α2-isoform and has close to no effect on the α1-isoform [28]. The α1-isoform is only inhibited by concentrations that are 100-fold higher due to a genetic variant unique to rodents [8,28]. Consequently, ouabain allows distinction between isoform-specific functions in rodents.
The vascular effects of ouabain are disputed [24,25,26,29]. While some studies indicate that long-term ouabain administration in rats increases blood pressure in vivo [24,29], other studies suggest no effect of ouabain on blood pressure [25,26]. Additionally, ex vivo studies suggest both ouabain-induced impairment and augmentation of vascular contractility depending on the vascular bed [24,26,30]. This matter is further complicated in vivo due to the inotropic effects of ouabain, which may also contribute to alterations in blood pressure [31,32]. Whether the conflicting data are due to variations in the inhibition of isoform-specific functions of the Na+,K+-ATPase remains unknown. The integrated cardiovascular assessment in vivo may be helpful in distinguishing between the cardiac and vascular components of the effect of ouabain and α2-isoform function. We have previously validated an experimental setup that allows for: (i) Comprehensive assessment of cardiac and vascular functions; (ii) control of heart rate through atrial pacing and examination of rate-dependent variables; and (iii) distinction between simultaneous changes in cardiac and vascular variables in vivo in the anesthetized mouse [33]. Therefore, in this study, we aimed to comprehensively characterize the cardiovascular effect of ouabain in aged (>8 months old) α2+/G301R mice, which were previously shown to have reduced left ventricular ejection fraction [11], and to compare cardiac and vascular responses to ouabain in α2+/G301R mice and matching wild-type mice (WT).
We hypothesized that the effect of ouabain on cardiac and vascular functions is greater in α2+/G301R mice compared to WT at plasma ouabain concentrations inhibiting the α2-isoform. This is due to the reduced expression of the α2-isoform in the cardiovascular system of α2+/G301R mice resulting in a more efficient ouabain-induced inhibition compared to that of the WT.
Our study demonstrates the importance of Na+,K+-ATPase α2-isoform for vascular function and links the ouabain-responsive vascular phenotype in α2+/G301R mice to consequences for their cardiac function in vivo.

2. Materials and Methods

2.1. Experimental Animals

According to the cardiac phenotype previously described in aged α2+/G301R mice [11], we used aged α2+/G301R and WT mice with C57BL/6J background (>8 months old) in this study. Investigators were blinded regarding the genotype of animals. The α2+/G301R mouse line was generated as previously described [21], and they were kept and bred at Aarhus University, Denmark. The homozygous genotype for the G301R mutation is lethal, therefore, only heterozygous mice were available for this study [34,35]. No sex differences have previously been observed in the cardiovascular phenotype of α2+/G301R mice [9,10,11]. Thus, due to their larger body sizes, only male mice (n = 12 for α2+/G301R and n = 12 for WT) were used in this study. Our approach yielded a higher surgical success rate ultimately reducing the number of animals used.
Mice were housed in rooms with controlled temperature (21.5 °C) and humidity (55%) with a 12:12 h light-dark cycle. Mice had ad libitum access to food and water. All animal experiments conformed to the guidelines from Directive 2010/63/EU of the European Parliament on the protection of animals used for scientific purposes. The experimental protocol was approved by the Animal Experiments Inspectorate of the Danish Ministry of Environment and Food and reported in accordance with the ARRIVE (Animal Research: Reporting in vivo Experiments) guidelines [36]. Mice were euthanized under deep anesthesia by cervical dislocation at the end of the study.

2.2. In Vivo Cardiovascular Study

The surgical preparation of mice and implantation of catheter, probe, and electrodes were done as previously described [33]. Mouse core temperature was kept at 37 ± 0.5 °C with a homeothermic blanket system (50-7222F, Harvard Apparatus, Holliston, MA, USA). Mice were mechanically ventilated with a MiniVent Ventilator (model 845, Harvard Apparatus, Holliston, MA, USA) under isoflurane anesthesia (induced at 3% and maintained at 2% in 100% O2 throughout the experiment). Ventilation was connected to a capnograph (Type 340, Harvard Apparatus, Holliston, MA, USA) relaying end-tidal CO2 (%etCO2). Tidal volume relied on body mass (10 µL/g) [37]. Respiration rate was adjusted according to %etCO2 (approximately 3.5%) [38], and it was then kept constant. For arterial blood pressure measurements, the tip of a 1.0 F solid-state catheter (SPR-1000, Millar, Houston, TX, USA) was introduced into the right common carotid artery and placed in the aortic arc. A transit-time flow probe (1.5 SL, Transonic, Ithaca, NY, USA) soaked in ultrasound gel (Kruuse, Langeskov, Denmark) was latched onto the ascending aorta. Flow measured by this flow probe was used as a proxy for cardiac output. Platinum bipolar electrodes positioned on the sinus node were used for electrical atrial pacing and were connected to a dual bioamplifier/stimulator unit (ADInstruments, Sydney, Australia). The electrical pulse width and the current used were 0.2 ms and 3 mA, respectively. Electrocardiogram (ECG) leads I and II were recorded with electrodes on the paws (MLA2505, ADInstruments, Sydney, Australia). During surgical preparation, mice were subject to intraperitoneal (i.p.) administration of pancuronium-bromide (0.4 mg/kg; P1918, Sigma, St. Louis, MO, USA) for the inhibition of respiratory reflexes and NaCl solution (1 mL, 9 mg/mL NaCl; Fresenius Kabi, Bad Homburg, Germany) to compensate any fluid loss.
Instrumentation of the flow probe and blood pressure catheter was successful in all 24 mice. However, the ECG recording of one WT mouse in the vehicle group was not interpretable. Thus, systolic time intervals were not calculated for this mouse.
Following stabilization of cardiovascular variables under the set respiratory parameters, the protocol was initiated (Figure 1). The protocol consisted of two rounds of atrial pacing with administration of either ouabain (1.5 mg/kg i.p., Sigma, St. Louis, MO, USA) or a corresponding volume of vehicle (9 mg/mL i.p., NaCl). First, to control heart rate, atrial pacing was done at 10 Hz with stepwise increments to 11.3 Hz (678 BPM) and then kept for 20 s as previously described [33]. Then, after one minute of sinus rhythm, i.e., heart rate without atrial pacing, ouabain or vehicle was administered i.p., and 5 min were given for cardiovascular variables to restabilize. Eight animals from each genotype were randomized to ouabain administration, and four animals from each genotype were randomized to vehicle administration. Another atrial pacing session was performed at 10 Hz with stepwise increments to 11.3 Hz, which was also kept for 20 s. Subsequently, the protocol was finalized with 6 min of sinus rhythm.
At the end of the experiment, which was approximately 15 min after i.p. injection, blood was collected from the left ventricle in heparinized Eppendorf tubes. The whole blood was centrifuged in a Biofuge centrifuge (Biofuge Fresco, Heraeus, Hanau, Germany) at 2000 RPM (g-force of approximately 310 m/s2) and 4 °C for 10 min to separate the blood components. Plasma was collected and snap-frozen for plasma ouabain analysis. This included 4 and 5 samples in the vehicle groups together with 7 and 13 samples in the ouabain groups for α2+/G301R and WT mice, respectively.

2.3. Measurements of Plasma Ouabain Concentration

Plasma ouabain concentrations were measured with an ELISA kit (CEV857Ge, Cloud-Clone Corp., Houston, TX, USA). The assay was prepared according to the manufacturer’s instructions. To increase the detection range for the standard ouabain concentration curve, we utilized the linearity of the standard ouabain concentration curve in ouabain concentration range of 50,000, 16,666.7, 5555.6, 1851.9, 617.3, 205.7, and 68.60 pg/mL. Each sample measurement was duplicated. The experiment and analysis were performed in a blinded fashion. The signal optical density was measured in a microplate spectrophotometer (Powerwave 340, BioTek, Winooski, VT, USA).

2.4. Data Acquisition and Calculations

All data were recorded in LabChart Pro 8 (ADInstruments, Sydney, Australia). Hemodynamic and ventilation variables were acquired at a sampling rate of 1 kHz using a Powerlab unit (PowerLab 16/35, ADInstruments, Sydney, Australia). The mouse ECG lead I and II were recorded with a sampling rate of 4 kHz. Hemodynamic variables were averaged over one minute. During atrial pacing, variables were averaged over a period of 20 s. Blood flow was measured as the integral of the transit-time flow measurement [39], and cardiac output was calculated based on the measured time interval. Stroke volume was calculated from heart rate and cardiac output. Total peripheral resistance was calculated from mean arterial pressure and cardiac output [40]. As indices for contractility and efficiency of relaxation, the maximum positive first-time derivative (dP/dtmax) [41] and the minimum negative first-time derivative (dP/dtmin) [42] were calculated based on arterial blood pressure measurements, respectively. The systolic time intervals were calculated to estimate myocardial efficiency [43]. This was done based on the temporal relationship between the QRS complex from lead I of the mouse ECG and the opening and closure of the aortic valve based on the blood pressure waveform and blood flow trace (Figure 2). For calculating the systolic time intervals, a script developed in MatLab (MatLab R2020a, MathWorks, Natick, MA, USA) was used. The pre-ejection period was defined as the time between the start of the QRS complex and the opening of the aortic valve indicated by the initial peak of blood flow acceleration in the aorta [44,45]. Left ventricular ejection time was defined as the time between opening of the aortic valve until its closure indicated by the dicrotic notch on the blood pressure waveform [44,46]. The systolic time interval ratio was calculated by dividing pre-ejection period by left ventricular ejection time [43]. Systolic duration was defined as the sum of the pre-ejection period and left ventricular ejection time.

2.5. Statistical Analysis

All data are presented as mean values ± SEM. Also, pacing data are presented as mean values with individual paired data points. If data violated the assumption of normality, a non-parametric test was used for analysis as indicated. Baseline parameters and cardiovascular variables were compared with an unpaired t-test or a Mann–Whitney test. In vivo functional data were analyzed with multiple Wilcoxon tests or a two-way repeated measures ANOVA. Dunnett’s or Bonferroni’s multiple comparison tests were used when a statistically significant effect of a variable was detected. Plasma ouabain concentrations were analyzed with a two-way ANOVA followed by Bonferroni’s multiple comparison test. p-values below 0.05 were considered statistically significant.

3. Results

3.1. Baseline Physiological Variables Were Similar between WT and α2+/G301R Mice

All mice were of the same age and displayed similar body mass. The physiological variables assessed before atrial pacing and pharmacological intervention were also similar between anesthetized WT and α2+/G301R mice (Table 1).

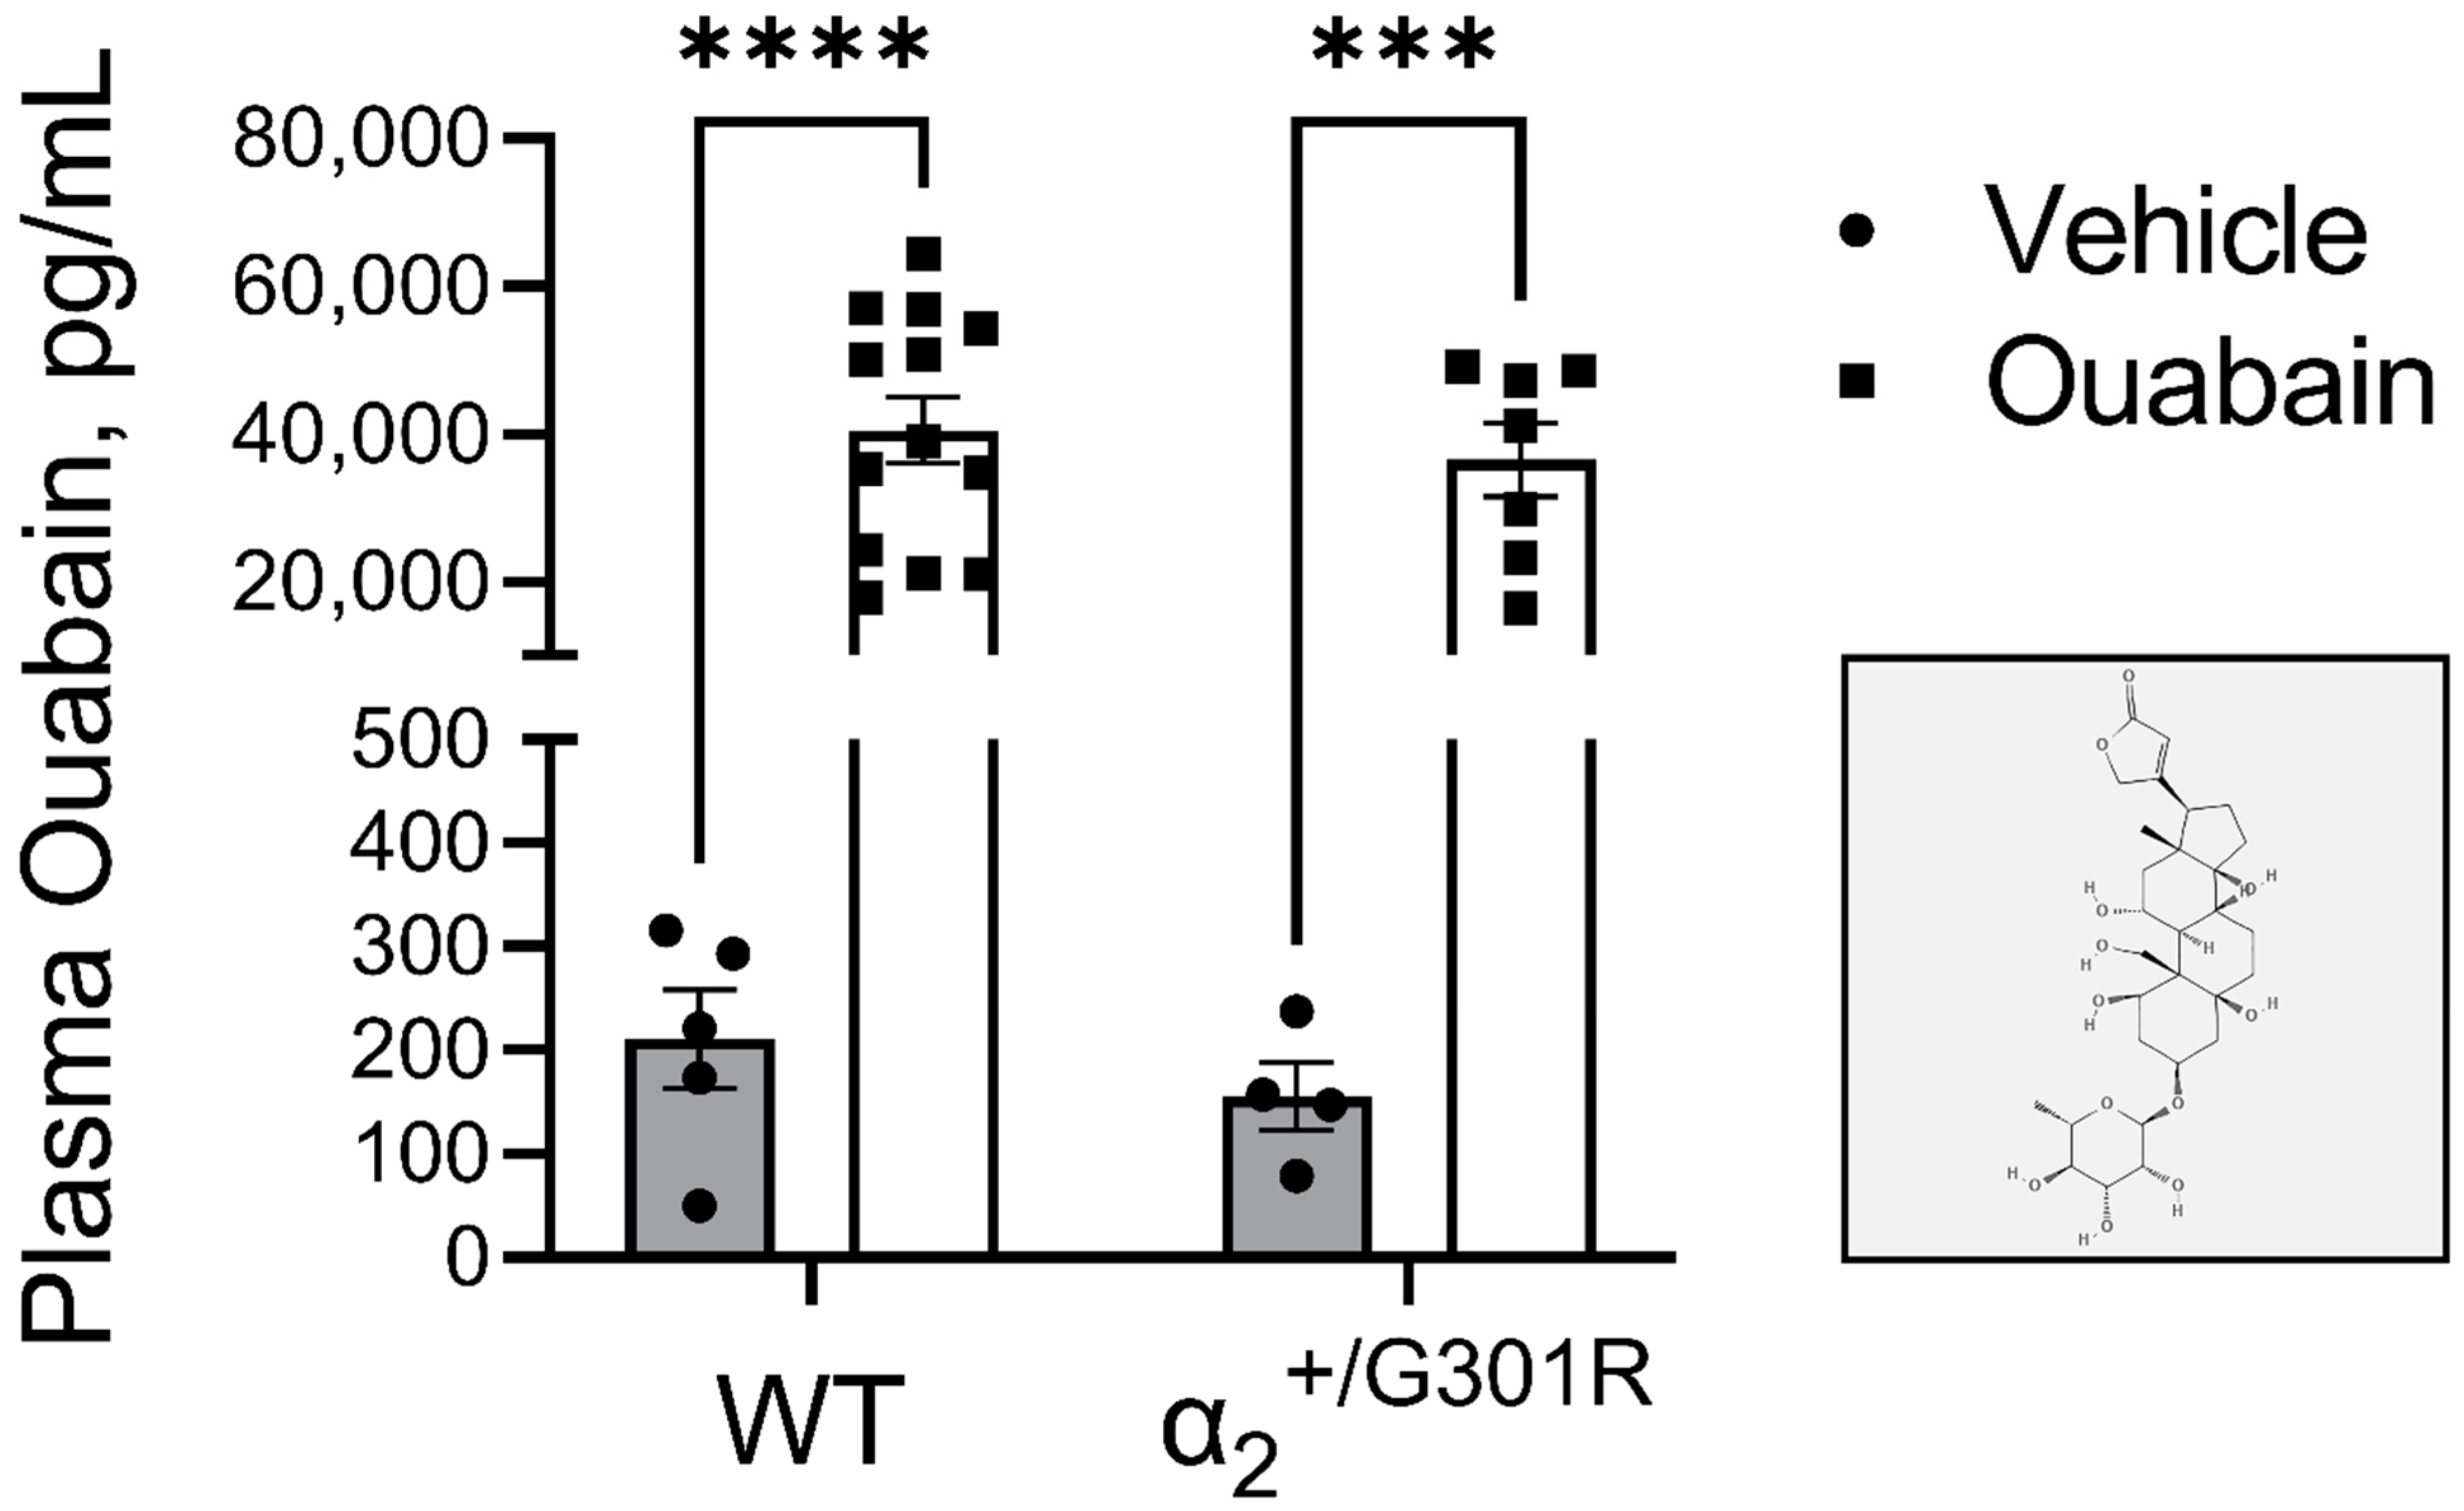
3.2. Administration of Ouabain Similarly Elevates the Plasma Ouabain Concentrations in WT and α2+/G301R Mice

Injection of ouabain (1.5 mg/kg, i.p.,) significantly increased plasma ouabain concentrations of both WT and α2+/G301R mice (p < 0.0001; Figure 3). There was no genotype effect in plasma ouabain concentrations before and after interventions (Figure 3).

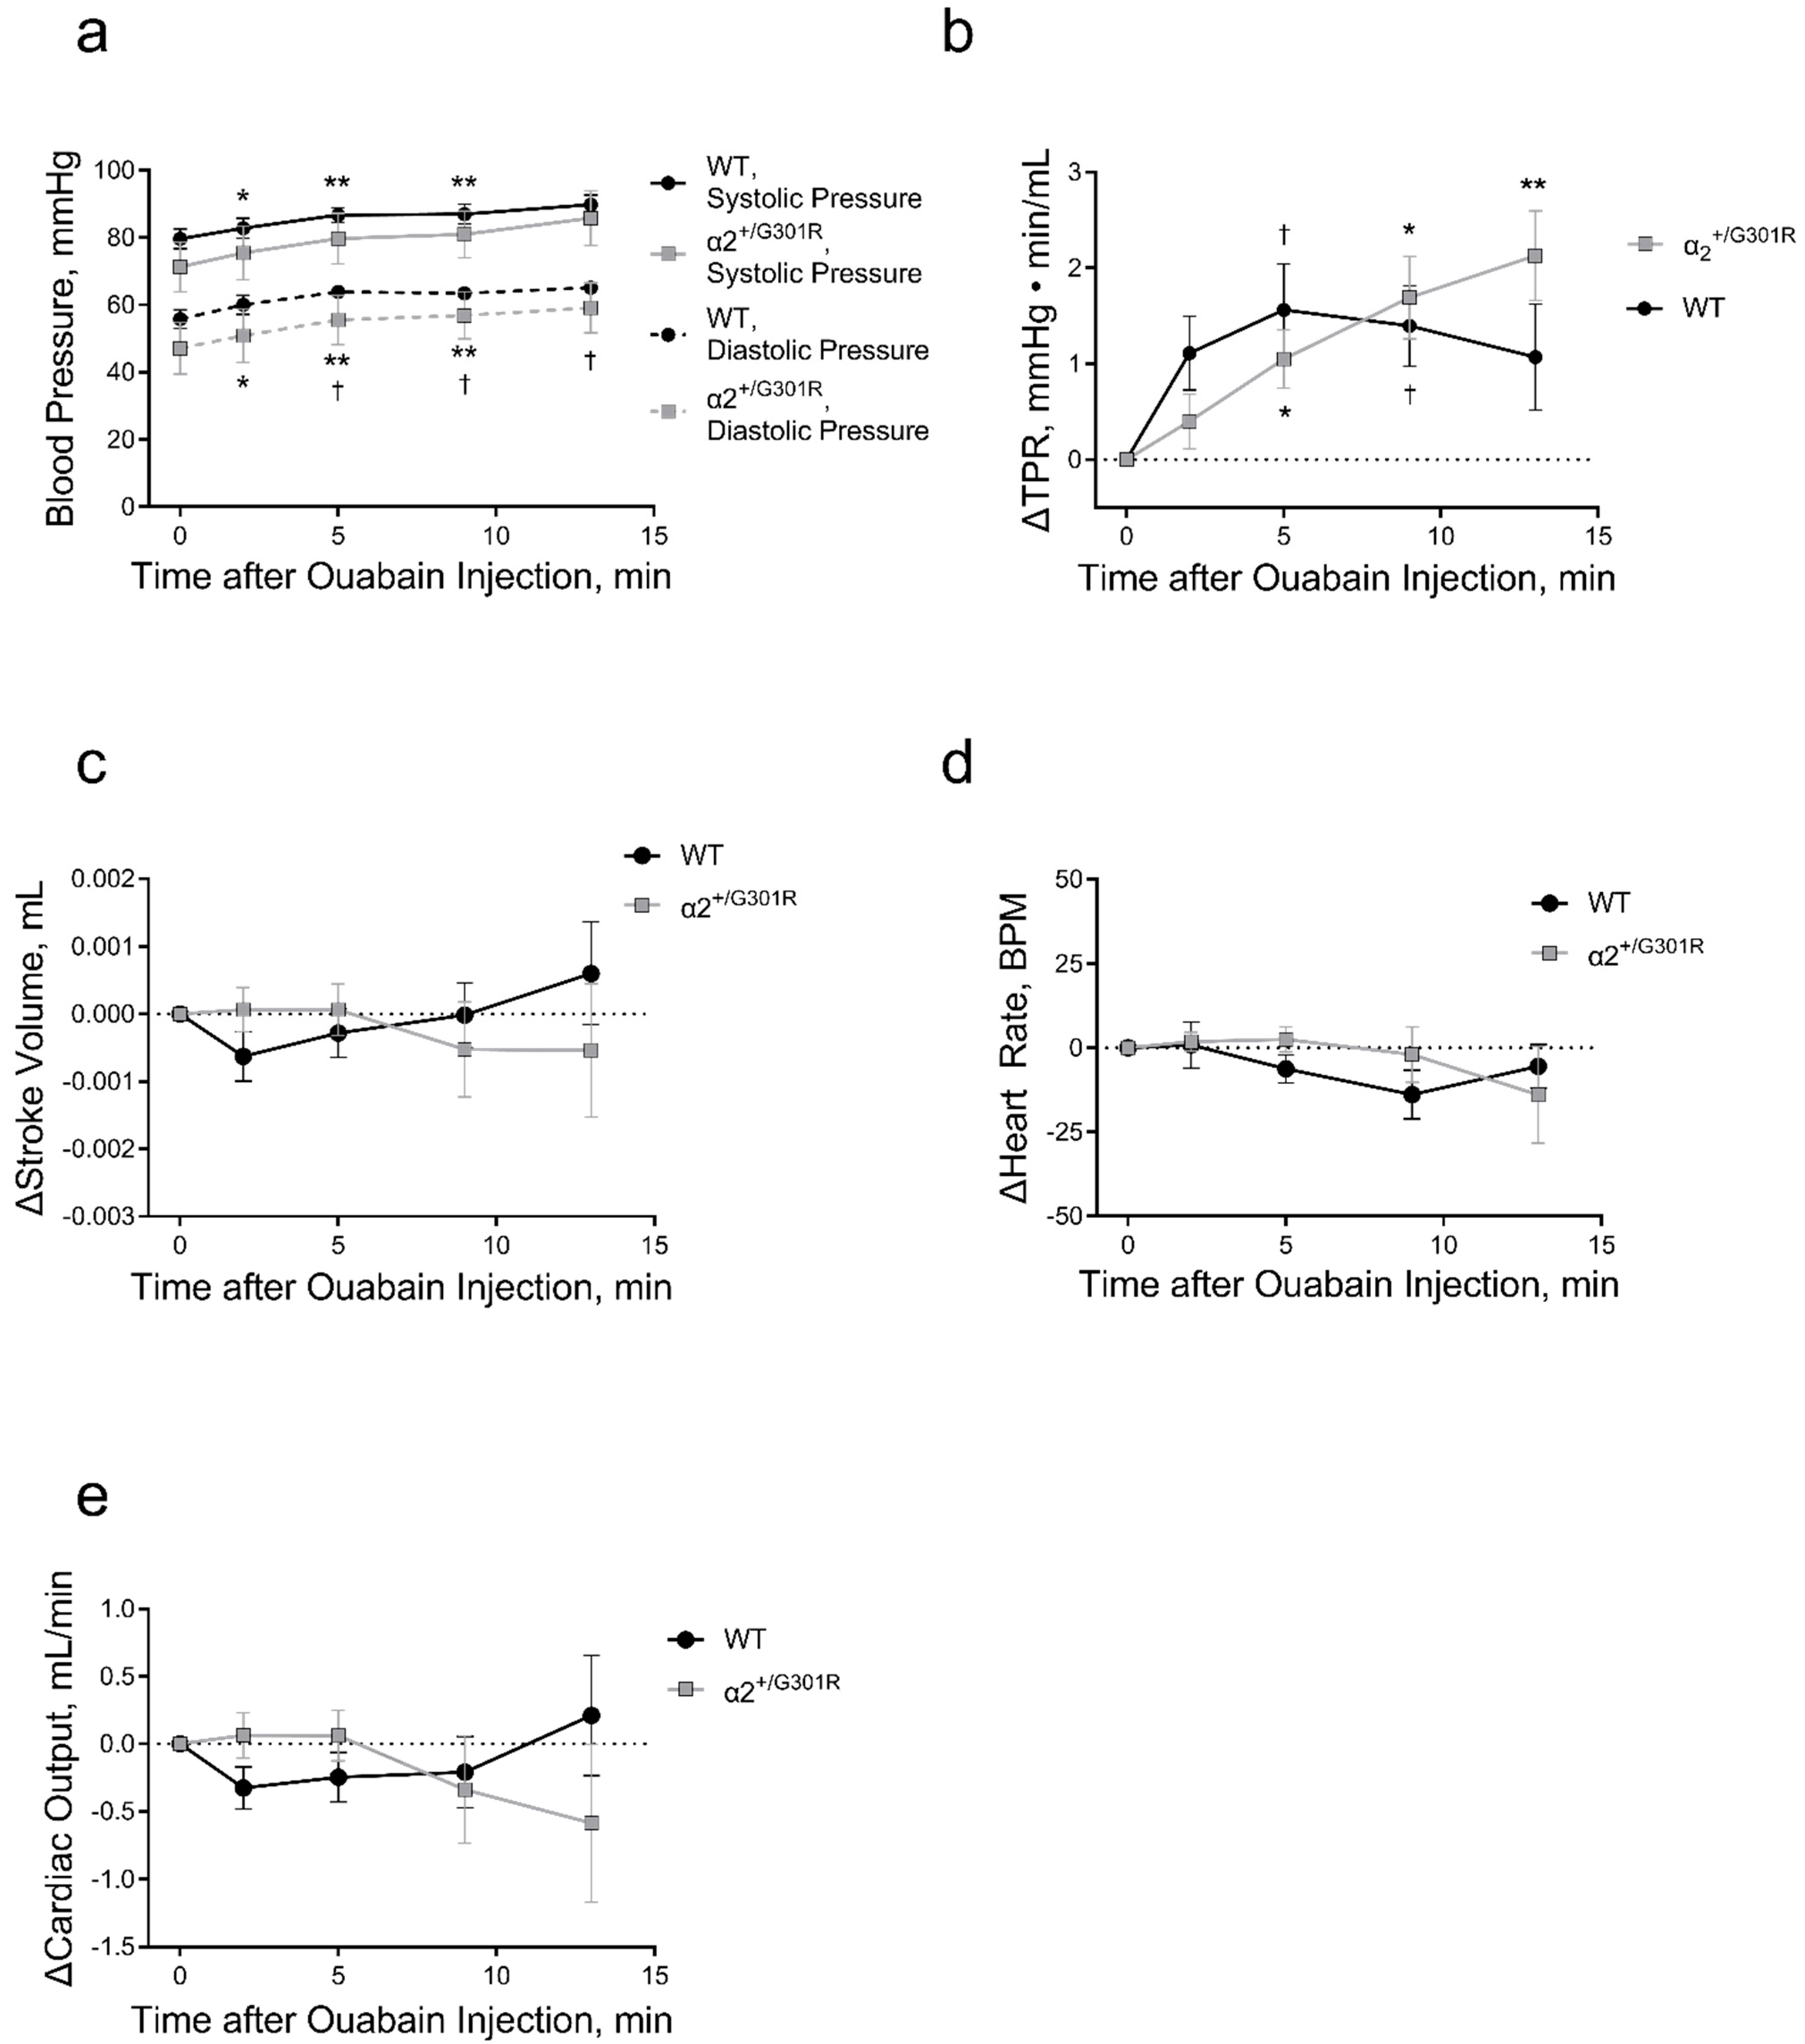
3.3. Ouabain Elevated Peripheral Vascular Resistance and Blood Pressure While Cardiac Variables Were Unchanged in Both WT and α2+/G301R Mice

In general, ouabain administration increased systolic blood pressure (p = 0.0193); however, following post-hoc analysis, the changes in WT systolic pressure did not achieve statistical significance (p = 0.0993, p = 0.0901, p = 0.0556, and p = 0.0944 for 2, 5, 9, and 13 min, respectively, after ouabain administration compared to the time prior injection; Figure 4a). The diastolic blood pressure was increased in both genotypes (p = 0.0100; Figure 4a). The increase in blood pressure was associated with ouabain-induced elevation in total peripheral resistance (p < 0.0001). The dynamic of these changes was steeper in α2+/G301R mice than in WT mice (p = 0.0340; Figure 4b). Ouabain administration did not modify stroke volume, heart rate, or cardiac output (Figure 4c–e).
Ouabain administration significantly increased the systolic time interval ratio of α2+/G301R mice only (p = 0.0004; Figure 5a). This was associated with ouabain-induced prolongation of the pre-ejection period (p = 0.0007) and shortening of the left ventricular ejection time (p = 0.0426; Figure 5b,c). Systolic time intervals of WT mice were unchanged. The systolic duration, arterial dP/dtmax, and arterial dP/dtmin were not affected by ouabain administration in both α2+/G301R and WT mice (Figure 5d–f).
Vehicle administration had no effect on blood pressure, total peripheral resistance, stroke volume, heart rate, nor cardiac output in both α2+/G301R and WT mice (Supplementary Figure S1). Similarly, no effect of vehicle administration was observed in systolic time intervals nor in systolic duration, arterial dP/dtmax, and arterial dP/dtmin (Supplementary Figure S2).

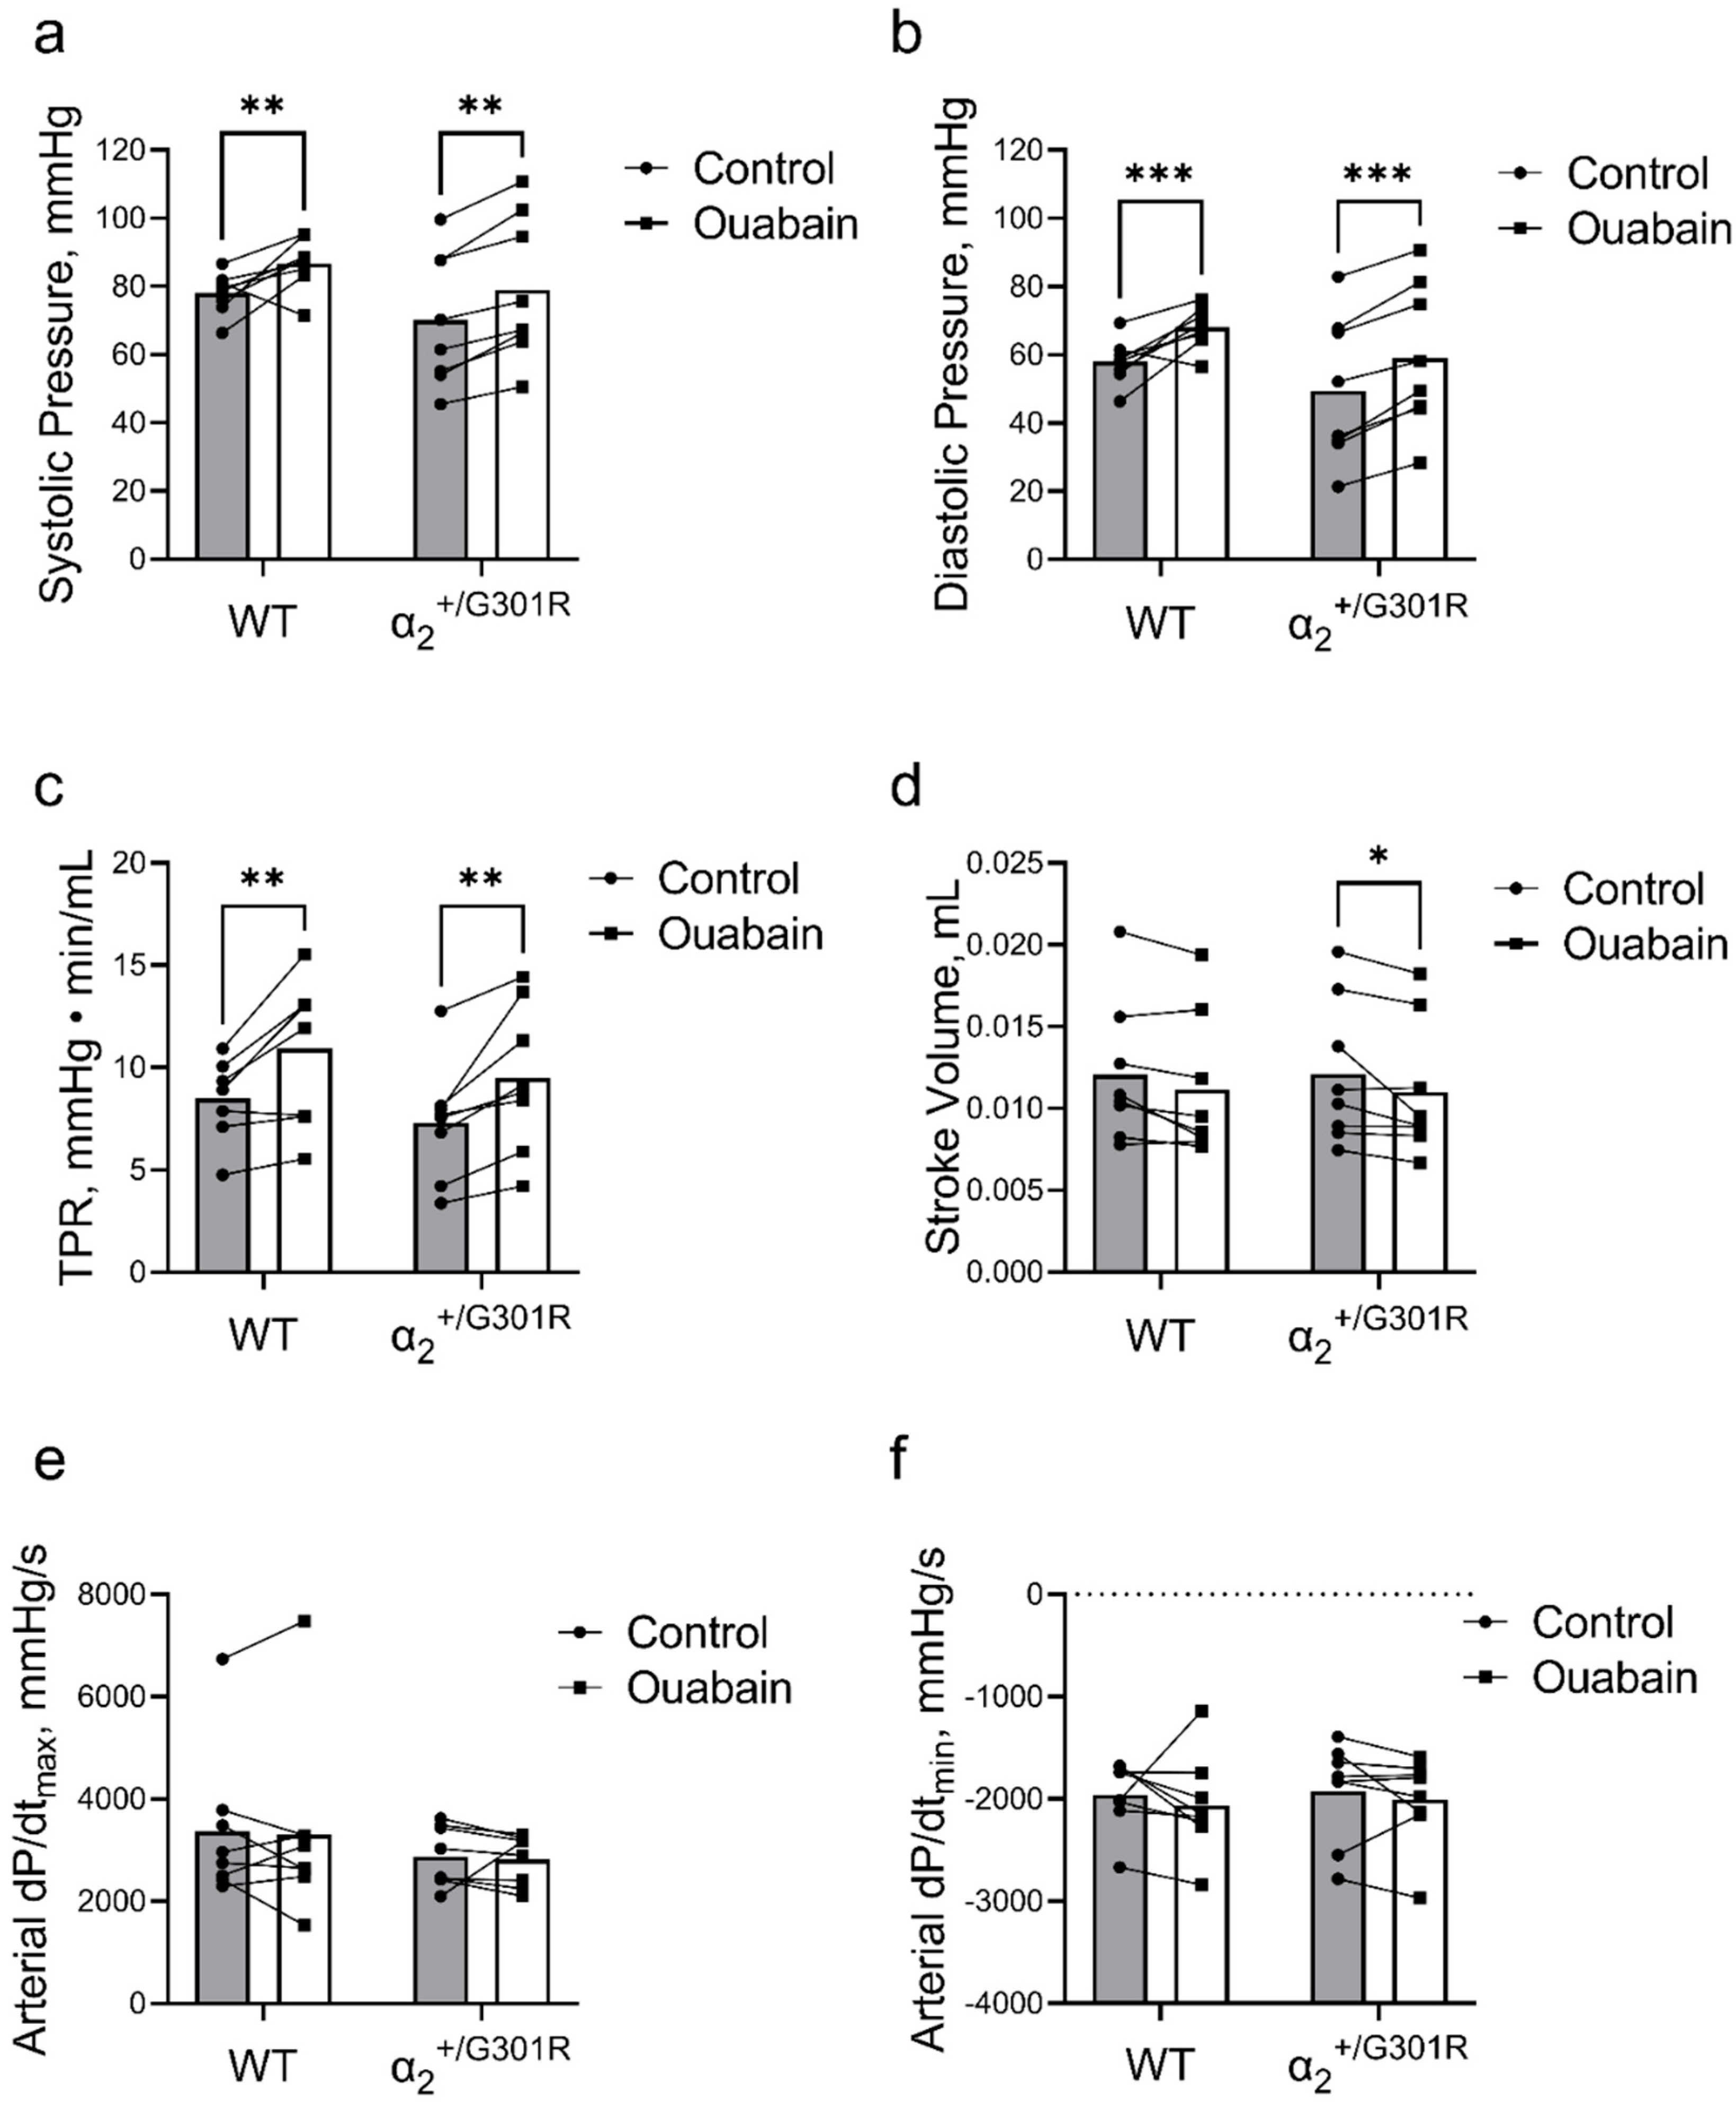
3.4. When Heart Rate Was Controlled, Ouabain Administration Reduced Stroke Volume in α2+/G301R Mice

When heart rate was kept at 11.3 Hz (678 BPM) by atrial pacing, ouabain administration significantly increased both systolic (p = 0.0002) and diastolic blood pressure (p < 0.0001) in both α2+/G301R and WT mice (Figure 6a,b). This increase in blood pressure was accompanied with an ouabain-induced augmentation of total peripheral resistance in both genotypes (p = 0.0001; Figure 6c).
A general effect of ouabain on stroke volume was detected during atrial pacing (p = 0.0054); however, following post-hoc analysis, ouabain administration reduced stroke volume during atrial pacing at 11.3 Hz in α2+/G301R mice (p = 0.0473), whereas the change in stroke volume in WT did not achieve statistical significance (p = 0.1062; Figure 6d).
Arterial dP/dtmax and arterial dP/dtmin were unchanged after ouabain administration during atrial pacing in both groups (Figure 6e,f).
Blood pressure, total peripheral resistance, and stroke volume were unaffected by vehicle injection in both groups during atrial pacing at 11.3 Hz (Supplementary Figure S3a–d). However, when the hearts were paced at 11.3 Hz, arterial dP/dtmax was greater in WT mice compared to α2+/G301R mice after vehicle administration (p = 0.0192; Supplementary Figure S3e). There was no change to arterial dP/dtmin (Supplementary Figure S3f).

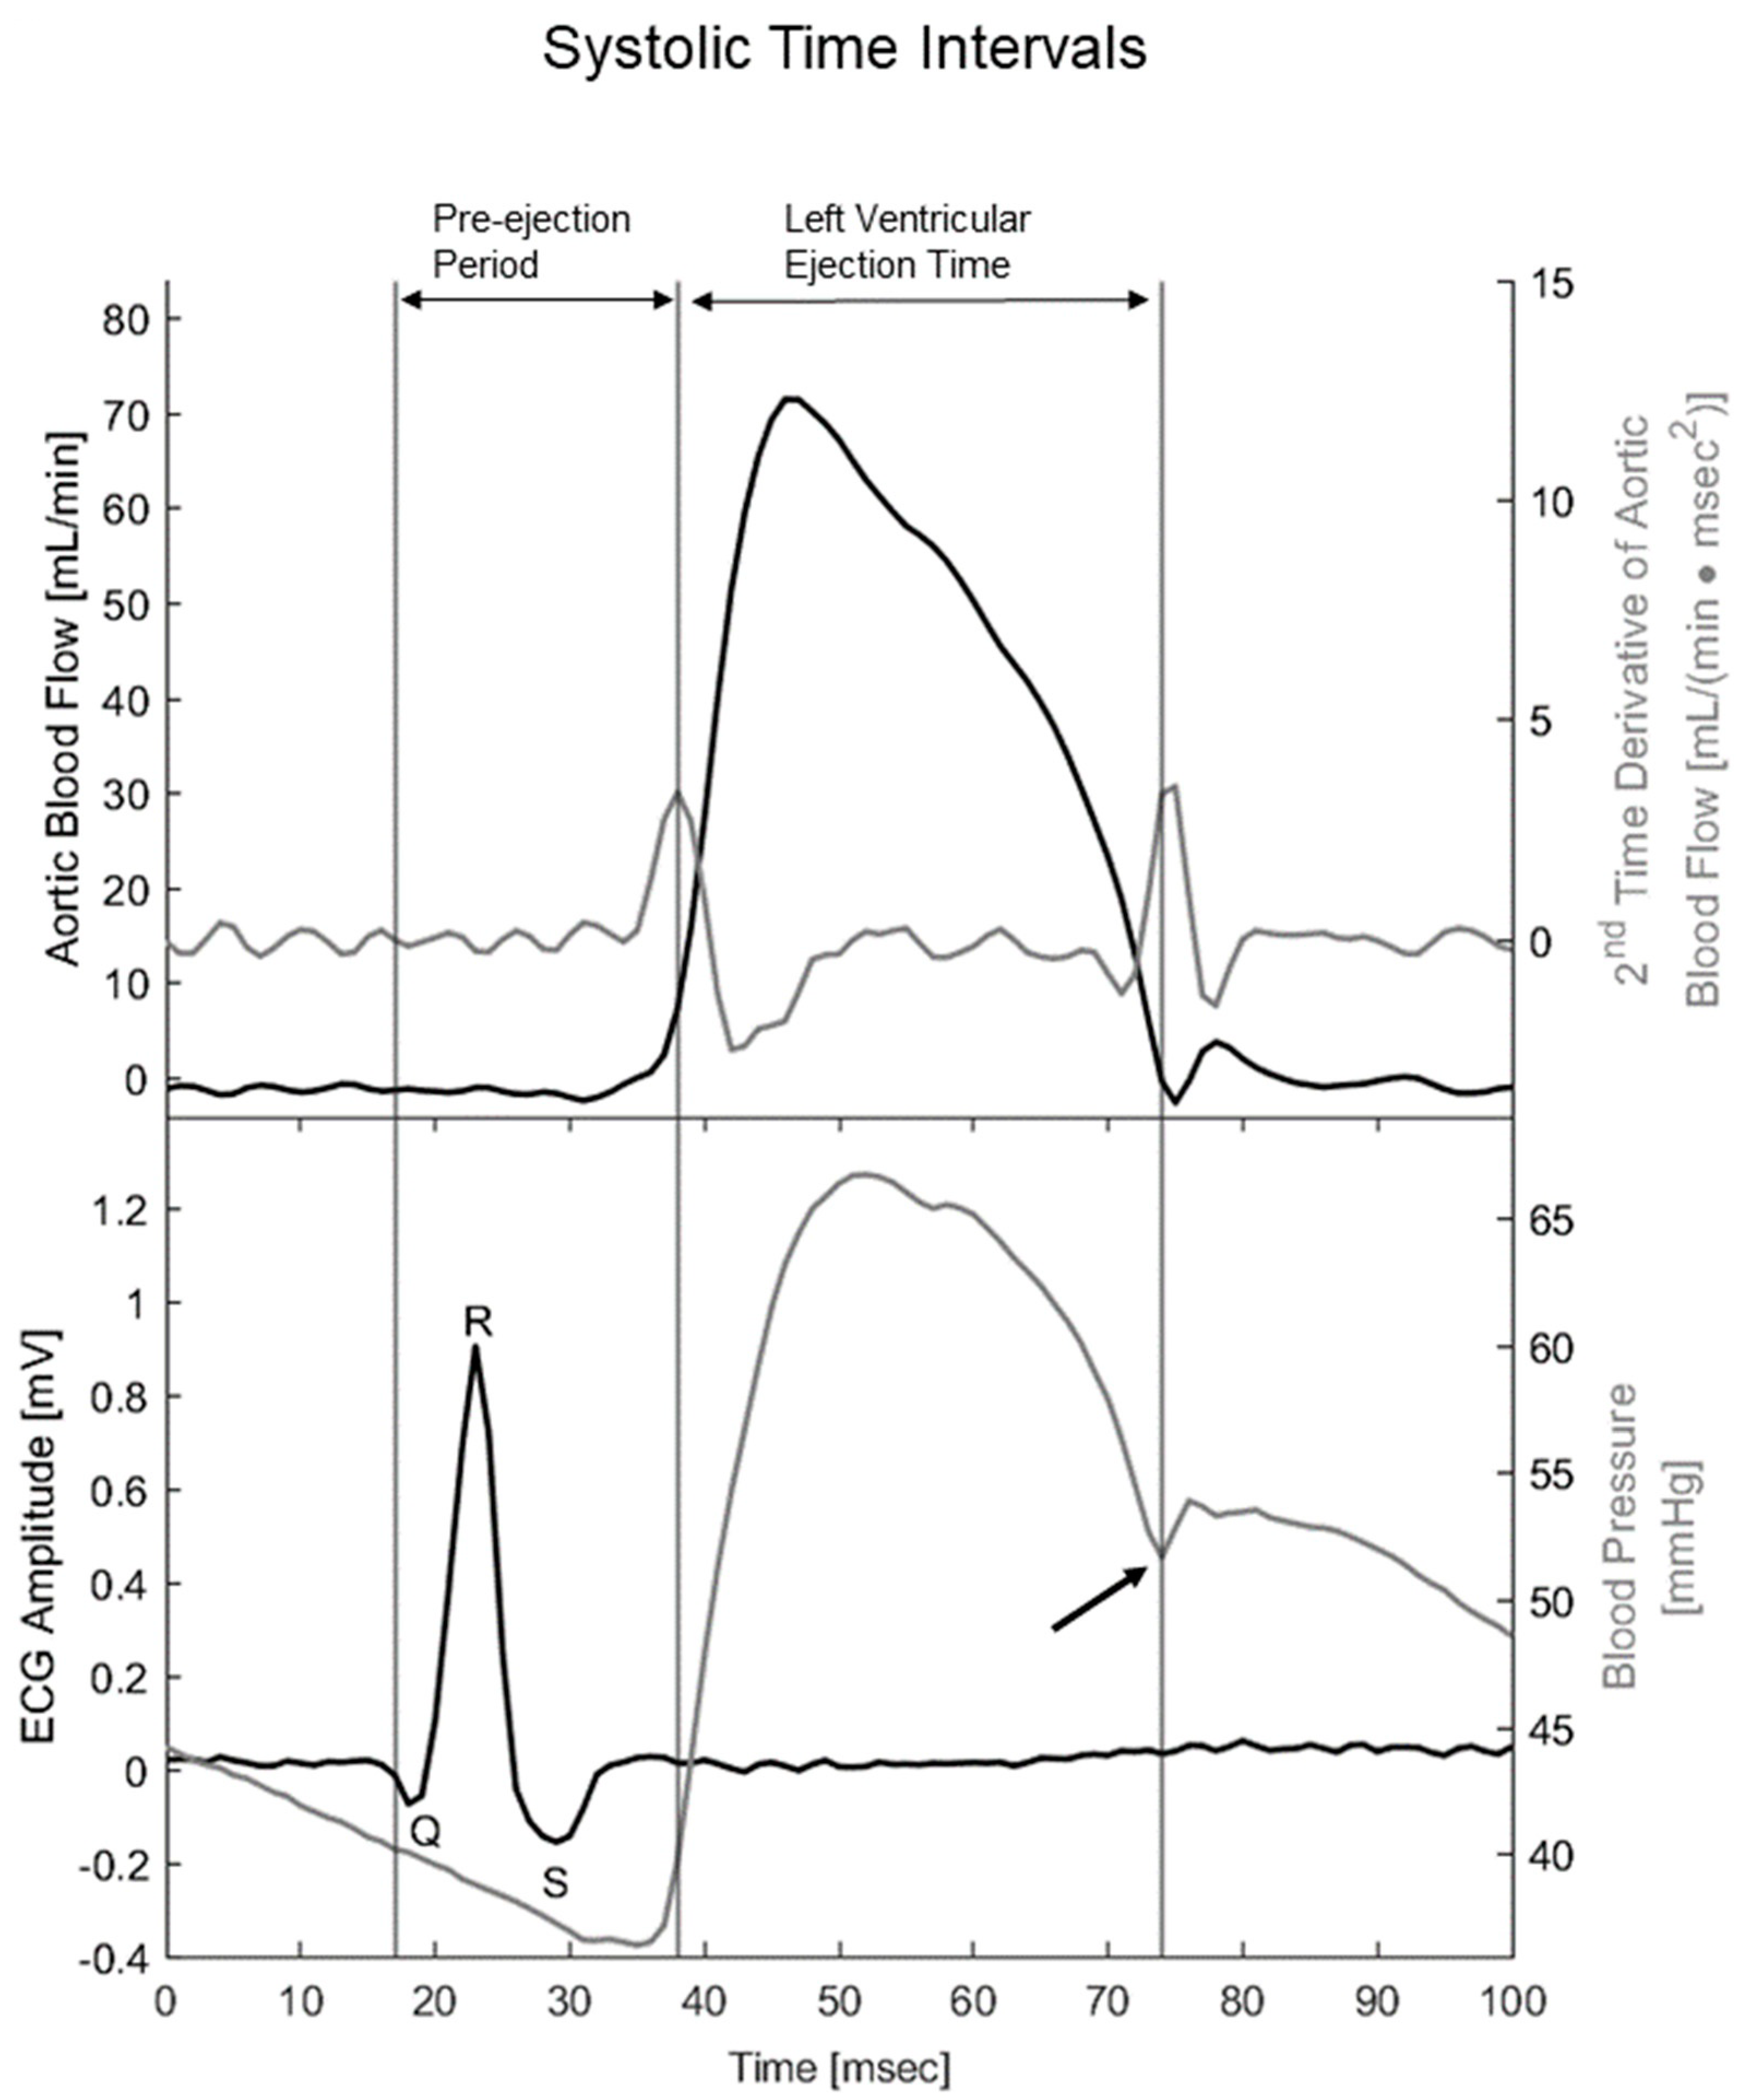
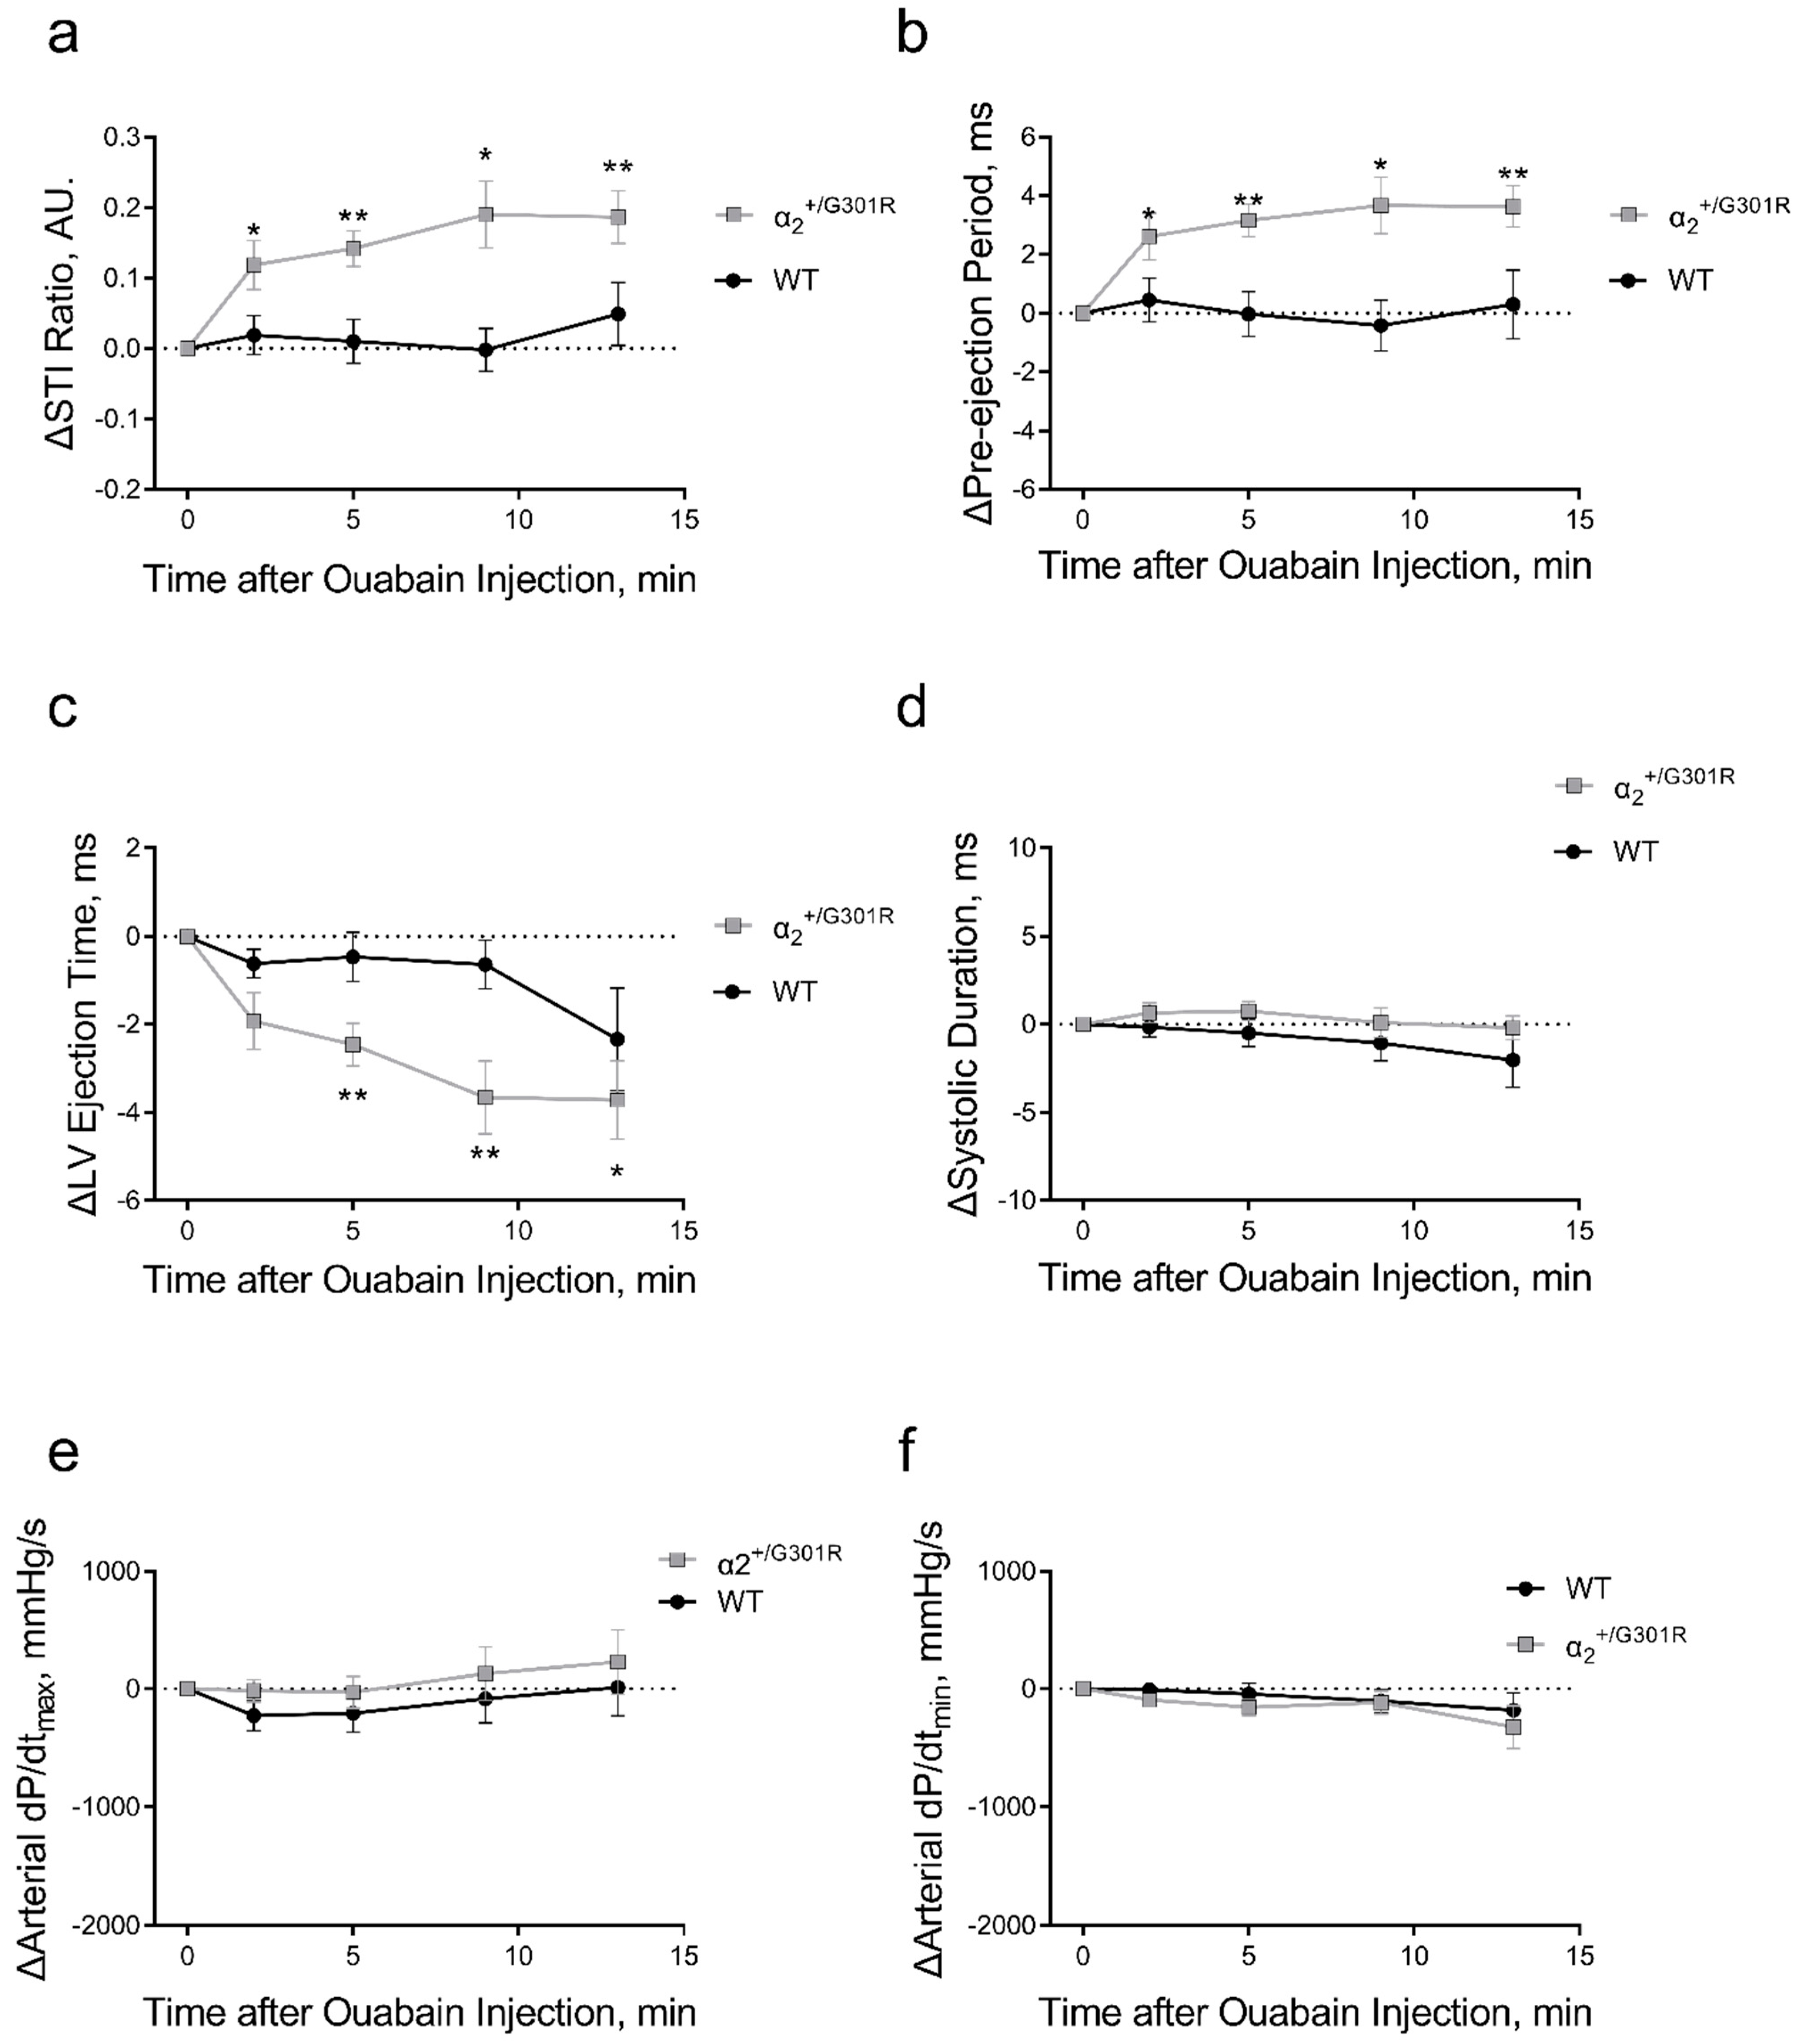
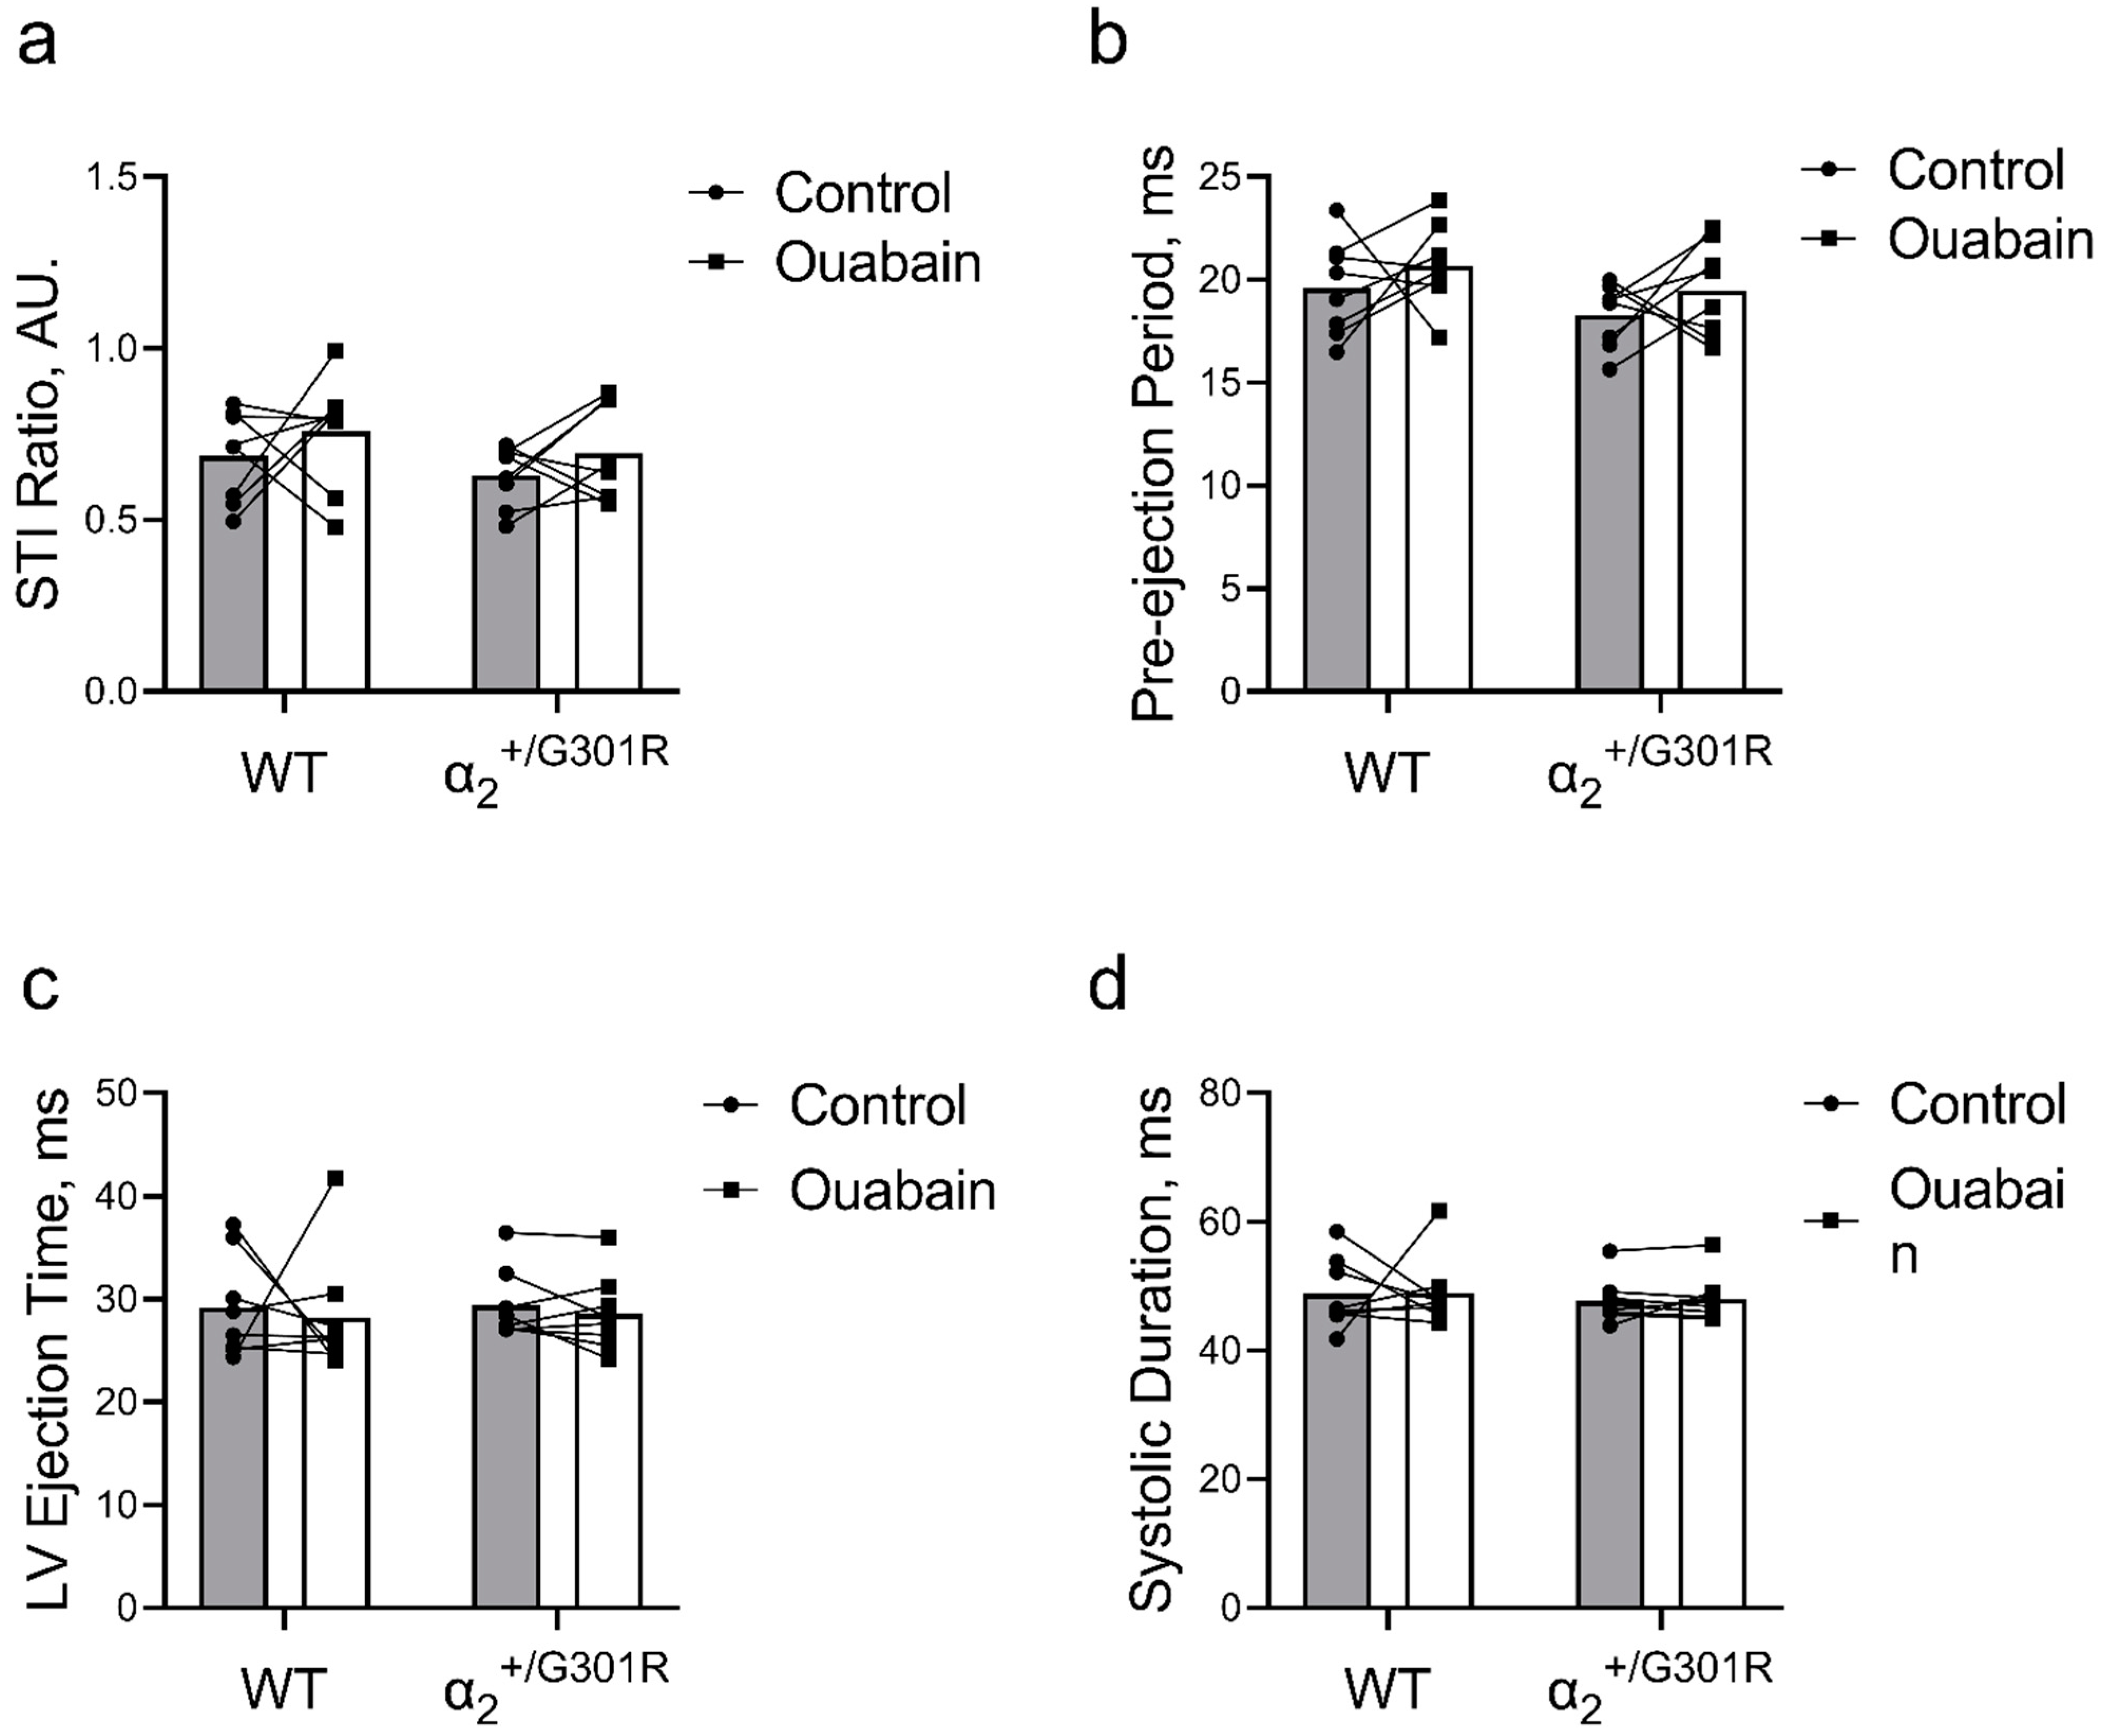
3.5. When Heart Rate Was Controlled at 11.3 Hz, Ouabain-Induced Changes to Systolic Time Intervals in α2+/G301R Mice Were Abolished

When the hearts were paced at 11.3 Hz, variables related to systolic time intervals including the systolic time interval ratio, pre-ejection period, left ventricular ejection time, and systolic duration were similar between genotypes before and after ouabain administration (Figure 7). Similarly, the systolic time interval ratio, pre-ejection period, left ventricular ejection time, and systolic duration were not affected by vehicle injection when the hearts were paced at 11.3 Hz (Supplementary Figure S4).

4. Discussion

We aimed to characterize the Na+,K+-ATPase α2-isoform-specific contribution to cardiovascular function and, thus, investigated the comprehensive cardiovascular responses to ouabain of α2+/G301R and WT mice. Additionally, we paced the hearts to discern potential rate-dependent changes to cardiac function associated to ouabain or the phenotype of the α2+/G301R mouse model [48,49].
We hypothesized that the cardiovascular response to ouabain in α2+/G301R mice was augmented due to their reduced expression of the Na+,K+-ATPase α2-isoform compared to WT. Pharmacologically, at a specific drug concentration, the effect of a drug may be described by how many receptors it binds relative to the total amount of receptors expressed on the cell membrane, i.e., fractional occupancy [50]. Mathematically, fractional occupancy equals the occupied binding sites divided by the number of total binding sites [50]. Thus, the fewer α2-isoforms present in the cell membrane of α2+/G301R mice results in higher fractional occupancy and effect of a specific concentration of ouabain [9,11].
Accordingly, we found that the peripheral vascular effect of ouabain in vivo was augmented in the α2+/G301R mice compared to WT. This was associated with ouabain-induced changes in the temporal development of the systole in α2+/G301R mice. However, stroke volume remained unchanged during sinus rhythm in α2+/G301R mice despite an increased total peripheral resistance and change in systolic function. Even so, stroke volume was reduced in α2+/G301R mice during atrial pacing after ouabain administration. Thus, in this study we demonstrated an association between the ouabain-sensitive vascular phenotype in α2+/G301R mice with reduced cardiac efficiency.
Different ouabain-sensitivity of the α1- and α2-isoforms of Na+,K+-ATPase in rodents [8] allows isoform-specific differentiation of their functions in the cardiovascular system [51]. The isoform-specific half-maximal inhibitory concentrations, i.e., IC50, of ouabain were reported to be 48,000 nM and 58 nM for the α1- and α2-isoforms in rats, respectively [28]. In our study, the basal plasma level of endogenous ouabain and its concentration after injection of exogenous ouabain were similar between α2+/G301R and WT mice. We estimated that the basal concentration of ouabain in mouse plasma was approximately 300 pM. This concentration is in close agreement with previously reported concentrations for rodents and humans [52,53]. Furthermore, in this study, injection of exogenous ouabain elevated the plasma ouabain concentration to approximately 100 nM, i.e., a concentration that affects the α2-isoform and not the α1-isoform function. In our preliminary study, higher concentrations of ouabain were lethal presumably due to complete inhibition of the Na+,K+-ATPase emphasizing the vital importance of the Na+,K+-ATPase function for living cells. Furthermore, the Na+,K+-ATPase α3-isoform is mostly allocated to neuronal tissues [2], and the blood–brain barrier is not permeable to circulating ouabain [54]. Therefore, we anticipated that the cardiovascular α2-isoform was the primary target of the pharmacological intervention in this study. However, we cannot exclude that some of the effects of ouabain administration were mediated via the autonomic nervous system [55].
In our earlier study, we found that during nighttime, i.e., the active period of mouse circadian rhythm, aged (>8 months old) α2+/G301R mice exhibited reduced blood pressure compared to WT [11]. However, blood pressure during daytime, i.e., the inactive period of mouse circadian rhythm, was the same between the two genotypes [11]. Accordingly, no difference in blood pressure between genotypes was seen in this study in anesthetized mice under baseline conditions.
In accordance with previous reports on rodents, we found that ouabain administration increased blood pressure [29,56]. The ouabain-induced blood pressure elevation has previously been ascribed to the inotropic effect of ouabain [31,32]. Paradoxically, ouabain was also reported to potentiate not only vasoconstriction but also vasodilation [9,57,58,59]. In our study, ouabain-induced elevation of blood pressure was associated with augmentation of total peripheral resistance, which was most pronounced in α2+/G301R mice. The major contribution of total peripheral resistance in this ouabain-induced blood pressure elevation was further supported by unaltered cardiac functions in both groups after ouabain administration. In line with previous ex vivo reports [9,57,60,61], our results suggest a primary pro-contractile action of ouabain on the vasculature at concentrations specific for α2-isoform inhibition. We propose that reduction in the vascular expression of the α2-isoform underlies the augmented ouabain-induced increase in total peripheral resistance in α2+/G301R mice. Accordingly, a similar concentration of circulating ouabain has a more efficient inhibitory action in α2+/G301R mice than in WT controls. Hence, our findings add to the perception of the importance of the α2-isoform function for vascular tone and blood pressure in vivo in rodents as previously proposed [62,63].
Systolic time intervals entail information about the overall external myocardial efficiency [43]. The systolic time interval ratio increased only in α2+/G301R mice after ouabain administration suggesting a decrease in myocardial efficiency. This increase in the systolic time interval ratio was a result of both a significant extension of the pre-ejection period and a slight shortening of the left ventricular ejection time. We suggest that the prolonged pre-ejection period may be a result of prolongation of the isovolumetric contraction phase of the heart as a result of the augmented ouabain-induced increase in total peripheral resistance in α2+/G301R mice [44]. However, we cannot exclude that ouabain induced changes in the electrical properties of the heart affecting the pre-ejection period [64], albeit heart rate was unchanged.
The inotropic effect of ouabain is well characterized, and it is described as a cardiac calcitrope, i.e., the inotropic effect is mediated by an increase in intracellular Ca2+ [27,65]. In our study, we assessed the arterial dP/dtmax as a proxy for cardiac contractility [41]. However, unlike the dP/dtmax measured directly in the left ventricle [66], the arterial dP/dtmax also depends on arterial system properties, e.g., the stiffness of the arterial wall [41]. In the current study, the arterial dP/dtmax was not affected following ouabain or vehicle administration during sinus rhythm. Considering that stroke volume and cardiac output did not change despite augmentation of total peripheral resistance in both WT and α2+/G301R mice, the presence of an inotropic effect of ouabain in our study during sinus rhythm is plausible. Additionally, shortening of left ventricular ejection time has been associated with an increase in intracellular Ca2+ mediated by cardiac calcitropes [43]. As left ventricular ejection time was only shortened in α2+/G301R mice, our finding may suggest a stronger cardiac effect of ouabain in α2+/G301R mice during sinus rhythm. In accordance, stroke volume and cardiac output were maintained in α2+/G301R mice despite greater augmentation of total peripheral resistance during sinus rhythm.
During atrial pacing, the arterial dP/dtmax was lower in α2+/G301R mice compared to WT after vehicle administration indicating a deleterious effect of time on the contractility in α2+/G301R mice. This was rescued by ouabain administration. However, the ouabain-induced recovery of arterial dP/dtmax in α2+/G301R mice compared to WT may also be a consequence of the augmented total peripheral resistance in α2+/G301R mice. In addition, the changes to systolic time intervals in α2+/G301R mice were not seen during atrial pacing. The systolic time intervals have been described to be influenced by heart rate, especially, in conjunction with hemodynamic changes [67,68,69]. Thus, in the current study, we suggest that the high heart rates (678 BPM) during atrial pacing compared to the heart rates during sinus rhythm (approximately 532 BPM) limits deviation of the systolic time intervals. This was further associated with reduced stroke volume in α2+/G301R mice. Thus, our findings may also suggest rate-dependent cardiac effects of ouabain.
Our study proposes a detrimental link between the vascular phenotype in α2+/G301R mice [9,10] and their cardiac function [11]. We suggest that the changes to cardiac function in α2+/G301R mice described in this study reflect the reduced ventricular function previously reported for aged α2+/G301R mice [11]. Furthermore, we suggest that the changed vascular reactivity, possibly in combination with intrinsic cardiac changes [11], underlies the pathological cardiovascular changes seen in α2+/G301R mice. This is based on the following observations from this and previous studies [9,10,11]: (i) the changed cardiac phenotype in α2+/G301R mice develops over time and is only seen in aged mice, (ii) the vascular phenotype in α2+/G301R mice is not unique to a specific age, and (iii) the presence of reduced cardiac efficiency in α2+/G301R mice when challenged with increments in afterload demonstrated in this study. However, whether parts of the cardiac changes are pre-defined or solely a product of the vascular abnormalities remain to be clarified. Nevertheless, all these aspects of cardiovascular dysfunction in α2+/G301R mice may in concert facilitate a milieu that leads to cardiac pathology over time [70]. Often, this type of cardiac disease progression is slow and silent, and it may resemble a heart failure phenotype with no apparent clinical symptoms during rest and sinus rhythm [71]. Similarly, the cardiac phenotype in α2+/G301R mice was only revealed during atrial pacing or after ouabain administration, and there was no apparent phenotype during sinus rhythm and at baseline in this study.
We primarily identified the changed cardiovascular phenotype in α2+/G301R mice. Intriguingly, the α2+/G301R mouse is also an animal model for migraine [21]. Migraine has been described as a significant risk factor in the development of cardiovascular morbidity [72,73]. However, the underlying mechanism remains unclear. Studies have suggested that migraine may be considered a “channelopathy”, specifically, that defects in ion transporters are the primary culprits in migraine pathology [74,75]. Furthermore, studies have argued that migraine should be considered a systemic disease rather than an isolated neurovascular condition [76,77]. Accordingly, our data suggest that global reduction of cardiovascular Na+,K+-ATPase α2-isoform associated with the migraine-associated mutation changes the vascular phenotype with consequences for cardiac function in α2+/G301R mice. This notion warrants investigation of the cardiovascular phenotype of FHM2 migraineurs, which may further elucidate the molecular link between cardiovascular morbidity and migraine.

5. Conclusions

Our results indicate that both the cardiac and vascular phenotypes are affected in α2+/G301R mice in vivo. Our findings indicate less resilience of α2+/G301R hearts to the Na+,K+-ATPase α2-isoform inhibition with ouabain. Specifically, α2+/G301R mice showed an augmented increase in total peripheral resistance associated with decreased cardiac efficiency in the presence of ouabain. We suggest that the hypercontractile vascular phenotype of the α2+/G301R mice may lead to detrimental cardiac function over time.

Supplementary Materials

The following supporting information can be downloaded at: https://www.mdpi.com/article/10.3390/biomedicines11020344/s1.

Author Contributions

Conceptualization, R.R., T.M.P., M.B.T., H.E.B. and V.V.M.; methodology, R.R., T.M.P., H.O.G., L.F.O. and V.V.M.; software, H.O.G.; validation, R.R., T.M.P., H.O.G. and L.F.O.; formal analysis, R.R., T.M.P., H.O.G., L.F.O. and V.V.M.; investigation, R.R. and L.F.O.; resources, V.V.M.; data curation, R.R. and V.V.M.; writing—original draft preparation, R.R. and V.V.M.; writing—review and editing, R.R., T.M.P., H.O.G., L.F.O., M.B.T., H.E.B. and V.V.M.; visualization, R.R. and H.O.G.; supervision, T.M.P., M.B.T., H.E.B. and V.V.M. project administration, V.V.M.; funding acquisition, V.V.M. All authors have read and agreed to the published version of the manuscript.

Funding

This research was funded by the Novo Nordisk Foundation, grant number NNF18OC0052021 and the Independent Research Fund Denmark, grant number 8020-00084B.

Institutional Review Board Statement

The animal study protocol was approved by the Animal Experiments Inspectorate of the Danish Ministry of Environment and Food (protocol code 2016-15-0201-00982, approved 23 June 2016; and protocol code 2021-15-0201-00986, approved 5 April 2022).

Informed Consent Statement

Not applicable.

Data Availability Statement

The datasets generated and analyzed during the current study are available from the corresponding author on reasonable request.

Acknowledgments

We thank Jane Holbæk Rønn and Viola Mose Larsen for the excellent technical assistance.

Conflicts of Interest

The authors declare no conflict of interest.

References

  1. Skou, J.C. The influence of some cations on an adenosine triphosphatase from peripheral nerves. Biochim. Biophys. Acta Bioenerg. 1957, 23, 394–401. [Google Scholar] [CrossRef] [PubMed]
  2. Clausen, M.V.; Hilbers, F.; Poulsen, H. The Structure and Function of the Na,K-ATPase Isoforms in Health and Disease. Front. Physiol. 2017, 8. [Google Scholar] [CrossRef] [Green Version]
  3. Friedrich, T.; Tavraz, N.N.; Junghans, C. ATP1A2 Mutations in Migraine: Seeing through the Facets of an Ion Pump onto the Neurobiology of Disease. Front. Physiol. 2016, 7. [Google Scholar] [CrossRef] [Green Version]
  4. Li, Z.; Langhans, S.A. Transcriptional regulators of Na,K-ATPase subunits. Front. Cell Dev. Biol. 2015, 3. [Google Scholar] [CrossRef] [PubMed] [Green Version]
  5. Peng, M.; Huang, L.; Xie, Z.; Huang, W.H.; Askari, A. Partial inhibition of Na+/K+-ATPase by ouabain induces the Ca2+-dependent expressions of early-response genes in cardiac myocytes. J. Biol. Chem. 1996, 271, 10372–10378. [Google Scholar] [CrossRef] [PubMed] [Green Version]
  6. Pratt, R.D.; Brickman, C.R.; Cottrill, C.L.; Shapiro, J.I.; Liu, J. The Na/K-ATPase Signaling: From Specific Ligands to General Reactive Oxygen Species. Int. J. Mol. Sci. 2018, 19, 2600. [Google Scholar] [CrossRef] [Green Version]
  7. Mobasheri, A.; Avila, J.; Cózar-Castellano, I.; Brownleader, M.D.; Trevan, M.; Francis, M.J.; Lamb, J.F.; Martín-Vasallo, P. Na+, K+-ATPase isozyme diversity; comparative biochemistry and physiological implications of novel functional interactions. Biosci. Rep. 2000, 20, 51–91. [Google Scholar] [CrossRef]
  8. Blanco, G.; Mercer, R.W. Isozymes of the Na-K-ATPase: Heterogeneity in structure, diversity in function. Am. J. Physiol. Renal Physiol. 1998, 275, F633–F650. [Google Scholar] [CrossRef]
  9. Staehr, C.; Hangaard, L.; Bouzinova, E.V.; Kim, S.; Rajanathan, R.; Boegh Jessen, P.; Luque, N.; Xie, Z.; Lykke-Hartmann, K.; Sandow, S.L.; et al. Smooth muscle Ca2+ sensitization causes hypercontractility of middle cerebral arteries in mice bearing the familial hemiplegic migraine type 2 associated mutation. J. Cereb. Blood Flow Metab. 2019, 39, 1570–1587. [Google Scholar] [CrossRef]
  10. Staehr, C.; Rajanathan, R.; Postnov, D.D.; Hangaard, L.; Bouzinova, E.V.; Lykke-Hartmann, K.; Bach, F.W.; Sandow, S.L.; Aalkjaer, C.; Matchkov, V.V. Abnormal neurovascular coupling as a cause of excess cerebral vasodilation in familial migraine. Cardiovasc. Res. 2019, 116, 2009–2020. [Google Scholar] [CrossRef]
  11. Staehr, C.; Rohde, P.D.; Krarup, N.T.; Ringgaard, S.; Laustsen, C.; Johnsen, J.; Nielsen, R.; Beck, H.C.; Morth, J.P.; Lykke-Hartmann, K.; et al. Migraine Associated Mutation in the Na,K-ATPase Leads to Disturbances in Cardiac Metabolism and Reduced Cardiac Function. J. Am. Heart Assoc. 2022, 11, e021814. [Google Scholar] [CrossRef] [PubMed]
  12. Bartlett, D.E.; Miller, R.B.; Thiesfeldt, S.; Lakhani, H.V.; Shapiro, J.I.; Sodhi, K. The Role of Na/K-ATPase Signaling in Oxidative Stress Related to Aging: Implications in Obesity and Cardiovascular Disease. Int. J. Mol. Sci. 2018, 19, 2139. [Google Scholar] [CrossRef] [Green Version]
  13. Rindler, T.N.; Dostanic, I.; Lasko, V.M.; Nieman, M.L.; Neumann, J.C.; Lorenz, J.N.; Lingrel, J.B. Knockout of the Na,K-ATPase α2-isoform in the cardiovascular system does not alter basal blood pressure but prevents ACTH-induced hypertension. Am. J. Physiol.-Heart Circ. Physiol. 2011, 301, H1396–H1404. [Google Scholar] [CrossRef] [Green Version]
  14. Rindler, T.N.; Lasko, V.M.; Nieman, M.L.; Okada, M.; Lorenz, J.N.; Lingrel, J.B. Knockout of the Na,K-ATPase α2-isoform in cardiac myocytes delays pressure overload-induced cardiac dysfunction. Am. J. Physiol.-Heart Circ. Physiol. 2013, 304, H1147–H1158. [Google Scholar] [CrossRef] [Green Version]
  15. Correll, R.N.; Eder, P.; Burr, A.R.; Despa, S.; Davis, J.; Bers, D.M.; Molkentin, J.D. Overexpression of the Na+/K+ ATPase α2 but not α1 isoform attenuates pathological cardiac hypertrophy and remodeling. Circ. Res. 2014, 114, 249–256. [Google Scholar] [CrossRef] [Green Version]
  16. Shattock, M.J.; Ottolia, M.; Bers, D.M.; Blaustein, M.P.; Boguslavskyi, A.; Bossuyt, J.; Bridge, J.H.B.; Chen-Izu, Y.; Clancy, C.E.; Edwards, A.; et al. Na+/Ca2+ exchange and Na+/K+-ATPase in the heart. Physiol. J. 2015, 593, 1361–1382. [Google Scholar] [CrossRef] [Green Version]
  17. Skogestad, J.; Aronsen, J.M. Regulation of Cardiac Contractility by the Alpha 2 Subunit of the Na+/K+-ATPase. Front. Physiol. 2022, 13. [Google Scholar] [CrossRef]
  18. Pritchard, T.J.; Bowman, P.S.; Jefferson, A.; Tosun, M.; Lynch, R.M.; Paul, R.J. Na+-K+-ATPase and Ca2+ clearance proteins in smooth muscle: A functional unit. Am. J. Physiol.-Heart Circ. Physiol. 2010, 299, H548–H556. [Google Scholar] [CrossRef] [Green Version]
  19. Pietrobon, D. Familial hemiplegic migraine. Neurotherapeutics 2007, 4, 274–284. [Google Scholar] [CrossRef]
  20. Spadaro, M.; Ursu, S.; Lehmann-Horn, F.; Liana, V.; Giovanni, A.; Paola, G.; Frontali, M.; Jurkat-Rott, K. A G301R Na+/K+-ATPase mutation causes familial hemiplegic migraine type 2 with cerebellar signs. Neurogenetics 2004, 5, 177–185. [Google Scholar] [CrossRef]
  21. Bøttger, P.; Glerup, S.; Gesslein, B.; Illarionova, N.B.; Isaksen, T.J.; Heuck, A.; Clausen, B.H.; Füchtbauer, E.M.; Gramsbergen, J.B.; Gunnarson, E.; et al. Glutamate-system defects behind psychiatric manifestations in a familial hemiplegic migraine type 2 disease-mutation mouse model. Sci. Rep. 2016, 6. [Google Scholar]
  22. James, P.F.; Grupp, I.L.; Grupp, G.; Woo, A.L.; Askew, G.R.; Croyle, M.L.; Walsh, R.A.; Lingrel, J.B. Identification of a specific role for the Na,K-ATPase alpha 2 isoform as a regulator of calcium in the heart. Mol. Cell. 1999, 3, 555–563. [Google Scholar] [CrossRef]
  23. Botelho, A.F.M.; Pierezan, F.; Soto-Blanco, B.; Melo, M.M. A review of cardiac glycosides: Structure, toxicokinetics, clinical signs, diagnosis and antineoplastic potential. Toxicon 2019, 158, 63–68. [Google Scholar] [CrossRef] [PubMed]
  24. Pulgar, V.M.; Jeffers, A.B.; Rashad, H.M.; Diz, D.I.; Aileru, A.A. Increased constrictor tone induced by ouabain treatment in rats. J. Cardiovasc. Pharmacol. 2013, 62, 174–183. [Google Scholar] [CrossRef] [Green Version]
  25. Li, M.; Martin, A.; Wen, C.; Turner, S.W.; Lewis, L.K.; Whitworth, J.A. Long-term ouabain administration does not alter blood pressure in conscious Sprague-Dawley rats. Clin. Exp. Pharmacol. Physiol. 1995, 22, 919–923. [Google Scholar] [CrossRef] [PubMed]
  26. Cargnelli, G.; Trevisi, L.; Debetto, P.; Luciani, S.; Bova, S. Effect of long-term ouabain treatment on contractile responses of rat aortae. J. Cardiovasc. Pharmacol. 2000, 35, 538–542. [Google Scholar] [CrossRef] [PubMed]
  27. Altamirano, J.; Li, Y.; DeSantiago, J.; Piacentino, V., 3rd; Houser, S.R.; Bers, D.M. The inotropic effect of cardioactive glycosides in ventricular myocytes requires Na+-Ca2+ exchanger function. J. Physiol. 2006, 575, 845–854. [Google Scholar] [CrossRef]
  28. Obrien, W.J.; Lingrel, J.B.; Wallick, E.T. Ouabain Binding Kinetics of the Rat Alpha Two and Alpha Three Isoforms of the Sodium-Potassium Adenosine Triphosphate. Arch. Biochem. 1994, 310, 32–39. [Google Scholar] [CrossRef]
  29. Yuan, C.M.; Manunta, P.; Hamlyn, J.M.; Chen, S.; Bohen, E.; Yeun, J.; Haddy, F.J.; Pamnani, M.B. Long-term ouabain administration produces hypertension in rats. Hypertension. 1993, 22, 178–187. [Google Scholar] [CrossRef] [Green Version]
  30. Xavier, F.E.; Rossoni, L.V.; Alonso, M.J.; Balfagón, G.; Vassallo, D.V.; Salaices, M. Ouabain-induced hypertension alters the participation of endothelial factors in α-adrenergic responses differently in rat resistance and conductance mesenteric arteries. Br. J. Pharmacol. 2004, 143, 215–225. [Google Scholar] [CrossRef] [Green Version]
  31. Shimoni, Y.; Gotsman, M.; Deutsch, J.; Kachalsky, S.; Lichtstein, D. Endogenous ouabain-like compound increases heart muscle contractility. Nature 1984, 307, 369–371. [Google Scholar] [CrossRef]
  32. Simaan, J.; Fawaz, G.; Jarawan, S. The effect of ouabain-induced contractility on myocardial oxygen consumption. Naunyn Schmiedebergs Arch. Pharmacol. 1971, 271, 249–261. [Google Scholar] [CrossRef] [PubMed]
  33. Rajanathan, R.; Pedersen, T.M.; Thomsen, M.B.; Botker, H.E.; Matchkov, V.V. Phenylephrine-Induced Cardiovascular Changes in the Anesthetized Mouse: An Integrated Assessment of in vivo Hemodynamics Under Conditions of Controlled Heart Rate. Front. Physiol. 2022, 13, 831724. [Google Scholar] [CrossRef] [PubMed]
  34. Ikeda, K.; Onaka, T.; Yamakado, M.; Nakai, J.; Ishikawa, T.-o.; Taketo, M.M.; Kawakami, K. Degeneration of the Amygdala/Piriform Cortex and Enhanced Fear/Anxiety Behaviors in Sodium Pump α2 Subunit (Atp1a2)-Deficient Mice. J. Neurosci. 2003, 23, 4667–4676. [Google Scholar] [CrossRef] [Green Version]
  35. Ikeda, K.; Onimaru, H.; Yamada, J.; Inoue, K.; Ueno, S.; Onaka, T.; Toyoda, H.; Arata, A.; Ishikawa, T.-o.; Taketo, M.M.; et al. Malfunction of Respiratory-Related Neuronal Activity in Na+, K+-ATPase α2 Subunit-Deficient Mice Is Attributable to Abnormal Cl Homeostasis in Brainstem Neurons. J. Neurosci. 2004, 24, 10693–10701. [Google Scholar] [CrossRef] [Green Version]
  36. Percie du Sert, N.; Ahluwalia, A.; Alam, S.; Avey, M.T.; Baker, M.; Browne, W.J.; Clark, A.; Cuthill, I.C.; Dirnagl, U.; Emerson, M.; et al. Reporting animal research: Explanation and elaboration for the ARRIVE guidelines 2.0. PLoS Biol. 2020, 18, e3000411. [Google Scholar] [CrossRef] [PubMed]
  37. Hauber, H.P.; Karp, D.; Goldmann, T.; Vollmer, E.; Zabel, P. Effect of low tidal volume ventilation on lung function and inflammation in mice. BMC Pulm. Med. 2010, 10, 21. [Google Scholar] [CrossRef] [PubMed] [Green Version]
  38. Hansen, K.B.; Staehr, C.; Rohde, P.D.; Homilius, C.; Kim, S.; Nyegaard, M.; Matchkov, V.V.; Boedtkjer, E. PTPRG is an ischemia risk locus essential for HCO3-dependent regulation of endothelial function and tissue perfusion. eLife 2020, 9. [Google Scholar] [CrossRef]
  39. Janssen, B.; Debets, J.; Leenders, P.; Smits, J. Chronic measurement of cardiac output in conscious mice. Am. J. Physiol.-Regul. Integr. Comp. Physiol. 2002, 282, R928–R935. [Google Scholar] [CrossRef] [Green Version]
  40. Hill, L.K.; Sollers Iii, J.J.; Thayer, J.F. Resistance reconstructed estimation of total peripheral resistance from computationally derived cardiac output - biomed 2013. Biomed. Sci. Instrum. 2013, 49, 216–223. [Google Scholar]
  41. Monge Garcia, M.I.; Jian, Z.; Settels, J.J.; Hunley, C.; Cecconi, M.; Hatib, F.; Pinsky, M.R. Performance comparison of ventricular and arterial dP/dtmax for assessing left ventricular systolic function during different experimental loading and contractile conditions. Crit. Care 2018, 22, 325. [Google Scholar] [CrossRef] [PubMed] [Green Version]
  42. Cohn, P.F.; Liedtke, A.J.; Serur, J.; Sonnenblick, E.H.; Urschel, C.W. Maximal rate of pressure fall (peak negative dP/dt) during ventricular relaxation. Cardiovasc. Res. 1972, 6, 263–267. [Google Scholar] [CrossRef]
  43. Alhakak, A.S.; Teerlink, J.R.; Lindenfeld, J.; Böhm, M.; Rosano, G.M.C.; Biering-Sørensen, T. The significance of left ventricular ejection time in heart failure with reduced ejection fraction. Eur. J. Heart Fail. 2021, 23, 541–551. [Google Scholar] [CrossRef] [PubMed]
  44. Boudoulas, H. Systolic time intervals. Eur. Heart J. 1990, 11 Suppl I, 93–104. [Google Scholar] [CrossRef]
  45. Vistisen, S.T.; Juhl-Olsen, P.; Frederiksen, C.A.; Kirkegaard, H. Variations in the pre-ejection period induced by deep breathing do not predict the hemodynamic response to early haemorrhage in healthy volunteers. J. Clin. Monit. Comput. 2014, 28, 233–241. [Google Scholar] [CrossRef] [PubMed]
  46. Politi, M.T.; Ghigo, A.; Fernández, J.M.; Khelifa, I.; Gaudric, J.; Fullana, J.M.; Lagrée, P.-Y. The dicrotic notch analyzed by a numerical model. Comput. Biol. Med. 2016, 72, 54–64. [Google Scholar] [CrossRef]
  47. National Center for Biotechnology Information. PubChem Compound Summary for CID 439501, O.R.J. 2022. Available online: https://pubchem.ncbi.nlm.nih.gov/compound/Ouabain (accessed on 18 January 2022).
  48. Wittenberg, S.M. Chronotropic Effects of Ouabain and Heart Rate on Canine Atrium in Vivo. Circ. Res. 1974, 34, 258–267. [Google Scholar] [CrossRef] [PubMed] [Green Version]
  49. Chiba, S.; Furukawa, Y.; Kobayashi, M. Direct positive chronotropic and inotropic effects of ouabain in the isolated and blood-perfused canine atrium. Jpn. Heart J. 1978, 19, 877–885. [Google Scholar] [CrossRef] [Green Version]
  50. Salahudeen, M.S.; Nishtala, P.S. An overview of pharmacodynamic modelling, ligand-binding approach and its application in clinical practice. Saudi. Pharm. J. 2017, 25, 165–175. [Google Scholar] [CrossRef] [Green Version]
  51. Matchkov, V.V.; Krivoi, I.I. Specialized Functional Diversity and Interactions of the Na,K-ATPase. Front. Physiol. 2016, 7, 179. [Google Scholar] [CrossRef] [Green Version]
  52. Ferrandi, M.; Manunta, P.; Balzan, S.; Hamlyn, J.M.; Bianchi, G.; Ferrari, P. Ouabain-like Factor Quantification in Mammalian Tissues and Plasma. Hypertension 1997, 30, 886–896. [Google Scholar] [CrossRef]
  53. Goto, A.; Yamada, K.; Nagoshi, H.; Terano, Y.; Omata, M. Stress-Induced Elevation of Ouabainlike Compound in Rat Plasma and Adrenal. Hypertension 1995, 26, 1173–1176. [Google Scholar] [CrossRef]
  54. Bai, Y.-L.; Chu, Q.-J.; Li, J.; Chen, Y.-Y.; Li, W.-J.; Zhang, Q. A comparison of the effects of digoxin, ouabain and milrinone on naloxone-precipitated withdrawal syndrome in mice. Eur. J. Pharmacol. 2012, 694, 69–74. [Google Scholar] [CrossRef] [PubMed]
  55. Yamazaki, T.; Akiyama, T.; Kitagawa, H.; Komaki, F.; Mori, H.; Kawada, T.; Sunagawa, K.; Sugimachi, M. Characterization of ouabain-induced noradrenaline and acetylcholine release from in situ cardiac autonomic nerve endings. Acta Physiol. 2007, 191, 275–284. [Google Scholar] [CrossRef]
  56. Manunta, P.; Rogowski, A.C.; Hamilton, B.P.; Hamlyn, J.M. Ouabain-induced hypertension in the rat: Relationships among plasma and tissue ouabain and blood pressure. J. Hypertens. 1994, 12, 549–560. [Google Scholar] [CrossRef] [PubMed]
  57. Cooke, J.P.; Shepherd, J.T.; Vanhoutte, P.M. Vasoconstriction induced by ouabain in the canine coronary artery: Contribution of adrenergic and nonadrenergic responses. Cardiovasc. Drugs Ther. 1988, 2, 255–263. [Google Scholar] [CrossRef] [PubMed]
  58. Woolfson, R.G.; Hilton, P.J.; Poston, L. Effects of ouabain and low sodium on contractility of human resistance arteries. Hypertension 1990, 15, 583–590. [Google Scholar] [CrossRef] [PubMed] [Green Version]
  59. Xie, J.; Wang, Y.; Summer, W.R.; Greenberg, S.S. Ouabain Enhances Basal Release of Nitric Oxide from Carotid Artery. Am. J. Med. Sci. 1993, 305, 157–163. [Google Scholar] [CrossRef]
  60. Zhang, L.; Aalkjaer, C.; Matchkov, V.V. The Na,K-ATPase-Dependent Src Kinase Signaling Changes with Mesenteric Artery Diameter. Int. J. Mol. Sci. 2018, 19, 2489. [Google Scholar] [CrossRef] [Green Version]
  61. Zulian, A.; Linde, C.I.; Pulina, M.V.; Baryshnikov, S.G.; Papparella, I.; Hamlyn, J.M.; Golovina, V.A. Activation of c-SRC underlies the differential effects of ouabain and digoxin on Ca(2+) signaling in arterial smooth muscle cells. Am. J. Physiol. Cell Physiol. 2013, 304, C324–C333. [Google Scholar] [CrossRef] [Green Version]
  62. Zhang, J.; Lee, M.Y.; Cavalli, M.; Chen, L.; Berra-Romani, R.; Balke, C.W.; Bianchi, G.; Ferrari, P.; Hamlyn, J.M.; Iwamoto, T.; et al. Sodium pump α2 subunits control myogenic tone and blood pressure in mice. Physiol. J. 2005, 569, 243–256. [Google Scholar] [CrossRef] [PubMed]
  63. Matchkov, V.V.; Moeller-Nielsen, N.; Dam, V.S.; Nourian, Z.; Briggs Boedtkjer, D.M.; Aalkjaer, C. The α2 isoform of the Na,K-pump is important for intercellular communication, agonist-induced contraction, and EDHF-like response in rat mesenteric arteries. Am. J. Physiol.-Heart Circ. Physiol. 2012, 303, H36–H46. [Google Scholar] [CrossRef] [PubMed]
  64. Ruiz-Ceretti, E.; Samson, J.P.; Reisin, I.; Schanne, O.F. Ionic and electrical effects of quabain on isolated rabbit hearts. J. Mol. Cell. Cardiol. 1977, 9, 51–61. [Google Scholar] [CrossRef]
  65. Psotka, M.A.; Gottlieb, S.S.; Francis, G.S.; Allen, L.A.; Teerlink, J.R.; Adams, K.F., Jr.; Rosano, G.M.C.; Lancellotti, P. Cardiac Calcitropes, Myotropes, and Mitotropes: JACC Review Topic of the Week. J. Am. Coll. Cardiol. 2019, 73, 2345–2353. [Google Scholar] [CrossRef] [PubMed]
  66. Hamlin, R.L.; del Rio, C. dP/dtmax — A measure of ‘baroinometry’. J. Pharmacol. Toxicol. Methods 2012, 66, 63–65. [Google Scholar] [CrossRef]
  67. Warrington, S.J.; Weerasuriya, K.; Burgess, C.D. Correction of systolic time intervals for heart rate: A comparison of individual with population derived regression equations. Br. J. Clin. Pharmacol. 1988, 26, 155–165. [Google Scholar] [CrossRef] [Green Version]
  68. Wolf, G.K.; Belz, G.G.; Stauch, M. Systolic time intervals—Correction for heart rate. Basic Res. Cardiol. 1978, 73, 85–96. [Google Scholar] [CrossRef]
  69. Mertens, H.M.; Mannebach, H.; Trieb, G.; Gleichmann, U. Influence of heart rate on systolic time intervals: Effects of atrial pacing versus dynamic exercise. Clin. Cardiol. 1981, 4, 22–27. [Google Scholar] [CrossRef]
  70. Ritterhoff, J.; Tian, R. Metabolism in cardiomyopathy: Every substrate matters. Cardiovasc. Res. 2017, 113, 411–421. [Google Scholar] [CrossRef] [Green Version]
  71. Sabbah, H.N. Silent disease progression in clinically stable heart failure. Eur. J. Heart Fail. 2017, 19, 469–478. [Google Scholar] [CrossRef]
  72. Hippisley-Cox, J.; Coupland, C.; Brindle, P. Development and validation of QRISK3 risk prediction algorithms to estimate future risk of cardiovascular disease: Prospective cohort study. BMJ 2017, 357, j2099. [Google Scholar] [CrossRef] [PubMed] [Green Version]
  73. Adelborg, K.; Szépligeti, S.K.; Holland-Bill, L.; Ehrenstein, V.; Horváth-Puhó, E.; Henderson, V.W.; Sørensen, H.T. Migraine and risk of cardiovascular diseases: Danish population based matched cohort study. BMJ 2018, 360, k96. [Google Scholar] [CrossRef] [PubMed] [Green Version]
  74. Sutherland, H.G.; Griffiths, L.R. Genetics of Migraine: Insights into the Molecular Basis of Migraine Disorders. Headache J. Head Face Pain 2017, 57, 537–569. [Google Scholar] [CrossRef] [Green Version]
  75. Pellacani, S.; Sicca, F.; Di Lorenzo, C.; Grieco, G.S.; Valvo, G.; Cereda, C.; Rubegni, A.; Santorelli, F.M. The Revolution in Migraine Genetics: From Aching Channels Disorders to a Next-Generation Medicine. Front. Cell. Neurosci. 2016, 10, 156. [Google Scholar] [CrossRef] [PubMed] [Green Version]
  76. Tietjen, G. Migraine as a Systemic Vasculopathy. Cephalalgia 2009, 29, 989–996. [Google Scholar] [CrossRef]
  77. Venugopal, N.; Sriram Gopal, M.R. Migraine is a marker for systemic disease. Indian J. Ophthalmol. 2013, 61, 613. [Google Scholar] [CrossRef]
Figure 1. Timeline of the in vivo protocol. Gray arrow indicates point of intraperitoneal injection of either ouabain (1.5 mg/kg) or vehicle (0.9 mg/mL NaCl), and gray bars indicate period after administration. After implantation of probes, a baseline measurement was made. The protocol includes atrial pacing starting from 10 Hz (600 BPM) with stepwise increments to 11.3 Hz (678 BPM) before and after administration. Time points 0, 2, 5, 9, and 13 min represent measurements done during sinus rhythm. The protocol was finalized by blood collection from the apex 15 min after administration of ouabain or saline. Figure was created with BioRender.com.
Biomedicines 11 00344 g001
Figure 2. Temporal alignment between the second time derivative of aortic blood flow, ECG, and blood pressure traces allowed for the calculation of systolic time intervals. Upper panel includes blood flow through the ascending aorta (black line) and its 2nd time derivative, i.e., acceleration (gray line). Lower panel includes mouse ECG lead I with depicted Q, R, and S waves (black line) together with arterial blood pressure measured in the aortic arc (gray line). Black arrow indicates the dicrotic notch on the blood pressure trace, i.e., closure of the aortic valve. Preejection period was defined as spanning from the beginning of the Q wave to opening of the aortic valve, i.e., Q wave to the first peak of the second time derivative of aortic flow. Left ventricular ejection period was defined as spanning from the opening to the closure of the aortic valve, i.e., spanning from the first peak of the second time derivative of blood flow to the dicrotic notch. Systolic duration was defined as the sum of the pre-ejection period and left ventricular ejection time.
Biomedicines 11 00344 g002
Figure 3. Similar plasma ouabain concentrations between wild-type (WT) and α2+/G301R mice approximately 15 mins after injection of ouabain (1.5 mg/kg) or vehicle (0.9% NaCl) treatment. Injection of ouabain i.p. increased plasma ouabain concentrations similarly in both WT (210 ± 48 pg/mL and 40,517 ± 4438 pg/mL for vehicle and ouabain administered mice, respectively) and α2+/G301R (156 ± 33 pg/mL and 36,489 ± 5041 pg/mL for vehicle and ouabain administered mice, respectively) mice compared to their respective vehicle groups. (Insert) The molecular structure of ouabain in 2D (adopted from the PubChem database [47]). ELISA data were analyzed by two-way ANOVA followed by Bonferroni’s multiple comparison test. *** p = 0.0003 and **** p < 0.0001; intragroup plasma ouabain concentration of vehicle vs. ouabain treated mice. n = 7–13 for ouabain groups, and n = 4–5 for vehicle groups.
Biomedicines 11 00344 g003
Figure 4. Intraperitoneal ouabain injection (1.5 mg/kg) increased blood pressure and total peripheral resistance in wild-type (WT) and α2+/G301R mice. (a) Ouabain increased blood pressure in WT and α2+/G301R mice (systolic pressure; p = 0.0193, and diastolic pressure; p = 0.0100). (b) Ouabain-induced increase in total peripheral resistance (TPR) was different between α2+/G301R and WT mice (p = 0.0340). There was no significant effect of ouabain administration on stroke volume (c), heart rate (d), or cardiac output (e) in neither WT nor α2+/G301R mice. Data were compared with two-way repeated measures ANOVA followed by Dunnett’s multiple comparison test. * p < 0.05 and ** p < 0.01 for α2+/G301R and † p < 0.05 for WT; variables at different time points vs. intragroup baseline before ouabain administration, i.e., time 0 min. n = 8. Data are available in Supplementary Table S1.
Biomedicines 11 00344 g004
Figure 5. Systolic time intervals were affected by ouabain administration (1.5 mg/kg, i.p.) only in α2+/G301R mice and not in wild-type mice (WT). (a) the systolic time interval ratio (STI Ratio) was significantly increased in α2+/G301R mice only (p = 0.0004) due to (b) prolongation of pre-ejection period (p = 0.0007) and (c) shortening of left ventricular ejection time (LV Ejection Time; p = 0.0426). (d) Systolic duration, (e) arterial dP/dtmax, and (f) arterial dP/dtmin were unchanged in both WT and α2+/G301R mice after ouabain administration. Data were compared with two-way repeated measures ANOVA followed by Dunnett’s multiple comparison test. * p < 0.05 and ** p < 0.01 for α2+/G301R; variables at different time points vs. intragroup baseline before ouabain administration, i.e., time 0 min. n = 8. Data are available in Supplementary Table S1.
Biomedicines 11 00344 g005
Figure 6. Ouabain administration increased blood pressure and total peripheral resistance in both wild-type (WT) and α2+/G301R mice when the hearts were paced at 11.3 Hz (678 BPM). Under these conditions, ouabain reduced stroke volume in α2+/G301R mice. Administration of ouabain augmented (a) systolic blood pressure (control vs. ouabain; 78.01 ± 2.14 mmHg vs. 86.71 ± 2.67 mmHg for WT and 70.19 ± 6.90 mmHg vs. 78.94 ± 7.50 mmHg for α2+/G301R mice; p = 0.0002), (b) diastolic blood pressure (control vs. ouabain; 58.01 ± 2.31 mmHg vs. 68.01 ± 2.16 mmHg for WT and 49.50 ± 7.51 mmHg vs. 59.03 ± 7.56 mmHg for α2+/G301R mice; p < 0.0001), and (c) total peripheral resistance (TPR; control vs. ouabain; 8.49 ± 0.68 mmHg·min/mL vs. 10.92 ± 1.24 mmHg·min/mL for WT and 7.31 ± 1.00 mmHg·min/mL vs. 9.48 ± 1.25 mmHg·min/mL for α2+/G301R mice; p = 0.0001). Ouabain administration significantly decreased stroke volume (d) in α2+/G301R mice (control vs. ouabain; 12.12 ± 1.54 µL vs. 11.02 ± 1.45 µL; p = 0.0473), whereas changes to stroke volume in WT mice did not achieve statistical significance (control vs. ouabain; 12.07 ± 1.53 µL vs. 11.15 ± 1.54 µL; p = 0.1062). (e) Arterial dP/dtmax (control vs. ouabain; 3367 ± 516 mmHg/s vs. 3303 ± 629 mmHg/s for WT and 2872 ± 209 mmHg/s vs. 2820 ± 174 mmHg/s for α2+/G301R mice) and (f) arterial dP/dtmin (control vs. ouabain; −1958 ± 119 mmHg/s vs. −2067 ± 172 mmHg/s for WT and −1922 ± 172 mmHg/s vs. −2009 ± 155 mmHg/s for α2+/G301R mice) were unchanged in both groups. Data were compared with multiple Wilcoxon tests or two-way repeated measures ANOVA followed by Bonferroni’s multiple comparison test. * p < 0.05, ** p < 0.01, and *** p< 0.001; intragroup variables before vs. after ouabain administration. n = 8.
Biomedicines 11 00344 g006
Figure 7. Ouabain administration was without an effect on systolic time intervals in α2+/G301R and wild-type mice (WT) when the hearts were paced at 11.3 Hz (678 BPM). (a) The systolic time interval ratio (STI Ratio; control vs. ouabain; 0.69 ± 0.04 vs. 0.76 ± 0.06 for WT and 0.63 ± 0.03 vs. 0.69 ± 0.05 for α2+/G301R mice), (b) pre-ejection period (control vs. ouabain; 19.6 ± 0.8 ms vs. 20.7 ± 0.7 ms for WT and 18.3 ± 0.5 ms vs. 19.5 ± 0.8 ms for α2+/G301R mice), (c) left ventricular ejection time (LV ejection time; control vs. ouabain; 29.2 ± 1.8 ms vs. 28.2 ± 2.1 ms for WT and 29.4 ± 1.2 ms vs. 28.6 ± 1.3 ms for α2+/G301R mice), and (d) systolic duration (control vs. ouabain; 48.8 ± 2.0 ms vs. 49.0 ± 1.9 ms for WT and 47.7 ± 1.2 ms vs. 48.1 ± 1.3 ms for α2+/G301R mice) were similar during atrial pacing at 11.3 Hz before and after ouabain administration. Data were compared with two-way repeated measures ANOVA. n = 8.
Biomedicines 11 00344 g007
Table 1. Baseline in vivo parameters and cardiovascular variables of all wild-type and α2+/G301R mice were similar. One wild-type mouse injected with vehicle had an uninterpretable ECG recording and, thus, was excluded in systolic time interval calculations. Data were compared with an unpaired t-test or a Mann–Whitney test where appropriate.
Wild Type (n = 12)α2+/G301R (n = 12)p-Value
Age (weeks)41 ± 245 ± 30.23
Body mass (g)35.3 ± 1.635.3 ± 0.8>0.99
Cardiovascular variables and respiratory parameters
Systolic pressure (mmHg)76.09 ± 2.9772.09 ± 4.680.48
Diastolic pressure (mmHg)49.71 ± 3.5346.16 ± 5.000.57
Total peripheral resistance (mmHg•min/mL)6.89 ± 0.717.21 ± 0.730.76
Cardiac output (mL/min)9.13 ± 0.758.28 ± 0.930.48
Stroke volume (µL)17.20 ± 1.5015.66 ± 1.830.52
Heart rate (BPM)534 ± 8530 ± 100.81
End-tidal CO2 (%)3.69 ± 0.133.76 ± 0.110.69
Ventilation rate (min−1)116 ± 6114 ± 70.87
Systolic time interval ratio (AU.)0.59 ± 0.040.54 ± 0.030.27
Pre-ejection period (ms)19.2 ± 0.818.2 ± 0.50.28
Left ventricular ejection time (ms)33.2 ± 1.534.4 ± 1.60.58
Systolic duration (ms)52.4 ± 1.652.6 ± 1.80.82
Arterial dP/dtmax (mmHg/s)3705 ± 298.93142 ± 197.90.13
Arterial dP/dtmin (mmHg/s)−2157 ± 92.78−2106 ± 134.40.76
Disclaimer/Publisher’s Note: The statements, opinions and data contained in all publications are solely those of the individual author(s) and contributor(s) and not of MDPI and/or the editor(s). MDPI and/or the editor(s) disclaim responsibility for any injury to people or property resulting from any ideas, methods, instructions or products referred to in the content.

