Abstract
In this paper, ZnO-TiO2-rGO nanocomposites were successfully synthesized by the hydrothermal method. The morphology and structure of the synthesized nanomaterials were characterized by SEM, XRD, HRTEM, and XPS. Butanone is a typical ketone product. The vapors are extremely harmful once exposed, triggering skin irritation in mild cases and affecting our breathing in severe cases. In this paper, the gas-sensing properties of TiO2, ZnO, ZnO-TiO2, and ZnO-TiO2-rGO nanomaterials to butanone vapor were studied. The optimum operating temperature of the ZnO-TiO2-rGO sensor is 145 °C, which is substantially lower than the other three sensors. The selectivity for butanone vapor is greatly improved, and the response is 5.6 times higher than that of other organic gases. The lower detection limit to butanone can reach 63 ppb. Therefore, the ZnO-TiO2-rGO sensor demonstrates excellent gas-sensing performance to butanone. Meanwhile, the gas-sensing mechanism of the ZnO-TiO2-rGO sensor to butanone vapor was also analyzed.
1. Introduction
Butanone is a colorless and transparent liquid with a slight odor and volatility [1], which is widely used in industrial production [2]. The exposure of butanone vapor to open flame or high temperature can cause combustion and explosion, resulting in accidental injury or death [3]. Without direct contact with butanone vapor, it will also bring certain stimulation and harm to our body. It is even genotoxic and carcinogenic, which seriously endangers human health [4,5]. Therefore, it is very important for butanone sensor to achieve early warning detection. In recent years, there has been an increasing interest in VOC sensors with selectivity, high sensitivity, and low cost [6]. However, fewer studies have been reported on the use of gas sensors for butanone measurement [7,8,9,10]. These sensors operate at high temperatures, have poor selectivity, and cannot detect lower concentrations. Therefore, it is necessary to develop better sensors to detect the performance of butanone.
Zinc oxide (ZnO) is an n-type semiconductor oxide with a wide band gap (3.37 eV) [11]. It can detect gases under different environmental conditions and has high sensitivity. So, it is widely used in semiconductor oxide-type gas sensors. ZnO nanomaterials have various morphologies, such as rods, spheres, and flowers [12,13,14]. However, studies have shown that the prepared ZnO-sensing materials still have disadvantages such as high operating temperature and poor target gas selectivity [15,16,17], which hinder their practical application in the field of gas sensors. So, we searched for other metal oxides for compounding [18,19,20]. Semiconductor materials such as titanium dioxide (TiO2) have a wide band gap of about 3.0 eV. It is widely used in energy utilization and catalytic research because of its high catalytic activity, non-toxic, good chemical stability, and low price [21,22,23,24]. With the increasing level of scientific research, the properties of pure ZnO and TiO2 can no longer meet the required requirements. After continuous exploration, the related properties can be improved through the doping mechanism [25]. Park et al. prepared TiO2-ZnO core–shell nanofibers as sensing materials for the dynamic detection of oxygen [26]. It is found that it has good sensitivity and reproducibility.
Graphene is a two-dimensional honeycomb carbon material composed of single-layer carbon atoms. It has good conductivity [27], rich sources [28], and high thermal conductivity [29]. Graphene has large specific surface area [30] and good adsorption activity [31] due to its single-layer folded structure [32]. As a result of its unique properties, it has a wide range of applications in the field of electronic sensing. Metal oxides generally face problems such as high working temperature and poor selectivity to organic gases. To avoid defects, we intended to introduce the two-dimensional material graphene, forming the ternary nanomaterial ZnO-TiO2-rGO. Johra et al. in 2015 have prepared RGO-TiO2-ZnO nanocomposites by the hydrothermal reduction method as a photocatalytic application [33].
In this paper, a simple hydrothermal method was used to prepare the ternary nanomaterial ZnO-TiO2-rGO for gas sensor applications. The ZnO-TiO2-rGO sensor has good stability, reproducibility, and selectivity for butanone vapor at low temperatures. The sensor is also capable of detecting lower butanone vapors and has good selectivity to butanone vapors. The ternary composite nanomaterial ZnO-TiO2-rGO significantly improved its gas-sensitive performance.
2. Materials and Characterization Instruments
2.1. Reagents and Instruments
C12H28O4Ti (AR) and CH3COOH (AR) were both purchased from Shanghai Macklin Biochemical Co., Ltd. NaOH (AR) and (CH3COO)2Zn (AR) were both purchased from Sinopharm Group Chemical Reagent Co., Ltd. C2H5OH (AR) was purchased from Tianjin Fuyu Fine Chemical Co., Ltd. AR is analytical pure reagent. The microscopic morphology and crystal structure of the nanomaterials were characterized and imaged using the instruments such as high-resolution transmission electron microscopy (HRTEM, JEOLJEM-2010, Beijing, China), X-ray photoelectron spectrometry (XPS, Thermo ScientificTM K-AlphaTM+ spectrometer, Beijing, China), field-emission scanning electron microscopy (SEM, Hitachi, Tokyo, Japan), and X-ray diffraction (XRD, SmartLab SE, Tokyo, Japan).
2.2. Materials Preparation
First, 1.5 mL of C12H28O4Ti, 50 mL of C2H5OH, and 1 mL of CH3COOH were mixed in the same beaker and sonicated for 20 min. The mixed solution was loaded into the reactor and reacted at 200 ℃ for 1 h. The product obtained was dried at 60 °C by centrifuging twice with water and ethanol, respectively. This process yielded the nanomaterial TiO2.
Then, 270 mg (CH3COO)2Zn was stirred well with 50 mL of deionized water, and 1 M NaOH solution was added dropwise to pH = 12. The mixed solution was poured into a suitable capacity reactor and reacted at 200 °C for 1 h. The same was centrifuged and dried at 60 °C. This process yields the product ZnO.
Then, 1.5 mL of C12H28O4Ti, 50 mL of C2H5OH, and 1 mL of CH3COOH were mixed in the same beaker and sonicated for 20 min. The mixed solution was loaded into the reaction kettle and reacted at 200 ℃ for 1 h. After centrifuging twice with water and ethanol respectively, 100 mL of deionized water was added and stirred well. Then, we added 270 mg of (CH3COO)2Zn and 1 M NaOH solution drop by drop to pH = 12. Afterwards, we poured the mixed solution into a suitable capacity reaction kettle, let it react for 1 h at 200 °C, performed centrifugation, and let it dry at 60 °C. This experimental procedure yielded the product ZnO-TiO2.
Graphene oxide was prepared by a modified Hummers method. First, 4 g of graphite raw material was placed in a 500 mL beaker. Then, 70 mL of concentrated sulfuric acid was added to the beaker, and the mouth of the beaker was sealed with plastic wrap. The beaker was placed on a magnetic mixer and stirred vigorously for 1 h to fully react the graphite with the concentrated sulfuric acid. Then, 12 g of KMnO4 was slowly added to the mixed solution. The beaker was placed in a warm water bath at 35 ℃ for 6 h. Afterwards, 100 mL of deionized water was added to the beaker and stirred for 30 min. Then, 40 mL of 30% hydrogen peroxide was added, and the solution turned golden yellow. Then, 30 mL of 1 mol/L HCl and 200 mL of deionized water were added and stirred for 30 min. Finally, the solution was washed by centrifugation with deionized water to neutral [34,35]. In addition, 6.5 mg/mL of graphene oxide was prepared for use. First, 1.5 mL of C12H28O4Ti, 50 mL of C2H5OH, and 1 mL of CH3COOH were mixed in a beaker and sonicated for 20 min. Then, 1.5 mL of 6.5 mg/mL GO was added and stirred evenly. The solution was put into the reactor and reacted at 200 °C for 1 h. After centrifuging twice with water and ethanol, 100 mL of deionized water and 270 mg of (CH3COO)2Zn were added. Then, 1 M NaOH was added dropwise to the solution until pH = 12. The mixed solution was put into the reactor and reacted at 200 °C for 1 h. Finally, the sample was dried at 60 °C and collected. The ideal ternary nanomaterial ZnO-TiO2-rGO was obtained [36]. The experimental procedure is illustrated in Figure 1.
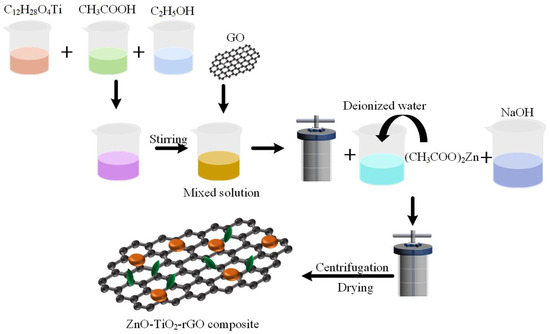
Figure 1.
Schematic diagram of the synthesis of ZnO-TiO2-rGO nanomaterials.
2.3. Fabrication and Testing of Sensors
For gas testing, the entire system consists of a synthetic dry air unit, a programmable DC power supply (RIGOL DP832A), a digital source meter (Keysight B2902A), and a 1 L gas chamber. The synthetic dry air consists of 21% oxygen and 79% nitrogen. The programmable DC power supply controls and regulates the temperature to which the sensor is adapted by connecting a resistive wire through an electrode. A digital source meter displays the current and voltage of the sensor during operation, and the change in resistance of the sensor during operation is displayed and recorded by the Labview software in the computer. The sensor is affected by the entry and exit of air and target gas in the confined chamber, and its resistance magnitude varies with some regularity. The target gas is the vapor pressure of different substances at different temperatures calculated using Antoine’s formula, as shown in Equation (1).
where P is the vapor pressure of the substance in mmHg. T is the temperature in °C. B and C are the corresponding constant coefficients. By calculation, the saturation vapor pressure of some organic gases will have a corresponding volume, and experiments will be performed with different sizes of syringes.
The sensor is shown in Figure 2 and consists of a ceramic tube, Ni-Cr heater, a gold electrode, and a platinum wire. The prepared nanomaterials were mixed well with a small amount of ethanol and applied to the surface of the ceramic tube to measure the gas-sensitive properties of the gas. The response of the gas sensor to the target gas is defined by Equation (2):
where is the sensitivity of the gas sensor and also the response value of the gas sensor. is the resistance value displayed by the gas sensor in the test gas. is the resistance value displayed by the gas sensor in air.
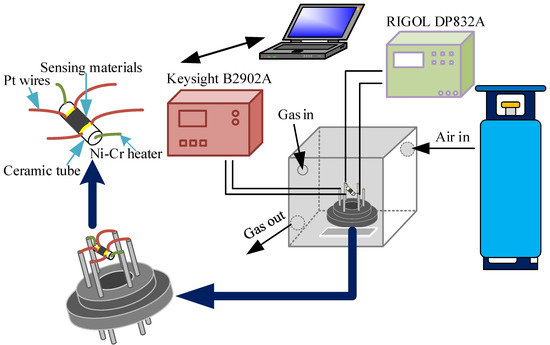
Figure 2.
Schematic diagram of the gas sensor.
3. Results and Discussion
3.1. Characterization
The SEM image of Figure 3a shows that ZnO-TiO2 is composed of ZnO nanorods and TiO2 nanoparticles. ZnO nanorods are dispersed in the surrounding environment. TiO2 nanoparticles are small in size and randomly stacked together. Figure 3b shows the SEM image of graphene oxide. It can be seen that graphene oxide is layered, similar to a thin film. It has very obvious folds. The SEM image in Figure 3c is ZnO-TiO2-rGO ternary nano material. ZnO nanorods and TiO2 nanoparticles are wrapped by graphene film. In addition, it can be seen that the size of TiO2 nanoparticles gradually increases and becomes obviously spherical. It indicated that in the composite process of ZnO-TiO2-rGO ternary nanomaterials, the formation of ZnO nanorods and TiO2 nanoparticles gradually changes due to the existence of graphene. Figure 3d shows the elemental contents corresponding to the EDS plots. It demonstrates that the ternary nanomaterial ZnO-TiO2-rGO adequately contains elements C, O, Ti, and Zn without the interference of other clutter elements. The percentages of elemental C, O, Ti, and Zn contents are listed in Table 1.
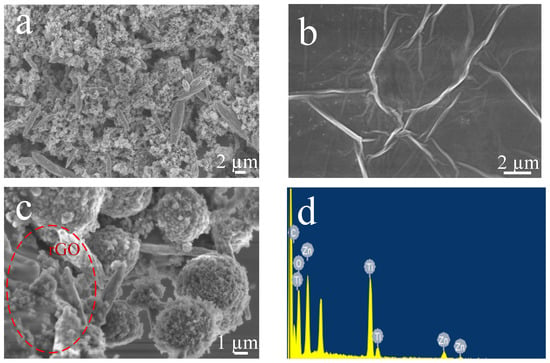
Figure 3.
SEM images of (a) ZnO-TiO2, (b) GO, and (c) ZnO-TiO2-rGO. (d) Element content of ZnO-TiO2-rGO.

Table 1.
Element content of ZnO-TiO2-rGO.
Figure 4 shows the elemental mapping part of ZnO-TiO2-rGO. Figure 4a mainly shows the elemental mapping of the ZnO rod range. Figure 4b mainly shows the elemental mapping of the TiO2 sphere range. It is more accurate to see that the previous SEM of ZnO-TiO2-rGO has ZnO in the rod range and TiO2 in the sphere range. For ZnO, the rod elements are basically Zn and O. For TiO2 spherical particles, the O, Ti, and Zn contents are more, indicating that for the most spherical TiO2, ZnO rods are more exposed. It can be clearly seen that the background element is C for both ZnO rods and TiO2 spheres, indicating that ZnO rods and TiO2 spheres are grown on the graphene oxide film. It is also proved that the elemental composition of ZnO-TiO2-rGO ternary nanomaterials is Zn, Ti, O, and C.
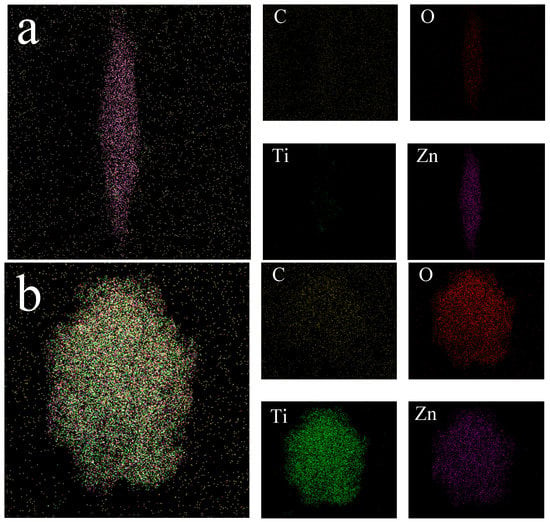
Figure 4.
(a) ZnO-TiO2-rGO elemental mapping of rod-shaped ZnO. (b) ZnO-TiO2-rGO elemental mapping of spherical TiO2.
Figure 5a shows the XRD patterns of four nanomaterials, ZnO, TiO2, ZnO-TiO2, and ZnO-TiO2-rGO. ZnO displays characteristic diffraction peaks at 2θ = 31.25°, 34.72°, 36.36°, 47.83°, 54.55°, and 62.83°. They correspond to the crystal planes (100), (002), (101), (102), (110), and (103) of PDF#99-0111, respectively. TiO2 exhibits characteristic diffraction peaks at 2θ = 25.36°, 37.98°, 48.16°, 55.25°, and 62.96°, corresponding to the crystallographic planes (101), (004), (200), (211), and (204) of PDF#99-0008, respectively. The ZnO-TiO2 binary nanocomposites show diffraction peaks at 25.36°, 31.94°, 34.49°, 36.44°, 47.85°, 56.89°, and 63.05° [37]. The presence of ZnO with TiO2 is demonstrated. Figure 5b shows the ZnO-TiO2-rGO HRTEM image. After the experimental calculation by the software Gatan DigitalMicrograph, the lattice spacing of ZnO is 0.26 nm, which corresponds to the crystal plane of ZnO in XRD (100). The lattice spacing of TiO2 is 0.30 nm, which corresponds to the crystal plane of TiO2 in XRD (101) [38].
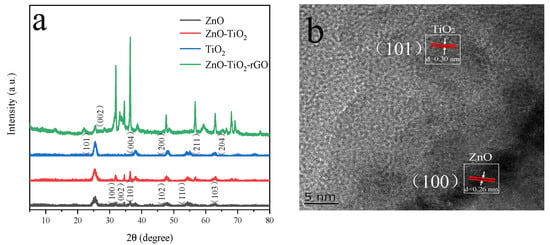
Figure 5.
(a) XRD patterns of ZnO, TiO2, ZnO-TiO2, and ZnO-TiO2-rGO. (b) TEM high-resolution image of ZnO-TiO2-rGO.
XPS can provide in-depth analysis of the surface composition and elemental composition of solid samples. Figure 6 shows the XPS spectrum of ZnO-TiO2-rGO. Figure 6a shows the full spectrum of ZnO-TiO2-rGO. It can be seen that Zn 2p, Ti 2p, C 1s, and O 1s show peaks at the binding of 1020.5 eV, 459.4 eV, 284.7 eV, and 530.3 eV, respectively [39]. Figure 6b shows the Zn 2p mapping of the nanocomposites. The binding energies of 1020.9 eV and 1043.8 eV correspond to Zn 2p3/2 and Zn 2p1/2, respectively. Figure 6c provides the Ti 2p mapping of the nanocomposite, showing two peaks centered at 457.6 eV and 463.4 eV for Ti 2p3/2 and Ti 2p1/2, respectively [40]. Figure 6d shows the C 1S diagram of the nanocomposite. The peak at the sp2 carbon atom belongs to graphene oxide, and the peak at 284.5 eV corresponds to C = C. The peak at the higher binding energy corresponds to C = O (287.8 eV) [41]. This result reinforces the successful composite of ZnO-TiO2-rGO nanocomposites.
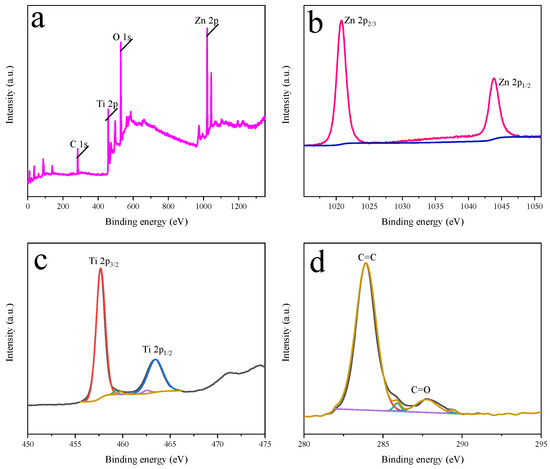
Figure 6.
(a) Measured spectrum of ZnO-TiO2-rGO. (b) XPS spectrum of Zn. (c) XPS spectrum of Ti. (d) XPS spectrum of C.
Figure 7 shows the infrared spectra of ZnO-TiO2-rGO before and after comparison with the passage of butanone vapor. The wavelength is around 667 cm−1 for the Ti-O-Ti bond vibration absorption peak [42]. The C = C bond at a number of 1623 cm−1 and the C-O bond at a wavelength of 1048 cm−1 can be seen in the figure [43]. By comparing the two figures, it can be observed that the intensity of the peaks in the other ranges gradually decreases, but the peak at 1048 cm−1 is enhanced for the C-O bond, where O is the element in butanone and C is the element in GO. It is equivalent to the C = O bond breaking and changing to a C-O bond in this process. It indicates that the ZnO-TiO2-rGO ternary nanomaterial sensor is in contact with the GO phase when it is in contact with the butanone vapor.
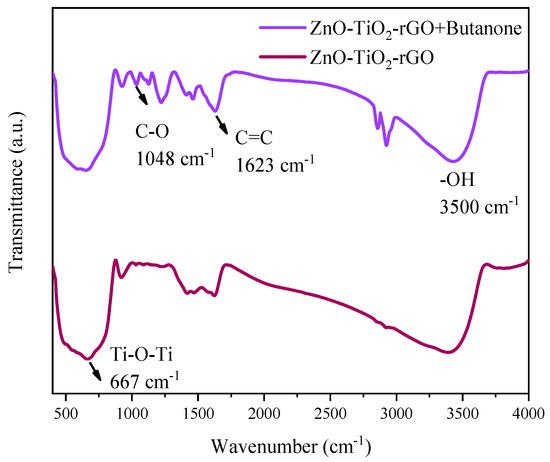
Figure 7.
Infrared spectra of ZnO-TiO2-rGO before and after the passage of butanone vapor.
Figure 7 shows the infrared spectra of ZnO-TiO2-rGO before and after comparison with the passage of butanone vapor. The wavelength is around 667 cm−1 for the Ti-O-Ti bond vibration absorption peak [42]. The C = C bond at 1623 cm−1 and the C-O bond at a wavelength of 1048 cm−1 can be seen in the figure [43]. By comparing the two figures, it can be observed that the intensity of the peaks in the other ranges gradually decreases, but the peak at 1048 cm−1 is enhanced for the C-O bond, where O is the element in butanone and C is the element in GO. It is equivalent to the C = O bond breaking and changing to a C-O bond in this process. It indicates that the ZnO-TiO2-rGO ternary nanomaterial sensor is in contact with the GO phase when it is in contact with the butanone vapor.
3.2. Gas-Sensing Properties
The sensitivity of the sensors is influenced by the operating temperature, because the change of temperature affects the response of the nanomaterials. We measured different sensors in roughly the same range of temperatures. The optimal operating temperatures of the different sensors are also shown in Figure 8a. The optimum operating temperatures of the ZnO sensor, TiO2 sensor, ZnO-TiO2 sensor, and ZnO-TiO2-rGO sensor are 336 °C, 323 °C, 390 °C, and 145 °C, respectively. It can be clearly seen that the optimal operating temperature of the ZnO-TiO2-rGO sensor is greatly reduced compared to the optimal operating temperature of the other three sensors. The lower energy consumption is more conducive to the development of practical applications. Gas sensors will respond to different organic gases to different degrees. The sensitivity of ZnO, TiO2, ZnO-TiO2, and ZnO-TiO2-rGO to eight different organic gases is shown in Figure 8b. Although the ZnO sensor has a high response to butanone vapor, it still has a high response to other organic gases, such as alcohols and ketones. This also indicates that the selectivity of the ZnO sensor is poor. The response of the TiO2 sensor to xylene and butanone is very high, and even the response to xylene has exceeded that of butanone. The response of the ZnO-TiO2 sensor to butanone is 1.93 times that of other organic gases. However, the response of the ZnO-TiO2-rGO sensor to butanone is the highest, which is 5.6 times that of other organic gases. Figure 8c shows the concentration gradient graph of the ZnO-TiO2-rGO sensor. There are corresponding 9.72%, 13%, 18.2%, 22.06%, and 38.69% values for butanone vapor concentrations of 10 ppm, 25 ppm, 50 ppm, 75 ppm, and 150 ppm, respectively. Figure 8d shows the recovery curve of the response of the ZnO-TiO2-rGO sensor to the lowest concentration of butanone vapor. A butanone vapor of 63 ppb can be detected with a response of 1.3%. Figure 8e shows more clearly the variation of the response values of the ZnO-TiO2-rGO sensor for different butanone vapor concentrations as well as the fitted curves for the responses of different butanone concentrations. The fitted curve is y = 6.43 + 0.21x, where x is the different concentrations of butanone vapor and y is the corresponding fitted response value. Figure 8f shows the test of the ZnO-TiO2-rGO sensor under different humidity environments. A certain humidity atmosphere is achieved by proportioning saturated salt solution. The response values of the ZnO-TiO2-rGO sensor corresponding to 27.5%, 25.3%, 24.3%, and 16.4% at 6.6%, 26%, 56%, and 95% humidity are demonstrated. It can be seen that the response value of the ZnO-TiO2-rGO sensor decreases slightly with the increase in humidity. Considered together, the ZnO-TiO2-rGO sensor exhibits good gas-sensitive performance for butanone vapor in terms of operating temperature, directional selectivity, and minimum detection line. Table 2 shows that the SiO2@CoO core–shell sensor has a high response to butanone, but the working temperature of the sensor is very high, which is 350 ℃. The 2% Pt/ZnO sensor also has a high response to butanone, but the working temperature of the sensor is very high, and the detection line is 5 ppm. Overall, the ZnO-TiO2-rGO sensor has a higher butanone-sensing performance.
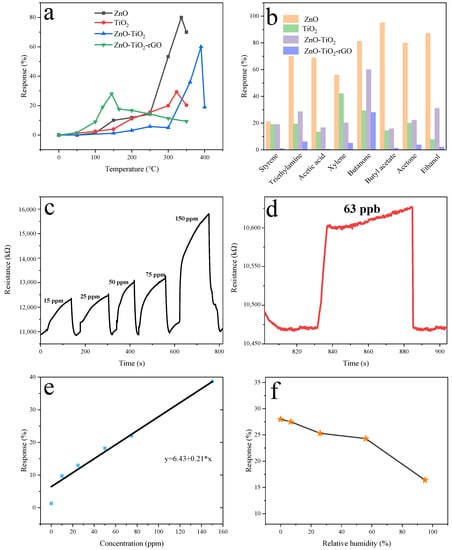
Figure 8.
(a) Optimal operating temperatures for ZnO, TiO2, ZnO-TiO2, and ZnO-TiO2-rGO sensors. (b) Response of ZnO, TiO2, ZnO-TiO2, and ZnO-TiO2-rGO sensors to different gases at 100 ppm. (c) ZnO-TiO2-rGO sensor response versus butanone concentration. (d) Minimum lower limit of ZnO-TiO2-rGO sensor. (e) The sensitivity-fitting curves of ZnO-TiO2-rGO for different concentrations of butanone. (f) Humidity curve of the ZnO-TiO2-rGO sensor.

Table 2.
Comparison of the sensing performance toward the detection of butanone of different sensors.
3.3. Gas-Sensing Mechanism of the ZnO-TiO2-rGO
For ZnO-TiO2 binary metal oxides, filling with graphene oxide and its composite greatly improves the gas-sensitive performance of the sensor to butanone. Here, rGO enhances the adsorption for ZnO nanorods and TiO2 nanoparticles grow firmly on the film of rGO. Moreover, TiO2 transforms from nanoparticles to spheres, increasing the overall specific surface area. For the butanone vapor, it can contact with the rGO film and increase the contact sites. Meanwhile, rGO enhances the electrical conductivity and the transfer of electrons during gas transport. The results show that the presence of graphene reduces the detection limit of butanone vapor.
4. Conclusions
In this paper, ZnO-TiO2-rGO ternary composites were prepared by the hydrothermal method. For experimental comparison, ZnO, TiO2, and ZnO-TiO2 nanomaterials were also prepared for gas-sensitive testing. The morphology and structure of the four synthesized nanomaterials were also characterized by XPS, HRTEM, SEM, and XRD. The results show that the ternary ZnO-TiO2-rGO nanomaterials have an optimal sensor operating temperature of 145 °C and a response of 28% to 100 ppm butanone vapor. Not only can butanone vapor be detected at 63 ppb but also the ternary ZnO-TiO2-rGO nanomaterials have better selectivity than ZnO, TiO2, and ZnO-TiO2 nanomaterials. Therefore, the experimental results show that the ZnO-TiO2-rGO sensor has better sensing performance to butanone vapor.
Author Contributions
Conceptualization, F.M.; methodology, Z.L. and F.M.; validation, Y.Y., F.M.; formal analysis, Z.Y. and Y.Y.; investigation, Z.L.; resources, F.M.; data curation, Z.Y.; writing—original draft preparation, Z.L.; writing—review and editing, Z.L.; visualization, Y.Y.; supervision, F.M.; project administration, Z.Y.; funding acquisition, F.M. All authors have read and agreed to the published version of the manuscript.
Funding
This work was supported by the National Natural Science Foundation of China (62033002, 61833006, 62071112, and 61973058), the 111 Project (B16009), the Fundamental Research Funds for the Central Universities in China (N2004019, and N2004028), the Liao Ning Revitalization Talents Program (XLYC1807198), the Liaoning Province Natural Science Foundation (2020-KF-11-04), and the Hebei Natural Science Foundation (No. F2020501040).
Institutional Review Board Statement
Not applicable.
Informed Consent Statement
Not applicable.
Conflicts of Interest
The authors declare no conflict of interest.
References
- Zhang, Q.; Xu, M.; Shen, Z.; Wei, Q. A nanostructured Cr2O3/WO3 p–n junction sensor for highly sensitive detection of butanone. J. Mater. Sci. Mater. Electron. 2017, 128, 12056–12062. [Google Scholar] [CrossRef]
- Liu, X.; Qin, X.; Ji, H.; Wang, M. An enhanced butanone sensing performance of Er0.7Yb0.3FeO3 material with the proper electronic structure. J. Alloys Compd. 2018, 772, 263–271. [Google Scholar] [CrossRef]
- Jiang, Z.; Guo, Z.; Sun, B.; Jia, Y.; Li, M.; Liu, J. Highly sensitive and selective butanone sensors based on cerium-doped SnO2 thin films. Sens. Actuators B Chem. 2010, 145, 667–673. [Google Scholar] [CrossRef]
- Xu, D.; Ge, K.; Qi, S.; Chen, Y.; Liu, Q. Hydrangea-like mesoporous WO3 nanoflowers with crystalline framework for 3-hydroxy-2-butanone sensing. Anal. Bioanal. Chem. 2020, 412, 1–8. [Google Scholar] [CrossRef] [PubMed]
- György, S.; Mihály, B. Catalytic transfer hydrogenation of 2-butanone over oxide catalysts. React. Kinet. Mech. Cat. 1999, 68, 197–205. [Google Scholar]
- Bhowmik, B.; Manjuladevi, V.; Gupta, R.; Bhattacharyya, P. Highly Selective Low-Temperature Acetone Sensor Based on Hierarchical 3-D TiO2 Nanoflowers. IEEE Sens. J. 2016, 16, 3488–3495. [Google Scholar] [CrossRef]
- Oliveira, T.; Zito, C.; Perfecto, T.; Azevedo, G.; Volanti, D. ZnO twin-rods decorated with Pt nanoparticles for butanone detection. New J. Chem. 2020, 44, 15574–15583. [Google Scholar] [CrossRef]
- Zito, C.; Perfecto, T.; Oliveira, T.; Volanti, D. Bicone-like ZnO structure as high-performance butanone sensor. Mater. Lett. 2018, 223, 142–145. [Google Scholar] [CrossRef] [Green Version]
- Zhang, Q.; Zhang, H.; Xu, M.; Shen, Z.; Wei, Q. A WO3 nanorod-Cr2O3 nanoparticle composite for selective gas sensing of 2-butanone. Chin. Chem. Lett. 2018, 29, 538–542. [Google Scholar] [CrossRef]
- Vioto, G.; Perfecto, T.; Zito, C.; Volanti, D. Enhancement of 2-butanone sensing properties of SiO2@CoO core-shell structures. Ceram. Int. 2020, 46, 22692–22698. [Google Scholar] [CrossRef]
- Shih, B.; Xue, Y.; Zhang, P.; Cohen, M.; Louie, S. Quasiparticle band gap of ZnO: High accuracy from the conventional GW approach. Phys. Rev. Lett. 2010, 105, 146401. [Google Scholar] [CrossRef]
- Qin, W.; Yuan, Z.; Gao, H.; Zhang, R.; Meng, F. Perovskite-structured LaCoO3 modified ZnO gas sensor and investigation on its gas sensing mechanism by first principle. Sens. Actuators B Chem. 2021, 341, 130015. [Google Scholar] [CrossRef]
- Vayssieres, L. Growth of Arrayed Nanorods and Nanowires of ZnO from Aqueous Solutions. Adv. Mater. 2010, 15, 464–466. [Google Scholar] [CrossRef]
- Heinlaan, M.; Ivask, A.; Blinova, I.; Dubourguier, H.; Kahru, A. Toxicity of nanosized and bulk ZnO, CuO and TiO2 to bacteria Vibrio fischeri and crustaceans Daphnia magna and Thamnocephalus platyurus. Chemosphere 2008, 71, 1308–1316. [Google Scholar] [CrossRef] [PubMed]
- Zhang, S.; Wei, S.; Zunger, A. Intrinsic N-Type Versus P-Type Doping Asymmetry and the Defect Physics of ZnO. Phys. Rev. B 2001, 63, 075205. [Google Scholar] [CrossRef] [Green Version]
- Wang, Z.; Qian, X.; Yin, J.; Zhu, Z. Large-scale fabrication of tower-like, flower-like, and tube-like ZnO arrays by a simple chemical solution route. Langmuir 2004, 20, 3441–3448. [Google Scholar] [CrossRef]
- Wang, X.; Zhou, J.; Song, J.; Jin, L.; Zhong, L. Piezoelectric Field Effect Transistor and Nanoforce Sensor Based on a Single ZnO Nanowire. Nano Lett. 2006, 6, 2768–2772. [Google Scholar] [CrossRef]
- Meng, F.; Qi, T.; Zhang, J.; Zhu, H.; Yuan, Z.; Liu, C.; Qin, W.; Ding, M. MoS2-templated porous hollow MoO3 microspheres for highly selective ammonia sensing via a Lewis acid-base interaction. IEEE Trans. Ind. Electron. 2021. Available online: https://ieeexplore.ieee.org/abstract/document/9339981/ (accessed on 2 October 2021). [CrossRef]
- Yuan, Y.; Adimi, S.; Thomas, T.; Wang, J.; Guo, H.; Chen, J.; Attfield, J.; DiSalvo, F.; Yang, M. Co3Mo3N—An efficient multifunctional electrocatalyst. Innovation 2021, 2, 40–46. [Google Scholar]
- Ji, H.; Qin, W.; Yuan, Z.; Meng, F. Qualitative and quantitative recognition method of drug-producing chemicals based on SnO2 gas Sensor with dynamic measurement and PCA weak separation. Sens. Actuators B Chem. 2021, 348, 130698. [Google Scholar] [CrossRef]
- Shao, X.; Wang, H.; Yuan, M.; Yang, J.; Zhan, W.; Wang, L.; Guo, Y.; Lu, G. Thermal stability of Si-doped V2O5/WO3–TiO2 for selective catalytic reduction of NOx by NH3. Rare Metals 2019, 38, 292–298. [Google Scholar] [CrossRef]
- Abbas, M.; Zubair, A.; Riaz, K.; Huang, W.; Zubair, M. Engineering multimodal dielectric resonance of TiO2 based nanostructures for high-performance refractive index sensing applications. Biomed. Opt. Express 2020, 28, 23509–23522. [Google Scholar] [CrossRef]
- Wang, F.; Shen, B.; Zhu, S.; Wang, Z. Promotion of Fe and Co doped Mn-Ce/TiO2 catalysts for low temperature NH3-SCR with SO2 tolerance. Fuel 2019, 249, 54–60. [Google Scholar] [CrossRef]
- Taghvaei, N.; Taghvaei, E.; Askari, M. Synthesis of Anodized TiO2 Nanotube Arrays as Ion Sieve for Lithium Extraction. ChemistrySelect 2020, 5, 10339–10345. [Google Scholar] [CrossRef]
- Wang, N.; Sun, C.; Zhao, Y.; Zhou, S.; Chen, P.; Jiang, L. Fabrication of three-dimensional ZnO/TiO2 heteroarchitectures via a solution process. J. Mater. Chem. A 2008, 18, 3909–3911. [Google Scholar] [CrossRef]
- Park, J.; Sun, W.; Lee, J.; Kim, S. Synthesis and Gas Sensing Properties of TiO2–ZnO Core-Shell Nanofibers. J. Am. Ceram. Soc. 2010, 92, 2551–2554. [Google Scholar] [CrossRef]
- Yuan, Z.; Liu, Y.; Zhang, J.; Zhang, H. Rose-like MoO3/MoS2/rGO low temperature ammonia sensors based on multi-gas detection methods. IEEE Trans. Instrum. Meas. 2021, 70, 1–9. [Google Scholar]
- Meng, F.; Li, X.; Yuan, Z.; Lei, Y.; Qi, T.; Li, J. Ppb-Level Xylene Gas Sensors based on Co3O4 Nanoparticles coated Reduced Graphene Oxide(rGO) Nanosheets Operating at Low Temperature. IEEE Trans. Instrum. Meas. 2021, 70, 1–10. [Google Scholar]
- Wu, K.; Luo, Y.; Li, Y.; Zhang, C. Synthesis and acetone sensing properties of ZnFe2O4/rGO gas sensors. Beilstein J. Nanotechnol. 2019, 10, 2516–2526. [Google Scholar] [CrossRef] [Green Version]
- Salehi, T.; Taherizadeh, A.; Bahrami, A.; Allafchian, A.; Ghafarinia, V. Towards a Highly Functional Hybrid ZnO Nanofiber-rGO Gas Sensor. Adv. Eng. Mater. 2020, 22, 2000005. [Google Scholar] [CrossRef]
- Chang, Y.; Yao, Y.; Wang, B.; Luo, H.; Li, T.; Zhi, L. Reduced Graphene Oxide Mediated SnO2 Nanocrystals for Enhanced Gas-sensing Properties. J. Mater. Sci. Technol. 2013, 29, 157–160. [Google Scholar] [CrossRef]
- Deng, S.; Tjoa, V.; Fan, H.; Tan, H.; Sayle, D.; Olivo, M.; Mhaisalkar, S.; Wei, J.; Sow, C. Reduced Graphene Oxide Conjugated Cu2O Nanowire Mesocrystals for High-Performance NO2 Gas Sensor. J. Am. Chem. Soc. 2012, 134, 4905–4917. [Google Scholar] [CrossRef] [PubMed]
- Johra, F.; Jung, W. RGO-TiO2-ZnO composites: Synthesis, characterization, and application to photocatalysis. Appl. Catal. A Gen. 2015, 491, 52–57. [Google Scholar] [CrossRef]
- Yu, H.; Zhang, B.; Bulin, C.; Li, R.; Xing, R. High-efficient Synthesis of Graphene Oxide Based on Improved Hummers Method. Sci. Rep. 2016, 6, 36143. [Google Scholar] [CrossRef] [Green Version]
- Marcano, D.; Kosynkin, D.; Berlin, J.; Sinitskii, A.; Sun, Z.; Slesarev, A.; Alemany, L.; Lu, W.; Tour, J. Improved synthesis of graphene oxide. ACS Nano 2010, 4, 4806. [Google Scholar] [CrossRef]
- Huynh, V.; Nguyen, M.; Nguyen, T.; Doan, B.; Le, T.; Dinh, N.; Nguyen, D.; Nguyen, A.; Le, M.; Hoang, M.; et al. Behavior of ZnO-doped TiO2/rGO nanocomposite for water treatment enhancement. Surf. Interfaces 2021, 23, 100950. [Google Scholar]
- Liao, D.; Badour, C.; Liao, B. Preparation of nanosized TiO2/ZnO composite catalyst and its photocatalytic activity for degradation of methyl orange. J. Mater. Chem. A 2008, 194, 11–19. [Google Scholar] [CrossRef]
- Divya, K.; Xavier, M.; Vandana, P.; Reethu, V.; Mathew, S. A quaternary TiO2/ZnO/RGO/Ag nanocomposite with enhanced visible light photocatalytic performance. New J. Chem. 2017, 10, 1039. [Google Scholar]
- Pan, X.; Yang, P.; Nan, H.; Yang, L.; Chen, H.; Zhao, X. Preparation and enhanced visible-light photoelectrocatalytic activity of ternary TiO2-ZnO/RGO nanocomposites. Electrochim. Acta 2018, 261, 284–288. [Google Scholar] [CrossRef]
- Rakkesh, R.; Balakumar, S. Facile synthesis of ZnO/TiO2 core-shell nanostructures and their photocatalytic activities. J. Nanosci. Nanotechnol. 2013, 13, 370–376. [Google Scholar] [CrossRef]
- Yang, D.; Velamakanni, A.; Bozoklu, G.; Park, S.; Stoller, M.; Piner, R.; Stankovich, S.; Jung, I.; Field, D.; Ventrice, C.; et al. Chemical analysis of graphene oxide films after heat and chemical treatments by X-ray photoelectron and Micro-Raman spectroscopy. Carbon 2009, 47, 145–152. [Google Scholar] [CrossRef]
- Nurdiansah, H.; Susanti, D.; Firlyana, R.; Purwaningsih, H. Effect of rGO Addition Toward Photocatalyst Properties of ZnO/rGO/TiO2 for Rhodamine B Degradation. Mater. Sci. Forum 2019, 964, 174–179. [Google Scholar] [CrossRef]
- Huong, N.; Dat, N.; Thinh, D.; Anh, T.; MinhNguyet, D.; Quan, T.; Long, P.; Nam, H.; Phong, M.; Hieu, N. Optimization of the antibacterial activity of silver nanoparticles-decorated graphene oxide nanocomposites. Synth. Met. 2020, 268, 116492. [Google Scholar] [CrossRef]
Publisher’s Note: MDPI stays neutral with regard to jurisdictional claims in published maps and institutional affiliations. |
© 2021 by the authors. Licensee MDPI, Basel, Switzerland. This article is an open access article distributed under the terms and conditions of the Creative Commons Attribution (CC BY) license (https://creativecommons.org/licenses/by/4.0/).