Abstract
Chrysanthemum, a traditional medicinal and edible plant, possesses diverse health-promoting properties attributed to its rich profile of bioactive compounds. However, the intrinsic quality, influenced by the composition of fundamental components like starch and lignin, varies significantly across different cultivars and origins. This study establishes a comprehensive phytochemical profile of 12 representative Chinese chrysanthemum cultivars by systematically quantifying their starch and lignin contents. Furthermore, it develops and validates a novel, low-cost rapid detection method for starch utilizing smartphone-based colorimetry. The starch content, determined by a colorimetric anthrone-sulfuric acid assay, ranged from 2.68 to 18.69 g/100 g, while the lignin content, measured via the acetyl bromide digestion followed by UV spectrophotometry at 280 nm, varied from 4.21 to 13.63 g/100 g, revealing substantial inter-cultivar differences. For starch analysis, a low-cost, immediate, general-purpose, and high-throughput (LIGHt) smartphone-based colorimetry was implemented. Standard curves constructed from both absorbance and the LIGHt assay demonstrated excellent linearity (R2 > 0.99). The method’s performance was evaluated under different lighting conditions and across various smartphone models. The UV spectrophotometry condenses lignin quantification to a single 30-min digestion–reading cycle, bypassing the two-day Klason protocol and increases efficiency greatly. The work successfully provides a foundational component analysis and validates a portable, high-throughput framework for on-site quality control of plant-based products, demonstrating the strong potential of smartphone-based colorimetry for rapid starch detection and a complementary laboratory-scale lignin assay.
1. Introduction
Chrysanthemum is a traditional Chinese medicinal herb with a cultivation and application history of over three thousand years for its ornamental, medicinal, and edible properties. It exhibits excellent physiological functions such as antioxidant and anti-inflammatory effects. In recent years, significant progress has been made in research on chrysanthemum in diverse areas of health research. Firstly, due to its abundance of active components like flavonoids, volatile oils, and polysaccharides, chrysanthemum exhibits strong antioxidant capacity, effectively scavenging free radicals and protecting cells from oxidative damage [1]. Secondly, its anti-inflammatory effects are equally remarkable; flavonoids and volatile oils can inhibit inflammatory responses and reduce the release of inflammatory mediators, thereby exerting significant anti-inflammatory effects. In terms of eye protection, compounds such as flavonoids, vitamin C, carotenoids, and lutein in chrysanthemum not only provide antioxidant and anti-inflammatory benefits but also protect retinal cells, alleviating eye fatigue and dryness. Additionally, studies have confirmed the hepatoprotective effects of chrysanthemum, as its extracts can mitigate liver damage and improve liver function, particularly in cases of hyperuricemia and alcohol-induced liver injury. Beyond these areas, chrysanthemum also demonstrates various other health benefits, including antihypertensive, antitumor, anti-fatigue, and antimicrobial properties.
The fundamental nutritional components, such as starch and lignin, hold significant implications for the quality and geographical origin of chrysanthemums. This is primarily related to their physiological functions, influence on plant traits, and potential as indicators for quality evaluation [2]. Starch serves as a crucial energy reserve in plants, and its content is closely associated with the growth, development, and stress resistance of chrysanthemums [3]. In chrysanthemums, starch accumulation is influenced by multiple factors, including nocturnal low-temperature treatment, which can significantly enhance starch accumulation [3]. Lignin, an essential structural component of plant cell walls, provides mechanical strength, structural support, and resistance to pests and diseases. The lignin content in chrysanthemums directly affects stem rigidity, lodging resistance, and postharvest quality [4]. Furthermore, lignin biosynthesis is regulated by various transcription factors. For instance, overexpression of CmMYB15 has been shown to enhance aphid resistance and increase lignin content in chrysanthemums [5]. While the detailed standards and research on precise starch and lignin content for quality metrics in chrysanthemum teas are less frequently highlighted as primary quality control parameters compared to bioactive compounds or contaminants, their presence is implicitly understood as part of the plant’s structural composition as indicated above. However, the composition and content of active compounds in chrysanthemum vary significantly depending on the origin and variety, directly influencing its quality and medicinal value. For instance, ‘Jinsihuangju’ may exhibit higher levels of flavonoids and trace elements [6], while ‘Huangju’ may be more notable for specific effects, such as clearing the liver and improving vision.
A variety of established procedures exist for starch quantification in real matrices, each offering distinct benefits and tailored applications. These methods can be primarily classified into iodine staining, enzymatic hydrolysis, near-infrared spectroscopy, and high-performance liquid chromatography based on their principles and application scenarios [7]. The enzymatic hydrolysis method involves multiple operation steps, is time-consuming, and requires high enzyme purity and activity, and sample pretreatment (such as grinding, gelatinization) significantly affects the results [8]. The near-infrared spectroscopy and high-performance liquid chromatography methods offer higher accuracy and can provide detailed information about starch molecular weight and structure [9], but their drawbacks include the need for specific instruments and complex and time-consuming operations, and these do not meet the requirements for on-site testing. Among these methods, the iodine assay remains the most frequently adopted because of its straightforward protocol and consistent performance [10,11]. The principle is that when iodine binds to the helical structure of starch, a visible color shift is generated, producing the characteristic blue-black coloration. Nevertheless, the assay lacks absolute specificity; glucosyl oligomers such as maltodextrins can trigger the same chromogenic response, leading to potential false positives [10].
For detecting lignin content, a number of standard protocols are available, each selected according to the substrate and the required level of sensitivity. The Klason lignin protocol, which applies acid-insoluble residue gravimetry after 72% sulfuric acid hydrolysis, remains the benchmark for total lignin determination. However, it is labor-intensive and time-consuming. Specifically, a single full Klason lignin determination, including extractives removal, acid hydrolysis, filtration, drying and ashing, etc., typically requires two working days [12]. Alternatively, the acetyl bromide (AcBr) spectrophotometric method is among the most common: lignin is solubilized in AcBr/acetic acid, reacted at 70 °C for 30 min, and the absorbance at 280 nm is directly proportional to lignin concentration [13]. This procedure is rapid, requires only milligram-scale samples, and provides good reproducibility across herbaceous and woody tissues. Recently, derivatization followed by reductive cleavage (DFRC) and thioacidolysis have gained popularity for characterizing lignin monomer composition, but these techniques demand specialized equipment and derivatization steps. Consequently, the AcBr assay is routinely chosen for high-throughput quantification, whereas Klason or thioacidolysis is reserved for complementary structural information.
The evolution of smartphones from simple communication devices to powerful analytical tools has been marked by continuous improvements in processing capabilities, camera quality, and sensor technology. The smartphone’s potential in chemical and biochemical analysis is increasingly being recognized [14,15]. In controlled environment agriculture, smartphone-based image analysis technology has also been successfully applied to measure plant growth characteristics, enabling non-destructive measurement of growth features in various common crops through processing images captured by smartphones [16]. Barman et al. [17] proposed a novel method combining improved contact imaging technology with machine learning algorithms for estimating chlorophyll content using smartphone contact images. For chlorophyll content prediction in algal blooms, RGB image analysis has also been utilized, providing an innovative and economical method to estimate the spatial and temporal distribution of chlorophyll in aquatic environments [18]. Our previous work demonstrated that morphological features of Chinese chrysanthemum teas captured by a smartphone and analyzed by deep-learning computer vision could be used for the rapid identification of tea types and flowering stages [19]. A comprehensive overview of visual food sensing strategies was recently provided by Milzi et al. [20]. In this study, smartphone-based colorimetric platforms were reported to be driven by RGB/CIE image processing, natural or engineered functional dyes, and nanomaterials that detect pH, volatile organic compounds (VOCs), contaminants and nutrients in real time, establishing smartphone colorimetry as a mature technology field. In our previous works, a unified colorimetric approach featuring low-cost, immediate, general-purpose, and high-throughput (LIGHt) smartphone colorimetric screening assay for the detection of total soluble protein and starch content has been developed [21,22]. As illustrated in Figure 1, the central goal of LIGHt is to improve the efficiency and throughput of colorimetric assay, while no specialized instruments are required. The LIGHt smartphone colorimetry has been shown useful in quality control applications in the plant-derived products such as tobacco leaves, and offers a promising tool for on-site production quality testing. Having previously established the LIGHt framework for starch detection in tobacco leaves [22], this study sought to evaluate its generalizability and robustness for the analysis of a complex matrix of medicinal plants, specifically Chinese chrysanthemum teas.
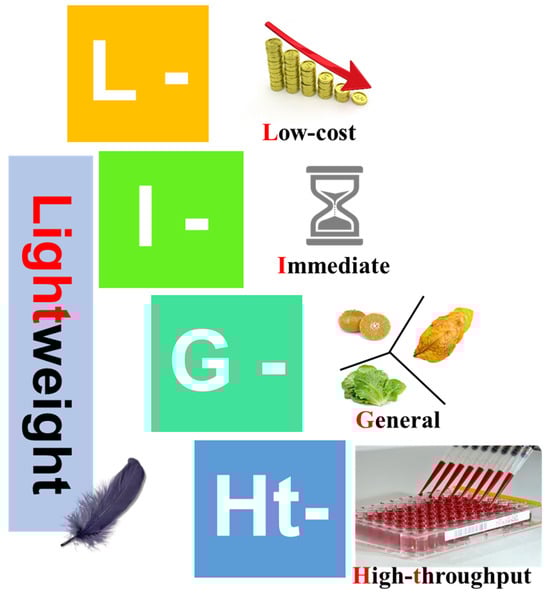
Figure 1.
The design principle of the low-cost, immediate, general-purpose, and high-throughput (LIGHt) smartphone-based colorimetry. LIGHt smartphone colorimetry delivers (i) low-cost (L in the acronym) quantification using only a phone camera and cheap consumables, (ii) immediate (I) on-site results, (iii) general (G) applicability to any chromogenic analyte via reagent swapping, and (iv) high-throughput (Ht) analysis of batch samples per image, matching microplate-reader output.
This study aims to systematically quantify and compare the starch and lignin content in 12 representative Chinese chrysanthemum teas using both UV spectrophotometry for lignin and the emerging smartphone colorimetric method for starch. The study will provide solid evidence of applying colorimetric method and UV spectrophotometry for low-cost, rapid assay in the experimental and industrial sectors. The term “rapid” in this context refers specifically to the post-preparation analytical workflow. While quantitative biochemical analysis necessitates initial sample homogenization and chemical extraction, our method accelerates the subsequent detection and data analysis phase. This approach contrasts with computer vision techniques for direct product identification [19], which require minimal preparation but do not yield quantitative chemical data. By utilizing smartphone imaging and automated RGB analysis of microplate wells, it provides an instantaneous analytical alternative to instrument-dependent methods like the multi-day Klason lignin assay and conventional manual spectrophotometer analysis.
2. Materials and Methods
2.1. Sample Information and Pretreatment
A total of 12 different cultivars of chrysanthemum were purchased. All samples were produced in 2025 in major chrysanthemum tea producing areas of China. Detailed sample information is provided in Table 1. The sampleswere sequentially ground to powder for 20 s each using a commercial kitchen grinder. The resulting powders were then separately collected in sealed bags and stored at 4 °C in a refrigerator for subsequent analysis.

Table 1.
Sampling Information of Chrysanthemum Teas.
2.2. Materials and Reagents
All reagents utilized in this experimental study were purchased from their respective suppliers. Specifically, the soluble starch standard was obtained from Aladdin Biochemical Technology Co., Ltd. (Shanghai, China), and analytical grade ethanol was obtained from Sinopharm Chemical Reagent Co., Ltd. (Beijing, China). Additionally, 98% (w/w) concentrated sulfuric acid (analytical grade) and 72% (w/w) perchloric acid (analytical grade) were also sourced from Sinopharm Chemical Reagent Co., Ltd. The anthrone, AcBr, and the lignin (de-alkali) standard were procured from Macklin Biochemical Technology Co., Ltd. (Shanghai, China). Glacial acetic acid (analytical grade) and hydroxylamine hydrochloride were supplied by Merrier Chemical Technology Co., Ltd. (Shanghai, China). Sodium hydroxide (NaOH) and sodium chloride (NaCl) were purchased from Lingfeng Chemical Reagent Co., Ltd. (Shanghai, China). All the reagents were of analytical grade purity and used without further purification. The ultrapure water was made by a Milli-Q 10 benchtop lab water purification system (Merck KGaA, Darmstadt, Germany).
The anthrone-sulfuric acid solution was prepared by measuring 500 mL of 88% (w/w) concentrated sulfuric acid in a 500 mL beaker, followed by adding 2 g of anthrone powder and mixing to homogeneity. To ensure consistency, the anthrone-sulfuric acid solution was freshly prepared immediately before each experiment. The 52% (w/w) and 40% (w/w) perchloric acid solutions were prepared as follows: For the 52% solution, 100 mL of distilled water was precisely measured into a 500 mL beaker, and 260 mL of 72% (w/w) perchloric acid was slowly added with continuous stirring using a glass rod to dissipate heat. For the 40% solution, 160 mL of distilled water was measured into a 500 mL beaker, and 200 mL of 72% (w/w) perchloric acid was slowly added under constant stirring. The 80% (w/w) ethanol-saturated NaCl solution was prepared by dissolving 16 g of NaCl in 50 mL of distilled water within a 300 mL beaker using a glass rod. Subsequently, 200 mL of absolute ethanol was added. The solution became turbid upon ethanol addition. After standing for a period, the solution was allowed to partially precipitate, the clarified supernatant was filtered for use.
To prepare the 30% (w/w) AcBr-glacial acetic acid solution, 140 mL of glacial acetic acid was added in a 500 mL beaker. Subsequently, 60 mL of AcBr solution was accurately measured and slowly added to the beaker containing the glacial acetic acid. The mixture was stirred continuously with a glass rod to ensure thorough homogenization. The entire procedure was conducted inside a fume hood.
2.3. Preparation of Starch Standard Curve
Two hundred milligrams of soluble starch standard were weighed into a 100 mL beaker. Five milliliters of distilled water were added, followed by the addition of 65 mL of 52% (w/w) perchloric acid. Subsequently, 30 mL of distilled water were added, and the mixture was stirred with a glass rod until the starch was completely dissolved. One milliliter of this solution was then pipetted into a 50 mL centrifuge tube, and 24 mL of distilled water were added and mixed thoroughly to obtain a starch stock solution with a concentration of 80 μg/mL. This starch standard solution was prepared fresh for each experiment. A series of standard solutions with concentration gradients of 0–80 μg/mL at a 20 μg/mL interval were prepared by diluting appropriate volumes of the 80 μg/mL starch stock solution with distilled water. All standards and samples were prepared and tested in triplicates.
To account for variations in imaging conditions and ensure the robustness of the smartphone-based quantification, our method implements simultaneous physical calibration rather than relying on a posteriori software correction. Specifically, for each experimental run, a set of calibration standards was prepared and co-imaged on the same microplate as the unknown samples. This guarantees the calibration curve used for quantification is generated under the exact same lighting conditions, sensor response, and imaging geometry as the test samples. This approach inherently normalizes for device-specific characteristics (e.g., sensor spectral sensitivity) and environmental variables (e.g., ambient light fluctuations), making the calibration intrinsically tied to the specific conditions of each measurement batch.
2.4. Data Processing
The majority of digital images on consumer devices like smartphones and computers are stored as raster graphics. In this format, each picture element (pixel) is defined by its Red (R), Green (G), Blue (B) values. These values are integers between 0 and 255, representing the intensity of each primary color channel, where 0 signifies the absence and 255 denotes the full intensity of that color. Following this, we developed a computer software tool using Python (version 3.9, Python Software Foundation) that uses OpenCV (Open-Source Computer Vision Library) version 4.7.0.68 to calculate the mean R, G, and B values from the selected areas. No software-based illumination correction or white balance algorithm was applied to the raw RGB data. The absorbance and RGB data of the aforementioned series of standard solutions were measured. A standard curve was plotted with starch/lignin concentration as the abscissa and the corresponding absorbance or the red channel value (R-value) from the RGB data as the ordinate. The CIE 1931 chromaticity diagram were plotted by an in-house script written in MATLAB R2025b (The MathWorks, Natick, MA, USA).
2.5. Rapid Detection Method for Starch Content in Chrysanthemum
Approximately 0.2 g of chrysanthemum powder was accurately weighed into a 50 mL centrifuge tube. Then, 10 mL of an 80% (w/w) ethanol-saturated NaCl solution was added, and the mixture was ultrasonicated at room temperature for 5 min using a KH7200 sonicator (Hechuang Ultrasonic Instrument Co., Ltd., Kunshan, Jiangsu, China). The extraction supernatant was discarded. The residue was washed with 2 mL of the same 80% (w/w) ethanol-saturated NaCl solution, and the washing solution was also discarded. Subsequently, 5 mL of distilled water and 25 mL of 52% (w/w) perchloric acid solution were added to the tube. The mixture was centrifuged at 4000 r/min for 5 min to obtain the starch extract.
For the detection assay, 50 μL of the sample extract was pipetted into a 10 mL centrifuge tube and diluted with 1950 μL of distilled water. Then, 6 mL of the freshly prepared anthrone-sulfuric acid solution was added all at once to the tube. The mixture was vortexed thoroughly and then incubated in a hot water bath for 5 min. After cooling to room temperature, the solution was subjected to subsequent absorbance and smartphone RGB detection.
The solution in the centrifuge tube was mixed thoroughly. From each sample, 200 μL was aliquoted into wells of a 96-well microplate (Nunc MicroWell transparent plate, Thermo Fisher Scientific, Waltham, MA, USA). The absorbance was first measured at a wavelength of 620 nm using an Infinite M1000 Pro microplate reader (Tecan Group Ltd., Männedorf, Switzerland). Following the absorbance measurement, the LIGHt smartphone-based colorimetry was operated following the previously reported protocols [21,22]. Specifically, the microplate was placed directly on the screen of an iPad for smartphone RGB colorimetric analysis. RGB values were acquired by photographing directly above the microplate using an iPhone 16 smartphone (Apple Inc., California, CA, USA) under both bright and dim lighting conditions, maintaining a consistent focal length of 50 mm for all images. The “Bright” condition (approx. 600 Lux) was achieved with ordinary laboratory ceiling lights on and window shades open. The “Dim” condition (approx. 3 Lux) was created by turning off all ceiling lights and closing window shades to mimic a darkroom-like light-sensitive laboratory environment. The microplate was placed on a planar light source. In this experiment, an iPad (Model A2152, Apple Inc.) was used as the light source with a pure white image displayed and the brightness adjusted to the highest level. This approach provides a controlled yet highly accessible environment for reproducible color analysis. In addition, all image capture was done by handheld smartphones without any fixed mounting stand. The handheld approach was specifically implemented to validate the method’s field-applicability and robustness under practical testing conditions. Despite handheld positioning, standardized imaging parameters including consistent focal length (50 mm) and shooting height ensured measurement reproducibility. The use of standardized 96-well microplate format provides inherent geometric consistency that minimizes angular variation.
2.6. Comprehensive Evaluation of Smartphone Colorimetry Performance Under Different Conditions
During the smartphone colorimetric detection phase, the assessment was expanded to evaluate the influence of different lighting environments and smartphone models on the method’s performance. In addition to the initial protocol using an iPhone 16 (Apple Inc.) to capture images from directly above the microplate, two additional devices were employed under identical conditions: an iPhone 14 (Apple Inc.) and an iQOO Z9 Turbo smartphone (Vivo Mobile Communication Co., Ltd., Shenzhen, Guangdong, China). All images were captured using a standardized 50 mm focal length and consistent handheld shooting height to evaluate the method’s robustness under practical, field-applicable conditions. This comparative approach was designed to systematically assess the impact of ambient lighting during image capture and the variation between different smartphone cameras, thereby validating the robustness and general applicability of the smartphone colorimetry method.
2.7. Preparation of Lignin Standard Curve
The entire procedure was conducted inside a fume hood. Twenty milligrams of de-alkalized lignin was weighed into a 15 mL plastic centrifuge tube. Ten milliliters of the 30% AcBr-glacial acetic acid solution were added, and the mixture was digested in a 50 °C water bath for 2 h, with thorough mixing every 30 min. After cooling, the digest was centrifuged at 3000 g for 15 min to obtain a 2 mg/mL de-alkalized lignin stock digest solution. Separately, a blank digest was prepared by adding 10 mL of the 30% AcBr-glacial acetic acid solution to an empty centrifuge tube and subjecting it to the same processing steps.
A series of mixed digest solutions with gradient concentrations of 0 to 2 mg/mL with a 0.4 mg/mL interval were prepared by blending the 2 mg/mL lignin stock digest solution with the blank digest solution in appropriate proportions. Subsequently, 0.5 mL aliquots from each of these mixed digest solutions were transferred into separate test tubes. Each aliquot was then treated by sequentially adding 6.5 mL of glacial acetic acid and 2.0 mL of 0.3 mol/L sodium hydroxide solution, mixing the contents after each addition. Finally, 1.0 mL of a 0.5 mol/L hydroxylamine hydrochloride solution was added to each tube, followed by another mixing step, resulting in six distinct lignin standard solutions.
The absorbance of this series of gradient concentration lignin standard solutions was measured by a UV-1800 UV-Vis spectrophotometer (Shimadzu Corporation, Kyoto, Japan). A standard curve was constructed by plotting the lignin concentration (x) on the abscissa against the corresponding absorbance (y) on the ordinate. All standards and samples were prepared and tested in triplicates.
2.8. Determination of Lignin Content in Chrysanthemum
Sixty milligrams of chrysanthemum powder was accurately weighed into a 15 mL plastic centrifuge tube. Ten milliliters of 30% AcBr-glacial acetic acid solution was added. The mixture was digested according to the same protocol as the standards. A 0.5 mL aliquot of this digest solution was transferred into a test tube containing 6.5 mL of glacial acetic acid and 2.0 mL of 0.3 mol/L NaOH. The contents were mixed thoroughly. Subsequently, 1.0 mL of 0.5 mol/L hydroxylamine hydrochloride solution was added, and the tube was mixed again. The absorbance of all solutions was measured at a wavelength of 280 nm using a UV spectrophotometer.
3. Results and Discussion
Table 2 presents the standard curves obtained using three comparative test methods. Their corresponding standard curves are also shown in Figure 2. In Table 2, the first and second rows display the standard curves derived by extracting the R-value after capturing images from directly above the 96-well microplate containing the standard solutions with a smartphone camera under bright and dim lighting conditions, respectively. The first row represents the absorbance measurement results obtained by a microplate reader. All three methods yielded comparable and consistent performances according to their good linearity. Besides, it is noteworthy that while the absorbance values of the stained starch standard solutions increased with rising starch concentration, the corresponding R-values decreased. Both relationships demonstrated linear trends with excellent goodness-of-fit (R2 > 0.99). Visual observation of Figure 3, showing increasing starch concentrations from left to right, confirmed that the actual solution color exhibited a gradual reduction in red intensity with increasing starch concentration, consistent with the trend observed in the R-values.
Table 2.
Standard Calibration Curve Equations for the Absorbance Method and Smartphone Colorimetric Method.
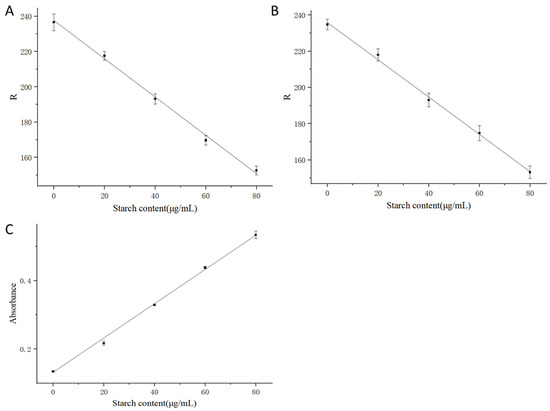
Figure 2.
Standard Curves in Starch Quantification for RGB Colorimetry—Bright Lighting (A), RGB Colorimetry—Dim Lighting (B), and Absorbance (C).
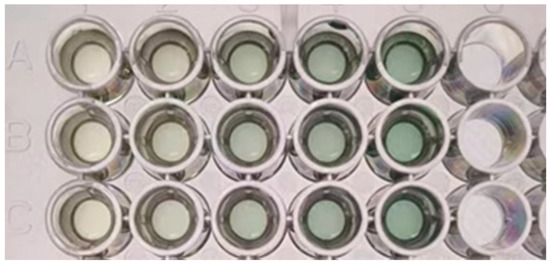
Figure 3.
Stained Starch Standard Solution Pending for Colorimetric Analysis. (A–C) parallel experimental groups with experiments.
3.1. Starch Content in Chrysanthemum Samples
According to the absorbance detection results presented in Table 3, the starch content of the 12 chrysanthemum samples ranged from 2.68 to 18.69 g/100 g, with relative standard deviations (RSDs) between 2.26% and 7.84%. Within each measurement methods, concentration means not sharing the same lowercase letter are significantly different (p < 0.05). This indicates that the developed rapid detection method for starch content performed well for the chrysanthemum samples. Additionally, the LIGHt colorimetric method was employed under both bright and dim lighting conditions, using a consistent 50 mm focal length. The starch content determined under bright light ranged from 3.80 to 19.86 g/100 g dry weight (RSDs: 2.26–12.28%), while the results under dim light ranged from 2.99 to 18.75 g/100 g dry weight (RSDs: 1.43–7.68%). The low RSD values achieved despite the handheld approach demonstrate a degree of inherent robustness in the colorimetric method. The standardized microplate format and consistent imaging parameters help compensate for potential minor variations in user positioning. However, the higher variance observed in specific samples under bright light suggests that the handheld technique is most susceptible to error when ambient lighting conditions are suboptimal and interact with highly concentrated samples. For future applications requiring the highest possible precision, or when analyzing samples with very high or low analyte concentrations, the use of a simple, low-cost mounting stand is recommended to eliminate user stability as a variable entirely.
Table 3.
Starch Content in Twelve Chrysanthemum Tea Cultivars.
Regarding the specific impact of lighting conditions on RGB colorimetry, significant differences (p < 0.05) were observed between the colorimetry results and the absorbance results for the HT group under both bright and dim light. Furthermore, a highly significant difference (p < 0.01) was found for the LY group under bright light. No significant differences were detected between the colorimetry and absorbance methods for the remaining sample groups. When directly comparing the results from bright versus dim light conditions, no significant differences (p > 0.05) were caused by the lighting environment itself. The results for samples with high starch content, such as GJ, BJ, and HT, showed significant deviations between the smartphone and spectrophotometer methods. This indicates that for high-concentration samples, the smartphone method may exhibit reduced accuracy. This is likely because the intense color of the solution leads to R-values that fall near the lower detection limit of the sensor’s dynamic range, where the signal-to-noise ratio is less favorable and the method is more susceptible to matrix interference. Based on the deviations observed for concentrations exceeding 10 g/100 g dry weight in the original extract, a 1:1 dilution with water is advised prior to RGB measurement for higher accuracy. This step brings the color intensity and corresponding R-value back into the optimal linear range of the smartphone sensor, thereby preserving measurement accuracy for high-starch samples. The large deviation for the LY group under bright light could be due to its very low starch content, resulting in a faintly colored solution after staining, which is more susceptible to interference from other light sources in bright environments, reducing accuracy. In contrast, the colorimetry results under dim light were very close to the absorbance results. The results not only confirm the feasibility of the LIGHt method, as previously shown, but also delineate its performance boundaries when applied to a diverse set of chrysanthemum cultivars, revealing specific considerations for samples with exceptionally high or low analyte concentrations.
3.2. Influence of Different Environments and Smartphones on the Smartphone Colorimetric Method
LIGHt smartphone colorimetry is designed to deliver robust, device-independent colorimetric measurements, making it essential to evaluate and calibrate each smartphone-based detection platform so that external sources of variation can be reduced. Consistency and accuracy must therefore be verified across different smartphone models and lighting environments. To quantify the influence of light control and camera hardware, three different smartphones were used to measure the RGB values under both bright and dim lighting conditions, maintaining a uniform 50 mm focal length and handheld shooting height. The colorimetry results obtained under dim light showed significant differences (p < 0.05) for the HT and GJ groups compared to the other methods but revealed no differences for the remaining 10 chrysanthemum samples. Data from Table 4 indicates that GJ and HT had the highest and second-highest starch contents, respectively, among the 12 samples. Therefore, the observed discrepancies in the colorimetry results likely resulted from the high starch content produced intensely colored solutions after staining, potentially exceeding the optimal detection range of the smartphone cameras. This suggests that for samples with high starch concentration, further dilution may be necessary to ensure the solution color falls within the smartphones’ optimal detection performance range.
Table 4.
Comparative Performance of RGB Detection Across Three Smartphone Models.
To visually contextualize the colorimetric results within a standardized color space, the chromaticity coordinates of all sample solutions were plotted on the CIE 1931 chromaticity diagram (Figure 4). This diagram provides a device-independent representation of color perception, where the x and y coordinates describe the chromaticity (hue and saturation) independent of luminance. The data points form three tight clusters corresponding to the three smartphones used, with almost no overlap between. All clusters are located in the central yellow, green, and red region of the diagram, confirming that the colorimetric reactions consistently produce solutions within a narrow and well-defined chromaticity range. The presence of separate, device-specific clusters indicates a consistent and systematic difference in how each device interprets the same physical color. Crucially, within each device’s own cluster, the primary variable is the variance in color intensity, not a shift in hue. Therefore, while a spectrophotometer measures absorbance at specific wavelengths, the smartphone-based method quantifies the device-specific RGB intensity changes, which correlate robustly with analyte concentration after accounting for these systematic inter-device differences.
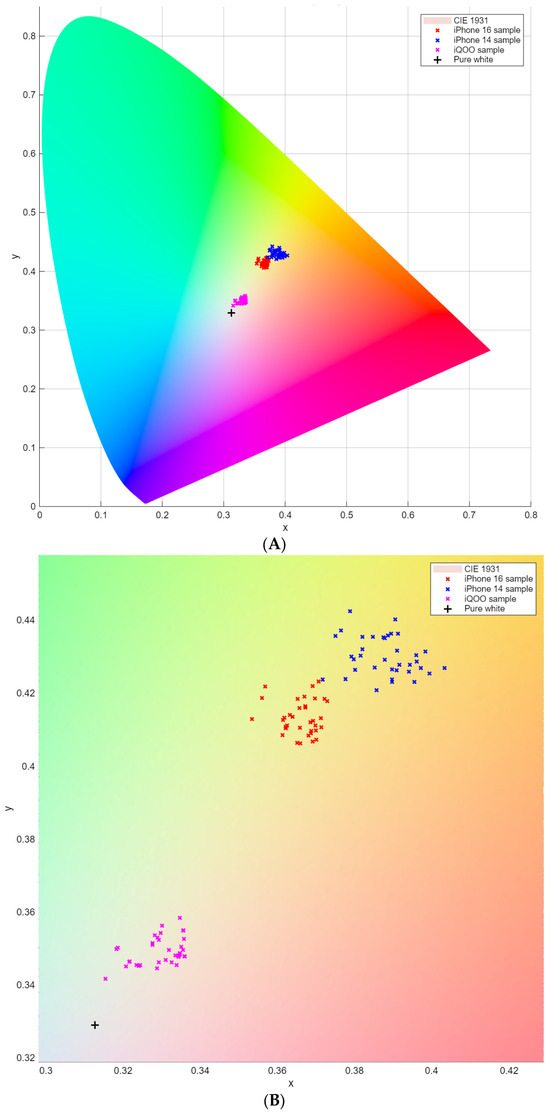
Figure 4.
CIE 1931 Chromaticity Diagram of LIGHt Smartphone Colorimetric Analysis. Both the color gamut (A) and the enlarged view of the smartphone samples (B) are presented.
3.3. Lignin Content in Chrysanthemum Samples
The standard curve for lignin measurement is presented in Figure 5. The equation for chrysanthemum lignin quantification using the absorbance method was y = 24.917x + 0.0553, where y represents the absorbance and x represents the lignin concentration in mg/mL. It can be concluded that the colorimetric method demonstrated an excellent linear correlation, with a correlation coefficient (R2) of 0.9991, across a concentration range of 0.02 to 0.10 mg/mL.
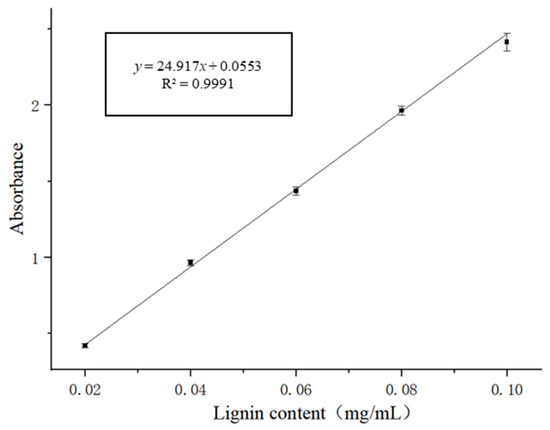
Figure 5.
Standard Curve for Lignin Measurement.
According to the detection results in Table 5, the lignin content of the 12 chrysanthemum samples ranged from 4.21 to 13.63 g/100 g, where concentration means not sharing the same lowercase letter are significantly different (p < 0.05). Sample KLM exhibited the highest content, while LY showed the lowest. The relative standard deviations (RSDs) ranged between 1.31% and 5.17%, indicating that the developed rapid detection method for lignin content performs reliably for chrysanthemum samples. Since this method detects lignin at its maximum absorption wavelength of 280 nm, which falls within the non-visible ultraviolet region, it is not suitable for the colorimetry detection method developed earlier for starch.
Table 5.
Lignin Content in Chrysanthemum Samples.
The significant variation in lignin content (4.21–13.63 g/100 g) observed in this study is not coincidental. It profoundly reflects the cumulative outcome of multiple interacting factors, including different chrysanthemum genotypes, cultivation environments, harvest periods, and post-harvest processing methods, on the final metabolic profile. For instance, KLX and KLM, originating from Xinjiang, exhibited lignin contents distinctly different from those of traditional medicinal chrysanthemums from the coastal areas of China, such as HB and BJ. This divergence is highly likely attributable to their unique species origin and genetic background. Lignin is a crucial structural component of the plant cell wall, and its biosynthesis is often induced by environmental stresses such as drought and low temperatures. The higher lignin content observed in KLX and KLM, which grow in the high-altitude geographical environment with high-UV exposure of Xinjiang, may represent a physiological adaptation to these extreme conditions.
This study systematically analyzed the starch and lignin contents in 12 chrysanthemum cultivars, delineating the compositional differences among them and validating the feasibility of using smartphone colorimetry for starch detection. The results demonstrate that the colorimetry method shows no significant difference from the standard method in most cases, indicating promising application potential. Furthermore, they provide a novel, low-cost, and rapid detection framework for other analytical methods based on colorimetric principles. For starch detection, it showed comparable performance to results by specialized instruments. For determination of lignin content, the proposed approach avoids cumbersome manual operations for individual samples and several days of time requirement in the traditional Klason lignin protocol. Beyond validating a previously published method, this work provides a comprehensive phytochemical profile of chrysanthemum teas and demonstrates the successful transfer and broader application of a low-cost, high-throughput analytical technology to a new domain of food and medicinal product quality control. The successful application of the LIGHt method to chrysanthemum tea, a matrix rich in water-soluble flavonoids and phenolic acids, confirms its robustness and generalizability. This transferability demonstrated the protocol’s effectiveness in mitigating a distinct class of matrix interferences. Furthermore, the systematic validation across multiple devices and environments, combined with the complementary use of UV spectrophotometry for lignin, establishes a more practical analytical framework than previously reported. However, it is noteworthy that when analyzing samples with high starch content, appropriate dilution may be necessary to ensure optimal performance of the smartphone colorimetric assay.
Author Contributions
Conceptualization: W.L. (Weiying Lu); methodology: W.L. (Wenchen Li) and W.L. (Weiying Lu); software: W.L. (Weiying Lu); formal analysis: W.L. (Wenchen Li); writing—original draft preparation: W.L. (Wenchen Li); writing—review and editing: W.L. (Weiying Lu). All authors have read and agreed to the published version of the manuscript.
Funding
This research received no external funding.
Data Availability Statement
All data associated with this study were included in this article.
Acknowledgments
We thank the anonymous reviewers for their constructive comments and suggestions, which have significantly improved the quality of this manuscript. We also gratefully acknowledge Caoyu Guo from the Department of Food Science and Technology, School of Agriculture and Biology, Shanghai Jiao Tong University, for his technical assistance in measuring the ambient illuminance for this study.
Conflicts of Interest
The authors declare no conflicts of interest.
References
- Xu, X.; Wang, L.; Wu, G.; Li, X. Therapeutic effects of chlorogenic acid on allergic rhinitis through TLR4/MAPK/NF-κB pathway modulation. Biomol. Biomed. 2025, 25, 1571–1580. [Google Scholar] [CrossRef] [PubMed]
- Yu, Z.; Xing-Fu, C.; Yuan-Feng, Z.O.U.; Jie, M.; Wen-Yu, Y.; Yu, J. Effects of different altitudes on plant growth and quality of chrysanthemum at high altitude. Guihaia 2015. [Google Scholar] [CrossRef]
- Kjær, K.H.; Thorup-Kristensen, K.; Rosenqvist, E.; Aaslyng, J.M. Low night temperatures change whole-plant physiology and increase starch accumulation in Chrysanthemum morifolium. J. Hortic. Sci. Biotechnol. 2007, 82, 867–874. [Google Scholar] [CrossRef]
- Jiang, L.; Wang, X.; Geng, Z.; Wang, Y.; Liu, L.; Wang, T.; Yu, J.; Li, M.; Zhao, X. Autopolyploidy enhances agronomic traits and active ingredients in ‘Huaibai’, a top-grade medicinal chrysanthemum. Plant Cell Tissue Organ. Cult. 2022, 151, 433–442. [Google Scholar] [CrossRef]
- An, C.; Sheng, L.; Du, X.; Wang, Y.; Zhang, Y.; Song, A.; Jiang, J.; Guan, Z.; Fang, W.; Chen, F.; et al. Overexpression of CmMYB15 provides chrysanthemum resistance to aphids by regulating the biosynthesis of lignin. Hortic. Res. 2019, 6, 84. [Google Scholar] [CrossRef] [PubMed]
- Lin, W.; Yu, F.; Wenwu, Y.; Ze, H. Antioxidant and anti-inflammatory activities of four kinds of Huangshan chrysanthemum. J. Pharm. Pract. Serv. 2023, 41, 325–328. [Google Scholar] [CrossRef]
- Wei, X.; Li, F.; Liu, Y.; Li, S.; Liu, Y.; Dong, D. Research progress on techniques for quantitative detection of starch in food in the past five years. Agric. 2025, 15, 1250. [Google Scholar] [CrossRef]
- Liu, K.; Han, J. Enzymatic method for measuring starch gelatinization in dry products in situ. J. Agric. Food Chem. 2012, 60, 4212–4221. [Google Scholar] [CrossRef] [PubMed]
- He, H.J.; Wang, Y.; Wang, Y.; Al-Maqtari, Q.A.; Liu, H.; Zhang, M.; Ou, X. Towards rapidly quantifying and visualizing starch content of sweet potato [Ipomoea batatas (L.) Lam] based on NIR spectral and image data fusion. Int. J. Biol. Macromol. 2023, 242, 124748. [Google Scholar] [CrossRef] [PubMed]
- Brust, H.; Orzechowski, S.; Fettke, J. Starch and Glycogen Analyses: Methods and Techniques. Biomolecules 2020, 10, 1020. [Google Scholar] [CrossRef] [PubMed]
- YC/T 216-2007; Tobacco and Tobacco Products—Determination of Starch—Continuous Flow Method. State Tobacco Monopoly Administration of China: Beijing, China, 2007.
- Otynshiyev, M.B.; Assanova, A.N.; Erkinkyzy, A.; Niyazbekov, B.Z.; Toishimanov, M. Studying various methods for determining residual lignin in bast fibers. J. Almaty Technol. Univ. 2024, 146, 164–170. [Google Scholar] [CrossRef]
- Bozek, A.; Mathis, F.; Guillaumat, L.; Müssig, J.; Boizot, N.; Ismael, A.; Ralph, J.; Lu, F.; Sibout, R.; Beaugrand, J. Determination of a suitable molar absorption coefficient (ε) for lignin analysis of fibrous plants using the CASA method. Int. J. Biol. Macromol. 2025, 308, 142324. [Google Scholar] [CrossRef] [PubMed]
- Volkan, K.; Nesrin, H.; Mehmet Ertugrul, S. From sophisticated analysis to colorimetric determination: Smartphone spectrometers and colorimetry. In Color Detection; IntechOpen: London, UK, 2018. [Google Scholar] [CrossRef]
- McGonigle, A.J.S.; Wilkes, T.C.; Pering, T.D.; Willmott, J.R.; Cook, J.M.; Mims, F.M.; Parisi, A.V. Smartphone spectrometers. Sens. 2018, 18, 223. [Google Scholar] [CrossRef] [PubMed]
- Li, C.; Adhikari, R.; Yao, Y.; Miller, A.G.; Kalbaugh, K.; Li, D.; Nemali, K. Measuring plant growth characteristics using smartphone based image analysis technique in controlled environment agriculture. Comput. Electron. Agric. 2020, 168, 105123. [Google Scholar] [CrossRef]
- Barman, U.; Saikia, M.J. Smartphone contact imaging and 1-D CNN for leaf chlorophyll estimation in agriculture. Agric. 2024, 14, 1262. [Google Scholar] [CrossRef]
- Tang, D.Y.Y.; Chew, K.W.; Chia, S.R.; Ting, H.Y.; Sia, Y.H.; Gentili, F.G.; Ma, Z.; Awasthi, M.K.; Show, P.L. Triphasic partitioning of mixed Scenedesmus and Desmodesmus for nutrients’ extraction and chlorophyll composition prediction for algae bloom. Env. Technol. 2022, 1–12. [Google Scholar] [CrossRef] [PubMed]
- Liu, C.; Lu, W.; Gao, B.; Kimura, H.; Li, Y.; Wang, J. Rapid identification of chrysanthemum teas by computer vision and deep learning. Food Sci. Nutr. 2020, 8, 1968–1977. [Google Scholar] [CrossRef] [PubMed]
- Milzi, L.; Diana, R.; Panunzi, B. Visual food sensing: The state-of-the-art through strategies, tools, analytes, and actual applications. J. Food Compos. Anal. 2025, 139, 107096. [Google Scholar] [CrossRef]
- Sha, Y.; Chen, Y.; Li, W.; Zhang, J.; Wang, J.; Fei, T.; Wu, D.; Lu, W. Low-cost, immediate, general-purpose, and high-throughput (LIGHt) smartphone colorimetric screening assay for water-soluble protein. Heliyon 2024, 10, e35596. [Google Scholar] [CrossRef] [PubMed]
- Li, W.; Sha, Y.; Xiong, J.; Chen, Y.; Zhang, Y.; Zhang, J.; Xu, L.; Lu, W. LIGHt-based rapid detection of starch in tobacco leaves by smartphone sensing. Sci. Rep. 2025, 15, 6689. [Google Scholar] [CrossRef] [PubMed]
Disclaimer/Publisher’s Note: The statements, opinions and data contained in all publications are solely those of the individual author(s) and contributor(s) and not of MDPI and/or the editor(s). MDPI and/or the editor(s) disclaim responsibility for any injury to people or property resulting from any ideas, methods, instructions or products referred to in the content. |
© 2025 by the authors. Licensee MDPI, Basel, Switzerland. This article is an open access article distributed under the terms and conditions of the Creative Commons Attribution (CC BY) license (https://creativecommons.org/licenses/by/4.0/).