Abstract
In the era of liquid biopsies, the reliable and cost-effective detection and screening of cancer biomarkers has become of fundamental importance, thus paving the way for the advancement of research in the field of point-of-care testing and the development of new methodologies and technologies. Indeed, the latter ones can help designing advanced diagnostic tools that can offer portability, ease of use with affordable production and operating costs. In this respect, impedance-based biosensing platforms might represent an attractive alternative. In this work, we describe a proof-of-concept study aimed at designing portable impedimetric biosensors for the monitoring of human urokinase-type plasminogen activator (h-uPA) cancer biomarker by employing small synthetic receptors. Aberrant levels of h-uPA were correlated with different types of cancers. Herein, we report the use of two bicyclic peptides (P2 and P3) which have been engineered to bind h-uPA with high affinity and exquisite specificity. The synthetic receptors were immobilized via biotin-streptavidin chemistry on the surface of commercial screen-printed electrodes. The impedimetric changes in the electrode/solution interface upon incubation of spiked h-uPA samples in the presence of a redox probe were followed via electrochemical impedance spectroscopy. The P3-based impedimetric assay showed the best outcomes in terms of dynamic range and linearity (0.01–1 μg mL−1) and sensitivity (LOD = 9 ng mL−1). To fully assess the performances of P3 over P2, and to compare the label-free architecture vs. labelled architecture, a voltammetric assay was also developed.
1. Introduction
In recent years, peptides have been proven to offer effective applications in medical fields. They have been successfully employed in oncology, radio-theragnostic, drug delivery, and vaccine formulation [1,2]. Moreover, peptides have become an effective and important alternative to antibodies as bioreceptors in the development of novel diagnostic tools, while providing several advantages owing to their stability, ease of synthesis, and the engineering of their structure [3]. Among others, these properties help in decreasing the steric hindrance of the receptors, thus allowing the increase in active sites to capture the analytes of interest, leading to an enhanced sensitivity of the biosensing platforms toward several bio- and non-bio molecules, such as heavy metals (lead, mercury, and cadmium), DNA, peptides, cells, and proteins [4,5,6]. The application of peptides as bioreceptors to detect target proteins and antibodies is well known, as witnessed by the high number of methodologies and tools used in clinical diagnostics and medical surveys [7]. Some examples include the detection of biomarkers for HIV [8], Alzheimer’s disease [9], and different types of carcinomas [10,11,12], including breast cancer [13].
A special class of peptides featuring a bicyclic-type structure have shown several advantages over their linear counterparts in mimicking protein affinity and specificity thanks to their enhanced conformational rigidity and metabolic stability. Apart from being successfully employed as therapeutics and chemical probes in drug targeting and imaging [14,15], bicyclic peptides have been recently exploited for the recognition and inhibition of human urokinase-type plasminogen activator (h-uPA) [16,17,18,19]. The latter onehas gained attention as a prognostic or diagnostic biomarker, as well as therapeutic protein [20]. h-uPA is a secreted trypsin-like serine protease involved in various physiological processes such as extracellular matrix homeostasis and tissue remodeling, as summarized in Figure 1 [21,22,23].
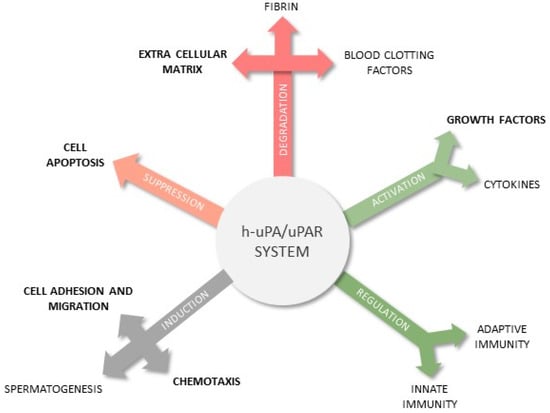
Figure 1.
The main functions of the h-uPA/uPAR system in human physiology and its relation with cancer.
Aberrant expression of h-uPA has been associated to several types of cancer, such as breast, prostate, colorectal and lung cancer, as summarized in Table 1 [24,25]. With respect to breast cancer, h-uPA is considered as relevant as the estrogen receptor (ER) and the human epidermal growth factor receptor 2 (HER2) [26,27]. To improve the early diagnose of breast cancer via h-uPA quantification, ELISA kits, such as FEMTELLETM “uPA/PAI-1 ELISA” [28], have been designed and validated. This assay requires small sample volumes (100 μL) with an established cut-off value of 3 ng mL−1, a limit of detection of 0.025 ng mL−1 and an assay time of 2.5 days [28,29]. Apart from this commercial kit, other biosensing strategies, mainly immunosensors, have been described for monitoring h-uPA and even uPAR in serum [30,31,32,33,34] down to nM or even fM levels (see the comparison reported in Table S1, Supplementary Materials). Despite their high performance, the clinical applicability of these immunosensing strategies [30,31] is limited by the production costs of their biorecognition elements, the antibodies, as discussed by Sfragano et al. [3]. In this frame, peptides represent suitable alternatives to antibodies and nucleic acids, thanks to their ease of synthesis, high affinity, and affordable production costs [35].
Recently, a large number of peptide binders specific for h-uPA have been described [16,17,18,19]. In particular a bicyclic peptide, namely UK18, showed high selectivity and inhibition potency (Ki = 53 nM) [19]. Such binding properties have been attributed to its extended surface of interaction with h-uPA (701 Å2), the numerous hydrogen bonds and complementary charge interactions established, and its reduced conformational freedom [19].
These findings drove the attention of researchers towards the possible integration of such bicyclic peptides as bioreceptors in sensing platforms for cancer diagnostics. Very recently, two biotinylated bicyclic peptides, namely P1 and P2, were designed to this end [36]. P1 was derived from UK18, whereas P2 offered a slightly modified sequence to outperform P1. They were employed as bioreceptors for h-uPA in an electrochemical assay. The results were very promising in terms of reproducibility, selectivity, and sensitivity with LODs of 105.8 ng mL−1 and 32.5 ng mL−1 for P1 and P2, respectively, which are close to the nanomolar concentration range required for diagnostic purposes (see Table 1) [36]. Therefore, inspired by such positive results, a novel bicyclic peptide, P3, was designed and synthesized. The results obtained in a fluorescence-based test in solution [37] have already shown a higher binding affinity compared to the previous peptides P1 and P2, paving the way to its use in biosensing as a candidate receptor for h-uPA.

Table 1.
Clinical concentration ranges of h-uPA in human serum for some cancer forms.
Table 1.
Clinical concentration ranges of h-uPA in human serum for some cancer forms.
| Cancer Type | [h-uPA] Range | References |
|---|---|---|
| Breast cancer | 0.21–16.06 ng mL−1 | [38] |
| Soft-Tissue Sarcoma (STS) | <4.76 ng mL−1 | [39] |
| Bladder cancer | <34.1 ng mL−1 | [40] |
| Colorectal cancer | 5.5–7.5 ng mL−1 | [41] |
| Head and Neck Squamous Cell Carcinoma | 0.21–1.92 ng mL−1 | [42] |
| Pancreas cancer | 1.2–7.6 ng mL−1 | [43] |
| Chronic pancreatitis | 0.9–5.4 ng mL−1 | [44] |
| Liver cancer | 0.2–14.7 ng mL−1 | [45] |
In this context, label-free biosensing platforms offer highly performing, cost-affordable, user-friendly, and potentially scalable solutions for the detection of several types of cancer biomarkers [46,47,48], from proteins up to exosomes [49,50,51], and for therapeutic drug monitoring [52]. Therefore, they are particularly appealing when developing biosensing platforms enabling point-of-care (PoC) diagnostics. In devices of this kind, electrochemical impedance spectroscopy (EIS) allows monitoring of the changes in the electrical properties of the electrode–electrolyte interface when a small-amplitude sinusoidal potential wave is applied on a DC potential biased electrode [53]. Depending on the architecture of the EIS-based biosensors, it is possible to distinguish between nonfaradic capacitive assays, where the changes in the capacitance are solely due to the properties of the interfaces, and faradic assays, which require the addition of a redox probe that is free to diffuse in solution or is confined at the electrode surface. In most faradic assays, EIS data, especially those described by the Nyquist plot, are modelled using electrical equivalent circuits (EECs) and correlate the concentration of the target analyte with the value of the double-layer capacitance (Cdl) or the charge transfer resistance (Rct) [54]. Moreover, changes in the Bode plots can also be considered in the design of EIS-based analytical strategies to simplify the data elaboration process, thus avoiding time-consuming steps (i.e., Nyquist fitting with EEC) [55]. In this last case, target-ligand interactions, both in solution and on a confined surface, should be investigated with complementary analytical techniques to avoid misleading data interpretations (i.e., [55,56]). The advances in impedimetric sensors are leading to the development of novel tools for liquid biopsies, especially for monitoring protein biomarkers [54].
Herein, we describe a proof-of-concept study aimed at developing EIS-based portable sensors, which can be used to monitor h-uPA, where P3 and its predecessor P2 serve as the receptors immobilized on streptavidin-modified screen-printed electrodes (SPE), as depicted in Figure 2. To fully assess the performances of P3 over P2, and to compare the label-free architecture vs. the labelled one, the voltammetric assay already described for P1 and P2 [36] was also tested with P3.
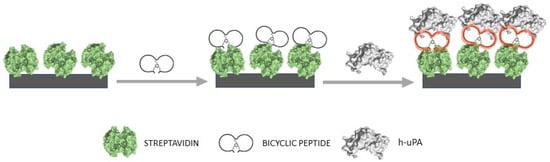
Figure 2.
Schematic representation of the assembling procedure of the bicyclic peptide-based impedimetric platform for h-uPA detection.
2. Materials and Methods
2.1. Materials and Reagents
The bicyclic peptides P2 and P3 were synthetized, characterized, and purified as previously described [36]. Bicyclic peptides P2 and P3 have been recently patented [37]. Potassium hexacyanoferrate(II) trihydrate, tris(hydroxymethyl)aminomethane hydrochloride (tris-HCl or Trizma-HCl), diethanolamine (DEA), non-ionic polyoxyethylenesorbitan monolaurate (Tween 20), Anti-Rabbit IgG-Alkaline phosphatase secondary antibody (Ab2), 1-Naphtyl phosphate disodium salt (1-NPP) and biotin were purchased from Sigma-Aldrich (Merck). Ethylendiaminotetraacetic acid (EDTA), magnesium chloride hexahydrate (MgCl2•6H2O) and monobasic potassium phosphate (KH2PO4) were purchased from AppliChem (Biochemica). Potassium chloride (KCl) and potassium hexacyanoferrate(III) were purchased from VWR® BDH® Prolabo. Dihydrate dibasic sodium phosphate (Na2HPO4•2H2O) and sodium chloride (NaCl) were purchased from Carlo Erba Reagents S.r.l., while the Dynabeads® MyOne™ Streptavidin C1 magnetic microbeads and the Urokinase Polyclonal primary Antibody (Ab1) were purchased from InvitrogenTM-Thermo Fischer. Low molecular weight human-urokinase plasminogen activator (h-uPA) was produced and purified as previously described [36]. Screen-Printed Carbon Electrodes (SPCE; DRP-110) and Streptavidin-modified Screen-Printed Carbon Electrodes (Strep-SPCE; DRP-110STR) were purchased from Metrohm DropSens. The buffer solutions used for the voltametric assay were prepared as previously described [36].
2.2. Sandwich-Type Affinity Electrochemical Assay for h-uPA
All voltammetric measurements were performed with a portable potentiostat EmStat Blue (PalmSens) and the data analysis was carried out with PSTrace5 software. Differential Pulse Voltammetry (DPV) measurements were recorded with a step potential of 0.002 V, a modulation amplitude of 0.002 V, and a scan rate of 0.05 Vs−1. For this assay, the biotinylated peptides P2 and P3 were immobilized on the surface of commercial streptavidin-coated magnetic beads (Strep-MBs) and stored at 4 °C. Each peptide-functionalized Strep-MB was used in the voltammetric sandwich assay to test different h-uPA-spiked samples. The assay was carried out following the previously described experimental procedure [36].
2.3. Impedimetric Assay for h-uPA
All EIS measurements were carried out using a SP-300 BioLogic potentiostat interfaced with ECLab software with the following optimized parameters: a frequency range from 0.1 MHz to 0.1 Hz, 0.001 V of sinus amplitude, and a potential range from −10 V to +10 V. To perform this assay, the Strep-SPCE were first rinsed with deionized water and dried with Ar. The bare Strep-SPE were characterized by EIS in a 80 μL drop of a 1 mM of [Fe(CN)6]3−/4− solution in PBS. Afterwards, a volume of 20 μL of 5 μg mL−1 of the biotinylated peptide P3 was immobilized on the surface of the Strep-SPCE working electrodes via dropcasting. The P3-Strep-SPE were left for 30 min at 4 °C prior to being rinsed twice with 1 mL of 0.01% of Tween 20 in PBS and twice with PBS only to remove P3 excess (washing steps). Prior to incubating P3-Strep-SPE with h-uPA-spiked samples, the electrodes were characterized via EIS, as previously described. A volume of 20 μL of each h-uPA-spiked sample was incubated at P3-Strep-SPE for 30 min at 4 °C. The electrodes were washed following the washing steps described above. These steps were carried out for two consecutive rounds, aiming to prevent the non-specific adsorption (NSA) of the target prior to recording the EIS measurements [57,58]. Overall, the EIS-based assay required 1 h 45 min, approximately 1 h for the preparation of the biosensors and 45 min for measuring the samples. The biosensing platforms were freshly prepared or stored at 4 °C for maximum 2 days prior to use.
The calibration plot was obtained by subtracting the blank value of each measurement and calculating the average and the associate error out of triplicates. All data elaboration was performed with Origin 8.5 software and the fitting of EIS data was elaborated with ECLab and ZView 2.
3. Results and Discussion
3.1. Comparing P3 and P2 Performance in Voltammetric Assay
The whole assembling procedure of the voltammetric biosensor employing the bicyclic peptide has already been described in a recently published article [36]. The bicyclic peptides P3 and P2 were specifically designed to target h-uPA and their inhibitory activity was previously characterized. P3 inhibitory activity was found to be twice as good as that of P2 [36].Despite the minimal variation in the amino-acid sequences (3 amino acids) between P2 and P3, the increased inhibitory activity of P3 might result in higher sensitivity in the electrochemical assay [36]. However, the performances of a bioreceptor in solution or on a confined surface might dramatically change as already described for other biomolecules [59]. To verify P3 binding affinity toward h-uPA on a confined surface, the biotinylated peptide was first immobilized on the surface of streptavidin-functionalized magnetic microbeads (Strep-MBs) and employed in a sandwich-type affinity electrochemical assay following the protocol previously optimized for P2 [36]. P3 is bound to the MBs via biotin-streptavidin chemistry. In this preliminary study, P2 was tested with the aim of comparing the performance of the peptide-based assays in the same experimental conditions. For all h-uPA concentrations tested, the assay with P3 showed a reliable response, thus confirming the applicability of P3 as synthetic bioreceptor in an electrochemical sensing platform. From the results summarized in Figure 3, it is possible to observe that, upon incubation of P3-modified Strep-MBs with increasing concentrations of h-uPA (ranging from 0.1 to 0.5 μg mL−1), higher current intensities were recorded. The P3-based assay shows a higher value of the slope obtained from the linear regression of the calibration plots, when compared to P2. Indeed, for P2 the response factor is 16.0 ± 0.9 µA mL µg−1, while for P3 is 21.7 ± 1.3 µA mL µg−1. Therefore, the P3-based assay shows a higher sensitivity compared to P2. The dynamic range of P3 is consistent with that of the P2-based assay, as shown in Figure S1 [36].
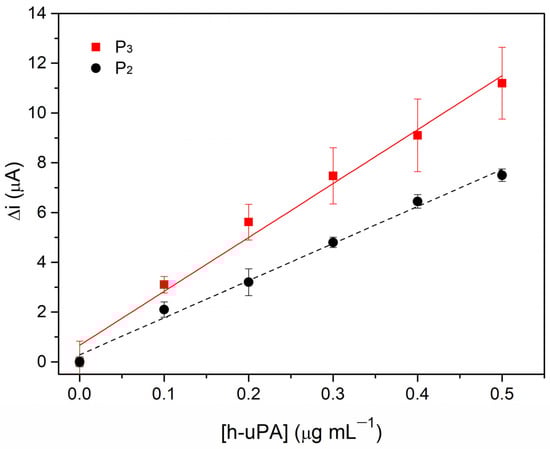
Figure 3.
Comparison of the calibration plots of h-uPA obtained via sandwich-type affinity assay using P2- (black full circles) or P3- (red full squares) modified-MB. The values shown are the average of triplicate measurements with the associate error calculated as the standard deviation. The linear fitting equations for P2 (dashed black line): y = 16.0 ± 0.9x + 0.28 ± 0.07 and P3 (red full line): y = 21.7 ± 1.3x + 0.67 ± 0.39.
3.2. EIS-Based Sensor Design and Characterization
In label-free impedance-based biosensors, EIS allows monitoring of the changes in the electrical properties of the electrode–electrolyte interface when a small-amplitude sinusoidal potential wave is applied to a DC potential biased electrode. As mentioned above, in most faradic assays, Nyquist plots are considered and modelled using EECs and correlate the target concentration with the variation of the Cdl or Rct values [54]. In this study, the Nyquist plots and their fitting with EECs were applied to characterize the sensing platform and describe the contributions given by the streptavidin layer, the biorecognition layer (P3 and P2) and, as the last step, from the target protein h-uPA. To this end, commercial Strep-SPCE was first activated and functionalized with the biotinylated peptides via biotin–streptavidin interactions. After removing the excess of nonspecifically adsorbed bioreceptor, the platform was incubated with increasing concentrations of h-uPA-spiked samples. All steps were characterized via EIS in presence of 1 mM [Fe(CN6)]3−/4− in PBS, as described in Section 2.3. In Figure 4a, the Nyquist plots obtained at the bare Strep-SPCE (green dots), after P3 immobilization (red dots) and after incubation of 0.1 μg mL−1 of h-uPA (grey dots), are reported with the corresponding Bode plots in Figure 4b. The Nyquist plots were fitted with the EECs reported in Figure 4c–e to acquire qualitative information regarding the processes occurring at the different electrode/solution interfaces.
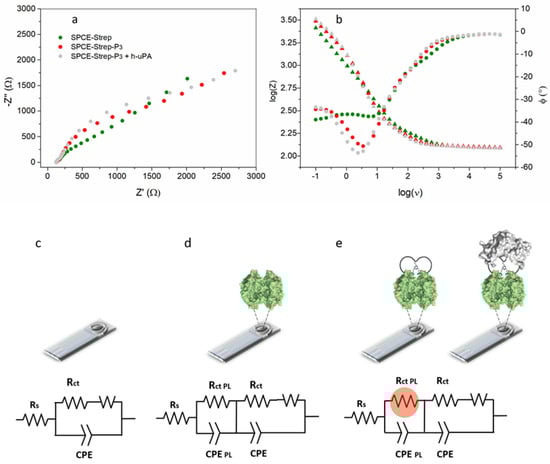
Figure 4.
(a) Nyquist and (b) Bode plots for bare Strep-SPCE (green), P3-modified Strep-SPCE (red) and P3-Strep-SPCE after incubation of 0.1 μgmL−1 of h-uPA (grey). The data of the Bode phase plot are represented with circles, while the triangles correspond to the data of the Bode magnitude plot. All the measurement were performed in 1 mM solution of [Fe(CN)6]3−/4−. EECs describing the Nyquist plots reported in (a) and the response of an unmodified SPCE: (c) the processes occurring at a bare SPCE/solution interface can be modelled with a standard Randles circuit, (d,e) modified EEC describing the presence of a poorly conductive layer (protein layer, PL).
The Nyquist plots for the Strep-SPCE were fitted with the Randles circuit including additional elements. The Randles circuit allows the modelling of a bare SPCE/solution interface where the migration of charge through the electrolyte solution is described by the solution resistance (Rs); the constant phase element (CPE) accounts for the double-layer formation at the electrode surface; the Rct describes the charge-transfer reaction; whereas the Warburg impedance element (W), a constant phase element independent from the frequency, accounts for the linear diffusion from the bulk of the solution. Often bare SPCEs show relatively high Rct values (2.10 kΩ) which decrease once the electrode surface is modified with a conductive protein [55,60] or a protein layer such as streptavidin (Rct = 0.25 kΩ), as shown in Figure S3a–c in the Supplementary Materials. Here, additional CPEPL and Rct PL can be ascribed to the streptavidin layer contributions in terms of resistance and capacitance. After incubation of the bioreceptor and the target protein, CPEPL and Rct PL values increase by about 40% compared to Strep-SPCE ones, suggesting that the formation of the biorecognition layer and, in a second step, the recognition of h-uPA contribute to the formation of a thicker, less conductive layer at the SPCE/solution interface (see Figure S3a). The changes in the Rct PL values were found to increase linearly with increasing concentrations of h-uPA (see Figure S3b).
It was observed that increasing concentrations of h-uPA resulted in increasing Rct PL (see Figure 4c–e), thus confirming the possibility of determining h-uPA within a faradic impedimetric sensing approach at the surface of the modified Strep-SPCE using P3 as the biorecognition element. These changes can even be followed from the Bode plots, where the peaks increase progressively in phase (φ) when P3 is immobilized on the electrode surface and after protein h-uPA is incubated, as shown in Figure 4b. Finally, the incubation of 0.1 μg mL−1 of the target protein leads to an additional interfacial layer at the SPCEs resulting in a more complex EEC circuit with supplementary CPE/Rct in series and an increased intensity in the process occurring at about log (ν) = 0.37 in the Bode Phase plot. The EIS characterization confirmed the successful immobilization of the bioreceptor, the formation of a stable biorecognition layer and, indirectly, its capability to recognize the target protein. Therefore, P3 can be further applied in EIS-based affinity assay for the detection of h-uPA. Prior to proceeding with the preliminary tests addressing the performance of this sensing strategies, the loading of the bioreceptor was optimized. Impedimetric biosensors generally require a high concentration of small bioreceptors such as peptides [48]. In our study, different loadings of P3 at Strep-SPCE were tested: 0.1, 1, 5, 10, 25 and 50 μg mL−1. To verify which one provides the highest analytical signal after the interaction with the target protein, for each of them a spiked h-uPA sample (0.1 μg mL−1), which is within the linear concentration range of the voltametric platform described in Section 3.1 and in the previous article [36], was incubated. Figure 5 shows the values obtained from the normalized phase (φ) signals, which derive from Bode plots peaks, along with the blank related to each amount of P3 loaded.
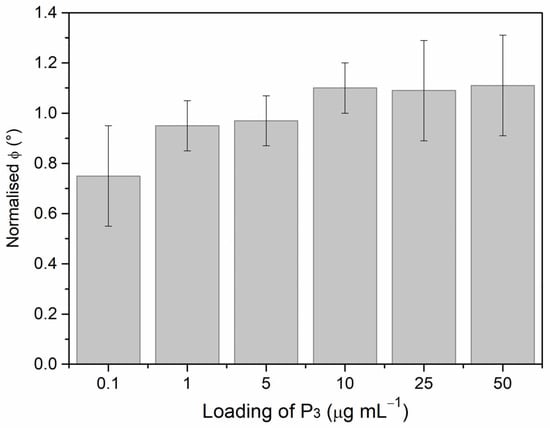
Figure 5.
Comparison of the response of the SPCE platform loaded with different concentrations of P3 ranging from 0.10 to 50 μg mL−1. A buffer solution spiked with 0.1 μg mL−1 h-uPA was analyzed. The normalized phase value presented was calculated from the Bode plots. The error bars were obtained on the triplicates.
The minimum values of the process at log (ν) = 0.37 (as shown in Figure 4b) in the presence/absence of h-uPA were extrapolated and normalized by subtracting and then dividing the minimum values in the presence of the target protein by those in absence of it (blanks). We observed that the mid concentration, 5.0 μg mL−1, was the best performing in terms of platform sensibility and peptide economy.
3.3. Impedimetric Detection Strategy: Preliminary Data
The findings of the EIS characterization study suggested the possibility of correlating the presence of h-uPA and its concentrations directly from the impedance signal, while considering the changes in the Bode phase plot peaks instead of analyzing the fitted parameters obtained from the EEC. Subtracting the blank values, upon P3 immobilization on Strep-SPCE, from the ones after h-uPA incubation (see Figure S4), a calibration curve could be obtained as shown in Figure 6. In this case, a higher dynamic range (0.01–1 μg mL−1) was investigated as shown in Figure 6a. The data were fitted using the four parameters logistic (4PL) regression model, described by the following equation:
where y is the analytical signal, A1 is the output at concentration zero of the analyte, A2 is the output at infinite analyte concentration, x is the analyte concentration, x0 is the inflection point of the curve, and p is the slope factor. This model is a sigmoidal curve with a linear region defined by two plateau regions related to the minimum and maximum responses and it is often applied to the characterization of bioassays with wide dynamic ranges [61,62].
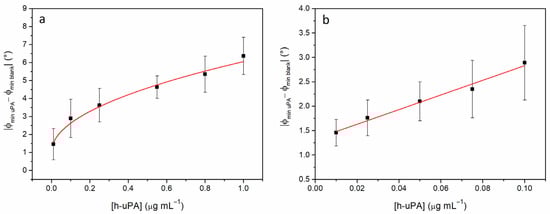
Figure 6.
(a) Calibration plots in the h-uPA concentration range 0.01–1 μg mL−1 with data regression obtained with the 4 parameters logistic model and (b) in the h-uPA concentration range 0.01–0.1 μg mL−1 with linear fitting equation (black full line): y = 15 ± 1x + 1.33 ± 0.04. The values presented are the average of triplicate measurements with the associate error calculated as the standard deviation.
To test the platform sensibility and its possible applicability to real samples, the lower concentration range (0.01–0.1 μg mL−1) was investigated. In fact, the concentration ranges of h-uPA in human serum, which are diagnostically relevant for breast cancer, fall within this range [38]. The h-uPA concentration ranges that are clinically relevant are in the order of nanograms, thus meaning that the sensitivity of the platform must reach this level to be applied to real samples. The results from different sensing platforms both freshly prepared and stored at 4 °C for 24h are reported in Figure 6b. The impedimetric platform responses show a good linearity (R2 > 0.9997). The LOD calculated as the ratio between three times the standard deviation of the blank and the curve slope [63] is equal to 0.009 µg mL−1 with a LOQ of 0.030 µg mL−1. These values suggest that this platform has a higher sensitivity than the voltammetric one in simple matrices spiked with h-uPA. With further optimizations, this platform could address clinical needs [64,65,66] and possibly be applied in the early diagnose of breast cancer within a cost-affordable device that overcomes the limitations of the immunosensing platforms previously described. The results of this proof-of-concept study confirmed the potential applicability of bicyclic peptides in the impedimetric sensing of protein cancer biomarkers.
4. Conclusions
In the present research work, we described the use of a novel synthetic receptor, based on a bicyclic peptide, to develop a biosensing platform aimed at detecting the cancer biomarker h-uPA, which has gained attention in recent decades as prognostic or diagnostic biomarker. In fact, aberrant levels of h-uPA have been associated with several types of cancer, such as breast, prostate, colorectal and lung. Therefore, its detection is of fundamental importance in oncology, as it can address several diagnostic needs.
The synthetic bicyclic peptide P3 was tested by adopting two methodologies: voltammetric- and an impedimetric-based biosensing platforms. In the first one, recently described by us [36], the use of P3 provided a higher sensitivity when compared with previous synthetic bicyclic peptides P1 and P2 in the same range of concentrations.
The second methodology, instead, provided the novelty as the impedimetric biosensing platform was developed by direct functionalization of a streptavidin-coated SPCE with P3, and the signal vs. h-uPA concentration was obtained while considering the impedimetric properties of the system from the growth of the Nyquist plot curves and the peaks of the Bode plot, which derive from the increase in resistance upon exposition to a higher concentration of h-uPA. The impedance-based assay was tested in a wide range of h-uPA concentrations (0.01–1 μg mL−1) and showed good linearity with R2 = 0.9963, a LOD = 9 ng mL−1 (LOQ of 30 ng mL−1). Our findings demonstrate an improvement when compared to both the previous platform and to the use of the previous synthetic receptor P2. Also, they witness the potential impact that synthetic receptors have on the development of biosensing platforms, especially in relation to the design of impedimetric devices, which are particularly appealing as they can enable the highly sought-after PoC diagnostic.
Supplementary Materials
The following supporting information can be downloaded at: https://www.mdpi.com/article/10.3390/chemosensors11040234/s1. Table S1. Comparison of biosensing strategies developed recently for h-uPA detection spiked buffer solutions and biological fluids]; Figure S1. The response of P3-based assay in presence of h-uPA concentrations ranging 0.1 to 1 μg mL−1; Figure S2. Comparison between the calibration plots obtained with P2 (red circles) and P3 (black squares) as bioreceptors in this impedimetric-based assay. The calibration curve of P3-based assay shows a gretated linear slope compared to the P2 one. These trends are consistent with the ones observed for the voltammetric sandwich-type assay presented in Figure 3. The choice of P3 as bioreceptor provides a higher sensibility to the platform compared to P2. The error associated with the response of the two platforms expressed as the standard deviation has the same order of magnitude for both P2 and P3; Figure S3. (a) Comparison of the Rct and RctPL values of Strep-SPCE, P3-Strep-SPCE, h-uPA-P3-Strep-SPCE. The values were obtained fitting the Nyquist plots in Figure 4a with the EECs reported in Figure 4c–e. (b) Relative variation of RctPL upon incubation of samples spiked with increasing concentrations of h-uPA. (c) Summary of the values of all resistance components present in the EECs used to fit the EIS data; Figure S4. Bode phase peaks, subtracted from the respective blanks, of the 6 h-uPA concentrations tested in the impedimetric P3-based platform.
Author Contributions
Conceptualization, G.M. and F.P.; Methodology, G.M., L.F. and F.P.; Formal analysis, L.F.; Investigation, L.F.; Resources, A.A. and F.P.; Data curation, G.M., L.F. and F.P.; Writing—original draft, G.M., L.F. and F.P.; Writing—review & editing, G.M., L.F., A.A. and F.P.; Supervision, G.M. and F.P.; Project administration, F.P.; Funding acquisition, F.P. All authors have read and agreed to the published version of the manuscript.
Funding
This research was funded by Ca’ Foscari University of Venice through the projects “Fondi di Primo Insediamento 2019–2020” and “Supporting Principal Investigator—SPIN2021” (TIDE project).
Institutional Review Board Statement
Not applicable.
Informed Consent Statement
Not applicable.
Data Availability Statement
No additional data are available.
Acknowledgments
The authors sincerely thank: Laura Cendron (University of Padova), who provided h-uPA; Stefano Perin and Ylenia Mazzoccato (Ca’ Foscari University of Venice), who kindly supported us in the synthesis of P3; Ilaria Palchetti (University of Florence), who kindly provided some extra aliquots of the antibodies used in this work; Francesco Di Baldassarre (Thasar S.r.l.), who kindly made the EM-Stat portable potentiostat available to us for the time we needed to develop the proof-of-concept voltammetric biosensing platform.
Conflicts of Interest
The authors declare no conflict of interest.
Abbreviations
| List of Abbreviations and Acronyms | |
| 1-NPP | 1-Naphtyl phosphate disodium salt |
| 4PL | Four parameters logistic |
| Ab1 | Urokinase polyclonal primary antibody |
| Ab2 | Anti-Rabbit IgG-Alkaline phosphatase secondary antibody |
| Cdl | Double-layer capacitance |
| CPE | Constant phase element |
| CPEPL | Constant phase element associated with the protein layer |
| DC | Direct current |
| DEA | Diethanolamine |
| DPV | Differential pulse voltammetry |
| EDTA | Ethylendiaminotetraacetic acid |
| EEC | Electric equivalent circuit |
| EIS | Electrochemical impedance spectroscopy |
| ELISA | Enzyme-linked immunosorbent assay |
| ER | Estrogen receptor |
| FBS | Fetal bovine serum |
| HER2 | Human epidermal growth factor receptor 2 |
| h-uPA | Human-urokinase plasminogen activator |
| Ki | Inhibitory affinity constant |
| LOD | Limit of detection |
| LOQ | Limit of quantification |
| NSA | Non-specific adsorption |
| P1 | Bicyclic peptide P1 |
| P2 | Bicyclic peptide P2 |
| P3 | Bicyclic peptide P3 |
| PBS | Phosphate buffered saline |
| PL | Protein layer |
| PoC | Point-of-care |
| Rct | Charge transfer resistance |
| RctPL | Charge transfer resistance associated with the protein layer |
| Rs | Solution resistance |
| SPCE | Screen-printed carbon electrode |
| SPE | Screen-printed electrode |
| Strep-SPCE | Streptavidin-modified screen-printed carbon electrode |
| Strep-MBs | Streptavidin-coated magnetic beads |
| tris-HCl or Trizma-HCl | Tris(hydroxymethyl)aminomethane hydrochloride |
| Tween 20 | Non-ionic polyoxyethylenesorbitan monolaurate |
| uPAR | Urokinase plasminogen activator receptor |
| UK18 | Bicyclic peptide UK18 |
| W | Warburg impedance element |
References
- Kurrikoff, K.; Aphkhazava, D.; Langel, Ü. The future of peptides in cancer treatment. Curr. Opin. Pharmacol. 2019, 47, 27–32. [Google Scholar] [CrossRef] [PubMed]
- Gaspar, D.; Salomé Veiga, A.; Castanho, M.A.R.B. From antimicrobial to anticancer peptides. A review. Front. Microbiol. 2013, 4, 1–16. [Google Scholar] [CrossRef] [PubMed]
- Sfragano, P.S.; Moro, G.; Polo, F.; Palchetti, I. The Role of Peptides in the Design of Electrochemical Biosensors for Clinical Diagnostics. Biosensors 2021, 11, 246. [Google Scholar] [CrossRef]
- Yuan, L.; Liu, L. Peptide-based electrochemical biosensing. Sensors Actuators B Chem. 2021, 344, 130232. [Google Scholar] [CrossRef]
- Chow, E.; Gooding, J.J. Peptide Modified Electrodes as Electrochemical Metal Ion Sensors. Electroanalysis 2006, 18, 1437–1448. [Google Scholar] [CrossRef]
- Stortini, A.M.; Baldo, M.A.; Moro, G.; Polo, F.; Moretto, L.M. Bio- and Biomimetic Receptors for Electrochemical Sensing of Heavy Metal Ions. Sensors 2020, 20, 6800. [Google Scholar] [CrossRef]
- Liu, Q.; Wang, J.; Boyd, B.J. Peptide-based biosensors. Talanta 2015, 136, 114–127. [Google Scholar] [CrossRef]
- Gerasimov, J.Y.; Lai, R.Y. An electrochemical peptide-based biosensing platform for HIV detection. Chem. Commun. 2010, 46, 395–397. [Google Scholar] [CrossRef] [PubMed]
- Xia, N.; Wang, X.; Yu, J.; Wu, Y.; Cheng, S.; Xing, Y.; Liu, L. Design of electrochemical biosensors with peptide probes as the receptors of targets and the inducers of gold nanoparticles assembly on electrode surface. Sensors Actuators B Chem. 2017, 239, 834–840. [Google Scholar] [CrossRef]
- Zhao, N.; He, Y.; Mao, X.; Sun, Y.; Zhang, X.; Li, C.; Lin, Y.; Liu, G. Electrochemical assay of active prostate-specific antigen (PSA) using ferrocene-functionalized peptide probes. Electrochem. commun. 2010, 12, 471–474. [Google Scholar] [CrossRef]
- Cho, C.H.; Kim, J.H.; Kim, J.; Yun, J.W.; Park, T.J.; Park, J.P. Re-engineering of peptides with high binding affinity to develop an advanced electrochemical sensor for colon cancer diagnosis. Anal. Chim. Acta 2021, 1146, 131–139. [Google Scholar] [CrossRef]
- Lim, J.M.; Ryu, M.Y.; Yun, J.W.; Park, T.J.; Park, J.P. Electrochemical peptide sensor for diagnosing adenoma-carcinoma transition in colon cancer. Biosens. Bioelectron. 2017, 98, 330–337. [Google Scholar] [CrossRef]
- Hu, L.; Hu, S.; Guo, L.; Shen, C.; Yang, M.; Rasooly, A. DNA Generated Electric Current Biosensor. Anal. Chem. 2017, 89, 2547–2552. [Google Scholar] [CrossRef] [PubMed]
- Rhodes, C.A.; Pei, D. Bicyclic Peptides as Next-Generation Therapeutics. Chem. A Eur. J. 2017, 23, 12690–12703. [Google Scholar] [CrossRef] [PubMed]
- Ahangarzadeh, S.; Kanafi, M.M.; Hosseinzadeh, S.; Mokhtarzadeh, A.; Barati, M.; Ranjbari, J.; Tayebi, L. Bicyclic peptides: Types, synthesis and applications. Drug Discov. Today 2019, 24, 1311–1319. [Google Scholar] [CrossRef]
- Roodbeen, R.; Paaske, B.; Jiang, L.; Jensen, J.K.; Christensen, A.; Nielsen, J.T.; Huang, M.; Mulder, F.A.A.; Nielsen, N.C.; Andreasen, P.A.; et al. Bicyclic Peptide Inhibitor of Urokinase-Type Plasminogen Activator: Mode of Action. ChemBioChem 2013, 14, 2179–2188. [Google Scholar] [CrossRef] [PubMed]
- Hansen, M.; Wind, T.; Blouse, G.E.; Christensen, A.; Petersen, H.H.; Kjelgaard, S.; Mathiasen, L.; Holtet, T.L.; Andreasen, P.A. A Urokinase-type Plasminogen Activator-inhibiting Cyclic Peptide with an Unusual P2 Residue and an Extended Protease Binding Surface Demonstrates New Modalities for Enzyme Inhibition *. J. Biol. Chem. 2005, 280, 38424–38437. [Google Scholar] [CrossRef]
- Henneke, I.; Greschus, S.; Savai, R.; Korfei, M.; Markart, P.; Mahavadi, P.; Schermuly, R.T.; Wygrecka, M.; Stürzebecher, J.; Seeger, W.; et al. Inhibition of urokinase activity reduces primary tumor growth and metastasis formation in a murine lung carcinoma model. Am. J. Respir. Crit. Care Med. 2010, 181, 611–619. [Google Scholar] [CrossRef] [PubMed]
- Angelini, A.; Cendron, L.; Chen, S.; Touati, J.; Winter, G.; Zanotti, G.; Heinis, C. Bicyclic Peptide Inhibitor Reveals Large Contact Interface with a Protease Target. ACS Chem. Biol. 2012, 7, 817–821. [Google Scholar] [CrossRef]
- Crippa, M.P. Urokinase-type plasminogen activator. Int. J. Biochem. Cell Biol. 2007, 39, 690–694. [Google Scholar] [CrossRef]
- Tang, L.; Han, X. The urokinase plasminogen activator system in breast cancer invasion and metastasis. Biomed. Pharmacother. 2013, 67, 179–182. [Google Scholar] [CrossRef]
- Gouri, A.; Dekaken, A.; El Bairi, K.; Aissaoui, A.; Laabed, N.; Chefrour, M.; Ciccolini, J.; Milano, G.; Benharkat, S. Plasminogen activator system and breast cancer: Potential role in therapy decision making and precision medicine. Biomark. Insights 2016, 11, 105–111. [Google Scholar] [CrossRef]
- Mekkawy, A.H.; Pourgholami, M.H.; Morris, D.L. Involvement of Urokinase-Type Plasminogen Activator System in Cancer: An Overview. Med. Res. Rev. 2014, 34, 918–956. [Google Scholar] [CrossRef]
- Duffy, M.J.; O’Grady, P.; Devaney, D.; O’Siorain, L.; Fennelly, J.J.; Lijnen, H.J. Urokinase-plasminogen activator, a marker for aggressive breast carcinomas. Preliminary report. Cancer 1988, 62, 531–533. [Google Scholar] [CrossRef] [PubMed]
- Jiping, X.; Guangde, Z.; Wenhua, X. Expression and significance of urokinase-type plasminogen activator in breast cancer. Chinese J. Cancer Res. 1999, 11, 295–298. [Google Scholar] [CrossRef]
- Jänicke, F.; Prechtl, A.; Thomssen, C.; Harbeck, N.; Meisner, C.; Untch, M.; Sweep, C.G.J.F.; Selbmann, H.-K.; Graeff, H.; Schmitt, M.; et al. Randomized Adjuvant Chemotherapy Trial in High-Risk, Lymph Node-Negative Breast Cancer Patients Identified by Urokinase-Type Plasminogen Activator and Plasminogen Activator Inhibitor Type 1. JNCI J. Natl. Cancer Inst. 2001, 93, 913–920. [Google Scholar] [CrossRef]
- Look, M.P.; van Putten, W.L.J.; Duffy, M.J.; Harbeck, N.; Christensen, I.J.; Thomssen, C.; Kates, R.; Spyratos, F.; Fernö, M.; Eppenberger-Castori, S.; et al. Pooled Analysis of Prognostic Impact of Urokinase-Type Plasminogen Activator and Its Inhibitor PAI-1 in 8377 Breast Cancer Patients. JNCI J. Natl. Cancer Inst. 2002, 94, 116–128. [Google Scholar] [CrossRef] [PubMed]
- FEMTELLETM uPA/PAI-1 ELISA BioMedica Diagnostics. Available online: https://www.hct.group/product/femtelle-upa-pai-1-elisa/ (accessed on 3 April 2023).
- Mahmood, N.; Mihalcioiu, C.; Rabbani, S.A. Multifaceted Role of the Urokinase-Type Plasminogen Activator (uPA) and Its Receptor (uPAR): Diagnostic, Prognostic, and Therapeutic Applications. Front. Oncol. 2018, 8. [Google Scholar] [CrossRef] [PubMed]
- Liu, X.-P.; Chen, J.-S.; Mao, C.; Niu, H.-L.; Song, J.-M.; Jin, B.-K. A label-free photoelectrochemical biosensor for urokinase-type plasminogen activator detection based on a g-C3N4/CdS nanocomposite. Anal. Chim. Acta 2018, 1025, 99–107. [Google Scholar] [CrossRef] [PubMed]
- Sharma, B.; Parajuli, P.; Podila, R. Rapid detection of urokinase plasminogen activator using flexible paper-based graphene-gold platform. Biointerphases 2020, 15, 11004. [Google Scholar] [CrossRef]
- Jarczewska, M.; Kékedy-Nagy, L.; Nielsen, J.S.; Campos, R.; Kjems, J.; Malinowska, E.; Ferapontova, E.E. Electroanalysis of pM-levels of urokinase plasminogen activator in serum by phosphorothioated RNA aptamer. Analyst 2015, 140, 3794–3802. [Google Scholar] [CrossRef]
- Shahdeo, D.; Kesarwani, V.; Suhag, D.; Ahmed, J.; Alshehri, S.M.; Gandhi, S. Self-assembled chitosan polymer intercalating peptide functionalized gold nanoparticles as nanoprobe for efficient imaging of urokinase plasminogen activator receptor in cancer diagnostics. Carbohydr. Polym. 2021, 266, 118138. [Google Scholar] [CrossRef] [PubMed]
- Roberts, A.; Tripathi, P.P.; Gandhi, S. Graphene nanosheets as an electric mediator for ultrafast sensing of urokinase plasminogen activator receptor-A biomarker of cancer. Biosens. Bioelectron. 2019, 141, 111398. [Google Scholar] [CrossRef] [PubMed]
- Trier, N.; Hansen, P.; Houen, G. Peptides, Antibodies, Peptide Antibodies and More. Int. J. Mol. Sci. 2019, 20, 6289. [Google Scholar] [CrossRef] [PubMed]
- Moro, G.; Severin Sfragano, P.; Ghirardo, J.; Mazzocato, Y.; Angelini, A.; Palchetti, I.; Polo, F. Bicyclic peptide-based assay for uPA cancer biomarker. Biosens. Bioelectron. 2022, 213, 114477. [Google Scholar] [CrossRef]
- Mazzocato, Y.; Frasson, N.; Laura, C.; Angelini, A. Inibitori Peptidici Biciclici Dell’attivatore Del Plasminogeno Di Tipo Urochinasi Umana (HuPA). 2022. Available online: https://iris.unive.it/handle/10278/5007900 (accessed on 3 April 2022).
- Banys-Paluchowski, M.; Witzel, I.; Aktas, B.; Fasching, P.A.; Hartkopf, A.; Janni, W.; Kasimir-Bauer, S.; Pantel, K.; Schön, G.; Rack, B.; et al. The prognostic relevance of urokinase-type plasminogen activator (uPA) in the blood of patients with metastatic breast cancer. Sci. Rep. 2019, 9, 1–10. [Google Scholar] [CrossRef]
- Taubert, H.; Würl, P.; Greither, T.; Kappler, M.; Bache, M.; Lautenschläger, C.; Füssel, S.; Meye, A.; Eckert, A.W.; Holzhausen, H.-J.; et al. Co-detection of members of the urokinase plasminogen activator system in tumour tissue and serum correlates with a poor prognosis for soft-tissue sarcoma patients. Br. J. Cancer 2010, 102, 731–737. [Google Scholar] [CrossRef]
- Casella, R.; Shariat, S.F.; Monoski, M.A.; Lerner, S.P. Urinary levels of urokinase-type plasminogen activator and its receptor in the detection of bladder carcinoma. Cancer 2002, 95, 2494–2499. [Google Scholar] [CrossRef]
- Huber, K.; Kirchheimer, J.C.; Sedlmayer, A.; Bell, C.; Ermler, D.; Binder, B.R. Clinical value of determination of urokinase-type plasminogen activator antigen in plasma for detection of colorectal cancer: Comparison with circulating tumor-associated antigens CA 19-9 and carcinoembryonic antigen. Cancer Res. 1993, 53, 1788–1793. [Google Scholar]
- Strojan, P.; Budihna, M.; Šmid, L.; Vrhovec, I.; Škrk, J. Urokinase-type plasminogen activator (uPA) and plasminogen activator inhibitor type 1 (PAI-1) in tissue and serum of head and neck squamous cell carcinoma patients. Eur. J. Cancer 1998, 34, 1193–1197. [Google Scholar] [CrossRef]
- Cantero, D.; Friess, H.; Deflorin, J.; Zimmermann, A.; Bründler, M.-A.; Riesle, E.; Korc, M.; Büchler, M.W. Enhanced expression of urokinase plasminogen activator and its receptor in pancreatic carcinoma. Br. J. Cancer 1997, 75, 388–395. [Google Scholar] [CrossRef]
- Winter, K.; Szcześniak, P.; Bulska, M.; Kumor-Kisielewska, A.; Durko, L.; Gąsiorowska, A.; Orszulak-Michalak, D.; Małecka Panas, E. Serum level of Urokinase Plasminogen Activator (uPA) Correlates with the Survival of Patients with Pancreatic Ductal Adenocarcinoma (PDAC). Pancreat. Disord. Ther. 2015, 5, 3–8. [Google Scholar] [CrossRef]
- Tsai, M.-C.; Yen, Y.-H.; Chang, K.-C.; Hung, C.-H.; Chen, C.-H.; Lin, M.-T.; Hu, T.-H. Elevated levels of serum urokinase plasminogen activator predict poor prognosis in hepatocellular carcinoma after resection. BMC Cancer 2019, 19, 1169. [Google Scholar] [CrossRef] [PubMed]
- Ravalli, A.; da Rocha, C.G.; Yamanaka, H.; Marrazza, G. A label-free electrochemical affisensor for cancer marker detection: The case of HER2. Bioelectrochemistry 2015, 106, 268–275. [Google Scholar] [CrossRef] [PubMed]
- Yang, T.; Wang, S.; Jin, H.; Bao, W.; Huang, S.; Wang, J. An electrochemical impedance sensor for the label-free ultrasensitive detection of interleukin-6 antigen. Sensors Actuators B Chem. 2013, 178, 310–315. [Google Scholar] [CrossRef]
- Ibau, C.; Md Arshad, M.K.; Gopinath, S.C.B.; Nuzaihan, M.; Fathil, M.F.M.; Estrela, P. Gold interdigitated triple-microelectrodes for label-free prognosticative aptasensing of prostate cancer biomarker in serum. Biosens. Bioelectron. 2019, 136, 118–127. [Google Scholar] [CrossRef]
- Singh, S.; Podder, P.S.; Russo, M.; Henry, C.; Cinti, S. Tailored point-of-care biosensors for liquid biopsy in the field of oncology. Lab Chip 2023, 23, 44–61. [Google Scholar] [CrossRef]
- Zhang, P.; Jiang, J.; Zhou, X.; Kolay, J.; Wang, R.; Wan, Z.; Wang, S. Label-free imaging and biomarker analysis of exosomes with plasmonic scattering microscopy. Chem. Sci. 2022, 13, 12760–12768. [Google Scholar] [CrossRef]
- Kwong Hong Tsang, D.; Lieberthal, T.J.; Watts, C.; Dunlop, I.E.; Ramadan, S.; del Rio Hernandez, A.E.; Klein, N. Chemically Functionalised Graphene FET Biosensor for the Label-free Sensing of Exosomes. Sci. Rep. 2019, 9, 13946. [Google Scholar] [CrossRef]
- Tartaggia, S.; Meneghello, A.; Bellotto, O.; Poetto, A.S.; Zanchetta, M.; Posocco, B.; Bunka, D.; Polo, F.; Toffoli, G. An SPR investigation into the therapeutic drug monitoring of the anticancer drug imatinib with selective aptamers operating in human plasma. Analyst 2021, 146, 1714–1724. [Google Scholar] [CrossRef]
- Zamfir, L.-G.; Puiu, M.; Bala, C. Advances in Electrochemical Impedance Spectroscopy Detection of Endocrine Disruptors. Sensors 2020, 20, 6443. [Google Scholar] [CrossRef]
- Pinkova Gajdosova, V.; Lorencova, L.; Blsakova, A.; Kasak, P.; Bertok, T.; Tkac, J. Challenges for impedimetric affinity sensors targeting protein detection. Curr. Opin. Electrochem. 2021, 28, 100717. [Google Scholar] [CrossRef]
- Moro, G.; Bottari, F.; Liberi, S.; Covaceuszach, S.; Cassetta, A.; Angelini, A.; De Wael, K.; Maria, L. Covalent immobilization of delipidated human serum albumin on poly (pyrrole-2-carboxylic) acid film for the impedimetric detection of perfluorooctanoic acid. Bioelectrochemistry 2020, 134, 107540. [Google Scholar] [CrossRef] [PubMed]
- Maso, L.; Trande, M.; Liberi, S.; Moro, G.; Daems, E.; Linciano, S.; Sobott, F.; Covaceuszach, S.; Cassetta, A.; Fasolato, S.; et al. Unveiling the binding mode of perfluorooctanoic acid to human serum albumin. Protein Sci. 2021, 30, 830–841. [Google Scholar] [CrossRef] [PubMed]
- Frutiger, A.; Tanno, A.; Hwu, S.; Tiefenauer, R.F.; Vörös, J.; Nakatsuka, N. Nonspecific Binding—Fundamental Concepts and Consequences for Biosensing Applications. Chem. Rev. 2021, 121, 8095–8160. [Google Scholar] [CrossRef] [PubMed]
- Lichtenberg, J.Y.; Ling, Y.; Kim, S. Non-Specific Adsorption Reduction Methods in Biosensing. Sensors 2019, 19, 2488. [Google Scholar] [CrossRef]
- Wael, E.D.A.-E.D.A.-G.M.A.-R.C.A.-K. De Mapping the gaps in chemical analysis for the characterisation of aptamer-target interactions. Trends Anal. Chem. 2021, 142, 116311. [Google Scholar] [CrossRef]
- Bottari, F.; Moro, G.; Sleegers, N.; Florea, A.; Cowen, T.; Piletsky, S.; van Nuijs, A.L.N.; De Wael, K. Electropolymerized o-Phenylenediamine on Graphite Promoting the Electrochemical Detection of Nafcillin. Electroanalysis 2020, 32, 135–141. [Google Scholar] [CrossRef]
- O’Connell, M.A.; Belanger, B.A.; Haaland, P.D. Calibration and assay development using the four-parameter logistic model. Chemom. Intell. Lab. Syst. 1993, 20, 97–114. [Google Scholar] [CrossRef]
- Yang, H.; Kim, H.J.; Zhang, L.; Strouse, R.J.; Schenerman, M.; Jiang, X.-R. Implementation of Parallelism Testing for Four-Parameter Logistic Model in Bioassays. PDA J. Pharm. Sci. Technol. 2012, 66, 262–269. [Google Scholar] [CrossRef]
- Solis-Marcano, N.E.; Morales-Cruz, M.; Vega-Hernández, G.; Gómez-Moreno, R.; Binder, C.; Baerga-Ortiz, A.; Priest, C.; Cabrera, C.R. PCR-assisted impedimetric biosensor for colibactin-encoding pks genomic island detection in E. coli samples. Anal. Bioanal. Chem. 2021, 413, 4673–4680. [Google Scholar] [CrossRef]
- Shiba, E.; Kim, S.J.; Taguchi, T.; Izukura, M.; Kobayashi, T.; Furukawa, J.; Yayoi, E.; Shin, E.; Takatsuka, Y.; Koyama, H.; et al. A prospective study on the prognostic significance of urokinase-type plasminogen activator levels in breast cancer tissue. J. Cancer Res. Clin. Oncol. 1997, 123, 555–559. [Google Scholar] [CrossRef] [PubMed]
- Borstnar, S.; Vrhovec, I.; Svetic, B.; Cufer, T. Prognostic Value of the Urokinase-Type Plasminogen Activator, and its Inhibitors and Receptor in Breast Cancer Patients. Clin. Breast Cancer 2002, 3, 138–146. [Google Scholar] [CrossRef] [PubMed]
- Lampelj, M.; Arko, D.; Cas-Sikosek, N.; Kavalar, R.; Ravnik, M.; Jezersek-Novakovic, B.; Dobnik, S.; Dovnik, N.F.; Takac, I. Urokinase plasminogen activator (uPA) and plasminogen activator inhibitor type-1 (PAI-1) in breast cancer-correlation with traditional prognostic factors. Radiol. Oncol. 2015, 49, 357–364. [Google Scholar] [CrossRef] [PubMed]
Disclaimer/Publisher’s Note: The statements, opinions and data contained in all publications are solely those of the individual author(s) and contributor(s) and not of MDPI and/or the editor(s). MDPI and/or the editor(s) disclaim responsibility for any injury to people or property resulting from any ideas, methods, instructions or products referred to in the content. |
© 2023 by the authors. Licensee MDPI, Basel, Switzerland. This article is an open access article distributed under the terms and conditions of the Creative Commons Attribution (CC BY) license (https://creativecommons.org/licenses/by/4.0/).