Abstract
In this study, we demonstrate a unique method for the detection of heavy metals such as chromium (Cr), copper (Cu), lead (Pb), and nickel (Ni) at trace levels in aqueous solutions via laser-induced breakdown spectroscopy (LIBS) enriched using chelating resin. Reduction in sample time preparation was shortened by tailoring the sample processing time with the aid of an enrichment method. The calibration curves and LODs of CH-90 chelating resin for enriching Cr, Cu, Pb, and Ni cations were established under the optimal conditions. The linear correlation coefficients were all above 0.98, and the detection limits were 0.148 mg/L, 0.150 mg/L, 0.149 mg/L, and 0.240 mg/L, corresponding to Cr, Cu, Pb, and Ni, respectively. The quantitative evaluation of the obtained results signifies that the proposed method is highly sensitive for detecting trace elements and offers a good correspondence of the acquired linear correlation with its calibration model. Results comparison with past studies suggests that the proposed method is able to achieve lower LODs for elements under investigation.
1. Introduction
With the development of the global economy and the acceleration of industrialization, environmental water pollution is becoming increasingly severe [1,2]. The mixing of untreated industrial wastewater containing lead, chromium, cadmium, copper, manganese, and other heavy metals into fresh water resources causes severe pollution to the natural water environment [3]. Therefore, it is necessary to detect heavy metals in water. According to the standards for drinking water quality GB5749-2006, the current standards for drinking water sanitation are Cr: 0.05 mg/L; Cu: 1.0 mg/L; Pb: 0.01 mg/L; and Ni: 1.0 mg/L.
At present, conventionally commercial analytical instruments such as inductively coupled plasma optical emission spectroscopy (ICP-OES) [4,5], inductively coupled plasma mass spectroscopy (ICP-MS) [6,7], atomic absorption spectroscopy (AAS) [8,9], X-ray fluorescence spectroscopy (XRF) [10], etc., are used for the analysis and detection of heavy metals in liquids. Although spectral analysis methods are able to provide high detection precision and excellent limits of detection (LODs), nonetheless, their preliminary sample processing steps are cumbersome and eventually spread secondary pollution. Laser-induced breakdown spectroscopy (LIBS) is a spectrochemical analysis method based on a spectral plasma generated using a pulsed laser. This technology focuses the high-energy pulsed laser beam on the surface of the target sample [11]. When the pulse laser energy exceeds the breakdown threshold of the sample, the sample surface is ablated, producing high-temperature plasma and forming ablation pits. When the laser induction stops, the energy of the plasma attenuates in the form of photons and radiates a characteristic spectrum with the information of the target element [12,13]. By collecting and analyzing the characteristic spectral information, the target samples can be qualitatively and quantitatively analyzed [14]. For the case of LIBS, the ablation is not limited by the sample’s physical state and can be directly applied to the detection of solid [15], liquid [16], gas [17], and aerosol [18] samples. However, the direct action of a laser on liquid samples causes many problems, including liquid sputtering, liquid level fluctuation, laser energy loss, and so on [19]. To solve these problems, the elements to be measured in the liquid are converted from the liquid phase to the enrichment matrix, after which LIBS technology is utilized to conduct qualitative and quantitative analysis. This method can greatly improve the detection sensitivity of liquid samples. Liquid analysis based on LIBS usually uses filter papers [20], graphite [21], wood slices [22], ZnO [23], dehydrated carbon [24], and montmorillonite [25] to convert liquid into solid samples.
Choi [3] et al. used filter paper as the enrichment base, put the filter paper into the glass dish containing the standard sample solution, and then put the glass dish in the oven to dry. In the experiment, Sr was used as the internal standard element to analyze Ca, and this analysis method was applied to measure Ca in tap water, bottled water, and groundwater samples. The results indicate that LIBS can be effectively applied for liquid analysis at the sub-parts per million level using a simple drying of liquid solutions on filter paper and using the correct internal standard elements with similar valence electronic structure. Li [21] et al. used a hydrophilic graphite sheet with an annular groove as the adsorption substrate. The sample solution was added to the graphite sheet of the annular groove, dried via an electromagnetic heating method, and Cd, Cr, Cu, Ni, Pb, and Zn cations in the solution were analyzed by employing LIBS. The relative standard deviation (RSD) was less than 6% and the LODs of these six heavy metal cations Cd, Cr, Cu, Ni, Pb, and Zn were 0.029, 0.087, 0.012, 0.083, 0.125, and 0.049 mg/L, respectively. Xiu et al. [20] used filter paper as the adsorption material, dropping the sample solution on filter paper placed on the surface of the metal target material, and the filter paper was dried out to isolate the metal target material, after which the pulse laser was focused on the filter paper to generate plasma. The measured LODs for Cd, Mn, Cr, and Cu cations in the liquid were 0.165, 0.035, 0.012, and 0.078 mg/L, respectively. Chen et al. [22] used wood chips as an enrichment material to transfer the elements to be measured in the liquid sample to the solid matrix for analysis. Based on the above method, Cr, Mn, Cu, Cd, and Pb cations in liquid samples were analyzed, and a calibration model was established. The linear correlation coefficient range for Cr, Mn, Cu, Cd, and Pb cations was 0.996~0.999, and their detection limits were 0.034, 0.036, 0.029, 0.590, and 0.074 mg/L respectively. Compared with the direct action of a pulsed laser on liquid samples, this method improved the detection sensitivity by 2–3 times. Wei et al. [23] used ZnO as an enrichment substrate to detect Cr in ink. In order to obtain a better tableting effect, KBr was used as the adhesive material during the tableting process, and it was mixed with dry ZnO powder evenly before tableting. The LOD for the Cr measured using this method was 9 mg/L. Huang et al. [26] introduced liquid samples through an electrospray and developed a method based on plasma-induced current normalization with a detection limit of 1.5 mg/L. Song et al. [27] quantitatively analyzed Cu, Mg, Zn, and Cd via the liquid jet method. The liquid to be measured was a mixed solution of these cations. The calibration curves were plotted against Cu, Mg, Zn, and Cd, and their linear correlation coefficients were found to be greater than 0.99. The LODs for Cu, Mg, Zn, and Cd were 5.62, 4.71, 13.67, and 4.43 mg/L, respectively. Tian et al. [28] analyzed Cd in drinking water via LIBS using chelating resin as the enrichment material. The authors used an appropriate amount of resin, washed it with pure water, filtered it, and dried it in air for 10 min. The resin was placed in a bottle containing standard solution, then shaken for 40 min to mix the resin and solution. Finally, the resin was taken out and placed on a glass sheet for detection and analysis. The detection limit was 3.6 μg/L, lower than the limit specified by the Chinese drinking water standard. Wang et al. [29] analyzed heavy metals such as Pb, Cd, Ni, etc. in water using LIBS combined with an aluminum electrode enrichment method. The RSDs of the recorded spectral intensities for the cases of Pb, Cd, and Ni were 5.98%, 4.25%, and 5.27%, respectively. The measured detection limits of these heavy metals, e.g., Pb, Cd, and Ni, were 1.2, 3.1, and 1.7 ppb, respectively. In the same fashion, one of the research works regarding the detection of heavy metal contents, e.g., Ni, Cr, and Cd, in the aqueous solution was conducted by Niu et al. [30] based on the use of aluminum oxide (Al2O3) nanoparticles (NPs). Limits of detection obtained for Ni, Cr, and Cd were 9.61, 8.49, and 71.6 mg/L (under 532 nm laser ablation), and 22.5, 20.4, and 83.8 mg/L (under 1064 nm laser ablation), respectively, for the case of 45 mL solutions used for enrichment and adsorption procedures. The RSDs of all elements were about 12% or 13%. The research shows that it is feasible to use the above materials as solid substrate, and better analysis results can be obtained. However, the introduction of the above materials causes certain defects in the actual experimentation. For example, the manufacturing steps of dehydrated carbon [24] are cumbersome in the actual production, and there are many interfering elements in filter paper [20], wood chips [22], CaO [23], montmorillonite [25] and other matrices, increasing the probability of interference with the spectral intensity of the actual analytes in the solution. Taking into account the summary of the above-mentioned factual problems, this method cannot be adopted on a large scale [31].
In this paper, we demonstrate a unique method for the detection of the heavy metal cations chromium (Cr), copper (Cu), lead (Pb), and nickel (Ni) in aqueous solutions at trace concentrations using LIBS enriched with chelating resins. The calibration curves of CH-90 chelating resin for enriching Cr, Cu, Pb, and Ni were established under optimal conditions. The linear correlation coefficients were all above 0.98, and the detection limits for Cr, Cu, Pb, and Ni were 0.148 mg/L, 0.150 mg/L, 0.149 mg/L, and 0.240 mg/L, respectively.
2. Materials and Methods
2.1. LIBS Experimental Setup
The LIBS system used in this study included a Q-switched Nd: YAG laser (Ultra 100, Quantel, Les Ulis, France), a spectrometer (Shamrock SR-750, Andor, Belfast, Britain), an intensified charge-coupled device (ICCD, DH340T-18U-03, Andor, Belfast, Britain), a reflector, a focusing lens, a three-dimensional displacement platform, and a computer, as shown in Figure 1. The fundamental frequency of the laser was 1064 nm, the maximum output energy was 100 mJ, and the repetition rate was 20 Hz.
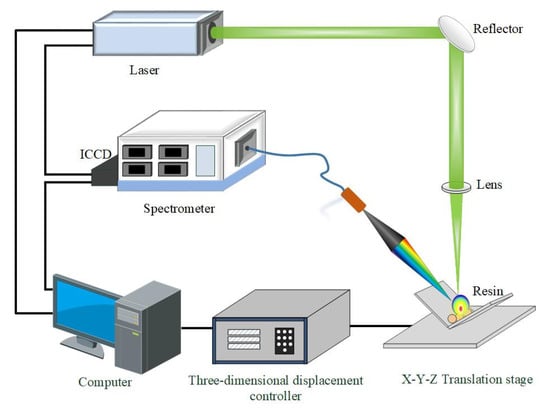
Figure 1.
Schematic diagram of laser-induced breakdown spectroscopy system.
The tested sample was placed on a fixed translation platform, and the sample particles were fixed with clay to prevent the laser from changing its position and ensure the signal’s stability during detection. To increase signal background ratio (SBR) and reduce instability, each recording was performed by accumulating signals from 20 ablation events. The laser was reflected and focused on the top of the chelated resin. The laser-induced plasma signal was collected using optical fibers at the approximately 45° side and fed directly into the spectrometer equipped with the intensified charge-coupled device (ICCD) detector.
2.2. Sample Preparation
The chelating resin Lewatit CH-90 was purchased from Yicheng Chemical Co., LTD. (Shanghai, China) and used to absorb the heavy metals. Standard samples (1000 mg/L) of Cr, Cu, Pb, and Ni were prepared by dissolving CuSO4•5H2O, Cr(NO3)3•9H2O, Pb (CH3COO)2•3H2O, and NiSO4•6H2O in deionized water and storing in the dark; these were then diluted into a standard solution containing different concentrations as needed.
The preparation process of the samples is schematically shown in Figure 2 and mainly included the following steps:
- Weigh a certain amount of chelating resin, place it in a beaker filled with deionized water, shake it for several minutes, then remove the chelating resin;
- Add about 20 mL of the solution to be tested into the beaker, place the processed chelating resin in the beaker containing the solution to be tested, and then place the beaker on the blender to stir the solution at a certain speed so that the resin can fully absorb the heavy metal cations in the solution;
- After enrichment, remove the chelated resin particles in the beaker, place them in the air, and dry them in open air for about 10 min. After a certain treatment of the waste liquid, pour it into a waste liquid barrel.

Figure 2.
Schematic diagram of sample preparation process.
Figure 2.
Schematic diagram of sample preparation process.

Steps of the test samples prepared for LIBS according to the method described above are shown in Figure 3. In addition, a small groove was observed on the surface of the prepared samples after testing.
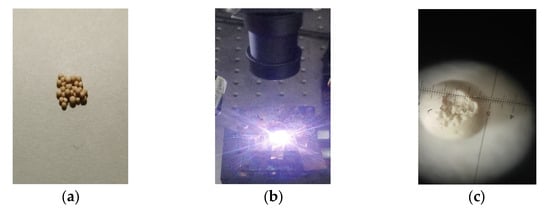
Figure 3.
LIBS test samples. (a) Chelating resin before LIBS applicability. (b) LIBS interaction with sample. (c) Chelating resin after LIBS applicability.
Blank samples were also prepared according to the sample preparation process described above. For Cr, the corresponding blank solution was replaced by deionized water with pH 5. For Cu, Pb and Ni, the corresponding blank solution was replaced by deionized water with pH value 3. It is worth noting that this whole sample preparation process does not involve expensive equipment, the operations are simple, and the preparation time is short. As a new and low-cost adsorbent, resins offer a promising alternative for LIBS liquid analysis.
3. Results
3.1. Optimization of Experimental Parameters
In the LIBS detection process, many factors affect the experimental results. Therefore, experimental parameters such as laser fluence, ICCD detection delay, resin granules, and enrichment time were optimized to obtain better analytical results. Peak intensity and SBR were evaluated under different parameter settings.
In the optimization process of different parameters, an interval range was first adjusted according to previous research experience, after which, in the subsequent parameter optimization process, the spectral signal strength, signal-background ratio, and RSD were taken as the analysis indexes. Except for the experimental parameters analyzed, the experimental parameters remained unchanged. In this section, the optimization of experimental parameters was carried out based on Cr characteristic analysis at the spectral line of 425.43 nm, Cu characteristic analysis at the spectral line of 324.76 nm, Pb characteristic analysis at the spectral line of 406.08 nm, and Ni characteristic analysis at the spectral line of 352.88 nm. The samples used in the experiment were 0.2 g CH-90 chelating resins enriched with concentrations of 10 mg/L standard solution of each element, and the volume of the standard solution was fixed as 20 mL. When the laser was applied to the sample, the ICCD detection gate width was fixed at 3 μs during the spectral acquisition process.
3.1.1. Optimization of Laser Fluence
Laser fluence is a crucial parameter that directly affects the formation and radiation of laser-induced plasma. To obtain better detection sensitivity, it is necessary to select an appropriate laser fluence. It can be seen from Figure 4 that with the gradual increase in laser fluence, the spectral intensity of characteristic spectral lines gradually increases, but SBR gradually decreases. Because the intensity of background signal and characteristic spectral line also increases with the increase in laser fluence, but the growth rate of background signal is faster than that of the characteristic spectral line, the SBR decreases gradually. Considering the spectral intensity and SBR of the characteristic spectral lines, 23 J/cm2 was selected as the best laser fluence for Cr, 25 J/cm2 for Pb and Cu, and 28 J/cm2 for Ni.
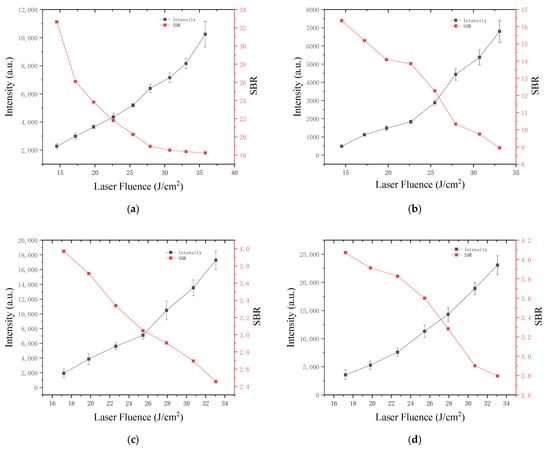
Figure 4.
Optimization of laser fluence on the emission of (a) Cr; (b) Cu; (c) Pb; (d) Ni.
3.1.2. Optimization of ICCD Delay Time
Since the lifetime of laser-induced plasma is very short and only several tens of microseconds, the spectral intensity and background signal of the characteristic spectral lines of laser-induced plasma are affected by ICCD detection delay time. The appropriate detection delay time can lead to higher detection sensitivity and avoid excessive interference. In the study, different detection delays were selected by adjusting the delay time of ICCD detection using Andor SOLIS software, and then the influence of detection delay time on the spectral signals of the characteristic emission spectral lines of the tested elements were analyzed. The effect of delay time on spectral intensity in the range 0.5–4.5 μs is illustrated in Figure 5. With the increase in detection delay time, spectral line intensity decreases and the SBR increases; this is because at the beginning of laser-induced plasma formation, the characteristic spectral line and background signal strength are higher, so the SBR is low, but with the increase in detection delay time, the background signal falls faster, and the characteristic spectral line intensity is reduced. Overall, after consideration, a 1.5 μs ICCD detection delay time was selected as the best detection delay time for Cr, Cu, Pb, and Ni.
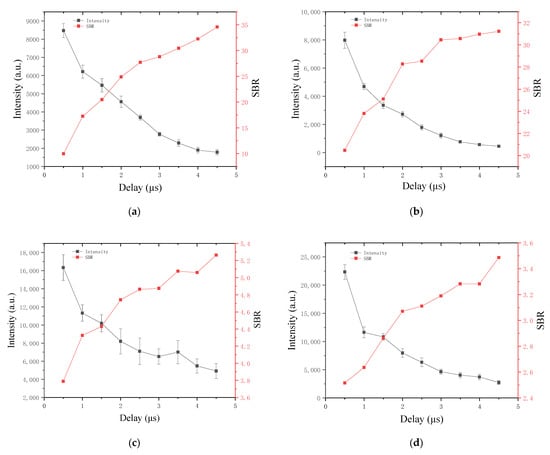
Figure 5.
Optimization of ICCD delay time on the emission of (a) Cr; (b) Cu; (c) Pb; (d) Ni.
3.1.3. Effects of Resin Granule on the Spectral Intensity
The content of a sample resin is one of the essential parameters related to whether the resin can adsorb the metal cations in the solution to be tested, this affecting the spectral signal intensity of the characteristic emission spectrum of the elements to be tested. Therefore, in the course of the experiment, the influence of resin content on the spectral signal of the characteristic emission line of the measured element was analyzed by weighing different resin contents.
The resin contents were adjusted from 0.1 g to 0.05 g, and the relationship between the resin contents and the intensity of the characteristic emission lines was obtained as shown in Figure 6. By analyzing the changing trend of the spectral intensity and resin content of the characteristic emission spectral line of the elements to be measured in the waste liquid, the best resin content value was obtained. It can be seen from Figure 6 that with the gradual increase in the content of resin particles, the spectral signal intensity of the characteristic emission spectrum of the elements to be measured in the waste liquid gradually decreases. This is because with the increase in the content of resin particles, the content of metal cations that it can adsorb increases gradually. When numerical particles weigh content increases to about 0.2 g, the metal cations in the solution are basically completely adsorbed. Therefore, 0.2 g resin can completely adsorb cations in the solution, so 0.2 g resin content was selected as the best resin content.
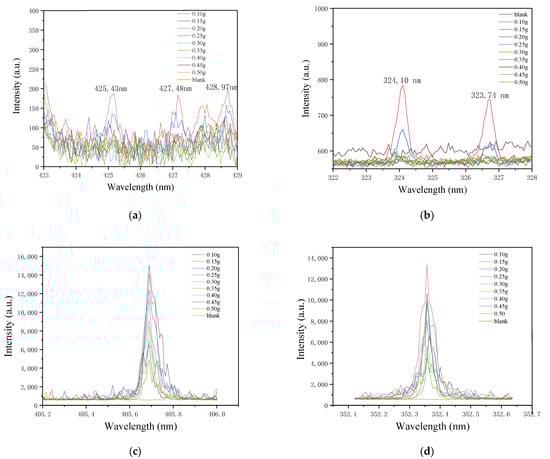
Figure 6.
Optimization of resin content on the emission of (a) Cr; (b) Cu; (c) Pb; (d) Ni.
3.1.4. Optimization of Enrichment Time
Sample enrichment time is also an important parameter related to the time required by the resin to adsorb metal cations from the solution. During the experiment, different enrichment times were selected to analyze the effect of enrichment time on the spectral signal of the characteristic emission line. The enrichment time started from 5 min and was gradually adjusted. Then, the relationship between the enrichment time and the intensity of the characteristic emission line was obtained, as shown in Figure 7. The optimum enrichment time was obtained by analyzing the variation trend of spectral intensity and enrichment time of characteristic emission lines of the elements to be measured.
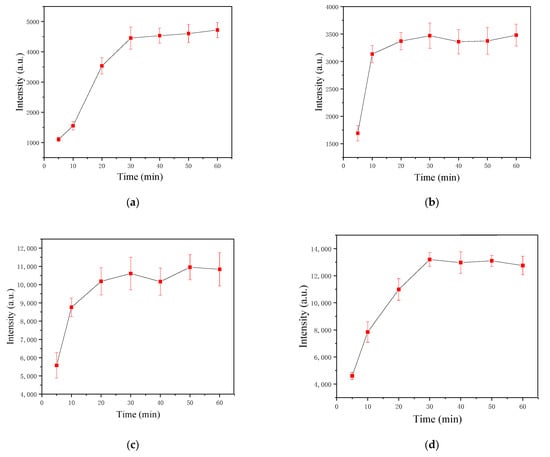
Figure 7.
Optimization of enrichment time on the emission of (a) Cr; (b) Cu; (c) Pb; and (d) Ni.
As can be seen from Figure 7, the spectral intensity of element characteristic lines increases gradually with the increase in enrichment time and tends to remain unchanged. This is because the enrichment capacity of resin particles tends to be saturated as a result of extension in enrichment time. With this in mind, the enrichment time continues to increase until the resin can no longer adsorb heavy metals. For Cr, Pb, and Ni, when the enrichment time reaches 30 min, the spectral intensity of the characteristic spectral line also reaches the maximum, and when the enrichment time further increases, the spectral intensity of the characteristic spectral line remains unchanged, obviously signaling that the resin has wholly adsorbed the Cr cations in the solution. For Cu, when the enrichment time reaches 20 min, the spectral intensity of its characteristic line reaches the maximum, which indicates that the resin has completely absorbed the Cu cations in the solution. In conclusion, 30 min was selected as the best enrichment time for Cr, Pb and Ni, and 20 min was selected as the best enrichment time for Cu.
3.2. Quantitative Analysis
3.2.1. Calibration Model and Limit of Detection
Factors affecting the enrichment process and those responsible for affecting laser-induced plasma processes were optimized using the sequential test method, and the optimal experimental conditions were obtained as follows: For Cr, the optimal concentration of chelate resin was 0.2 g, the optimal enrichment time was 30 min, the optimal laser energy fluence was 23 mJ/cm2, and the optimal ICCD detection delay time was 1.5 μs. For Cu, the optimal concentration of chelate resin was 0.2 g, the optimal enrichment time was 20 min, the optimal laser energy fluence was 25 mJ/cm2, and the optimal ICCD detection delay time was 1.5 μs. For Pb, the optimal concentration of chelate resin was 0.2 g, the optimal enrichment time was 30 min, the optimal laser energy fluence was 25 mJ/cm2, and the optimal ICCD detection delay time was 1.5 μs. For Ni, the optimal concentration of chelate resin was 0.2 g, the optimal enrichment time was 30 min, the optimal laser energy fluence was 28 mJ/cm2, and the optimal ICCD detection delay time was 1.5 μs. The standard external method was used to establish calibration curves under the conditions of the best experimental parameters mentioned above, and a series of standard solutions with different concentrations containing the cations to be tested were configured to verify and analyze the calibration curves.
In the process of establishing the calibration model, it was first necessary to configure standard solutions with different concentrations as the sample solution to be tested. After the samples were prepared, LIBS technology was used to quantitatively analyze the samples. The calibration curves of Cr, Cu, Pb, and Ni were obtained by fitting the collected spectral data with Origin software, as shown in Figure 8. In the analytical formula, y represents the spectral intensity of metal emission in the unit a.u. (arbitrary unit), and x represents the concentration unit in mg/L.
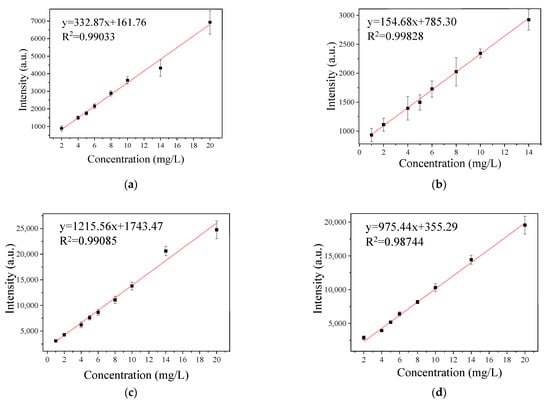
Figure 8.
Calibration model: (a) Cr; (b) Cu; (c) Pb; (d) Ni.
As can be seen from Figure 8, the abscissa of the calibration model is the concentration of the sample to be measured, and the ordinate is the corresponding spectral line intensity. It can be seen from the figure that the linear correlation coefficient of Cr is 0.990. The linear correlation coefficient of Cu is 0.998. The linear correlation coefficient of Pb is 0.990. The linear correlation coefficient of Ni is 0.987. The linear correlation coefficients are all above 0.98, indicating that the intensity of characteristic spectral lines has a good linear relationship with the concentration of standard solution, which further indicates that chelating resin as an enrichment material has a good linear correlation when applied to LIBS liquid detection. In addition, in the experiment, the standard deviation of the background signal was obtained by collecting the spectral data of 10 blank samples and calculating the average value. By calculation, the detection limits of Cr, Cu, Pb and Ni are 0.148 mg/L, 0.150 mg/L, 0.149 mg/L, and 0.240 mg/L, respectively. Although the LODs of some elements in this study did not meet the standards of drinking water, chelated resin-assisted LIBS technology, as a new and excellent enrichment material, has broad prospects in the detection of liquid samples.
Table 1 lists the limits of detection of Cr, Cu, Pb, and Ni in liquid obtained by LIBS and different enrichment bases in previous references. LODs obtained in this study were better than most previous studies because of the strong ability of the chelating resin to remove metal cations from solution to solid matrix. In addition to this sensitivity, this method does not involve expensive materials and complex procedures. Therefore, it is more practical than other techniques and thus holds potential for field application.

Table 1.
Comparison of LODs of different enrichment substrates.
3.2.2. Analysis of Prediction Accuracy
To demonstrate prediction accuracy of the calibration model, a series of standard solutions with different concentrations containing elements to be tested were configured, and then the samples to be tested for LIBS were prepared according to the process shown in Figure 2. Then, LIBS detection and analysis were carried out, and the spectral intensities of the obtained characteristic spectral lines were substituted into the calibration curve (shown in Figure 8) to calculate the corresponding predicted concentrations.
The relative error (RE) evaluates the prediction accuracy of the established calibration model. As can be seen from Table 2, the relative error of the additive concentration and predicted concentration ranged from 1.25% to 10.40%, indicating that the predicted values calculated using the calibration model established by the method proposed in this study are close to the true values, which indicates that the calibration model has high accuracy.
Table 2.
Accuracy of prediction.
3.3. Natural Water Sample Analysis
The above calibration models were all obtained from the standard solution configured in the laboratory, and the standard solution used in the laboratory was obtained by dissolving the solute in deionized water. However, various chemical properties of natural water bodies and deionized water are different. There are many kinds of ions in actual water samples. If the solute is dissolved in a natural water body, the various impurity ions in the water body may affect the adsorption effect of the chelating resin on the target metal elements, and then affect the characteristic spectral line intensity of the target elements, resulting in unreliable analysis results. Therefore, the feasibility of applying the proposed method to the analysis of actual water bodies was verified by the study of the recovery rate of the added standard by collecting actual water samples.
Recovery rate refers to the ratio between the result obtained and the theoretical value when quantitative reference material is added to the sample matrix without measured substance and analyzed according to the processing steps of the sample. Its calculation expression is:
Observed = observed concentration;
Unspiked = unspiked concentration;
Spiked = spiked concentration.
To demonstrate the accuracy and feasibility of the calibration model established in this study, Liangfengya spring water from the Nan’an District of Chongqing and Tushan Lake water samples (Nanshan Street of Nan’an District of Chongqing) were collected to study the recovery rate. The actual water sample without any standard solution was analyzed using LIBS technology, and it was found that there were no characteristic spectral lines of the elements to be measured. Therefore, the unspiked concentration could be considered as 0. A series of sample solutions containing different concentrations of Cr, Cu, Pb, and Ni (e.g., of 5, 8, and 10 mg/L concentration gradients) were prepared by diluting the natural spring water samples and the filtered Tushan Lake water samples with the mother liquor of the elements to be tested and acidified to their respective pH values. Then, the samples were prepared according to the process shown in Figure 2, and the quantitative analysis was carried out using LIBS technology. The study data are shown in Table 3.
Table 3.
Concentration and recovery of natural spring water.
4. Conclusions
An analytical method was developed for the separation and determination of heavy metals in aqueous solution via LIBS to determine Cr, Cu, Pb, and Ni in aqueous solutions, using chelating resin for adsorption and higher-sensitivity analysis after careful experimental optimization. The measured detection limits for Cr, Cu, Pb, and Ni were 0.148, 0.150, 0.149, and 0.240 mg/L, respectively. The detection results show that the proposed method has high detection sensitivity, along with the calibration curves having good linear correlation tendency, and offers a lower limit of detection compared with previously reported studies. Contemplation of the relative error to probe the accuracy of the calibration model established that the relative error range between the predicted and actual concentrations was in the range 1.25% ~ 10.40%. Consistency is witnessed between the predicted concentration values calculated using the calibration model with the actual concentration values, clearly denoting the high accuracy of the calibration model. Furthermore, natural water samples were collected to determine the spiked recovery rates, measured in the range from 93.50% to 99.75% for Cr, from 92.20% to 108.3% for Cu, from 92.52% to 108.99% for Pb, and from 98.01% to 106.38% for Ni. Our experimental results indicate the suitability of the calibration curves established using the proposed method for detecting natural water contents.
Author Contributions
Conceptualization, J.W.; methodology and writing—original draft, G.L.; funding acquisition and validation, P.Z., J.W., H.T. and D.D; writing—review and editing, S.S. and H.I.A.Q.; formal analysis, J.L. and S.L.; resources, H.T. and D.D. All authors have read and agreed to the published version of the manuscript.
Funding
This work was financially supported by the National Natural Science Foundation of China (32171627, 62105050), the Distinguished Scientist Development Program of Beijing Academy of Agriculture and Forestry Sciences (JKZX202209),the Natural Science Foundation of Chongqing (cstc2020jcyj-msxmX0147) and the Science and Technology Research Program of Chongqing Municipal Education Commission (KJQN202000640, KJZD-M202200602).
Institutional Review Board Statement
Not applicable.
Informed Consent Statement
Not applicable.
Data Availability Statement
Not applicable.
Conflicts of Interest
The authors declare no conflict of interest.
References
- Heidari, A.; Younesi, H.; Mehraban, Z. Removal of Ni(II), Cd(II), and Pb(II) from a ternary aqueous solution by amino functionalized mesoporous and nano mesoporous silica. Chem. Eng. J. 2009, 153, 70–79. [Google Scholar] [CrossRef]
- Jarup, L. Hazards of heavy metal contamination. Br. Med. Bull. 2003, 68, 167–182. [Google Scholar] [CrossRef]
- Choi, D.; Gong, Y.; Nam, S.H.; Han, S.H.; Yoo, J.; Lee, Y. Laser-Induced Breakdown Spectroscopy (LIBS) Analysis of Calcium Ions Dissolved in Water Using Filter Paper Substrates: An Ideal Internal Standard for Precision Improvement. Appl. Spectrosc. 2014, 68, 198–212. [Google Scholar] [CrossRef]
- Rehan, I.; Gondal, M.A.; Almessiere, M.A.; Dakheel, R.A.; Rehan, K.; Sultana, S.; Dastageer, M.A. Nutritional and toxic elemental analysis of dry fruits using laser induced breakdown spectroscopy (LIBS) and inductively coupled plasma atomic emission spectrometry (ICP-AES). Saudi J. Biol. Sci. 2021, 28, 408–416. [Google Scholar] [CrossRef]
- Rehan, I.; Gondal, M.A.; Rehan, K. Determination of lead content in drilling fueled soil using laser induced spectral analysis and its cross validation using ICP/OES method. Talanta 2018, 182, 443–449. [Google Scholar] [CrossRef] [PubMed]
- Voica, C.; Kovacs, M.H.; Dehelean, A.; Ristoiu, D.; Iordache, A. ICP-MS Determinations of Heavy Metals in Surface Waters From Transylvania. Rom. J. Phys. 2012, 57, 1184–1193. [Google Scholar]
- de Souza, R.M.; Meliande, A.; Da Silveira, C.; Aucelio, R.Q. Determination of Mo, Zn, Cd, Ti, NiVFe, Mn, Cr and Co in crude oil using inductively coupled plasma optical emission spectrometry and sample introduction as detergentless microemulsions. Microchem. J. 2006, 82, 137–141. [Google Scholar] [CrossRef]
- Beinrohr, E.; Manova, A.; Dzurov, J. Preconcentration of Cr (III) and total Cr in waters for flame AAS in a flow-through electrochemical/sorption cell. Fresenius J. Anal. Chem. 1996, 355, 528–531. [Google Scholar] [CrossRef] [PubMed]
- Huang, Q.Q.; Liu, X.; Zhang, Q.; Qiao, Y.H.; Su, D.C.; Jiang, R.F.; Rui, Y.K.; Li, H.F. Application of ICP-MS and AFS to Detecting Heavy Metals in Phosphorus Fertilizers. Spectrosc. Spectr. Anal. 2014, 34, 1403–1406. [Google Scholar]
- Nakano, K.; Okubo, K.; Tsuji, K. Preconcentration of environmental waters by agar for XRF analysis. Powder Diffr. 2009, 24, 135–139. [Google Scholar] [CrossRef]
- Zhang, Q.F.; Zhang, Q.D.; Ye, Z.X.; Liu, T. Study of cardiovascular and cerebrovascular disease in Chinese traditional medicines on Pb, Cr, Cd by AAS. Spectrosc. Spectr. Anal. 2001, 21, 865–867. [Google Scholar]
- Rusak, D.A.; Castle, B.C.; Smith, B.W.; Winefordner, J.D. Fundamentals and applications of laser-induced breakdown spectroscopy. Crit. Rev. Anal. Chem. 1997, 27, 257–290. [Google Scholar] [CrossRef]
- Arca, G.; Ciucci, A.; Palleschi, V.; Rastelli, S.; Tognoni, E. Trace element analysis in water by the laser-induced breakdown spectroscopy technique. Appl. Spectrosc. 1997, 51, 1102–1105. [Google Scholar] [CrossRef]
- Yuan, R.; Tang, Y.; Zhu, Z.; Hao, Z.; Li, J.; Yu, H.; Yu, Y.; Guo, L.; Zeng, X.; Lu, Y. Accuracy improvement of quantitative analysis for major elements in laser-induced breakdown spectroscopy using single-sample calibration. Anal. Chim. Acta 2019, 1064, 11–16. [Google Scholar] [CrossRef] [PubMed]
- Zheng, P.C.; Zheng, S.; Wang, J.M.; Liao, X.Y.; Li, X.J.; Peng, R. Study on Grade Identification of Dendrobium by LIBS. Spectrosc. Spectr. Anal. 2020, 40, 941–944. [Google Scholar]
- Wang, L.; Xu, L.; Xu, W.Q.; Yao, G.X.; Zheng, X.F.; Cui, Z.F. Single- and Dual-Pulse Laser Induced Breakdown Spectroscopy for Aluminum in Liquid Jets. Spectrosc. Spectr. Anal. 2018, 38, 314–319. [Google Scholar]
- Rong, K.; Wang, Z.Z.; Hu, R.M.; Liu, R.W.; Deguchi, Y.; Yan, J.J.; Liu, J.P. Experimental study on mercury content in flue gas of coal-fired units based on laser-induced breakdown spectroscopy. Plasma Sci. Technol. 2020, 22, 074010. [Google Scholar]
- Diaz, D.; Hahn, D.W. Aerosol measurements with laser-induced breakdown spectroscopy and conditional analysis. Spectrochim. Acta Part B-At. Spectrosc. 2021, 179, 106107. [Google Scholar]
- Agrawal, Y.K.; Sharma, K.R. Speciation, liquid-liquid extraction, sequential separation, preconcentration, transport and ICP-AES determination of Cr(III), Mo(VI) and W(VI) with calix-crown hydroxamic acid in high purity grade materials and environmental samples. Talanta 2005, 67, 112–120. [Google Scholar] [CrossRef]
- Xiu, J.; Gao, Q.; Liu, S.; Qin, H. Quantitative Analysis of Trace Metals in Aqueous Solutions by Laser Induced Breakdown Spectroscopy Combined with Filter Paper Assisted Analyte Enrichment. J. Appl. Spectrosc. 2020, 87, 629–635. [Google Scholar] [CrossRef]
- Fang, L.; Zhao, N.J.; Ma, M.J.; Meng, D.S.; Jia, Y.; Huang, X.J.; Liu, W.Q.; Liu, J.G. Detection of heavy metals in water samples by laser-induced breakdown spectroscopy combined with annular groove graphite flakes. Plasma Sci. Technol. 2019, 21, 034002. [Google Scholar]
- Chen, Z.J.; Li, H.K.; Liu, M.; Li, R.H. Fast and sensitive trace metal analysis in aqueous solutions by laser-induced breakdown spectroscopy using wood slice substrates. Spectrochim. Acta Part B-At. Spectrosc. 2008, 63, 64–68. [Google Scholar] [CrossRef]
- Wei, J.; Zhang, T.L.; Dung, J.; Sheng, L.W.; Tang, H.S.; Yang, X.F.; Li, H. Quantitative Determination of Cr in Ink by Laser-induced Breakdown Spectroscopy(LIBS) Using ZnO as Adsorbent. Chem. Res. Chin. Univ. 2015, 31, 909–913. [Google Scholar] [CrossRef]
- Niu, G.H.; Shi, Q.; Xu, M.J.; Lai, H.J.; Lin, Q.Y.; Liu, K.P.; Duan, Y.X. Dehydrated Carbon Coupled with Laser-Induced Breakdown Spectrometry (LIBS) for the Determination of Heavy Metals in Solutions. Appl. Spectrosc. 2015, 69, 1190. [Google Scholar] [CrossRef]
- Teran, E.J.; Montes, M.L.; Rodriguez, C.; Martino, L.; Quiroga, M.; Landa, R.; Sanchez, R.; Pace, D. Assessment of sorption capability of montmorillonite clay for lead removal from water using laser-induced breakdown spectroscopy and atomic absorption spectroscopy. Microchem. J. 2019, 144, 159–165. [Google Scholar] [CrossRef]
- Huang, J.S.; Lin, K.C. Laser-induced Breakdown Spectroscopy of Liquid Droplets Based on Plasma-induced Current Correlation. J. Chin. Chem. Soc. 2014, 61, 175–186. [Google Scholar] [CrossRef]
- Song, C.; Zhang, Y.W.; Gao, X. Detection of Heavy Metal Elements in the Mixture Solution with Laser Induced Breakdown Spectroscopychi. Spectrosc. Spectr. Anal. 2017, 37, 1885–1889. [Google Scholar]
- Tian, H.W.; Jiao, L.Z.; Dong, D.M. Rapid determination of trace cadmium in drinking water using laser-induced breakdown spectroscopy coupled with chelating resin enrichment. Sci. Rep. 2019, 9, 10443. [Google Scholar] [CrossRef] [PubMed]
- Wang, Y.Y.; Zhao, N.J.; Ma, M.J.; Fang, L.; Yu, Y.; Meng, D.S.; Gu, Y.H.; Jia, Y.; Liu, J.G.; Liu, W.Q. Study on Detection Sensitivity of Heavy Metal in Water Based on LIBS Combined with Electrode Enrichment Method. Spectrosc. Spectr. Anal. 2017, 37, 884–888. [Google Scholar]
- Niu, S.; Zheng, L.J.; Khan, A.Q.; Zeng, H.P. Laser-Induced Breakdown Spectroscopic (LIBS) Analysis of Trace Heavy Metals Enriched by Al2O3 Nanoparticles. Appl. Spectrosc. 2019, 73, 380–386. [Google Scholar] [CrossRef]
- Yaroshchyk, P.; Morrison, R.; Body, D.; Chadwick, B.L. Quantitative determination of wear metals in engine oils using LIBS: The use of paper substrates and a comparison between single- and double-pulse LIBS. Spectrochim. Acta Part B-At. Spectrosc. 2005, 60, 1482–1485. [Google Scholar] [CrossRef]
- Chen, C.H.; Niu, G.H.; Shi, Q.; Lin, Q.Y.; Duan, Y.X. Laser-induced breakdown spectroscopy technique for quantitative analysis of aqueous solution using matrix conversion based on plant fiber spunlaced nonwovens. Appl. Opt. 2015, 54, 8318–8325. [Google Scholar] [CrossRef]
- Hu, L.; Zhao, N.J.; Liu, W.Q.; Meng, D.H.; Fang, L.; Wang, Y.; Yu, Y.; Ma, M.J. Quantitative Analysis of Heavy Metals in Water Based on LIBS with an Automatic Device for Sample Preparation. Plasma Sci. Technol. 2015, 17, 699–703. [Google Scholar]
- Xiu, J.S.; Zhong, S.L.; Hou, H.M.; Lu, Y.; Zheng, R.E. Quantitative Determination of Manganese in Aqueous Solutions and Seawater by Laser-Induced Breakdown Spectroscopy (LIBS) Using Paper Substrates. Appl. Spectrosc. 2014, 68, 1039–1045. [Google Scholar] [CrossRef]
- Lin, Q.Y.; Bian, F.; Wei, Z.M.; Wang, S.; Duan, Y.X. A hydrogel-based solidification method for the direct analysis of liquid samples by laser-induced breakdown spectroscopy. J. Anal. At. Spectrom. 2017, 32, 1412–1419. [Google Scholar] [CrossRef]
- Zhu, D.H.; Chen, J.P.; Lu, J.; Ni, X.W. Laser-induced breakdown spectroscopy for determination of trace metals in aqueous solution using bamboo charcoal as a solid-phase extraction adsorbent. Anal. Methods 2012, 4, 819–823. [Google Scholar] [CrossRef]
- Suyanto, H.; Utomo, A.P.; Manurung, M.; Suharta, W.G. Application of activated zeolite to quantitative analysis of Pb liquid sample using commercial laser-induced breakdown spectroscopy (LIBS). J. Phys. 2017, 817, 012044. [Google Scholar] [CrossRef]
- Ma, M.J.; Fang, L.; Zhao, N.J.; Huang, X.J.; Meng, D.S.; Pan, C.C.; Liu, J.G.; Liu, W.Q. Simultaneous detection of heavy metals in solutions by electrodeposition assisted laser induced breakdown spectroscopy. J. Laser Appl. 2022, 34, 012021. [Google Scholar] [CrossRef]


Disclaimer/Publisher’s Note: The statements, opinions and data contained in all publications are solely those of the individual author(s) and contributor(s) and not of MDPI and/or the editor(s). MDPI and/or the editor(s) disclaim responsibility for any injury to people or property resulting from any ideas, methods, instructions or products referred to in the content. |
© 2023 by the authors. Licensee MDPI, Basel, Switzerland. This article is an open access article distributed under the terms and conditions of the Creative Commons Attribution (CC BY) license (https://creativecommons.org/licenses/by/4.0/).