Article

Automatic Analysis of Isothermal Amplification via Impedance Time-Constant-Domain Spectroscopy: A SARS-CoV-2 Case Study

by
Roberto G. Ramírez-Chavarría
1,*,
Elizabeth Castillo-Villanueva
1,2,
Bryan E. Alvarez-Serna
1,
Julián Carrillo-Reyes
3,
Lizeth Torres
1,
Rosa María Ramírez-Zamora
1,
Germán Buitrón
3 and
Luis Alvarez-Icaza
1
1
Instituto de Ingeniería, Universidad Nacional Autónoma de México, Ciudad de México 04510, Mexico
2
Departamento de Microbiología y Parasitología, Facultad de Medicina, Universidad Nacional Autónoma de México, Ciudad de México 04510, Mexico
3
Laboratorio de Investigación en Procesos Avanzados de Tratamiento de Aguas, Unidad Académica Juriquilla, Instituto de Ingeniería, Universidad Nacional Autónoma de México, Querétaro 76230, Mexico
*
Author to whom correspondence should be addressed.
Chemosensors 2023, 11(4), 230; https://doi.org/10.3390/chemosensors11040230
Submission received: 20 February 2023 / Revised: 4 April 2023 / Accepted: 5 April 2023 / Published: 7 April 2023
(This article belongs to the Special Issue Electrochemical Detection: Analytical and Biological Challenges)

Abstract

:
The development of sensitive and affordable testing devices for infectious diseases is essential to preserve public health, especially in pandemic scenarios. In this work, we have developed an attractive analytical method to monitor products of genetic amplification, particularly the loop-mediated isothermal amplification reaction (RT-LAMP). The method is based on electrochemical impedance measurements and the distribution of relaxation times model, to provide the so-called time-constant-domain spectroscopy (TCDS). The proposed method is tested for the SARS-CoV-2 genome, since it has been of worldwide interest due to the COVID-19 pandemic. Particularly, once the method is calibrated, its performance is demonstrated using real wastewater samples. Moreover, we propose a simple classification algorithm based on TCDS data to discriminate among positive and negative samples. Results show how a TCDS-based method provides an alternative mechanism for label-free and automated assays, exhibiting robustness and specificity for genetic detection.

1. Introduction

Pathogens are one the main causes of human diseases. Recently, the world population experienced a pandemic of the SARS-CoV-2 virus causing COVID-19, which brought serious human, social and economic consequences [1]. From it, we have learned that fast, affordable and decentralized diagnostic tests are mandatory to detect new outbreaks to mitigate the spread rate and for early diagnosis. Classical diagnostic methods are based on molecular techniques, the polymerase chain reaction (PCR) being the gold standard [2]. On the other hand, rapid assays based on the detection of antigens and antibodies are an alternative to PCR, but have some inherent drawbacks such as less sensitivity and specificity [3]. Although molecular techniques have been used in clinical settings with appreciable sensitivity, these tools require specialized infrastructure and qualified personnel, whose availability is limited during a pandemic. In this sense, it is necessary to have technological alternatives to overcome the disadvantages of conventional analytical methods. For example, it has been shown that new sensitive materials and transduction methods [4] make it possible to develop rapid and affordable diagnostic tests at large scales, especially in regions with limited resources. On the other hand, novel paradigms for epidemiological surveillance, such as the so-called wastewater-based epidemiology (WWBE) [5], work around molecular analysis. Wherein, the sophisticated infrastructure causes a bottleneck when trying to perform tests, thus limiting its versatility [6].
Isothermal amplification techniques have emerged as an alternative to PCR because the reaction is performed at a constant temperature in a relatively short-time [7]. Particularly, the loop-mediated isothermal amplification (LAMP) has demonstrated promising results in diagnosis tests for infectious diseases [8]. In the case of SARS-CoV-2, it has been shown that its genetic material can be detected by a reverse transcriptase-LAMP (RT-LAMP) reaction with enough sensitivity and specificity. Furthermore, since the COVID-19 pandemic, the use of isothermal reactions coupled with automated and portable sensing, pave the road to develop innovative analytical devices. For instance, for emergent pathogens one can find recent developments based on optical detection [9], electrochemical transduction [10], nanomaterial-based sensors [11], colorimetric assays [12] and field-effect devices [13], to mention only a few. Jointly, there is a current need to provide solutions not only for viral particles, but also for easy-to-use and rapid molecular tests.
Electrochemical sensors and biosensors are useful devices to capture biological and biochemical events, and directly translate the results into electrical signals encoding useful information [14]. Its potentiality has been demonstrated in detecting several pathogens such as Escherichia coli [15], H1N1 [16] and Mycobacterium tuberculosis [17], to mention only a few. Recently, the performance of electrochemical sensors has been enhanced by using novel nanomaterials [18] and advanced surfaces [19]. These trends has demonstrated its versatility as signal amplification strategies for pathogens detection [20]. In particular, electrical impedance spectroscopy (EIS), is a powerful, non-destructive and label-free tool for assessing several physicochemical processes involved in sensing devices [21]. Hence, EIS-based sensors are a current trend due to their features performance [22]. Nonetheless, impedance measurements should be interpreted by sophisticated models, which complicate their usage as analytical devices [23]. Classically, such a procedure is performed by fitting the experimental data to an equivalent circuit model (ECM), whose parameters are related with the underlying phenomena [24]. Though the ECM is the rule-of-thumb method for analyzing EIS data, its structure should be selected with prior knowledge of the experiment, thus limiting its performance in real-time or automated measurements [25]. Thereby, the selection of an adequate model to interpret EIS data shunts the versatility of the method to provide quantitative results.
On the other hand, the distribution of the relaxation times (DRT) model offers an attractive alternative to analyze EIS data [26]. In general, DRT allows a detailed representation of the underlying phenomena by deconvolving the impedance spectrum [27]. Thus, DRT retrieves a distribution function in a time-constant domain, that straightforwardly isolates and resolves the electrochemical processes. Solving DRT is an ill-posed mathematical problem, for which several algebraic and numerical solutions have been proposed [28,29,30,31,32]. However, the applications of DRT remain limited, and are mainly focused on energy storage devices, materials science and for studying interfaces. Interestingly, DRT has started to gain attention for characterizing biological media such as tissues [33] and cells [34]. More recently, DRT was proposed as the basis of the so-called time-constant domain spectroscopy (TCDS). Thereby, the TCDS is an automated method to interpret impedance measurements with applications in sensors and biosensors [35]. Nonetheless, its versatility requires more research attention for real-world applications, such as the detection of pathogens using molecular methods in sensing platforms. Hence, we hypothesize that the TCDS could be an alternative method to characterize and analyze genetic amplification reactions, which has not been previously reported in the state-of-the-art.
In this work, we introduce an automated analysis of RT-LAMP reactions using impedance measurements and TCDS. We present, for the first time, the analysis of EIS data using the DRT model for monitoring genetic amplification processes. Particularly, we show how the TCDS has a twofold advantage compared with classical sensing platforms. Firstly, the TCDS serves as an impedance-based analytical method to quantify RT-LAMP products. This feature outperforms ECM analyses as the TCDS can be processed online. On the other hand, the TCDS signals encode relevant features of the electrochemical process, such that it can be used for classification purposes. That is, by means of TCDS, one can sense and simultaneously discriminate among positive and negative samples in an automated way. To illustrate the performance of the proposed analysis, we consider the SARS-CoV-2 genome as a study case due its relevance in recent years.
Hence, the TCDS-based analysis aims to be a simple, but robust, spectroscopic method for sensing and detection purposes. The proposal preserves the features of EIS-based sensors, but provides smartness to the device, which is not straightforward to perform in other detection methods due to instrumental or data constraints.

2. Theoretical Background

2.1. Electrochemical Impedance

The electrochemical impedance is given by the ratio of voltage and current phasors, given by the discrete Fourier transform F of the applied voltage V ( ω i ) F { v ( t ) } and the measured current I ( ω i ) F { i ( t ) } . Hence, at an arbitrary frequency ω i , for i = 1 , 2 , , N , the i-th impedance measurement is given by
Z ^ ( j ω i ) V ( ω i ) I ( ω i ) = Z ^ re ( ω i ) + j Z ^ im ( ω i ) ,
where j = 1 , Z re ( ω ) is the real and Z im ( ω ) the imaginary component. In practice, the measured impedance is fitted to an ECM [36], which generally considers the interconnection of resistors, capacitors and/or constant-phase-elements (CPE). For fitting purposes, the CPE has good performance as it deals with non-idealities; however, its physical interpretation is not straightforward, even more for sensing purposes in biochemical processes [37].

2.2. Distribution of Relaxation Times Model

The DRT model has an associated impedance given by the following Fredholm integral:
Z DRT ( j ω ) = R + 0 γ ( ln τ ) 1 + j ω τ d ( ln τ ) ,
where R is the high-frequency-related resistance, γ ( ln τ ) is a distribution function and τ is the time-constant domain scale. However, solving for γ ( · ) in (2) is an inverse problem with a non-trivial solution. Therein, the aim is to find the optimal function, γ ( ln τ ) , such that the impedance measurements well approximate the model, i.e., Z ^ ( j ω i ) Z DRT ( j ω ) . In this work, we establish that an estimate of the distribution function γ ( ln τ ) in a time-constant-domain scale will be the retrieved spectrum encoding the relevant electrochemical processes to monitor a RT-LAMP reaction.

3. Materials and Methods

Figure 1 shows the workflow of the proposed methodology. Firstly, the genome target is extracted and the sample concentrated, using a custom and sensitive method [38]. Subsequently, the RT-LAMP mixture is mainly made up by specific designed primers and methylene blue (MB) acting as a redox intercalating probe. Hence, a volume of approximately 50 μ L of the reaction mixture is drop-cast over the surface of the screen-printed-electrodes (SPEs) acting as the sensitive element. Therein, the RT-LAMP reaction takes place by regulating the local temperature at ∼63 C. The transduction signal relies upon the application of an electrical potential, while measuring the resulting density current, which is enhanced by the presence of MB. Thus, as the RT-LAMP progresses, the electrochemical impedance is measured to obtain the real Z ^ re and imaginary Z ^ im components. These data encode the amount/number of RT-LAMP products, namely amplicons, which can be straightforward quantified through the TCDS. Finally, the retrieved TCDS data are useful for extracting relevant features of the reaction, which are used to automatically classify samples as negative or positive. Jointly, the procedure takes around 2 h to succeed starting from the raw sample.

3.1. Chemicals and Materials

A QuantiTect Reverse Transcription kit and RNeasy Power Microbiome extraction kit were obtained from Qiagen (Hilden, Germany). A 0.45 μ m pore diameter nitrocellulose membrane was purchased from Millipore (Burlington, MA, USA). Bst 2.0 enzyme, Bst buffer, and MgSO 4 were purchased from NEB (Northborough, MA, USA). dNTPs mix 10 mM, nuclease-free water and SYBR Safe DNA gel stain were obtained from Thermo Fisher Scientific (Waltham, MA, USA). HCl, tris acetate buffer (TAE) and methylene blue (MB) were purchased from Sigma-Aldrich (St Louis, MO, USA). All chemicals were of analytical grade. Aqueous solutions were prepared with Milli-Q water. The electrodes were fabricated using the screen printing method. Carbon conductive ink paste was obtained from Nanochemazone (Edmonton, AB, Canada) to fabricate the working electrode (WE) and the counter electrode (CE). Ag/AgCl ink was obtained from Creative Materials (Ayer, MA, USA) to elaborate the reference electrode (RE). The electrodes were deposited over a ceramic substrate to reach an active area of 12.56 mm 2 . Prior to its use, the SPEs were prepared and cleaned by cyclic voltammetry (CV) in the range of 1.0 to −0.6 V, at 100 mV/s, using TAE, and rinsed with deionized water. Electrochemical impedance measurements and temperature control were carried out using a custom measurement system [35].

3.2. Sample Collection and Preparation

To test the proposed method, we used real wastewater samples taken from the effluent. The raw samples should be prepared to extract and concentrate the genetic material as it is highly diluted. Firstly, the concentration was carried out by adsorption onto a negatively charged membrane [38]. The pH of the samples was set to 3.5 using 2 N HCl. Then, the samples were filtered through a negatively charged nitrocellulose membrane of 0.45 μ m pore diameter. Afterwards, the membrane was stored at 20 C, cut and used directly in the RNeasy Power Microbiome kit for RNA extraction.

3.3. RT-LAMP Assay

After the extraction of SARS-CoV-2, 5 μ L of RNA was reverse transcribed with the QuantiTect Reverse Transcription kit according to the manufacturer’s instructions. For the proposed detection, a volume of 50 μ L of the RT-LAMP reaction mixture is made up of: 5 μ L of Bst buffer, 3 μ L of MgSO 4 , 5 μ L of 2 mM dNTPs, 2 μ L of 10× primer’s core mix, 2 μ L of 10× primer’s loop mix, 10 U of Bst 2.0 DNA polymerase, 4 μ L cDNA and nuclease free water. The specificity of the detection is based on the RT-LAMP primers. These have been designed for the N and ORF1ab fragments of the SARS-CoV-2 according to the methodology described in [39]. The RT-LAMP primers were also validated using the PrimerExplorer V5 tool (https://primerexplorer.jp/e/, accessed on 21 November 2022). Experimentally, a custom control system was developed to regulate the temperature, at 63 ± 0.5   C using an adaptive scheme. This value was selected using a temperature ramp test in the range from 60 C to 65 C, where the Bst polymerase is able to be amplified. Hence, we found that the RT-LAMP reaction was more efficient at 63 C. All the reactions were run on 1% agarose gel stained with SYBR Safe DNA Gel Stain for the presence of a visual ladder pattern. Finally, the RT-LAMP products were also verified by sequencing to test its specificity (Genbank OM522662).

3.4. Electrochemical Impedance Measurements

A low-cost electrochemical cell based on screen-printed-electrodes (SPE) is used as the sensing element. This configuration allows the sensor to be treated as a low-cost test strip. Due to the features and performance of the cell, it allows reproducible results using a sample volume of 50 μ L in the form of a drop over the surface of the electrodes. Therein, the RT-LAMP reaction takes place to retrieve the electrochemical impedance signal. EIS measurements were performed using a custom-made potentiostat [35]. The input voltage signal was a multisine with the form v i ( t ) = v dc + k = 1 F A k cos ( ω k t + δ k ) , with a constant potential v dc = 0.28 V, amplitude A k = ± 5 mV , phase δ k and ω k = 2 π f k frequencies, with F = 46 points, in the range form of 10 Hz to 150 kHz.

3.5. Time-Constant-Domain Spectroscopy

Once the EIS data are available, they should be transformed into the TCDS. For this purpose, we adopt the regularized least-squares (RLS) method [40] to solve the integral equation of the DRT model in (2). Specifically, the DRT solution is given by minimizing the following cost function
V ( θ ) = ( ( R 1 ) + A re θ ) Z ^ re 2 2 + A i m θ Z ^ i m 2 2 + R ,
with 1 R L × 1 a vector of ones, Z ^ re R L × 1 and Z ^ im R L × 1 the measurement vector of the impedance real and imaginary parts, respectively. Additionally, (2) can be written in matrix notation thus leading to A Re R L × M and A Im R L × M , the real and imaginary components of the DRT model. The cost function in (3) includes a regularization term R λ θ 2 2 , with λ > 0 , denoting the 2 -norm of the vector θ , related with the amplitude of the function γ ( ln τ ) . Regularization allows to prevent overfitting and provides smoothness to the solution of the problem θ = arg min θ : θ 0 V ( θ ) , for which θ is the optimal parameter vector. Thereby, once θ is retrieved, the TCDS is straightforward given by γ ^ ( ln τ ; θ ) . Thus, the electrochemical phenomena encoded by γ ^ ( · ) can be easily identified via the local maxima centered at the characteristic time-constant τ k . Finally, one can derive the following hypothesis: the RT-LAMP reactions can be analyzed in an automated and robust way by the TCDS, instead of fitting impedance data to an ECM whose interpretation is not straightforward.

3.6. Classification Algorithm

In line with the device capacities, we propose a machine learning (ML) algorithm to classify and discriminate among positive and negative samples. Particularly, a linear model based on logistic regression is well-suited for the problem [41]. Briefly, the algorithm works with a training data set D = { ( x 1 , y 1 ) , , ( x m , y m ) } , and the empirical risk minimization problem is given by
w = arg min w R d 1 m i = 1 m log 1 + exp ( y i w , b i ) ,
which is equal to the well-known maximum likelihood estimator in statistics. The logistic model is optimized using the gradient descent algorithm for solving (4). In this work, we consider a binary classification problem for two categories of TCDS. This latter is assumed to encode negative and positive results for the presence of the SARS-CoV-2 genome.

4. Results

4.1. Performance to Detect the SARS-CoV-2 Genome

As the first experiment, we characterized the specificity and the performance of the TCDS as an analytical method to detect RT-LAMP reactions. For this purpose, a negative template control (NTC) and a positive sample to SARS-CoV-2, previously labeled by a classical PCR reaction, were used. For this latter, we performed 10× dilution series in the range from 5000 to 0.05 pg/ μ L. A sample volume of ∼50 μ L was placed over the SPE, where the temperature control was held at 63 ± 0.5   C for 35 min to complete the RT-LAMP reaction. All the reactions were measured in triplicate by EIS, and further processed to retrieve the TCDS. Thus, this latter aims to provide a specific method to analyze a genetic amplification reaction specificity, which extends the previous usages of DRT [33] and TCDS [35].

4.1.1. Impedance Measurements of RT-LAMP Reactions

Figure 2a shows the Nyquist plots of the mean impedance of the triplicate for the NTC and the concentrations c 1 = 5000, c 2 = 500, c 3 = 50, c 4 = 5, c 5 = 0.5, and c 6 = 0.05 pg/ μ L. Additionally, the Figure 2b depicts the ECM commonly used to describe the impedance measurements. From the experimental data (circles) and the fitted model (solid line) shown in Figure 2a, it was possible to perform the following analysis using the ECM parameters of Figure 2b. The element CPE 1 models the double layer capacitance arising from the electrode–electrolyte interface. The element CPE 2 is related to the diffusion process of the species. The resistor R ct is associated with the charge transfer resistance of the redox reaction. The element R s is modeling the high-frequency conductivity. Furthermore, using the impedance plots in Figure 2a, it is possible to identify two relevant electrochemical processes. (i) At low frequencies (<100 Hz), the straight line is due to the diffusion process. (ii) In frequencies above 100 Hz, the presence of an apparent semi-circle suggests changes in the charge transfer resistance, R ct . This latter process is highly correlated with the amount of products generated by the RT-LAMP reaction for each concentration. As a first approach, one can notice that the larger the concentration, the higher the value of R ct is, as can be seen in the semicircles shown in the impedance plots of Figure 2a. Nonetheless, a quantitative analysis of the RT-LAMP reactions is not trivial from the raw EIS data and the ECM model. Therefore, by means of TCDS in a sensing framework [35], it would be feasible to monitor the electrochemical processes involved in the RT-LAMP reactions with enough sensitivity and accuracy.

4.1.2. Time-Constant-Domain Spectroscopy of RT-LAMP Reactions

Herein, we report the TCDS as an analytical technique to circumvent the drawbacks of the classical EIS analysis. Figure 2c shows the resultant mean TCDS in the triplicate for the NTC and the six concentrations. As a result, the TCDS confirms the presence of two dominant processes described by the maxima of the distribution function. Thereby, the maximum value of γ ^ , located at τ 10 1 s, is related to the diffusion process denoted by D. On the other hand, in the range from 10 4 < τ < 10 2 there exists a second maximum of small amplitude, but the location of which could be related with the charge transfer process, C T . For the diffusion phenomenon, the maximum of γ ^ does not exhibit a significant change in its location at τ . This indicates that the time-constant related to the diffusion could not be highly sensitive to detect the RT-LAMP reactions. On the contrary, the charge transfer mechanism shown in the inset of Figure 2c suggests that its amplitude and location in τ is different for each concentration. Hence, it is convenient to perform a detailed analysis of the TCDS in the range from 10 4 < τ < 10 2 . For this purpose, the maxima related to the diffusion D are filtered out from the spectra by attenuating its amplitude.
Figure 3 shows the results for monitoring RT-LAMP reactions using the TCDS. Firstly, Figure 3a depicts the new representation of the TCDS signals, where the diffusion process has been removed, and keeping only information of the charge transfer effect. For the sake of visual representation, an arbitrary offset was added to amplitude in the spectra of Figure 3a. This modification supposes no effect in the further analysis owing that it will be focused in the time-constant scale. Hence, in Figure 3a it is worth noticing a shift, from left to right, of the maximum in the distribution function γ ^ ( · ) . This shift, in turn, is related with the concentration of each sample with respect to the NTC. More specifically, the MB in the RT-LAMP mixture acts as a redox intercalating probe. Hence, whenever the amplification reaction progresses, the MB binds to the dsDNA, becoming less electroactive at the electrode surface. Likewise, the RT-LAMP does not generate amplicons for the NTC sample, so the amount of electroactive species remain free in the electrodes. This situation is related to the charge transfer resistance, promoted by the MB, which increases with the amount of RT-LAMP products. Hence, the larger the number of amplicons, the higher the equivalent electrical resistance. Likewise, this latter value influences the time-constant associated with the C T process (see Figure 3a). To quantify the amount of RT-LAMP products generated in a positive sample, we used the spectra of Figure 3a, and the time-constant shift parameter is defined as
Δ τ = τ i τ NTC ,
where, τ i is the characteristic time-constant of each concentration, and τ NTC is the constant associated with the negative control. Thus, it is possible to establish a relationship among the shift Δ τ and the nucleic acid concentration detected by the sensor.
Figure 3b depicts the calibration curve of the sensor using TCDS as the transduction signal. Therein, the plot shows the experimental data (dots), the measurement uncertainty in a triplicate (bars), and the best fitted model (solid line). From the curve of Figure 3b, it is possible to confirm that the sensor exhibits a highly linear response, which increases proportionally to the logarithmic concentration. Quantitatively, the sensor exhibits a sensitivity of 0.93 ms log ( pg / μ L ) , a limit-of-detection (LoD) of 0.045 pg / μ L , and a linearity of approximately 98 % . Interestingly, with our proposal, the impedance data are represented by a smooth spectrum, for which a shift in the characteristic time-constant is straightforward related with the products of the RT-LAMP reaction. Moreover, the TCDS as an analytical technique exhibits a high linear response, which interpretation is more easy than the classical ECM commonly used for EIS data.
For comparison purposes, we contrasted the TCDS-based analysis with ECM shown in Figure 2b, considering the charge transfer resistance R ct as the sensing parameter. The LoD was obtained to investigate the performance of the TCDS and the ECM, achieving 0.045 pg / μ L and 0.175 pg / μ L , respectively. Hence, the TCDS exhibits superior performance as the LoD is one order of magnitude below than for the ECM. On the other hand, we evaluated the computation time for both methods when fitting the raw impedance data to the models. As a result, the TCDS-based approach retrieved results afer ∼1.2 ms, whereas the ECM required ∼25 ms. This situation is due to TCDS is an algebraic method with a closed-form solution, whilst fitting to an ECM uses a non-linear-least-squares (NLLS) alongside an iterative solver. Thus, the advantages of detecting genetic amplification via TCDS could be attractive to develop label-free and portable sensing platforms to retrieve fast and accurate results [42]. Additionally, the versatility of TCDS is confirmed because it could be applied to sense both dielectric [35] and electrochemical processes, as reported in this work.

4.2. Detecting SARS-CoV-2 Genome in Wastewater Samples

To test the specificity of the TCDS to detect the amplification reaction, three positive samples to SARS-CoV-2, s 1 , s 2 and s 3 and a NTC were used. Firstly, the TCDS was retrieved for each sample in an end-point configuration. That is, the TCDS was obtained after 30 min of the RT-LAMP reaction. Figure 4 shows the results of the mean TCDS in a triplicate for the three positive samples and the negative control.
In Figure 4a, we show the TCDS signals for the specific detection of gene N from SARS-CoV-2 genome. Therein, one can see how the positive samples clearly exhibit a shift in τ with respect to the NTC samples. In the three positive cases, the maxima of the function γ ^ are located around τ N 10 2 s. Likewise, Figure 4b shows the TCDS signals when detecting the ORF1ab fragment of the SARS-CoV-2. In line with the previous findings, it is confirmed that the TCDS for positive samples reveal a shift towards higher values of τ . Hence, for this case, the maxima of the distribution function are near to τ ORF 1 ab 10 2 s. Therefore, we could confirm that, by an appropriate design of the genetic amplification reaction, the TCDS is highly sensitive to specifically detect genome fragments. This was not the case in previous reports of TCDS in biological applications [33,35], since it worked on bulky systems neglecting the specificity in the detection.
Concurrently to this experiment, the RT-LAMP reactions were verified using gel electrophoresis as shown in Figure 4c,d, for the genes N and ORF1ab, respectively. Therein, one can see the agarose gels for molecular weight markers (MW), negative control samples (NTC) and the three tested samples ( s 1 , s 2 and s 3 ). Additionally, from Figure 4c,d, it is worth observing that only the positive reactions resulted in a quasi-ladder pattern, while the NTCs did not show detectable RT-LAMP products. Thus, the electrophoresis test allowed us to corroborate that the results retrieved by TCDS were successful to specifically detect two genome regions of the SARS-CoV-2 as a study case.

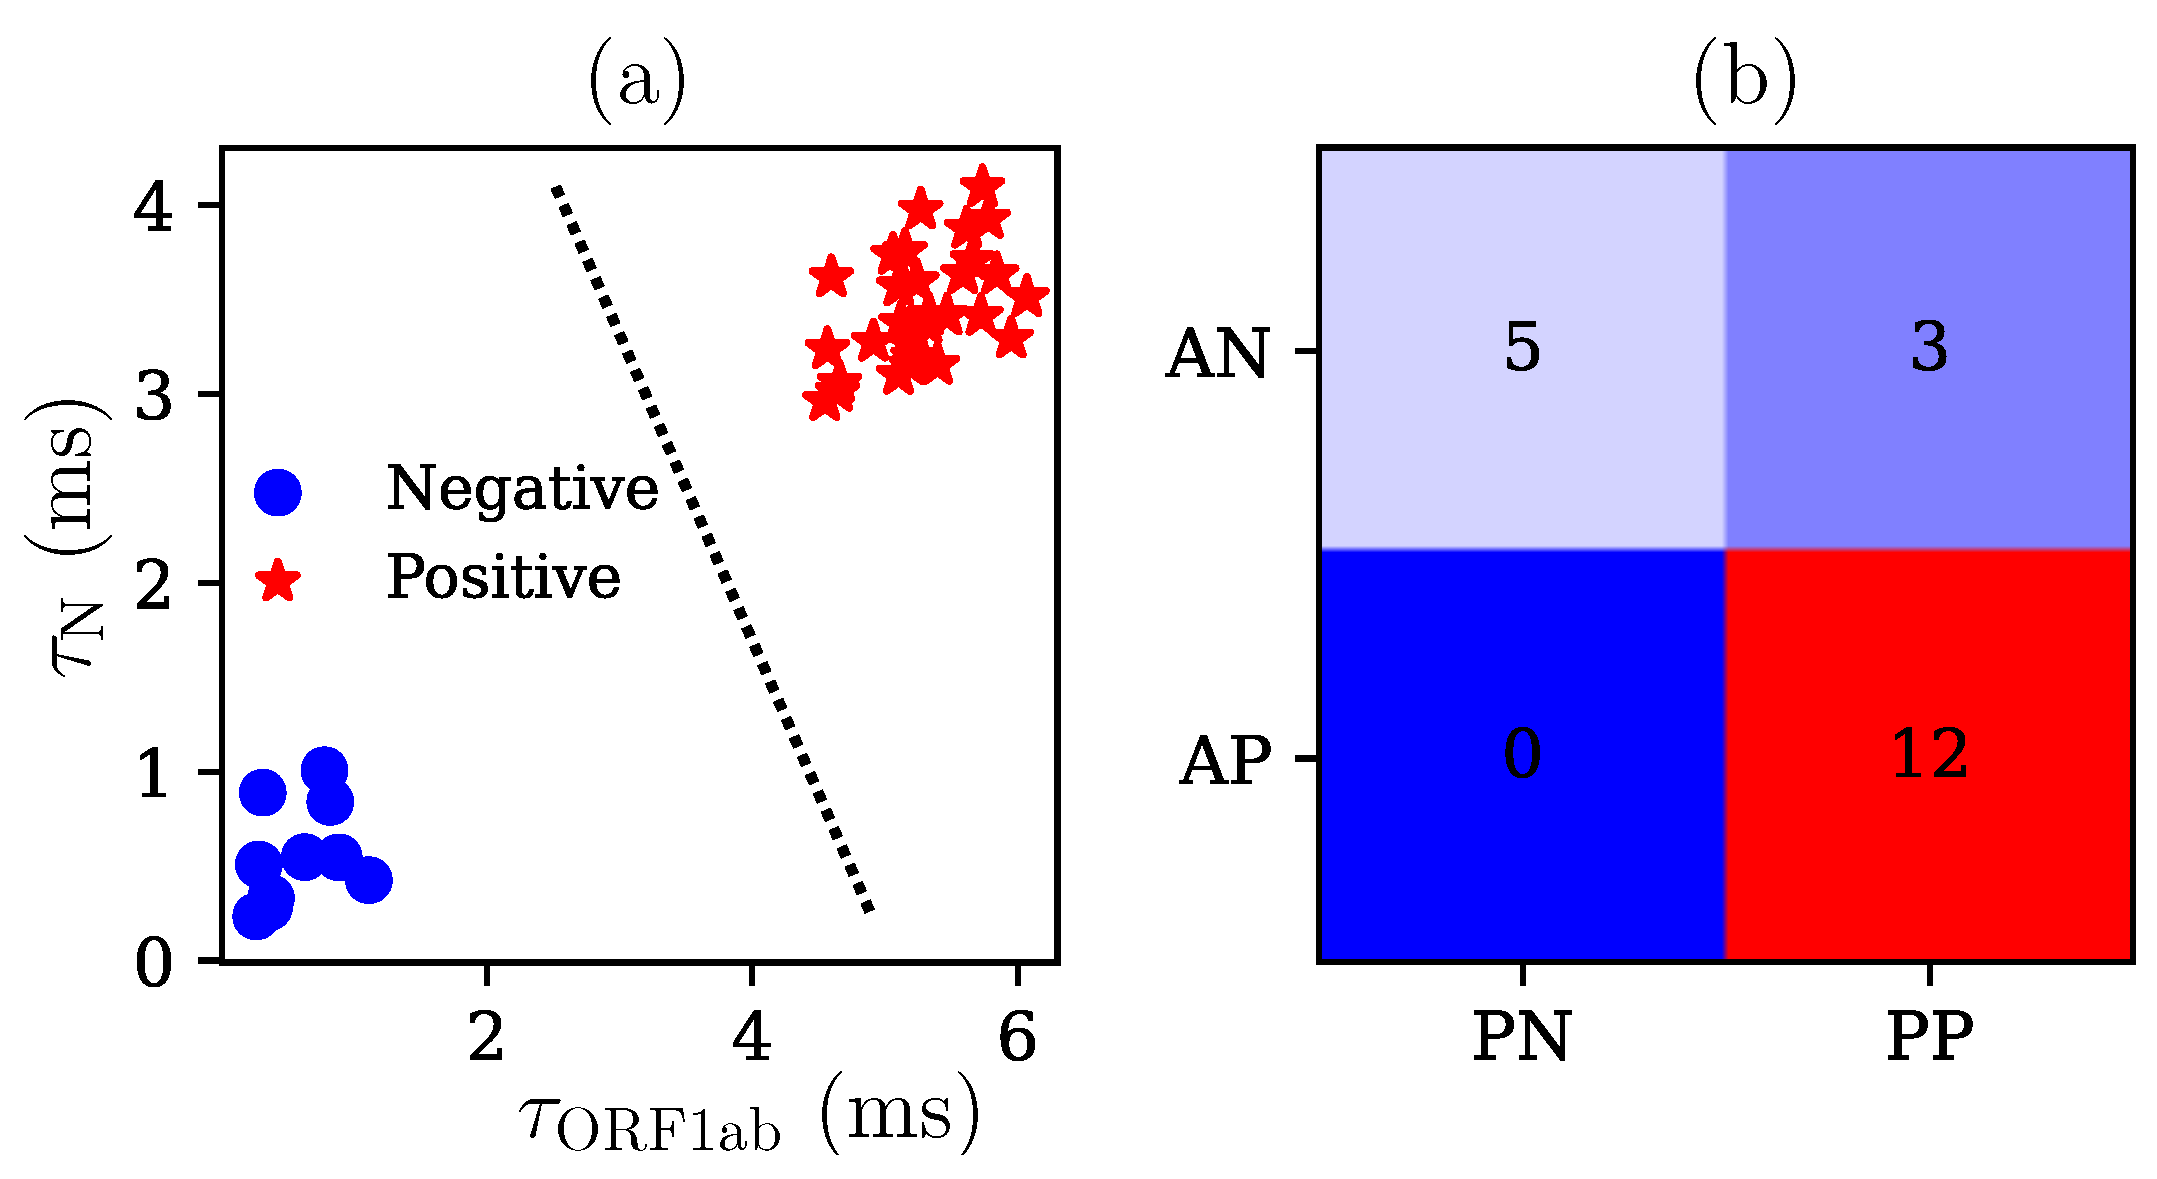
4.3. Automatic Classification of Samples

Once the performance of the method was verified, the next step consisted of a deep analysis of wastewater samples. For classification purposes, it was necessary to perform a feature extraction step on the TCDS data. Hence, the hypothesis was that the time-constants τ N and τ ORF 1 ab are those representative parameters of the samples analyzed by the TCDS for the SARS-CoV-2 genome. For this study, a total of N train = 40 samples for the training data set and N test = 20 for the test set were considered.
Subsequently, the vector of features Θ = { τ N , τ ORF 1 ab } R 2 × N train was the input of the linear classifier, for which 0.1 and 300,000 were the values of the learning rate and the number of iterations, respectively, to solve the problem in (4). Figure 5 shows the results of the classifier for the TCDS obtained from wastewater samples. Firstly, Figure 5a depicts the results of the classifier training process. Therein, one can observe that the decision boundary (dashed line) is able to distinguish among two classes of samples, negative (dots) and positives (stars).
On the other hand, Figure 5b depicts the performance of the classifier in terms of a confusion matrix when using the test data set. Therein, the results are shown for actual negative (AN) and actual positive (AP), determined using a classical PCR assay; whereas, the predicted negative (PN) and predicted positive (PP) are those classes retrieved by the algorithm. Quantitatively, it can be deduced that the classifier operates with a PN value of 100% for all the negative samples. Nevertheless, one can observe that the method retrieved three false positives in the analyzed samples, which results in an accuracy of 85%. In general, the performance of the classifier could be considered good enough due to the experimental variability of the samples. Furthermore, one should note that a simple linear classifier was able to deal with sensor data in a simple but effective way. Hence, the classification results are promissory on the basis of novel automated methods to analyze biochemical assays [43] such as genetic amplification, which can be easily extended to analyze the presence of several pathogens.

5. Conclusions

This work introduced an attractive method to automatically analyze isothermal amplification reactions using electrochemical impedance spectroscopy (EIS) and data science-like methods. The proposal demonstrated the potentiality of the so-called time-constant-domain spectroscopy (TCDS) as an analytical method in the framework of impedance-based sensors. Moreover, we showed the TCDS is a powerful tool for monitoring the reverse transcriptase-loop mediated isothermal amplification (RT-LAMP) of the SARS-CoV-2 genome. Interestingly, the TCDS results showed a twofold advantage when compared with classical sensing platforms. Firstly, the TCDS could serve as a sensor to quantify the amplification reaction with a limit-of-detection of 0.045 pg / μ L and a high linear response ( 98 % ). On the other hand, the TCDS data encoded relevant features of the electrochemical processes within the RT-LAMP reaction. These features could be considered as the input of a classification algorithm, which was able to discriminate among positive and negative samples with an accuracy of 85 % . Although the findings presented in this work are promissory, they require an extensive validation with more samples to reach a fully integrated device. Additionally, the proposed method could be extended for detecting other pathogens and/or for multiplex assays. Future work will consider real-time measurements within an integrated portable system for quantitative analyses. Ultimately, we demonstrated the versatility of EIS coupled with TCDS to develop novel analytical methods and attractive solutions to monitor amplification reactions, mainly focused on affordable devices in low-resource settings.

Author Contributions

Conceptualization: R.G.R.-C.; investigation: E.C.-V., B.E.A.-S., J.C.-R., L.T.; methodology: R.G.R.-C., E.C.-V., B.E.A.-S., J.C.-R., L.T.; resources: R.M.R.-Z., G.B., L.A.-I.; validation: J.C.-R., L.T., R.M.R.-Z., G.B., L.A.-I.; software: R.G.R.-C.; writing—original draft: R.G.R.-C., E.C.-V.; writing—review and editing: B.E.A.-S., J.C.-R., L.T., G.B., L.A.-I.; funding acquisition: R.G.R.-C. All authors have read and agreed to the published version of the manuscript.

Funding

This work was funded by the grants DGAPA-UNAM-PAPIIT TA100221, TA101423 and CONACyT CF-2023-1879. The financial support from the project “Cambio de paradigma: residuos como materia prima para conciliar el eje agua-energía- ambiente-seguridad alimentaria” of the Grupos Interdisciplinarios de Investigación (GII) of the Institute of Engineering, UNAM is acknowledged. B.E.A.-S. thanks CONACyT for his PhD studies grant (CVU 1004078).

Institutional Review Board Statement

Not applicable.

Informed Consent Statement

Not applicable.

Data Availability Statement

Data are contained within the article.

Conflicts of Interest

The authors declare no conflict of interest.

References

  1. Abdool Karim, S.S.; de Oliveira, T. New SARS-CoV-2 Variants—Clinical, Public Health, and Vaccine Implications. N. Engl. J. Med. 2021, 384, 1866–1868. [Google Scholar] [CrossRef] [PubMed]
  2. Alcoba-Florez, J.; Gil-Campesino, H.; de Artola, D.G.M.; González-Montelongo, R.; Valenzuela-Fernández, A.; Ciuffreda, L.; Flores, C. Sensitivity of different RT-qPCR solutions for SARS-CoV-2 detection. Int. J. Infect. Dis. 2020, 99, 190–192. [Google Scholar] [CrossRef] [PubMed]
  3. Sil, B.K.; Jahan, N.; Haq, M.A.; Oishee, M.J.; Ali, T.; Khandker, S.S.; Kobatake, E.; Mie, M.; Khondoker, M.U.; Jamiruddin, M.R.; et al. Development and performance evaluation of a rapid in-house ELISA for retrospective serosurveillance of SARS-CoV-2. PLoS ONE 2021, 16, 1–16. [Google Scholar] [CrossRef]
  4. Hao, Z.; Chen, H.; Shi, X.; Tan, W.; Zhu, G. Fabrication for paper-based microfluidic analytical devices and saliva analysis application. Microfluid. Nanofluidics 2021, 25, 80. [Google Scholar] [CrossRef]
  5. Kumblathan, T.; Liu, Y.; Uppal, G.K.; Hrudey, S.E.; Li, X.F. Wastewater-Based Epidemiology for Community Monitoring of SARS-CoV-2: Progress and Challenges. ACS Environ. Au 2021, 1, 18–31. [Google Scholar] [CrossRef]
  6. Shrestha, S.; Yoshinaga, E.; Chapagain, S.K.; Mohan, G.; Gasparatos, A.; Fukushi, K. Wastewater-Based Epidemiology for Cost-Effective Mass Surveillance of COVID-19 in Low- and Middle-Income Countries: Challenges and Opportunities. Water 2021, 13, 2897. [Google Scholar] [CrossRef]
  7. Zhao, Y.; Chen, F.; Li, Q.; Wang, L.; Fan, C. Isothermal Amplification of Nucleic Acids. Chem. Rev. 2015, 115, 12491–12545. [Google Scholar] [CrossRef]
  8. Ongerth, J.E.; Danielson, R.E. RT qLAMP—Direct Detection of SARS-CoV-2 in Raw Sewage. J. Biomol. Tech. 2021, 32, 206–213. [Google Scholar] [CrossRef]
  9. Rezaei, M.; Razavi Bazaz, S.; Morshedi Rad, D.; Shimoni, O.; Jin, D.; Rawlinson, W.; Ebrahimi Warkiani, M. A Portable RT-LAMP/CRISPR Machine for Rapid COVID-19 Screening. Biosensors 2021, 11, 369. [Google Scholar] [CrossRef]
  10. Chaibun, T.; Puenpa, J.; Ngamdee, T.; Boonapatcharoen, N.; Athamanolap, P.; O’Mullane, A.P.; Vongpunsawad, S.; Poovorawan, Y.; Lee, S.Y.; Lertanantawong, B. Rapid electrochemical detection of coronavirus SARS-CoV-2. Nat. Commun. 2021, 12, 802. [Google Scholar] [CrossRef]
  11. Naikoo, G.A.; Awan, T.; Hassan, I.U.; Salim, H.; Arshad, F.; Ahmed, W.; Asiri, A.M.; Qurashi, A. Nanomaterials-Based Sensors for Respiratory Viral Detection: A Review. IEEE Sens. J. 2021, 21, 17643–17656. [Google Scholar] [CrossRef]
  12. González-González, E.; Lara-Mayorga, I.M.; Rodríguez-Sánchez, I.P.; Zhang, Y.S.; Martínez-Chapa, S.O.; Santiago, G.T.d.; Alvarez, M.M. Colorimetric loop-mediated isothermal amplification (LAMP) for cost-effective and quantitative detection of SARS-CoV-2: The change in color in LAMP-based assays quantitatively correlates with viral copy number. Anal. Methods 2021, 13, 169–178. [Google Scholar] [CrossRef] [PubMed]
  13. Alvarez-Serna, B.E.; Ramírez-Chavarría, R.G.; Castillo-Villanueva, E.; Carrillo-Reyes, J.; Ramírez-Zamora, R.M.; Buitrón, G.; Alvarez-Icaza, L. Label-free and portable field-effect sensor for monitoring RT-LAMP products to detect SARS-CoV-2 in wastewater. Talanta 2023, 253, 124060. [Google Scholar] [CrossRef]
  14. Singh, A.; Sharma, A.; Ahmed, A.; Sundramoorthy, A.K.; Furukawa, H.; Arya, S.; Khosla, A. Recent Advances in Electrochemical Biosensors: Applications, Challenges, and Future Scope. Biosensors 2021, 11, 336. [Google Scholar] [CrossRef]
  15. Ramanujam, A.; Neyhouse, B.; Keogh, R.A.; Muthuvel, M.; Carroll, R.K.; Botte, G.G. Rapid electrochemical detection of Escherichia coli using nickel oxidation reaction on a rotating disk electrode. Chem. Eng. J. 2021, 411, 128453. [Google Scholar] [CrossRef]
  16. Bhardwaj, J.; Chaudhary, N.; Kim, H.; Jang, J. Subtyping of influenza A H1N1 virus using a label-free electrochemical biosensor based on the DNA aptamer targeting the stem region of HA protein. Anal. Chim. Acta 2019, 1064, 94–103. [Google Scholar] [CrossRef] [PubMed]
  17. Teengam, P.; Siangproh, W.; Tuantranont, A.; Vilaivan, T.; Chailapakul, O.; Henry, C.S. Electrochemical impedance-based DNA sensor using pyrrolidinyl peptide nucleic acids for tuberculosis detection. Anal. Chim. Acta 2018, 1044, 102–109. [Google Scholar] [CrossRef] [PubMed]
  18. Guo, J.W.; Yang, Z.W.; Liu, X.L.; Zhang, L.W.; Guo, W.B.; Zhang, J.; Ding, L.H. 2D Co metal-organic framework nanosheet as an oxidase-like nanozyme for sensitive biomolecule monitoring. Rare Met. 2023, 42, 797–805. [Google Scholar] [CrossRef]
  19. Ding, L.; Yan, F.; Zhang, Y.; Liu, L.; Yu, X.; Liu, H. Microflowers Comprised of Cu/CuxO/NC Nanosheets as Electrocatalysts and Horseradish Peroxidase Mimics. ACS Appl. Nano Mater. 2020, 3, 617–623. [Google Scholar] [CrossRef] [Green Version]
  20. Ding, L.; Zhang, L.; Yang, H.; Liu, H.; Ge, S.; Yu, J. Electrochemical biosensor for p53 gene based on HRP-mimicking DNAzyme-catalyzed deposition of polyaniline coupled with hybridization chain reaction. Sens. Actuators B Chem. 2018, 268, 210–216. [Google Scholar] [CrossRef]
  21. Strong, M.E.; Richards, J.R.; Torres, M.; Beck, C.M.; La Belle, J.T. Faradaic electrochemical impedance spectroscopy for enhanced analyte detection in diagnostics. Biosens. Bioelectron. 2021, 177, 112949. [Google Scholar] [CrossRef] [PubMed]
  22. Magar, H.S.; Hassan, R.Y.A.; Mulchandani, A. Electrochemical Impedance Spectroscopy (EIS): Principles, Construction, and Biosensing Applications. Sensors 2021, 21, 6578. [Google Scholar] [CrossRef] [PubMed]
  23. Stupin, D.D.; Kuzina, E.A.; Abelit, A.A.; Emelyanov, A.K.; Nikolaev, D.M.; Ryazantsev, M.N.; Koniakhin, S.V.; Dubina, M.V. Bioimpedance Spectroscopy: Basics and Applications. ACS Biomater. Sci. Eng. 2021, 7, 1962–1986. [Google Scholar] [CrossRef] [PubMed]
  24. Xu, Y.; Li, C.; Mei, W.; Guo, M.; Yang, Y. Equivalent circuit models for a biomembrane impedance sensor and analysis of electrochemical impedance spectra based on support vector regression. Med. Biol. Eng. Comput. 2019, 57, 1515–1524. [Google Scholar] [CrossRef] [PubMed] [Green Version]
  25. Van Haeverbeke, M.; Stock, M.; De Baets, B. Practical Equivalent Electrical Circuit Identification for Electrochemical Impedance Spectroscopy Analysis With Gene Expression Programming. IEEE Trans. Instrum. Meas. 2021, 70, 1–12. [Google Scholar] [CrossRef]
  26. Kežionis, A.; Kazakevičius, E. Some features of the analysis of broadband impedance data using distribution of relaxation times. Electrochim. Acta 2020, 349, 136379. [Google Scholar] [CrossRef]
  27. Li, X.; Ahmadi, M.; Collins, L.; Kalinin, S.V. Deconvolving distribution of relaxation times, resistances and inductance from electrochemical impedance spectroscopy via statistical model selection: Exploiting structural-sparsity regularization and data-driven parameter tuning. Electrochim. Acta 2019, 313, 570–583. [Google Scholar] [CrossRef]
  28. Saccoccio, M.; Wan, T.H.; Chen, C.; Ciucci, F. Optimal regularization in distribution of relaxation times applied to electrochemical impedance spectroscopy: Ridge and Lasso regression methods—A theoretical and experimental Study. Electrochim. Acta 2014, 147, 470–482. [Google Scholar] [CrossRef]
  29. Boukamp, B.A. Fourier transform distribution function of relaxation times; application and limitations. Electrochim. Acta 2015, 154, 35–46. [Google Scholar] [CrossRef]
  30. Ciucci, F.; Chen, C. Analysis of electrochemical impedance spectroscopy data using the distribution of relaxation times: A Bayesian and hierarchical Bayesian approach. Electrochim. Acta 2015, 167, 439–454. [Google Scholar] [CrossRef]
  31. Liu, J.; Ciucci, F. The Deep-Prior Distribution of Relaxation Times. J. Electrochem. Soc. 2020, 167, 026506. [Google Scholar] [CrossRef]
  32. Maradesa, A.; Py, B.; Quattrocchi, E.; Ciucci, F. The probabilistic deconvolution of the distribution of relaxation times with finite Gaussian processes. Electrochim. Acta 2022, 413, 140119. [Google Scholar] [CrossRef]
  33. Ramírez-Chavarría, R.; Sánchez-Pérez, C.; Matatagui, D.; Qureshi, N.; Pérez-García, A.; Hernández-Ruíz, J. Ex-vivo biological tissue differentiation by the distribution of relaxation times method applied to electrical impedance spectroscopy. Electrochim. Acta 2018, 276, 214–222. [Google Scholar] [CrossRef]
  34. Shi, F.; Kolb, J.F. Enhanced resolution impedimetric analysis of cell responses from the distribution of relaxation times. Biosens. Bioelectron. 2020, 157, 112149. [Google Scholar] [CrossRef]
  35. Ramírez-Chavarría, R.G.; Sánchez-Pérez, C.; Romero-Ornelas, L.; Ramón-Gallegos, E. Time-Constant-Domain Spectroscopy: An Impedance-Based Method for Sensing Biological Cells in Suspension. IEEE Sens. J. 2021, 21, 185–192. [Google Scholar] [CrossRef]
  36. Saxena, R.; Srivastava, S. An insight into impedimetric immunosensor and its electrical equivalent circuit. Sens. Actuators B Chem. 2019, 297, 126780. [Google Scholar] [CrossRef]
  37. Vivier, V.; Orazem, M.E. Impedance Analysis of Electrochemical Systems. Chem. Rev. 2022, 122, 11131–11168. [Google Scholar] [CrossRef]
  38. Carrillo-Reyes, J.; Barragán-Trinidad, M.; Buitrón, G. Surveillance of SARS-CoV-2 in sewage and wastewater treatment plants in Mexico. J. Water Process. Eng. 2021, 40, 101815. [Google Scholar] [CrossRef]
  39. Song, J.; El-Tholoth, M.; Li, Y.; Graham-Wooten, J.; Liang, Y.; Li, J.; Li, W.; Weiss, S.R.; Collman, R.G.; Bau, H.H. Single- and Two-Stage, Closed-Tube, Point-of-Care, Molecular Detection of SARS-CoV-2. Anal. Chem. 2021, 93, 13063–13071. [Google Scholar] [CrossRef] [PubMed]
  40. Ramírez-Chavarría, R.; Quintana-Carapia, G.; Müller, M.I.; Mattila, R.; Matatagui, D.; Sánchez-Pérez, C. Bioimpedance Parameter Estimation using Fast Spectral Measurements and Regularization. IFAC-PapersOnLine 2018, 51, 521–526. [Google Scholar] [CrossRef]
  41. Shalev-Shwartz, S.; Ben-David, S. Understanding Machine Learning: From Theory to Algorithms; Cambridge University Press: Cambridge, UK, 2014. [Google Scholar] [CrossRef]
  42. Tang, Z.; Cui, J.; Kshirsagar, A.; Liu, T.; Yon, M.; Kuchipudi, S.V.; Guan, W. SLIDE: Saliva-Based SARS-CoV-2 Self-Testing with RT-LAMP in a Mobile Device. ACS Sens. 2022, 7, 2370–2378. [Google Scholar] [CrossRef] [PubMed]
  43. Nasir, N.; Kansal, A.; Alshaltone, O.; Barneih, F.; Sameer, M.; Shanableh, A.; Al-Shamma’a, A. Water quality classification using machine learning algorithms. J. Water Process. Eng. 2022, 48, 102920. [Google Scholar] [CrossRef]
Figure 1. Workflow of the proposed method for analyzing isothermal amplification using electrical impedance spectroscopy (EIS) measurements and time-constant-domain spectroscopy (TCDS).
Chemosensors 11 00230 g001
Figure 2. Impedance measurements and time-constant domain spectroscopy for six concentrations of the SARS-CoV-2 genome, c 1 to c 6 . (a) EIS measurements in a Nyquist plot after 35 min of the RT-LAMP reaction. (b) Equivalent circuit model used for EIS data fitting. (c) TCDS retrieved from the estimated distribution function γ ^ ( · ) by processing EIS data using the DRT model. Two electrochemical processes are highlighted, charge transfer: C T (inset), and diffusion: D.
Chemosensors 11 00230 g002
Figure 3. (a) Time-constant-domain spectroscopy filtered signals preserving only the charge transfer process. The spectra are normalized in amplitude for the negative template control (NTC) and six concentrations. (b) Calibration curve using TCDS as the transduction signal. Sensor response Δ τ as a function of the logarithmic concentration of SARS-CoV-2 genome.
Chemosensors 11 00230 g003
Figure 4. Detection of SARS-CoV-2 genome using a negative control (NTC) and three positive samples s 1 , s 2 and s 3 . (a,b) TCDS signals for genes N and ORF1ab, respectively. (c,d) Gel electrophoresis of the RT-LAMP reaction for genes N and ORF1ab, respectively.
Chemosensors 11 00230 g004
Figure 5. Classification results for SARS-CoV-2 genome detection. (a) Linear model for the training data set based on logistic regression. (b) Confusion matrix describing the classifier performance in prediction, of which the accuracy is 85%.
Chemosensors 11 00230 g005
Disclaimer/Publisher’s Note: The statements, opinions and data contained in all publications are solely those of the individual author(s) and contributor(s) and not of MDPI and/or the editor(s). MDPI and/or the editor(s) disclaim responsibility for any injury to people or property resulting from any ideas, methods, instructions or products referred to in the content.

