Abstract
In vitro cell cultures are used as models for drug discovery. The detection of cell damage biomarkers such as adenylate kinase (AK) is often used in drug screening and cell biology experiments. A microfluidic platform for AK detection was developed with the capability of detecting the AK resulting from the lysis of 10–100 human colorectal adenocarcinoma HCT116 cells. For this assay, AK was captured on the surface of microbeads integrated into a microfluidic device and optically detected using a fluorescently labelled anti-AK antibody. Microfluidic technologies have in addition been used to develop two- and three-dimensional cell culture models that have the potential to accelerate drug discovery. The microfluidic platform was used to detect the AK resulting from the lysis of HCT116 cells cultivated in a microfluidic biochip, demonstrating the potential for the integration of the miniaturised biosensor with the cell chip.
1. Introduction
Cancer is the second leading cause of death in the world, and therapy resistance is one of the main factors limiting patient outcomes [1]. In cancer, as well as in other diseases, the discovery of new drug candidates is of vital importance to improve treatment outcomes and reduce mortality rates [2,3]. Two-dimensional (2D) or three-dimensional (3D) cell cultures are used as experimental models for drug discovery [4,5,6,7]. The detection of adenylate kinase (AK), a protein present in all cells that is responsible for the high-energy phosphoryl transfer reaction, is often used as a cell damage reporter [8,9] in drug screening. AK is released into the extracellular medium when the cell membrane is damaged, which is taken as an indication of the efficiency of the therapy. The activity of the adenylate kinase released by damaged cells is usually performed in a two-step assay. In the first reaction, AK converts ADP to ATP. In a second reaction, luciferase catalyses the formation of light from ATP and luciferin; the light is then measured using a luminometer. This assay can be time-consuming and requires significant cell volumes (25 µL) and laboratory equipment [10]. In this work, we present a microfluidic biosensing module for the detection of AK based on a direct immunoassay, which was used to detect AK in the supernatant after the lysis of human colorectal adenocarcinoma HCT116 cells.
A recent tendency has been to miniaturise the platforms for cell culture using microfluidic technologies to create cell chips [11]. Cell chips are miniaturised devices in which cells grow in an environment that can be easily manipulated and treated in a controlled and reproducible way at length scales comparable to the cell dimensions [2,12,13,14]. Cell chips have been used to clarify disease mechanisms, in pharmaceutical screening, and in the monitoring of different aspects of cell biology, such as dispersion, migration, and signalling mechanisms [15]. One of the most important potential advantages of cell chips is the possibility of integrating miniaturised sensors for the real-time and space-resolved monitoring of the cell culture in the chip [12]. This can be accomplished through microfluidic chip instrumentation, including, for example, impedance sensors for cell attachment and biomass monitoring, pH sensors to track pH changes caused by cellular metabolism, oxygen optical sensors, or by including a biosensor module [16]. In this paper, the detection of AK was demonstrated for monitoring the effect of cell damage exposure to the chemotherapeutic agent 5-fluorouracil (5-FU) in a cell chip.
2. Materials and Methods
2.1. Reagents
PPA HyperCel, HEA HyperCel, and MEP HyperCel were obtained from Pall Corporation (Port Washington, NY, USA). CM Sepharose, Capto MMC, NHS Sepharose, Heparin Sepharose, Capto MMC Imp Res, and SP Sepharose were obtained from Cytiva (Uppsala, Sweden). Phosphate buffer solution (PBS) 10x, adenylate kinase antibody (1 mg/mL), Accutase, RIPA buffer, aminopropyltriethoxysilane (APTES), Dye BODIPY FL®, and Alexa Fluor® (A430) NHS ester (succinimidyl ester) were obtained from Fisher Scientific (Waltham, MA, USA). AK (42.2 µM), bovine serum albumin (BSA), and polyethylene glycol (PEG) 8000 were obtained from Sigma-Aldrich (St. Louis, MO, USA). The complete cell culture growth medium for HCT116 cells comprised DMEM (modified) medium supplemented with 100 U/mL penicillin and 100 µg/mL streptomycin obtained from GibcoTM (Thermo Fisher Scientific, Waltham, MA, USA), and 10% foetal bovine serum (FBS) obtained from the Biowest (Riverside, MO, USA). Clinical-grade 5-FU (50 mg/mL) was kindly provided by Hospital São Francisco Xavier (Lisbon, Portugal).
2.2. Fabrication of the Biomarker Detection Chamber
The microfluidic devices for AK detection were fabricated with two different heights: (1) 100 μm used for bead packing and (2) 20 μm for the sample and reactant injection and bead trapping (devices in Figure 1A,B). In Figure 1A, the solutions flowed through the same inlet used for bead packing. The microfabrication process used two masks, each for a different height.
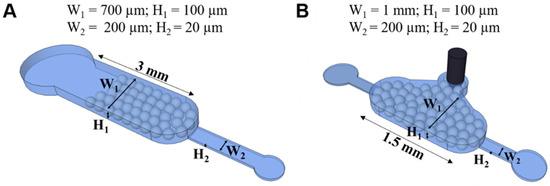
Figure 1.
The microfluidic structures, packed with beads, for screening studies (A) and for detection of AK in assays (B).
The fabrication of the photomasks and master mould for the structures in Figure 1A and Figure 1B can be found in Pinto et al. [17] and Brás et al. [18], respectively. The PDMS was prepared at a ratio of 1:10 with its curing agent (Sylgard 184 silicon elastomer kit, Dow-Corning) poured on top of the mould, and baked for 90 min. The PDMS was then peeled from the mould, and the inlets and outlets were punched with an 18 Gauge syringe; then, the PDMS structure was sealed against a 500 μm PDMS membrane prepared under the same curing conditions. Both PDMS surfaces were subjected to an oxygen plasma (Harrick Plasma, Ithaca, NY, USA) to seal the device. The sealed structures were stored for at least 24 h before being used, to stabilise their hydrophobicity.
2.3. Fabrication of the Microfluidic Cell Culture Chamber
The microfluidic cell culture chamber used in Section 3 has a height of 20 µm, and an area of 1 cm2, with structural posts to avoid the collapse of the channel (Figure 2). The procedure for fabrication is described in Condelipes et al. [19]. For the microfabrication process, one mask level was used for a 20 µm high structure. The aluminium (Al) photomask was designed using computer-assisted design (CAD) software (AutoCAD 2022) and was fabricated in-house using direct-write photolithography (Heidelberg DWLII, Heidelberg Instruments Mikrotechnik, Mittelgewannweg, Heidelberg, Germany). A 200 nm Al layer was deposited on a clean glass (Corning Eagle) substrate via magnetron sputtering (Nordiko 7000). A 1.5 µm thick layer of positive photoresist (PFR 7790G) was spin-coated on the deposited Al layer, and the pattern was transferred to the photoresist with a direct-write laser photolithography system (Heidelberg Instruments, DWLii). After exposure, the substrate was developed (TMA 238 WA, JSA Micro), and the Al was wet-etched using a commercial Al etchant (TechniEtch Al80 aluminium etchant, Microchemicals, Ulm, DE, Germany). The mask was used to fabricate a mould by exposing a SU-8 negative photoresist. The mould was fabricated by first spin-coating a 20 μm thick layer of SU-8 2015 (Microchem) onto a silicon substrate, which was previously cleaned. The SU-8 was then exposed to UV light through the Al mask followed by post-exposure baking and development in propylene glycol methyl ether acetate (PGMEA, Sigma-Aldrich). Then, the mould underwent a final hard-baking step at 150 °C, for 15 min. The finished SU-8 mould was then used for the fabrication of the polydimethylsiloxane (PDMS) microfluidic cell culture chamber.
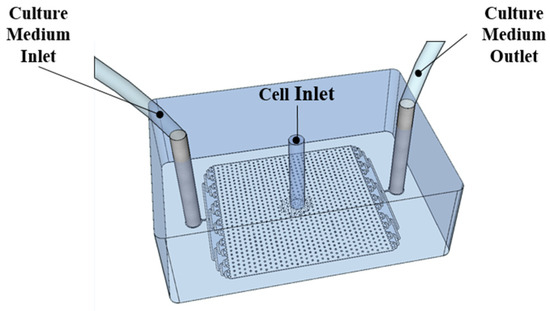
Figure 2.
Microfluidic chamber for cell culture.
The PDMS microfluidic cell culture chamber was sealed against a polystyrene Petri dish. To promote sealing, the Petri dish was subjected to an oxygen plasma treatment for 5 min at 30 W. The surface of the Petri dish was functionalised with silane using APTES solution according to a process described in Condelipes et al. [19]. After this incubation time, the Petri dish was washed with DI water and dried with compressed air. The PDMS microfluidic structure received an oxygen plasma treatment for 5 min at 30 W. Finally, both the silanised Petri dish and PDMS oxidised surfaces were pressed against each other for a few seconds, generating a covalently bonded device.
2.4. Packing of the Biomarker Detection Chamber
Commercially available microbeads were prepared in an ethanol solution 20% (v/v) comprising PPA HyperCel, HEA HyperCel, MEP HyperCel, CM Sepharose, Capto MMC, NHS Sepharose, Heparin Sepharose, Capto MMC Imp Res, and SP Sepharose. In all cases, the bead suspension was homogenised and transferred into a PEG 8000 20% (w/w) solution in a proportion of 1:10. PEG was used to avoid clogging the channel with bead aggregates and to achieve uniform packing. To pack the microfluidic structure, a negative pressure was applied at the outlet using a syringe pump (NE-4000, New Era Pumps, Farmingdale, NY, USA). A pipette tip containing the bead suspension was previously inserted in the inlet. The negative pressure produced a flow rate of approximately 7 µL/min into the channel, resulting in the packing of the beads inside the detection chamber. Subsequently, the microfluidic structures were washed at 17 µL/min using PBS 1x.
2.5. AK Labelling
To prepare fluorescently labelled AK, 50 µL of the commercial protein was diluted in 400 µL of 0.1 M sodium bicarbonate buffer and then conjugated with 10 µL of the amine-reactive dye BODIPY FL® NHS ester (succinimidyl ester) previously dissolved in DMSO at 10 mg/mL. This mixture was incubated in the dark for 1 h at room temperature. The excess dye was washed using a 10 kDa Amicon tube (Merck, Alameda Fernão Lopes, Algés, Portugal). This was carried out by using 500 µL of PBS at a time and centrifuging at 14,000× g for 10 min until the permeate was not fluorescent [20,21].
To prepare the fluorescently labelled anti-AK antibody, the process was the same as the one described above, but with the dye Alexa Fluor® (A430) NHS ester (succinimidyl ester).
The excitation and emission wavelengths for BODIPY FL® NHS ester (succinimidyl ester) and Alexa Fluor® (A430) NHS ester (succinimidyl ester) are 502/ 510 nm and 430/545 nm, respectively.
2.6. Preparation of Lysed HCT116 Cell Supernatant
For the AK detection in cell lysate solutions, described in Section 3.2, the HCT116 (ECACC 91091005) cells were cultivated in a T-flask in a complete cell culture growth medium at 37 °C, with 5% CO2 in a saturated atmosphere [22]. The medium and cells (at 1.6 × 10⁶ cells/mL) were collected, and RIPA lysis buffer was added according to the manufacturer’s specifications [23]. The resultant mixture was left to incubate on ice for 30 min. Afterwards, the mixture was centrifuged at 14,600× g for 30 min at 4 °C, and 7 mL of supernatant was recovered. Successive dilutions were made from the supernatant obtained after lysis. HCT116 was the cell line used in this study because it is susceptible to 5-FU.
2.7. Image Acquisition and Processing
Fluorescence measurements were performed using a fluorescence microscope (Leica DMLM) equipped with a digital camera (DFC300FX) and a 100 W short arc mercury lamp as an excitation light source, coupled to an I3 filter cube with a band-pass for the excitation of 450–490 nm (blue) and a long-pass for emission at 515 nm (green). For the quantification of AK, the fluorescence signal from the beads inside the microcolumns was acquired with an exposure time of 2 s, and 1 × gain. The obtained micrographs were analysed using ImageJ software from the National Institutes of Health, USA [24]. The images were split into red, green, and blue channels, and only the green channel was analysed by creating a region of interest inside the microfluidic channel (signal) and an equal region outside of the microfluidic channel (background) that was subtracted from the signal value.
2.8. Direct Immunoassay for AK Detection
2.8.1. Microbead Screening Study
The microbead screening study for AK capture was performed in the microfluidic column in Figure 1A [17]. The microcolumn was packed with the microbeads as described in Section 2.4. Then, a solution of AK labelled with 1 mg/mL BODIPY FL® was injected at a flow rate of 1 µL/min for 10 min. The microfluidic structure was washed with PBS 1x using 5 µL/min, and fluorescence was measured.
2.8.2. Optimisation
The structure in Figure 1B was used to perform the optimisation of AK detection. The microcolumn was packed with NHS Sepharose beads (~90 µm), as described in Section 2.4. Then, a solution of commercial AK was injected, followed by the addition of a blocking agent (BSA 1%, BSA 4%, or complete cell culture growth medium), both using a flow rate of 1 µL/min for 10 min. Finally, an anti-AK antibody labelled with Alexa Fluor® (A430) was injected with a flow rate of 1 µL/min for 5 min. The microfluidic structure was washed with PBS 1x using a 5 µL/min flow rate for 10 min, and fluorescence was measured.
Anti-AK Antibody Concentration
As described in Section 2.8.2, different concentrations of labelled anti-AK antibodies (5 × 10⁻², 1 × 10⁻¹, 5 × 10⁻¹, 1, and 5 mg/mL) were tested against a fixed concentration of 42.2 µM commercial AK. BSA 4% was used as a blocking agent.
Blocking Agent
As described in Section 2.8.2, different blocking agents, BSA 1%, BSA 4%, and complete cell culture growth medium were tested in the absence of commercial AK and with 1 mg/mL anti-AK antibody labelled with Alexa Fluor® (A430).
2.8.3. AK Detection Calibration Curve Using the Optimised Anti-AK Antibody Concentration and Blocking Agent
A calibration curve was plotted with AK concentrations ranging from 1 × 10⁻¹ to 42.2 µM. The microfluidic structure in Figure 1B was used to detect and quantify the AK concentration. After the NHS Sepharose bead packing step, described in Section 2.4, a flow of AK solution at a given concentration and a flow rate of 0.2 µL/min was maintained for 10 min. The complete cell culture growth medium was used as a blocking agent and flowed at 1 µL/min for 10 min. FBS is very rich in proteins, such as BSA, which is an excellent blocking agent in immunoassays. Subsequently, 1 mg/mL anti-AK antibody labelled with Alexa Fluor® (A430) was injected at a flow rate of 1 µL/min for 5 min. The microfluidic structure was washed with PBS 1x using 5 µL/min for 10 min. All these solutions were pumped using a negative pressure at the outlet. The fluorescence was measured.
The fluorescence signals obtained were plotted as a function of the different measured AK concentrations. Then, a linear regression was measured, using five concentration points 2.5, 4.2, 12.7, 25.3, and 42.2 µM, as shown in Section 3.2.
2.8.4. Measurement of AK in the Cell Culture Supernatant
The microcolumn in Figure 1B was packed with NHS Sepharose beads, as described in Section 2.4, followed by the insertion of lysed supernatant (as described in Section 2.6) for 10 min at a flow rate of 0.2 µL/min. Different dilutions of 1.6 × 10⁶ cells/mL were tested. A volume of 5 µL of 1 mg/mL anti-AK antibody labelled with Alexa Fluor® (A430) was then flowed for 5 min at a flow rate of 1 µL/min, followed by a wash step with PBS 1x for 10 min with a flow rate at 5 µL/min. All these assay steps were pumped using negative pressure at the outlet. These assays were performed without a blocking step, as described before in others sections, because the samples collected were surrounded in the complete cell culture growth medium.
2.9. Cell Culture in the Microfluidic Cell Culture Chamber
The microfluidic cell culture chamber (Figure 2) was sterilised (during 20 min in UV light), coated with collagen type I, and washed with the complete cell culture growth medium, and HCT116 cells were injected into the chip following the processes described in Condelipes et al. [19]. The chip was placed into an incubator (37 °C, 5% CO2) for 5 h to allow cell attachment to the collagen-coated chip surface. After seeding, the medium was set to flow at 0.2 µL/min, and the chips were placed inside an incubator during the full cell culture period of the experiments.
2.9.1. Cell Growth + RIPA Lysis in the Microfluidic Cell Culture Chamber
After 61 h of cell growth as described in Section 2.9, cell lysis was induced. Two different lysis procedures were performed: (1) RIPA lysis buffer was set to flow inside the chip where cells were cultured, and (2) the cells were first removed from the chip and then lysed off-chip using the RIPA buffer. Additionally, a control assay was performed in which no RIPA buffer lysis was used.
When cell lysis was performed inside the microfluidic channel, the RIPA buffer solution was set to flow for 15 min at 10 µL/min. The solution collected at the outlet was centrifuged at 14,600× g for 30 min at 4 °C (according to the manufacturer instructions) to remove cells and cell debris from the solution, which could interfere with the AK detection process [25]. When cell lysis was performed off-chip, cells were first detached using an accutase solution, which flowed in the chip for 20 min at 10 µL/min at 37 °C, with 5% CO2. The cells were collected periodically at the chip outlet. According to the approximate number of cells inside the chip, the appropriate quantity of RIPA buffer was added, and the lysis protocol described in Section 2.6 was carried out (Figure S1A).
2.9.2. Cell Growth + 5-FU + RIPA Lysis in the Microfluidic Cell Chamber
For the study of the drug effect, cells were grown in the chip for 24 h, as described in Section 2.9. After that time, 5-FU was injected for 72 h at 0.2 µL/min. Different drug concentrations were tested: 0 µM, 50 µM, and 1000 µM in a complete cell culture growth medium. During the treatment time, samples were collected periodically at the chip outlet. Whenever a sample was collected at a given time point, a new microcentrifuge tube was used for the collection at the outlet.
After 72 h of cell growth, the RIPA buffer solution was injected for 15 min at 10 µL/min. The solution collected at the outlet was subjected to centrifugation at 14,600× g for 30 min at 4 °C—according to the manufacturer instructions (Figure S1B).
In both cases, RIPA lysis and 5-FU exposure in the microfluidic cell chamber, measurements of AK were performed as described in Section 2.8.4.
3. Results and Discussion
3.1. Screening of Microbeads for AK Capture: Optimisation of Anti-AK Antibody Concentration and Blocking Agent
The main goal of this work was to develop a microfluidic direct immunoassay capable of detecting a cell damage biomarker. This detection can be performed off-chip after cell treatments or coupled with a cell chip in which cells were exposed to a lysis agent or a drug. Here, AK was used as the biomarker of cell damage since it is commonly used in compound screening. The AK direct immunoassay detection is based on capturing the biomarker in microbeads mechanically trapped in a microfluidic channel, followed by the optical detection of AK using a labelled anti-AK antibody. This strategy is schematically summarised in Figure 3. The specific signal is directly proportional to the concentration of AK in the sample and can be used to determine the number of AK molecules that are released upon cell damage.
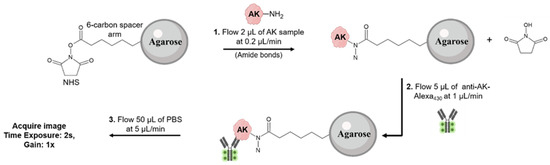
Figure 3.
Schematic of the immunoassay for AK detection using microbeads. AK primary amines form covalent bonds with the NHS groups.
To achieve this goal, a novel microfluidic-compatible strategy for AK detection was developed based on microbeads typically used in chromatographic processes. The use of microbeads trapped in the microfluidic structure increases the surface area, hence the sensitivity of detection, and decreases the diffusion length, and therefore the duration of the assay. Thus, the first step in assay development was to determine which beads were optimal to capture the AK target. The microcolumn used for these screening assays is schematically shown in Figure 1A. A screening study with different microbeads was performed to select the microbeads that were the most efficient in the capture of the target AK molecule.
PPA HyperCel and HEA HyperCel bind target molecules mainly via hydrophobic interactions, while MEP HyperCel has a binding mechanism that includes a mild hydrophobic effect, together with electrostatic and covalent components, and NHS Sepharose and Heparin Sepharose bind via covalent interactions. CM Sepharose, Capto MMC, and Capto MMC ImpRes beads are weak cation exchangers, whereas SP Sepharose is a strong cation exchanger. Only cation exchanger beads were tested because the AK protein at pH 7 is positively charged (the isoelectric point is approximately 9 [26]). From this screening assay, in which fluorescently labelled AK first flowed, followed by a PBS 1x wash, as shown in Figure 4A,B, it was concluded that the NHS Sepharose beads exhibited higher fluorescence after a longer washing step, and thus these beads were selected for further assay development. NHS Sepharose beads form covalent, chemically stable amide bonds with the primary amines present in AK, and the spacer arm between the NHS group and the agarose beads allowed highly efficient binding by minimising steric hindrance (Figure 3).
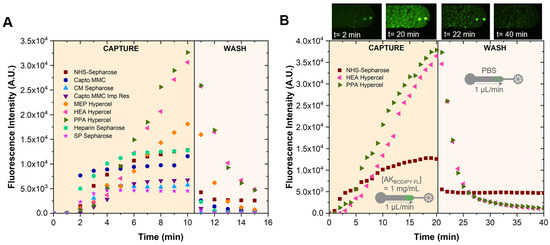
Figure 4.
Microbead screening study: (A) test of different microbeads to determine the optimal microbead to capture adenylate kinase (AK). A solution of AKBODIPY FL = 1 mg/mL was set to flow through the beads for 10 min and a washing step with PBS 1x was performed for 5 min (n = 1); (B) capture and longer washing curves obtained by continuously measuring the fluorescence intensity of the packed NHS Sepharose, HEA Hypercel, and PPA Hypercel beads (n = 1). The images refer to NHS Sepharose. The excitation wavelength was 450–490 nm (blue).
Having selected the NHS Sepharose beads to capture the AK, the next step in assay development was to determine the concentration of anti-AK antibody necessary to reach a saturation signal at the relatively large AK concentration of 42.2 µM. This saturation means that essentially all AK target molecules were involved in the detection of the anti-AK antibody. As it is possible to observe in Figure 5A, increasing the antibody concentration beyond 1 mg/mL did not change the signal, so this anti-AK antibody concentration was selected for further assays.
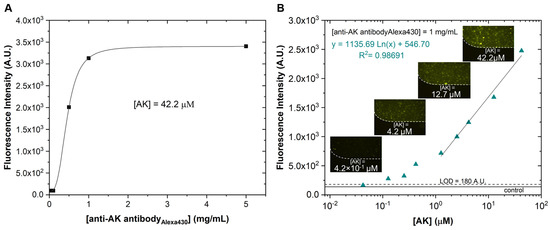
Figure 5.
Immunoassay for AK detection: (A) optimisation of the labelled anti-AK antibody concentration for a fixed AK concentration (42.2 µM). Capture and wash steps were performed at 1 µL/min and 5 µL/min, respectively; (B) fluorescence response curve for different target synthetic AK concentrations, ranging from 1 × 10⁻¹ to 42.2 µM, using the optimised assay conditions, and linear regression (y = 1135.69 Ln(x) + 546.70). The control corresponds to the assay without target AK, establishing the baseline for non-specific interactions and residual capture of detection antibodies (n = 3). The excitation wavelength was 450–490 nm (blue).
The complete cell culture growth medium was selected as the blocking agent, because it presented lower fluorescence intensity values in negative control assays, indicating the absence of non-specific interactions (Figure S2). The negative control experiment consisted of the assay described in Section 2.8.2 but without flowing the AK target in the microfluidic channel. Here, we tested three different blocking agents (BSA 1%, BSA 4%, and the complete cell culture growth medium) to see which one would be the best. The assay without blocking would lead to the binding of the labelled anti-AK antibody to the microfluidic channel walls or microbeads. In this way, with the presence of the blocking agent in the assay, the labelled anti-AK antibody would only covalently bind to the AK target. Thus, the verified fluorescence signal would always be due to the presence of the AK target and not for any other reason. In addition, we also ruled out the possibility of binding the labelled anti-AK antibody to the components of the complete cell culture growth medium, due to the low fluorescence values obtained in the negative control.
3.2. AK Detection Sensitivity in Buffer and Lysed Cell Solution
After determining the optimal anti-AK antibody concentration (Figure 5A), a curve was plotted for the fluorescence signal as a function of AK concentrations in PBS 1x (with the anti-AK antibody fixed as the optimised concentration), which is shown in Figure 5B. The results show that is possible to detect molecules of AK down to a concentration of approximately 1 × 10⁻⁶ M.
This response curve was obtained using the microfluidic structure schematically shown in Figure 1B. This structure was less susceptible than that shown in Figure 1A to the development of air bubbles and disturbance to the microbead packaging integrity, which may lead to irregular flow rates, increased noise in the measurements, and decreased assay reproducibility.
Having established the sensitivity of the AK detection assay in model conditions (AK in PBS 1x), the next step was to demonstrate that the AK resulting from cell lysis could be detected. For this purpose, the successive dilutions of a solution with 1.6 × 10⁶ lysed HCT116 cells were used to determine the lower concentration limit of lysed cells detectable using the microfluidic AK detection immunoassay. The original cell solution was subjected to chemical lysis using the RIPA buffer, a reagent used for mammalian cell lysis and protein solubilisation. Figure 6 shows that it is possible to detect the AK resulting from the lysis of approximately 10–100 HCT116 cells with reaction volumes of 2 µL. The ToxilightTM Bioassay reagent method used on a macroscale is faster in terms of detection because the readable signal is detectable 5 min after the addition of the ToxilightTM Bioassay reagent. However, for this measurement, 25 µL of cell volume is required, and to reach this volume, it takes about 2 h (using a flow rate of 0.2 µL/min). Using the method developed in this article, the detection time was approximately 20 min; however, the cell volume required was much smaller (2 µL), so the sample collection time was only 10 min. In this way, it can be inferred that the method using microfluidics surpasses the macroscale method, in addition to the fact that the sensitivity is greater since at the macroscale, it is only possible to detect 10 HCT116 lysed cells per well (25 µL), while at the microscale, it is possible to detect 10–100 HCT116 lysed cells in 2 µL [10]. It is important to note that for cell lysis to occur, it was necessary to add the RIPA buffer solution since centrifugation alone did not cause significant cell damage (results shown in blue in Figure 6).
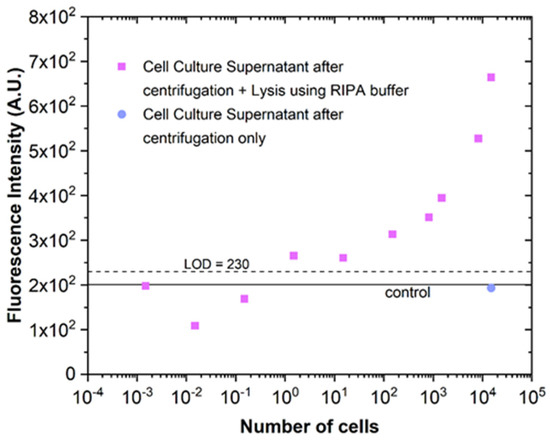
Figure 6.
Cell lysis monitored through AK detection in a microfluidic chip. AK detection immunoassay was performed in solutions obtained by sequentially diluting a stock lysate solution with a concentration of 1.6 × 10⁶ cells/mL (pink squares) and in a solution of cells subjected only to centrifugation (blue) (n = 1). The control results from non-specific interactions and the residual capture of free detection antibodies when only the complete cell culture growth medium flowed through the channel (in the absence of cells) (n = 3). The excitation wavelength was 450–490 nm (blue).
Using Figure 5B and Figure 6, it is possible to estimate the number of AK molecules detected per cell lysed. Although the matrices are different (the calibration curve of Figure 5B was plotted for the experiment using PBS 1x), it was found in separate experiments that the presence of RIPA buffer does not interfere with the AK detection assay. An estimate of approximately 3.1 × 10⁵ AK molecules per cell was obtained, assuming a cell volume of approximately 3 × 10⁻⁶ µL [27].
3.3. Monitoring Cell Damage in a Microfluidic Cell Chip
The AK detection assay was used to monitor cell lysis in a cell chip. HCT116 cells were inserted, incubated, and grown in a cell chip. In one experiment, after 61 h of cell growth, chemical lysis with RIPA buffer was performed following two different approaches: (1) in the chip and (2) off-chip lysis. The increase in the fluorescence signal after RIPA buffer treatment demonstrates that cell damage monitoring in the cell biochip is possible using the AK microfluidic detection assay (Figure 7A). From the fluorescence value obtained and using the established calibration curve, it was possible to estimate that the number of cells present on the chip and subsequently lysed was approximately 2 × 10⁴. It was also possible to observe a slight increase in fluorescence at 61 h of cell growth before chemical lysis (Figure 7A), which could be due to the occurrence of natural cell damage in the chip.
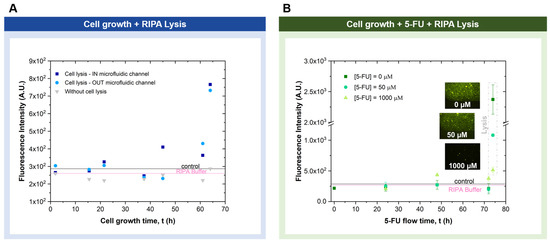
Figure 7.
Detection of AK resulting from cell damage in cell chips. Two different procedures were performed: (A) cell growth for 61 h with complete cell culture growth medium perfusion followed by lysis inside or outside the microfluidic channel, performed with RIPA buffer. Intermediate measurements of AK before lysis were taken during this period (n = 1); (B) cell growth for 24 h with complete cell culture growth media perfusion, followed by the continuous 5-FU injection at different concentrations during 72 h. Intermediate measurements of AK were taken during this period. At the end of this period, lysis was performed by flowing RIPA buffer inside the microfluidic channel (n = 2). In both cases, the control and RIPA buffer refer to the non-specific background fluorescence value when only the complete cell culture growth medium or RIPA buffer flowed through the channel (in the absence of cells) (n = 3). The excitation wavelength was 450–490 nm (blue).
A second AK detection experiment was performed by inserting different 5-FU concentrations into the biochip during cell growth. Notably, 5-FU is one of the most commonly used drugs in cancer treatment, often in combination with other anticancer drugs. Additionally, 5-FU is an antimetabolite that targets replicating cells by overwhelming DNA repair mechanisms, eventually leading to cell death [28]. After 24 h of cell insertion, incubation, and growth, 5-FU was added to the complete cell culture growth medium. Figure 7B shows that, after 48 h, for the highest 5-FU concentration (1000 µM), it was possible to observe the initial signs of cell damage in the biochip from the AK signal collected. At the end of the assay, the RIPA buffer was allowed to flow into the biochip to verify the amount of AK that was released. In the chip with the highest concentration of 5-FU, a smaller amount of target AK was observed when cell lysis was performed using the RIPA buffer at the end of the experiment, as expected (Figure 7B and Figure 8). In this way, it was possible to conclude that the lower the 5-FU concentration flowed on the chip, the greater the amount of the target AK released at the end of the experiment following lysis. This is due to the greater number of viable cells on the chip, without a compromised cell membrane at lower 5-FU concentrations.
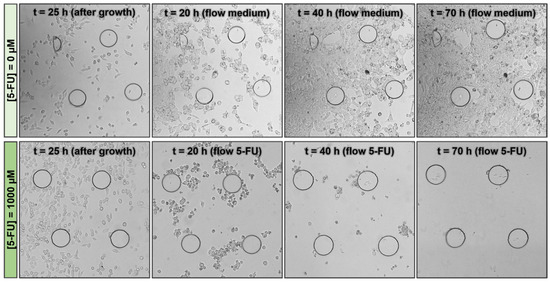
Figure 8.
Micrograph of a subsection over time of injection of a specific drug concentration, 0 µM and 1000 µM.
The standard assays for AK measurement rely on two chemical reactions. Firstly, the AK released by damaged cells converts ADP into ATP. Then, in a bioluminescence method, luciferase catalyses light formation from ATP and luciferin. This signal can be measured using a luminometer and is proportional to AK concentration. Available in commercial kits, these assays are easy to use. However, high volumes of both the reagent buffer and cell culture medium are required for the bioluminescence reaction (25 µL for 384-well plates or 100 µL for 96-well plates). Additionally, the luminescence signal generated cannot be related to the number of cells seeded and always has to be relative to a control condition. Lastly, these approaches are usually endpoint evaluations and do not allow the continuous monitoring of cell damage.
The methodology presented in this paper allows the monitoring of AK release over time through cell media collection at the outlet at specific time points without compromising cell incubation. In addition, the reaction volumes used can be as low as 2 µL. Moreover, by using an anti-AK antibody, the signal measured is directly proportional to the amount of AK present in the samples.
4. Conclusions
A microfluidic biosensing platform capable of detecting a cell damage biomarker—adenylate kinase (AK)—was proposed and demonstrated. Using a direct immunoassay, in which AK was captured on the surface of microbeads trapped in the microfluidic device and detected using a labelled anti-AK antibody, it was possible to detect AK in the supernatant of human colorectal adenocarcinoma HCT116 cells corresponding to about 10–100 lysed cells. This procedure was also implemented at the outlet of a cell chip. In this case, it was possible to detect the AK resulting from the lysis of the cells cultivated in the chip, and to monitor the effect of the exposure of the cell culture in the chip to 5-FU over time, albeit still with limited sensitivity. The integration of this microfluidic biosensor—and additional biosensors with other capabilities—with the cell chip platform can potentially dramatically improve the speed and quality of drug discovery and disease treatment procedures.
Supplementary Materials
The following supporting information can be downloaded at: https://www.mdpi.com/article/10.3390/chemosensors11040220/s1, Figure S1. Detection of AK resulting from cell damage in cell chips. Two different procedures were performed: (A) cell growth + RIPA lysis in the microfluidic cell culture chamber; (B) cell growth + 5-FU + RIPA lysis in the microfluidic cell chamber. Figure S2. Optimisation performed related to blocking agent, using AK = 0 µM (absence) and anti-AK antibody = 1 mg/mL.
Author Contributions
C.D.: methodology, investigation, formal analysis, writing—original draft preparation. P.M.F. and P.G.M.C.: methodology, investigation, writing—review and editing. V.M. and M.B.A.: investigation, writing—review and editing. V.C., C.M.P.R. and J.P.C.: conceptualisation, methodology, writing—review and editing, supervision, funding acquisition. All authors have read and agreed to the published version of the manuscript.
Funding
The authors thank the funding from the European Structural and Investment Funds through the COMPETE Program under the Program grant LISBOA-01-0145-FEDER-016405 and from National Funds through FCT—Fundação para a Ciência e a Tecnologia under the Program grant SAICTPAC/0019/2015. Cristiana Domingues acknowledges FCT for funding through a doctoral grant 2020.09377.BD. Pedro Mendes Fontes and Pedro G. M. Condelipes acknowledge FCT for funding through their doctoral grants PD/BD/135275/2017 and, PD/BD/150393/2019, respectively. INESC-MN acknowledges FCT for funding the Research Unit INESC-MN through the pluriannual BASE (UIDB/05367/2020) and PROGRAMATICO (UIDP/05367/2020) financing and project VineSense (PTDC/BAA-DIG/4735/2020).
Institutional Review Board Statement
Not applicable.
Informed Consent Statement
Not applicable.
Data Availability Statement
Not applicable.
Conflicts of Interest
The authors declare no conflict of interest.
References
- Siegel, R.L.; Miller, K.D.; Fuchs, H.E.; Jemal, A. Cancer statistics. CA Cancer J. Clin. 2022, 72, 7–33. [Google Scholar] [CrossRef]
- Sanjay, S.T.; Fu, G.; Dou, M.; Xu, F.; Liu, R.; Qi, H.; Li, X. Biomarker detection for disease diagnosis using cost-effective microfluidic platforms. Analyst 2015, 140, 7062–7081. [Google Scholar] [CrossRef]
- Shi, Y.; Cai, Y.; Cao, Y.; Hong, Z.; Chai, Y. Recent advances in microfluidic technology and applications for anti-cancer drug screening. TrAC Trends Anal. Chem. 2020, 134, 116118. [Google Scholar] [CrossRef]
- Shang, M.; Soon, R.H.; Lim, C.T.; Khoo, B.L.; Han, J. Microfluidic modelling of the tumor microenvironment for anti-cancer drug development. Lab Chip 2019, 19, 369–386. [Google Scholar] [CrossRef]
- Coluccio, M.L.; Perozziello, G.; Malara, N.; Parrotta, E.; Zhang, P.; Gentile, F.; Limongi, T.; Raj, P.M.; Cuda, G.; Candeloro, P.; et al. Microfluidic platforms for cell cultures and investigations. Microelectron. Eng. 2019, 208, 14–28. [Google Scholar] [CrossRef]
- Kapałczyńska, M.; Kolenda, T.; Przybyła, W.; Zajączkowska, M.; Teresiak, A.; Filas, V.; Ibbs, M.; Bliźniak, R.; Łuczewski, L.; Lamperska, K. 2D and 3D cell cultures—A comparison of different types of cancer cell cultures. Arch. Med. Sci. 2018, 14, 910–919. [Google Scholar] [CrossRef]
- Gao, D.; Liu, H.; Jiang, Y.; Lin, J.-M. Recent developments in microfluidic devices for in vitro cell culture for cell-biology research. TrAC Trends Anal. Chem. 2012, 35, 150–164. [Google Scholar] [CrossRef]
- Fujisawa, K.; Terai, S.; Takami, T.; Yamamoto, N.; Yamasaki, T.; Matsumoto, T.; Yamaguchi, K.; Owada, Y.; Nishina, H.; Noma, T.; et al. Modulation of anti-cancer drug sensitivity through the regulation of mitochondrial activity by adenylate kinase 4. J. Exp. Clin. Cancer Res. 2016, 35, 48. [Google Scholar] [CrossRef] [PubMed]
- Jacobs, A.C.; DiDone, L.; Jobson, J.; Sofia, M.K.; Krysan, D.; Dunman, P.M. Adenylate Kinase Release as a High-Throughput-Screening-Compatible Reporter of Bacterial Lysis for Identification of Antibacterial Agents. Antimicrob. Agents Chemother. 2013, 57, 26–36. [Google Scholar] [CrossRef] [PubMed]
- ToxiLightTM Non-Destructive Cytotoxicity BioAssay Kit, 500 Test, (n.d.). Available online: https://bioscience.lonza.com/lonza_bs/PT/en/Culture-Media-and-Reagents/p/000000000000186467/ToxiLightTM-Non-Destructive-Cytotoxicity-BioAssay-Kit%2C-500-test (accessed on 6 February 2023).
- Chi, C.-W.; Ahmed, A.R.; Korkut, Z.D.; Wang, S. Microfluidic cell chips for high-throughput drug screening. Bioanalysis 2016, 8, 921–937. [Google Scholar] [CrossRef]
- Primiceri, E.; Chiriacò, M.S.; Rinaldi, R.; Maruccio, G. Cell chips as new tools for cell biology—Results, perspectives and opportunities. Lab Chip 2013, 13, 3789–3802. [Google Scholar] [CrossRef]
- Wang, P.; Liu, Q. Cell-Based Biosensors Principles and Applications; Artech House: Norwood, MA, USA, 2010. [Google Scholar]
- Halldorsson, S.; Lucumi, E.; Gómez-Sjöberg, R.; Fleming, R.M.T. Advantages and challenges of microfluidic cell culture in polydimethylsiloxane devices. Biosens. Bioelectron. 2015, 63, 218–231. [Google Scholar] [CrossRef] [PubMed]
- Joshi, P.N. Cells and Organs on Chip—A Revolutionary Platform for Biomedicine. In Lab-on-a-Chip Fabrication and Application; IntechOpen: London, UK, 2016; pp. 77–79. [Google Scholar] [CrossRef]
- Kieninger, J.; Weltin, A.; Flamm, H.; Urban, G.A. Microsensor systems for cell metabolism—From 2D culture to organ-on-chip. Lab Chip 2018, 18, 1274–1291. [Google Scholar] [CrossRef]
- Pinto, I.; Caneira, C.; Soares, R.; Madaboosi, N.; Aires-Barros, M.; Conde, J.; Azevedo, A.; Chu, V. The application of microbeads to microfluidic systems for enhanced detection and purification of biomolecules. Methods 2017, 116, 112–124. [Google Scholar] [CrossRef] [PubMed]
- Brás, E.J.; Domingues, C.; Chu, V.; Fernandes, P.; Conde, J.P. Microfluidic bioreactors for enzymatic synthesis in packed-bed reactors—Multi-step reactions and upscaling. J. Biotechnol. 2020, 323, 24–32. [Google Scholar] [CrossRef]
- Condelipes, P.G.M.; Fontes, P.M.; Godinho-Santos, A.; Brás, E.J.S.; Marques, V.; Afonso, M.B.; Rodrigues, C.M.P.; Chu, V.; Gonçalves, J.; Conde, J.P. Towards personalized antibody cancer therapy: Development of a microfluidic cell culture device for antibody selection. Lab Chip 2022, 22, 4717–4728. [Google Scholar] [CrossRef]
- Alexa FluorTM 430 NHS Ester (Succinimidyl Ester), Thermo Fisher Scientific, (n.d.). Available online: https://www.thermofisher.com/order/catalog/product/A10169 (accessed on 3 June 2022).
- BODIPYTM FL NHS Ester (Succinimidyl Ester), Thermo Fisher Scientific, (n.d.). Available online: https://www.thermofisher.com/order/catalog/product/D2184 (accessed on 3 June 2022).
- HCT 116, CCL-247TM. ATCC: The Global Bioresource Center, (n.d.). Available online: https://www.atcc.org/products/ccl-247 (accessed on 3 June 2022).
- RIPA Lysis Buffer. In Cold Spring Harbor Protocols; Cold Spring Harbor Laboratory Press: Cold Spring Harbor, NY, USA, 2017; Volume 2017. [CrossRef]
- Schneider, C.A.; Rasband, W.S.; Eliceiri, K.W. NIH Image to ImageJ: 25 Years of image analysis. Nat. Methods 2012, 9, 671–675. [Google Scholar] [CrossRef]
- Meineke, B.; Heimgärtner, J.; Eirich, J.; Landreh, M.; Elsässer, S.J. Site-Specific Incorporation of Two ncAAs for Two-Color Bioorthogonal Labeling and Crosslinking of Proteins on Live Mammalian Cells. Cell Rep. 2020, 31, 107811. [Google Scholar] [CrossRef]
- Tsuboi, K.K.; Chervenka, C.H. Adenylate kinase of human erythrocyte. Isolation and properties of the predominant inherited form. J. Biol. Chem. 1975, 250, 132–140. [Google Scholar] [CrossRef]
- Milo, R. What is the total number of protein molecules per cell volume? A call to rethink some published values. Bioessays 2013, 35, 1050–1055. [Google Scholar] [CrossRef] [PubMed]
- Wigle, T.J.; Tsvetkova, E.V.; Welch, S.A.; Kim, R.B. DPYD and Fluorouracil-Based Chemotherapy: Mini Review and Case Report. Pharmaceutics 2019, 11, 199. [Google Scholar] [CrossRef] [PubMed]
Disclaimer/Publisher’s Note: The statements, opinions and data contained in all publications are solely those of the individual author(s) and contributor(s) and not of MDPI and/or the editor(s). MDPI and/or the editor(s) disclaim responsibility for any injury to people or property resulting from any ideas, methods, instructions or products referred to in the content. |
© 2023 by the authors. Licensee MDPI, Basel, Switzerland. This article is an open access article distributed under the terms and conditions of the Creative Commons Attribution (CC BY) license (https://creativecommons.org/licenses/by/4.0/).