Abstract
Laser engraving is a convenient, fast, one-step, and environmentally friendly technique used to produce more conductive surfaces by local pyrolysis. The laser’s thermal treatment can also remove non-conductive materials from the electrode surfaces and improve electrochemical performance. The improvement was assessed by electrochemical tools such as cyclic voltammograms and electrochemical impedance spectroscopy using [Fe(CN)6]3−/4− and dopamine as redox probes. The electrochemical results observed showed that a treated surface showed an improvement in electron transfer and less resistance to charge transfer. To optimize the electrode performance, it was necessary to search for the most favorable graphite mines and optimize the parameters of the laser machine (laser power, scan rate, and output distance). The resultant material was adequately characterized by Raman spectroscopy and scanning electron microscopy (SEM), where an irregular surface composed of crystalline graphite particles was noticed. Furthermore, as a proof-of-concept, it was applied to detect indapamide (IND) in synthetic urine by flow injection analysis (FIA), a diuretic drug often used by athletes to alter urine composition to hide forbidden substance consumption in doping tests.
1. Introduction
The laser scribing technique is a rapid, practical, and green way to pattern three-dimensional graphene conductive tracks onto carbon-content materials by direct local pyrolysis [1]. It allows mass production and miniaturization of electrochemical devices without requiring reagents or a controlled environment. In addition to surface treatment of carbonaceous materials, laser scribing has also been used to produce carbon surfaces on polymeric substrates such as polyimide [2], polyetherimide [3], and cardboard [4], generating electrochemical sensors for the most diverse applications [1].
The laser-scribing process improves the electrochemical performance of electrodes. Among the factors that contribute to this improvement can be listed the increase in crystallinity and surface area of the material, the removal of non-conducting materials, and even the generation of graphene [5]. In the case of electrodes constructed with pencil lead, the removal of debris becomes one of the most important factors [6]. Furthermore, it was demonstrated that the association of laser scribing and electrochemical treatment was effective in optimizing the graphite structure of the commercial screen-printed electrode, resulting in improved performance [7].
In the literature, there are many studies utilizing pencil graphite for electroanalysis applications. However, to our knowledge, graphite mines used to load mechanical pencils were not yet subjected to laser treatment to improve electrochemical performance. Graphite leads are affordable and cost-effective materials found at stationaries in various grades (from 10B to 10H) [8]. Graphite is classified on a scale of letters describing hardness (H) and softness (B); the letters marked on the pencils indicate the degree [9]. They consist of a mixture of clay/wax binders and graphite powder. The more clay and wax they have, the harder (H) and lighter the traces left on the paper. On the other hand, the more graphite in its composition, the softer or blacker (B) the graphite mines will be [8].
Graphite electrodes are disposable, providing a renewed surface with each measurement, which simplifies the process compared to tedious polishing. These devices demonstrate good sensitivity, have narrower and sharper peaks, require less deposition time, allow direct application to samples, and are affordable. However, one of their limitations is the reproducibility of graphite manufacturing, even when coming from the same manufacturer and having the same classification in relation to hardness [10].
Their structure is composed of dangling carbon bonds and sp2-hybridized carbon atoms on the basal plane and edges, and the presence of oxygen groups, such as carboxyl and carbonyl, provides differentiated electrochemical performance [11]. Due to its properties, it is widely applied in various fields, such as biomedicine, to measure the anti-diphtheria toxin antibody concentration in serum samples to evaluate immunization degree [11].
In this study, graphite leads were treated with laser to improve their electrochemical characteristics. After establishing the best conditions, the treated graphite leads were applied to the quantification of indapamide at low concentrations.
Indapamide is a thiazide-type diuretic, but its molecular structure differs from other thiazide drugs due to the presence of a 2-methyl indoline ring that confers important lipophilic properties. This drug presents itself as a suitable alternative for the treatment of mild and moderate hypertension [12]. In these cases, its effectiveness in reducing blood pressure is concentrated in thiazide diuretics and β-adrenergic blocking agents when used as monotherapy. Furthermore, according to the seventh report of the Joint National Committee (JNC7), this medication is considered a first-line option in the treatment of hypertension [13].
This diuretic agent with intense antihypertensive action [13] has been banned in sports since 1988, as it is used to reduce body weight to qualify the competitor for a lower weight category as well as to manipulate urine in order to mask positive results in doping tests [14]. Seven different grades of graphite leads were tested using different laser machining parameters such as scan rate, laser output, and focal distance of the laser source to find the best graphite lead and optimal treatment conditions. Electrochemical experiments were explored to select the best electrode. Additional characterizations of the surfaces of the laser-scribed electrodes were conducted using Raman spectroscopy and scanning electron microscopy (SEM). The optimized graphite lead electrode was applied for the analysis of indapamide in synthetic urine samples utilizing amperometry and flow injection analysis (FIA).
2. Materials and Methods
Pencil leads (Pentel, Tokyo, Japan) with grades 2H, H, HB, B, 2B, 3B, and 4B and modeling dough (Acrilex, São Paulo, Brazil) were purchased at the local stationery. To modify the pencil leads, a cutting machine (WorkSpecial 9060C, São Paulo, Brazil) equipped with a CO2 laser unit working at a wavelength of 10.6 µm and a pulse duration of 75 µs pulse−1 was utilized.
2.1. Reagents
All solutions were prepared using deionized water from a Milli-Q purification system (Merck, France, Direct-Q system model, resistivity ≥18.2 MΩ cm). Phosphate buffer solutions (PBS) 0.10 mol L−1 were prepared by solubilizing and diluting, respectively, amounts of NaH2PO4 and Na2HPO4 (Synth, Diadema, Brazil) in deionized water. The pH values were adjusted by adding NaOH or HCl solutions of 3.0 mol L−1. Potassium dihydrogen phosphate, sodium chloride, potassium ferrocyanide, potassium ferricyanide, potassium chloride, sodium hydroxide, and sodium sulfate were purchased from (Synth, Diadema, Brazil). Urea was purchased from (Sigma Aldrich, St. Louis, MO, USA) and dopamine from (Sigma-Aldrich, Gillingham, UK). Calcium chloride, glucose, ascorbic acid, and indapamide were bought from (Merck, Darmstadt, Germany). Indapamide (IND) was prepared at a concentration of 1.0 mmol L−1, solubilized in a phosphate buffer. IND stock solutions were prepared before each experiment to minimize drug oxidation.
2.2. Pencil-Lead Electrodes Laser Treatment
After the series of experiments described above, it was clear that H graphite mines showed the best performance. Before its use, about 70% of the extension of each mine was coated with varnish. The coated extremity was sanded to remove the coating, and then the tips of the mines were polished on office paper until getting a smooth and shiny surface. In sequence, the pencil mines were (individually or in groups) fixed in the modeling dough in a position that formed a 90° angle with the base of the laser machine. Afterward, the laser output was positioned 10 mm from the pencil lead surface. The laser scanned an area of 3 × 3 mm using a power and scan rate of 50% and 1 mm s−1. The treatment lasted ~10 s when individual units were treated. In experiments involving groups of lead pencils, the area was increased to 5 × 5 mm. The electrical contact was established on the opposite side, in the uncoated region.
2.3. Electrochemical Measurements
Cyclic voltammograms (CVs) and electrochemical impedance spectroscopy (EIS) were recorded using a PGSTAT 128N potentiostat with the FRA2 module. To evaluate the performance of the laser-scribed electrodes, experiments were performed using a glassy carbon electrode (GCE), a non-treated graphite (NTGr) and the laser-treated graphite (LTGr) as the working electrode. Ag/AgCl,KCl(sat.) and Pt as the reference and auxiliary electrodes, respectively, completed the arrangement. The three different working electrodes were evaluated by cyclic voltammetry experiments utilizing 1 mmol L−1 [Fe(CN)6]3−/4− solution prepared in 0.10 mol L−1 KCl and also using 1.0 mmol L−1 and dopamine solution in 0.10 mol L−1 acetate buffer, utilizing a scan rate of 50 mV s−1. Electrochemical impedance spectroscopy (EIS) was also explored to compare the non-treated and treated graphite electrodes. The experiments were performed at the open circuit potential (using the same Ag/AgCl,KCl(sat.) and Pt electrode employed in CVs) in a solution containing 4.0 mmol L−1 [Fe(CN)6]3−/4− prepared in 0.10 mol L−1 KCl solution applying alternating potential with an amplitude of 0.01 RMS operating over the 0.10 Hz to 100 kHz frequency range.
2.4. Raman Spectroscopy
The Raman mapping of non-treated and lased-treated graphite surfaces was performed using a Renishaw Invia Raman spectrometer (Renishaw plc, Wotton-under-Edge, UK). Randomly selected areas (11 × 11 µm) were scanned on each graphite surface using a 532 nm-wavelength laser with a power of 100% in conjunction with a lens of 5× of augmentation, exposure time of 5 s, and accumulation time of 1 s.
2.5. Scanning Electron Microscopy
The scanning electron microscopy (SEM, JEOL JSM-7401F microscope) images of the original and treated pencil lead were obtained using an electron beam with 5 kV of intensity, a working distance of 8 mm, and a lower secondary electron detector at different magnifications (×1000, ×10,000, and ×25,000).
2.6. Flow Injection Analysis (FIA)
The FIA system described in this study was built in our laboratory and is depicted in Figure 1. It is composed of four main units: the gravimetric propulsion unit, the injection valve, the electrochemical cell, and the potentiostat for the measurements. To propel the solutions, preference was given to the use of gravimetric propulsion, avoiding the pulsation of the peristaltic pump. For this, a deposit containing the carrier solution was positioned at an adequate height, defining the hydrostatic pressure and, consequently, the flow rate of the carrier solution [12,13]. The carrier deposit (c) was constructed from a one-liter bottle, from which the bottom was removed. At the opposite end, in the center of the bottle cap, a polyethylene tube (d) was adapted, through which the electrolyte was drawn. A polylactic acid (PLA) piece was built using a 3D printer (b), with dimensions to fit on the upper border of the electrolyte deposit. Its function was to support a 500 mL volumetric flask (a), placed upside down inside the electrolyte deposit. When the level of the solution decreases in the deposit (c), air enters in the inverted bottle (a) and the level of the deposit is reestablished. This volumetric flask keeps the solution level constant, avoiding variations in the solution level, maintaining constant hydrostatic pressure. From the deposit, the solution was carried to the injection valve (e). The sample was aspirated from its beaker (g) using a syringe (h) to fill the sample loop (f). When the valve is rotated, the sample enters a flowing stream and is conducted to the electrochemical cell. The solution enters the cell via a tube pressed inside a pipette tip (j), positioned exactly in front of the working electrode (o). The electrochemical cell was built in our laboratory using a cylindrical plexiglass tube (l), to which a bottom (k) was fixed. A hole was drilled in the center of this bottom piece of the exact size to adapt under pressure to a 1 mL pipette tip, which was used as the positioning element of the entering flow. The cell received a cover (m), in which were drilled 3 holes. Exactly in the center, the hole to introduce the working electrode (o) was drilled. On the right side, the counter electrode (n) was positioned, and in the opposite direction, in the third hole, the reference electrode (p) was positioned. The three electrodes were connected to the potentiostat (r). This arrangement is depicted in Figure 1.
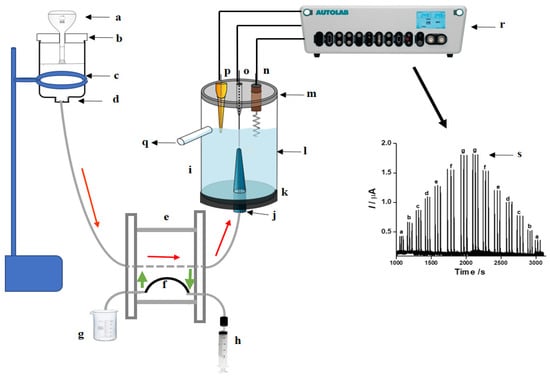
Figure 1.
Schematic diagram showing the experimental setup for FIA-based studies: (a) 500 mL volumetric flask; (b) PLA support printed on a 3D printer; (c) polyethylene bottle (1 L); (d) polyethylene tube adapted to the bottle lid to conduct the electrolyte; (e) manual rotary injector; (f) sampling loop; (g) sample; (h) syringe; (i) electrochemical cell; (j) pipette tip (internal volume 1 mL for the flow inlet); (k) support to fix the pipette; (l) tubular plexiglass tube; (m) cell cap with three holes (for the electrodes); (n) counter electrode; (o) working electrode (LTGr); (p) reference electrode; (q) drain out from the cell; (r) potentiostat; (s) amperogram.
3. Results and Discussion
3.1. Fabrication of the Laser-Scribing-Treated Pencil-Lead Electrode
Laser treatment is a very convenient and fast way to quickly treat electrode surfaces, improving their characteristics. The powerful light beam of the laser cutter is capable of burning carbon-rich polymeric materials on the surface of the pencil lead [15], generating more conductive tracks [1]. Moreover, the resulting high temperature can remove debris (by volatilization of non-conductive materials) that spoils the electrochemical performance [5].
Various types of graphite are available on the market; some of them are softer or darker (B) due to the higher amount of graphite [16] in their composition compared to wax and clay, and others are harder (H) or lighter because they have a relatively high amount of wax and clay. To select the best pencil lead electrode, graphites 2H, H, HB, B, 2B, 3B, and 4B were evaluated. The choice of graphite was based on the ratio of faradaic and capacitive currents in relation to optimizations of laser machine parameters, such as power, scan rate, and focal length height. As expected, a large amount of graphite produces lower electric resistance [8]. However, for electrodes with very high amounts of graphite, an increase in the background current and some mechanical instability were observed (they cracked quickly with laser engraving, compromising their reproducibility). In this way, a graphite with a relatively high concentration of carbon (H) was used in our study (ratio 2.5), as illustrated in Figure 2 [6]. Thus, the best compromise between the aspects described above was obtained with H-type graphite.
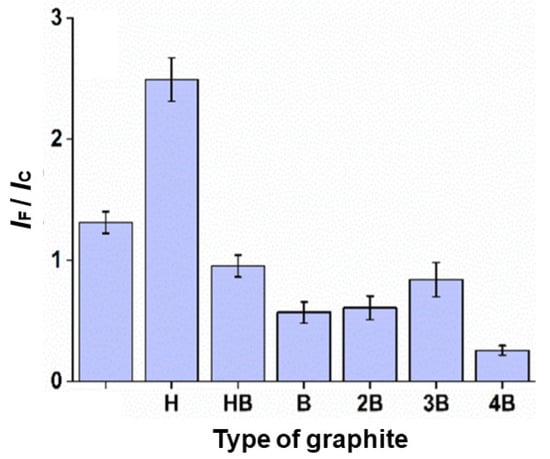
Figure 2.
Signal/background ratio (IF/IC) of the different types of graphite mine, carried out by monitoring the faradaic (IF) and capacitive current (IC) ratios. Graphite was selected by setting laser power, scan rate, and height to 30%, 1 mm s−1, and 10 mm, respectively.
Graphite H can also be beneficial in the matter of quantifying indapamide, according to Stradolini et al. [17]. It was found that the higher the graphite content (weight%), the greater the sensitivity, while the higher the clay content (% by weight), the smaller the fouling effect; clay has a significant effect on ion exchange and structural properties. In the study, a significant value for the clay/graphite ratio was identified as 0.4, for which the fouling effect is not significant in the time series of measurements. The appropriate range of clay to graphite ratio is chosen (from 0.4 to 1.5—from F to 9H) [17].
3.2. Laser-Treated Pencil Lead Characterization
Laser-scribing improved the electrochemical performance of graphite. To demonstrate this aspect, two well-known species, [Fe(CN)6]3−/4− and dopamine, were selected for comparative tests. The peak-to-peak separation (ΔEp) of the [Fe(CN)6]3−/4− inner-sphere redox probe decreased from 467 mV to 112 mV (Figure 3A) after laser scribing. In the case of dopamine, the ΔEp decreased from 249 mV to 138 mV (Figure 3B), indicating that the electron transfer to the organic molecule became faster after laser treatment. The pair [Fe(CN)6]3−/4− is sensitive to cleaning (processed by the laser scribing) at the electrode surface, and dopamine is a molecule sensitive to the proportion of oxygen present on the electrode surface [18]. In both cases, the improvement of the electrochemical signal strongly suggests that the laser treatment removed compounds that impair electron transfer, such as clay/wax, and introduced oxygenated groups on the graphite surface. These results corroborate previous work in which it was reported that the laser treatment of the graphite introduced fractions of oxygen; in addition, the laser restored carbon double bonds and removed additives from the graphite mine, improving electron transfer [6]. It is also necessary to highlight the significant increase in the current intensity, demonstrated in the CVs of [Fe(CN)6]3−/4− and dopamine (Figure 3A,B). The increase in current recorded after the laser scribing process was attributed to the upsurge of new active sites on the electrode surface [6], so as to increase the electrode area.
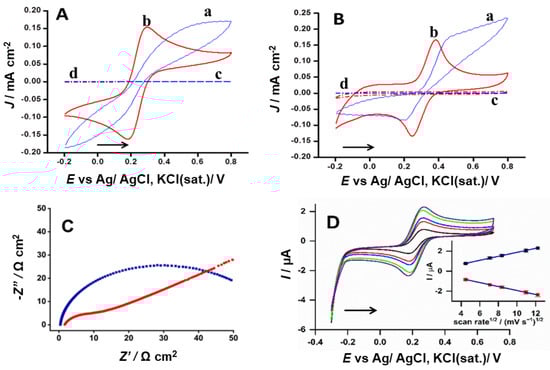
Figure 3.
(A,B) Cyclic voltammograms (CVs) recorded with a scan rate of 50 mV s−1 using non-treated—NTGr (blue) and treated—LTGr (red) H-type graphite, treated under the optimized condition of laser treatment. (A) CVs of the non-treated (a, c) and treated (b, d) electrode in KCl 0.10 mol L−1 (a, b) and in presence of 0.10 mol L−1 KCl aqueous + 1.0 mmol L−1 [Fe(CN6)]3−/4−; (B) CVs of the non-treated (a, c) and treated (b, d) electrode in 0.1 mol L−1 acetate buffer (a, b) and in presence of 0.10 mol L−1 acetate buffer + 1.0 mmol L−1 dopamine (b, d). (C) Electrochemical impedance spectroscopy (EIS) performed at the open-circuit potential in 0.10 mol L−1 KCl solution containing 4.0 mmol L−1 of [Fe(CN)6]3−/4− using non-treated (blue) and treated (red) graphite electrodes, applying alternated potential with an amplitude of 0.01 RMS, operating over the 0.10 Hz to 100 kHz frequency range. (D) CVs at different scan rates in 1.0 mmol L−1 [Fe(CN)6]3−/4−, performed at 20, 50, 70, 120, and 150 mV s−1.
The impedance spectroscopy provides an extension of the electron transfer improvement. As shown in Figure 3C, the electron transfer resistance significantly decreased from 60 Ω cm2 to 10 Ω cm2 due to the laser treatment of the pencil lead. Additionally, the [Fe(CN)6]3−/4− current intensities recorded by varying the scan rates fit the Randles–Ševčík equation, suggesting that the electrochemical process was controlled by diffusion, and ΔEp remained constant even with increasing scan rate (Figure 3D).
The effect of the laser treatment on the morphological structure of the H-type LTGr electrode was analyzed using FE-SEM (Figure 4) [19]. The NTGr surface polished on sulphite paper shows a relatively rough and scaly surface (Column 4A). After treatment with laser (Column 4B), the electrode surface shows a more complex (like eroded soils) morphology with a visible increase in the surface area with more visible graphite-exposed platelets (tactoids) [20]. In fact, the laser treatment introduced remarkable changes in the morphology of the graphite [21], an aspect that contributed to the improved electrochemical response [22].
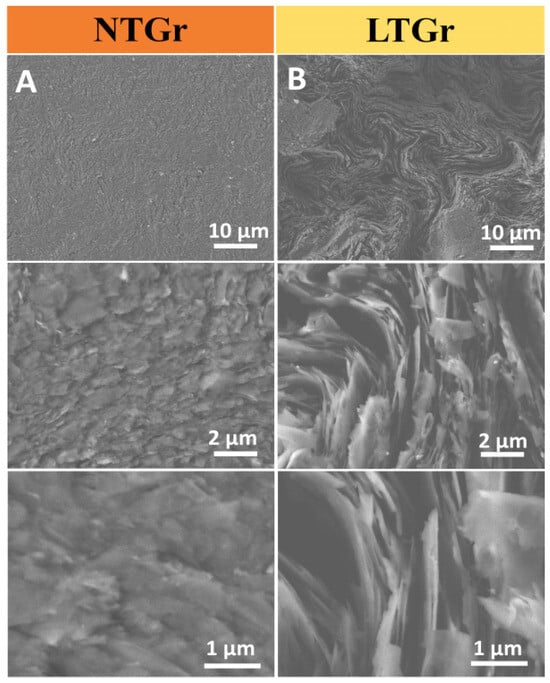
Figure 4.
FE-SEM images of (A) untreated and (B) laser-treated graphite showing increasing magnifications (magnifications increase from top to bottom: ×1000, ×10,000 and ×25,000).
Raman spectroscopy was also used to characterize the NTGr and LTGr electrodes (Figure 5). The Raman spectrums assign two sharp, distinctive peaks of graphitic materials, the D and G bands [7]. The sp2 graphitic carbon is represented by the G band, which corresponds to in-plane symmetric C–C stretching. On the other hand, the sp3-disordered carbon is represented by the D band, and associated with the distortion of finite crystallite size present in polycrystalline graphite and distorted carbon material [7]. In fact, the Raman spectra indicated that the ID/IG ratio (density integration) decreased from 0.43 to 0.090 after laser treatment, which reveals that the surface turned more crystalline (Figure 5A). Furthermore, the Raman mapping image for the LTGr electrode shows that, in basically the entire mapped area (Figure 5B), the ID/IG ratio values are lower when compared to the untreated Gr (Figure 5C). It happened because the laser eliminated debris/binders and burned less crystalline and small graphite particles, decreasing the ID/IG ratio due to exposing graphite edges and tips of platelets, as confirmed in the SEM images. These results corroborated with those available in the literature [23].
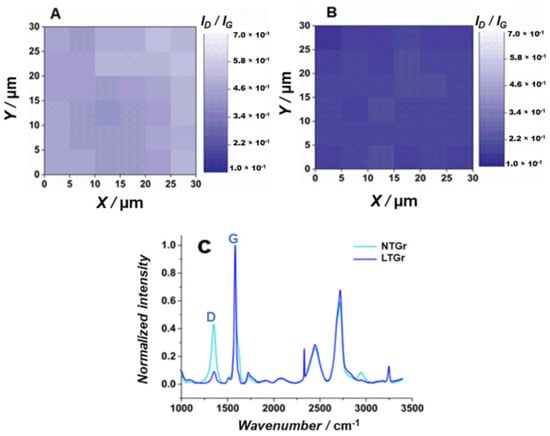
Figure 5.
Raman mapping of (A) NTGr and (B) LTGr, obtained using a laser with wavelength of 532 nm with a lens of ×5 of augmentation, laser power of 100%, exposure time of 5 s, and accumulation of 1 in an area of 11 × 11 µm. (C) Raman spectrum (λexc = 532 nm) of NTGr (cyan line), LTGr (royal blue line).
3.3. Amperometric Detection of Indapamide Using the FIA Technique
3.3.1. Optimization of System Conditions FIA
The redox couple [Fe(CN)6]3−/4− was used as the electrochemical probe to establish the best parameters to be used under hydrodynamic conditions. The sampling loop volume was studied from 50 to 200 µL, a continuous increase in the analytical response was observed up to 150 µL. After this volume, the signal remained almost constant, and the washing time increased. For this reason, the sampling loop volume of 150 µL was chosen as the optimal value. The flow rate was optimized in a range of 0.20 to 2.0 mL min−1 by changing the height of the solution reservoir. The analytical signal increases linearly with the flow rate until 0.80 mL min−1, and after this, more moderately. Injections utilizing 1.2 to 2.0 mL min 1 flow rates were examined with more details, and 1.6 mL min−1 was chosen as the best volume for the following experiments. Using these conditions, the repeatability of the injection was evaluated. Successive injections of 1.0 mmol L−1 [Fe(CN)6]3−/4− lead to a relative standard deviation (RSD) of 1.8%, n = 20. The analysis time for a single injection was 50 s (72 analyses per hour).
3.3.2. FIA Parameters for Quantification of Indapamide
For quantification of indapamide, the FIA parameters optimized previously (flow rate and injected volume) were maintained. Phosphate buffer (0.10 mol L−1, pH = 12) was used as the carrier solution, and all indapamide solutions were prepared in the same medium. The choice of carrier took into account the solubility of indapamide, which is greater in an alkaline environment. The cyclic voltammetric study of indapamide (not shown) indicates the first oxidation peak at the 0.20 V region. To precisely define the optimum potential, a series of injections was performed in the 0.15 V to 0.25 V region, varying the intervals by 0.010 V. From 0.15 V to 0.19 V, the signal increased. After 0.20 V, it was almost constant. In this way, 0.20 V (vs. Ag/AgCl (3.0 mol L−1 KCl [24])), was chosen as the working potential for the following measurements.
To demonstrate the good behavior of the system for indapamide analysis and to evaluate if there was a memory effect during the measurements, a curve with increasing and decreasing IND concentrations ranging from 10 to 70 µmol L−1 was performed (Figure 6A). The good linearity of the responses in this concentration range is clear in Figure 6B. The linear regression of the increasing series resulted in (Ip = 0.023 [IND] + 0.182, R2 = 0.998) and the decreasing series was calculated as (Ip = 0.025 [IND] + 0.037, R2 = 0.991). To evaluate the repeatability of the analysis, a series of 10 injections of 1.0 mmol L−1 indapamide was done (Figure 6C). The relative standard deviation was calculated as 0.70%, attesting to the good precision of the FIA-amperometric method. To demonstrate the feasibility of analysis in real samples, two enriched synthetic urine samples were prepared and tested (Figure 6D).
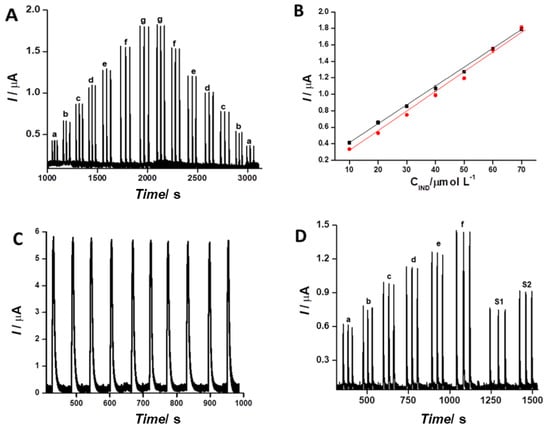
Figure 6.
(A) Analytical curves with increasing and decreasing IND concentrations ranging from (a) 10, (b) 20, (c) 30, (d) 40, (e) 50, (f) 60, (g) 70 µmol L−1. (B) Linear adjustments in the calibration curves with increasing and decreasing IND concentration. (C) Repeatability studies (n = 10) of 1.0 mmol L−1 IND. (D) Amperogram for determination of IND by the FIA system in enriched synthetic urine. Analytical curve (a) 20, (b) 30, (c) 40, (d) 50, (e) 60, (f) 70 µmol L−1, (S1) sample 1, and (S2) sample 2. Experimental conditions: 0.10 mol L−1 phosphate buffer (pH = 12), 150 µL sampling loop, flow rate 1.6 mL/min, and potential +0.20 V vs. Ag/AgCl,KCl(sat.).
3.3.3. Quantification of Indapamide in Synthetic Urine
The LTGr sensor presented good performance for the analysis of IND in the presence of a synthetic urine sample [25], as demonstrated by the amperometric responses in Figure 6D. The realization of this series of measurements required eight volumetric flasks (10.0 mL), and all of these flasks received 5.0 mL of synthetic urine with doubled concentrations, as recommended in the literature, prepared in a phosphate buffer of pH = 12 [26]. In the first six flasks, indapamide was spiked so that the final volumes obtained were 20, 30, 40, 50, 60, and 70 µmol L−1. After that, the volumes of the volumetric flasks were completed to 10.0 mL with a phosphate buffer.
In the last two volumetric flasks, the procedure was similar, and the “spiked urine” samples (30 and 40 µmol L−1) were prepared following the same procedure. The linear regression of the signals generated by the first six solutions (20 to 70 µmol L−1) followed the adjustment (Ip = 0.016 [IND] + 0.278, R2 = 0.996). The two samples of synthetic urine enriched with IND were injected at a concentration of 30 µmol L−1 (sample 1) and 40 µmol L−1 (sample 2), as illustrated in Figure 6D. The recovery was calculated at 94.5% and 94.7%, respectively. The limit of detection of 5.0 × 10⁻⁷ mol L−1 of indapamide was determined experimentally. These results indicate that the method presents a good analytical performance for the evaluation of IND in samples of clinical and doping interest [27].
The effects of interfering species were evaluated. The signal proportionated by pure IND (20 µmol L−1) was compared with solutions containing the same amount of IND plus the corresponding amount of each constituent of the synthetic urine [26]. The effect of the six inorganic salts (CaCl2.2H2O = 1.103 g L−1, NaCl = 2.025 g L−1, Na2SO4 = 2.25 g L−1, KH2PO4 = 1.40 g L−1, KCl = 1.60 g L−1, and NH4Cl = 1.00 g L−1) was small. As all of these salts are not electroactive in the studied region, the small decreases were attributed to variations in the diffusional process. In the case of urea (25.0 g L−1), a more accentuated decrease was observed (91.8%). In the case of creatinine, a small increase of 102% was observed; for glucose, an increase of 90% was observed; and for ascorbic acid, the signal had a slight decrease of 95%.
The electroanalytical performance of the device proposed in this work for determination of IND was compared to that of other sensors reported in the literature. As can be seen in Table 1, the detection limit is close to the ones obtained in studies using boron-doped, glassy carbon, and carbon paste electrodes. The limits obtained with mercury electrodes are much lower, but unfortunately, these electrodes are no longer in use in the majority of laboratories. In the present study, the LTGr device had a good electrochemical performance, and its performance was similar to the ones obtained using carbon paste and glassy carbon electrodes. BDDE and Hg electrodes presented superior performance.

Table 1.
Voltammetric studies involving the quantification of indapamide.
4. Conclusions
Laser engraving showed an effective, rapid, and convenient technique to treat graphite mines without the need for chemicals. It could eliminate non-conductive materials and less crystalline small graphite particles to improve electron transference, which was evaluated by CVs using dopamine and [Fe(CN)6]3−/4− as redox probes and EIS using [Fe(CN)6]3−/4−. The electrochemical results showed a decrease in the CV’s peak-to-peak differences and lower resistance to charge transfer. The treatment produced a rougher surface composed of crystalline particles that were characterized by Raman spectra and SEM. Using the FIA technique, the graphite mines were successfully applied to detect indapamide as a proof-of-concept in synthetic urine. Therefore, the laser treatment was shown as a green and convenient procedure to improve electrodic materials’ electrochemical performance, proving its potential to fabricate cost-effective electrodes with high performance and the potential for massive production.
Author Contributions
Conceptualization, T.G.O., W.A.A. and L.A.; methodology, T.G.O., W.A.A. and L.A.; formal analysis, T.G.O. and L.A.; investigation, T.G.O., R.S.S., I.S.L. and J.M.G.; resources, L.A. and H.E.T.; data curation, T.G.O., I.S.L., R.S.S. and J.M.G.; writing—T.G.O., W.A.A., J.M.G. and L.A.; writing—review and editing, L.A. and H.E.T.; supervision, L.A.; project administration, L.A.; funding acquisition, L.A. and H.E.T. All authors have read and agreed to the published version of the manuscript.
Funding
This research was supported by São Paulo Research Foundation—FAPESP (grant numbers: 2014/50867-3, 2019/22126-2, 2018/16896-7, 2017/13137-5 and 2022/04127-4), and from to the National Council for Research—CNPq (processes 311847-2018-8, 465389/2014-7, 305247/2022-0, and 131305/2021-2).
Institutional Review Board Statement
Not applicable.
Informed Consent Statement
Not applicable.
Data Availability Statement
The data reported in this paper are available from the corresponding author upon request.
Acknowledgments
The authors are also grateful to Fabio Rodrigues and Evandro Pereira da Silva for the Raman spectroscopy measurements.
Conflicts of Interest
All authors declare they have no conflict of interest.
References
- Ameku, W.A.; Negahdary, M.; Lima, I.S.; Santos, B.G.; Oliveira, T.G.; Paixão, T.R.L.C.; Angnes, L. Laser-Scribed Graphene-Based Electrochemical Sensors: A Review. Chemosensors 2022, 10, 505. [Google Scholar] [CrossRef]
- Mendes, L.F.; Pradela-Filho, L.A.; Paixão, T.R.L.C. Polyimide Adhesive Tapes as a Versatile and Disposable Substrate to Produce CO2 Laser-Induced Carbon Sensors for Batch and Microfluidic Analysis. Microchem. J. 2022, 182, 107893. [Google Scholar] [CrossRef]
- Kavai, M.S.; de Lima, L.F.; de Araujo, W.R. A Disposable and Low-Cost Laser-Scribed Graphene Electrochemical Sensor for Simultaneous Detection of Hydroquinone, Paracetamol and Methylparaben. Mater. Lett. 2023, 330, 133211. [Google Scholar] [CrossRef]
- Devi, M.; Wang, H.; Moon, S.; Sharma, S.; Volker Strauss, V. Laser-Carbonization—A Powerful Tool for Micro-Fabrication of Patterned Electronic Carbons. Adv. Mater. 2023, 35, 2211054. [Google Scholar]
- Richter, E.M.; Rocha, D.P.; Cardoso, R.M.; Keefe, E.M.; Foster, C.W.; Munoz, R.A.A.; Banks, C.E. Complete Additively Manufactured (3D-Printed) Electrochemical Sensing Platform. Anal. Chem. 2019, 91, 12844–12851. [Google Scholar] [CrossRef] [PubMed]
- Murilo Santhiago, M.; Strauss, M.; Pereira, M.P.; Chagas, A.S.; Bufon, C.C.B. Direct Drawing Method of Graphite onto Paper for High-Performance Flexible Electrochemical Sensors. ACS Appl. Mater. Interfaces 2017, 9, 11959–11966. [Google Scholar] [CrossRef] [PubMed]
- Alba, A.F.; Totoricaguena-Gorriño, J.; Sánchez-Ilárduya, M.B.; Ruiz-Rubio, L.; Vilas-Vilela, J.L.; Lanceros-Méndez, S.; del Campo, F.J. Laser-Activated Screen-Printed Carbon Electrodes for Enhanced Dopamine Determination in the Presence of Ascorbic and Uric Acid. Electrochim. Acta 2021, 399, 139374. [Google Scholar] [CrossRef]
- Kaneko, S.; Shimizu, Y.; Rachi, T.; Kato, C.; Tanaka, S.; Naganuma, Y.; Katakura, T.; Satoh, K.; Ushiyama, M.; Konuma, S.; et al. Multigraphene Growth on Lead-Pencil Drawn Sliver Halide Print Paper Irradiated by Scanning Femtosecond Laser. Jpn. J. Appl. Phys. 2015, 55, 01AE24. [Google Scholar] [CrossRef]
- Annu; Sharma, S.; Jain, R.; Raja, A.N. Review—Pencil Graphite Electrode: An Emerging Sensing Material. J. Electrochem. Soc. 2019, 167, 037501. [Google Scholar] [CrossRef]
- David, I.G.; Popa, D.-E.; Buleandra, M. Pencil Graphite Electrodes: A Versatile Tool in Electroanalysis. J. Anal. Methods Chem. 2017, 2017, e1905968. [Google Scholar] [CrossRef]
- Ameku, W.A.; Ataide, V.N.; Costa, E.T.; Gomes, L.R.; Napoleão-Pêgo, P.; William Provance, D.; Paixão, T.R.L.C.; Salles, M.O.; De-Simone, S.G. A Pencil-Lead Immunosensor for the Rapid Electrochemical Measurement of Anti-Diphtheria Toxin Antibodies. Biosensors 2021, 11, 489. [Google Scholar] [CrossRef]
- Bataillard, A.; Schiavi, P.; Sassard, J. Pharmacological Properties of Indapamide. Clin Pharmacok. 1999, 37, 7–12. [Google Scholar] [CrossRef] [PubMed]
- Chaffman, M.; Heel, R.C.; Brogden, R.N.; Speight, T.M.; Avery, G.S. Indapamide. A Review of Its Pharmacodynamic Properties and Therapeutic Efficacy in Hypertension. Drugs 1984, 28, 189–235. [Google Scholar] [CrossRef] [PubMed]
- Cadwallader, A.B.; De La Torre, X.; Tieri, A.; Botrè, F. The Abuse of Diuretics as Performance-Enhancing Drugs and Masking Agents in Sport Doping: Pharmacology, Toxicology and Analysis. Brit. J. Pharm. 2010, 161, 1–16. [Google Scholar] [CrossRef] [PubMed]
- Dossi, N.; Toniolo, R.; Piccin, E.; Susmel, S.; Pizzariello, A.; Bontempelli, G. Pencil-Drawn Dual Electrode Detectors to Discriminate Between Analytes Comigrating on Paper-Based Fluidic Devices but Undergoing Electrochemical Processes with Different Reversibility. Electroanalysis 2013, 25, 2515–2522. [Google Scholar] [CrossRef]
- Akanda, M.R.; Sohail, M.; Aziz, M.A.; Kawde, A.N. Recent Advances in Nanomaterial-Modified Pencil Graphite Electrodes for Electroanalysis. Electroanalysis 2016, 28, 408–424. [Google Scholar] [CrossRef]
- Stradolini, F.; Kilic, T.; Di Consiglio, A.; Ozsoz, M.; De Micheli, G.; Carrara, S. Long-Term Monitoring of Propofol and Fouling Effect on Pencil Graphite Electrodes. Electroanalysis 2018, 30, 1363–1369. [Google Scholar] [CrossRef]
- Shahzadi, M.; Nisar, S.; Kim, D.-K.; Sarwar, N.; Rasheed, A.; Ahmad, W.; Afzal, A.M.; Imran, M.; Assiri, M.A.; Shahzad, Z.M.; et al. Highly Efficient, Non-Covalent Functionalization of CVD-Graphene via Novel Pyrene-Based Supporter Construct. Chemosensors 2023, 11, 83. [Google Scholar] [CrossRef]
- Celiešiūtė, R.; Trusovas, R.; Niaura, G.; Švedas, V.; Račiukaitis, G.; Ruželė, Ž.; Pauliukaite, R. Influence of the Laser Irradiation on the Electrochemical and Spectroscopic Peculiarities of Graphene-Chitosan Composite Film. Electrochim. Acta 2014, 132, 265–276. [Google Scholar] [CrossRef]
- Li, Z.; Li, K.; Wang, S.; Teng, C. Covalent Patterning of Graphene for Controllable Functionalization from Microscale to Nanoscale: A Mini-Review. Front. Chem. 2022, 10, 829614. [Google Scholar] [CrossRef]
- Kim, J.; Ahn, D.; Sun, J.; Park, S.; Cho, Y.; Park, S.; Ha, S.; Ahn, S.; Kim, Y.A.; Park, J.-J. Vertically and Horizontally Drawing Formation of Graphite Pencil Electrodes on Paper by Frictional Sliding for a Disposable and Foldable Electronic Device. ACS Omega 2021, 6, 1960–1970. [Google Scholar] [CrossRef]
- Lenner, M.; Kaplan, A.; Huchon, C.; Palmer, R.E. Ultrafast Laser Ablation of Graphite. Phys. Rev. B 2009, 79, 184105. [Google Scholar] [CrossRef]
- Sokolov, D.A.; Shepperd, K.R.; Orlando, T.M. Formation of Graphene Features from Direct Laser-Induced Reduction of Graphite Oxide. J. Phys. Chem. Lett. 2010, 1, 2633–2636. [Google Scholar] [CrossRef]
- Pedrotti, J.J.; Angnes, L.; Gutz, I.G.R. Miniaturized Reference Electrodes with Microporous Polymer Junctions. Electroanalysis 1996, 8, 673–675. [Google Scholar] [CrossRef]
- Legorburu, M.J.; Alonso, R.M.; Jiménez, R.M. Electrochemical Oxidation of the Diuretic Indapamide. Electroanalysis 1996, 8, 280–284. [Google Scholar] [CrossRef]
- Laube, N.; Mohr, B.; Hesse, A. Laser-Probe-Based Investigation of the Evolution of Particle Size Distributions of Calcium Oxalate Particles Formed in Artificial Urines. J. C. Grow. 2001, 233, 367–374. [Google Scholar] [CrossRef]
- Oliveira, T.G.; Santos, B.G.; Gonçalves, J.M.; Angnes, L. Amperometric Detection of Indapamide on Glassy Carbon Electrode. Electroanalysis 2023, 35, e202200441. [Google Scholar] [CrossRef]
- Salamanca-Neto, C.A.R.; Yoshida, F.A.; Sartori, E.R.; Moraes, J.T. Boron-Doped Diamond Electrode: A Modification-Free Platform for Sensitive Square-Wave Voltammetric Determination of Indapamide Hydrochloride. Anal. Methods 2018, 10, 3347–3352. [Google Scholar] [CrossRef]
- Radi, A.-E.; Eissa, S. Electrochemical Study of Indapamide and Its Complexation with β-Cyclodextrin. J. Incl. Phenom. Macrocycl. Chem. 2011, 71, 95–102. [Google Scholar] [CrossRef]
- Radi, A. Stripping Voltammetric Determination of Indapamide in Serum at Castor Oil-Based Carbon Paste Electrodes. J. Pharm. Biom. Anal. 2001, 24, 413–419. [Google Scholar] [CrossRef]
- Radi, A. Adsorptive Cathodic Stripping Voltammetric Determination of Indapamide as Copper Complex at a Hanging Mercury Drop Electrode. Chem. Anal. 2003, 48, 273–281. [Google Scholar]
Disclaimer/Publisher’s Note: The statements, opinions and data contained in all publications are solely those of the individual author(s) and contributor(s) and not of MDPI and/or the editor(s). MDPI and/or the editor(s) disclaim responsibility for any injury to people or property resulting from any ideas, methods, instructions or products referred to in the content. |
© 2023 by the authors. Licensee MDPI, Basel, Switzerland. This article is an open access article distributed under the terms and conditions of the Creative Commons Attribution (CC BY) license (https://creativecommons.org/licenses/by/4.0/).