Abstract
The carbon quantum dot (CQD) paper-based analytical device (PAD) has drawn great attention and is being intensively explored. However, the construction of a continuous flow CQD synthesis device remains challenging. In this work, a continuous flow reaction apparatus was constructed to synthesize nitrogen-doped CQDs using a mixed-solvent system of tetraethylene glycol and water. The optical properties of the CQDs were characterized. The CQDs were found to be quenched by phenolics such as chlorogenic acid, salvianolic acid B, and rutin. The CQD PAD was prepared for the determination of the total phenolic content of honeysuckle extracts. A smartphone was used to test the analytical performance of the CQD PAD. The results demonstrated that the degree of fluorescence quenching of the CQDs showed a linear relationship with the concentration of the added chlorogenic acid solution. This method was compared with the total phenolic assay in the Chinese Pharmacopoeia, and the statistical test showed no significant difference between their results. With aqueous tetraethylene glycol as the solvent for the synthesis, the continuous flow reactor for CQD preparation could be easily set up. The CQD PAD is convenient, cheap, and expected to be used for the rapid quality detection of traditional Chinese medicines.
1. Introduction
In the last two decades, an important development trend in the quality control of traditional Chinese medicines (TCMs) has been the determination of TCM quality from a holistic perspective. Fingerprint techniques can reflect the overall characteristics of TCM and were used in the 2020 edition of the Chinese Pharmacopoeia Vol. 1 [1]. Bioassays can also evaluate the quality of TCM as a whole [2]. A typical example is the detection of leech quality by antithrombin activity, which was also elaborated in the 2020 edition of the Chinese Pharmacopoeia Vol. 1 [3]. Indicators such as total solids, total flavonoids, total saponins, and total phenolic acids were all used in the Chinese Pharmacopoeia Vol. 1 to characterize the overall quality of TCM from a holistic perspective.
Another trend in the quality control of TCM is the lowering of the testing cost. The quantitative analysis of multi-components by a single marker can effectively reduce the cost of chemical reference substances in TCM quality testing [4,5]. The Chinese medicine quality marker (Q-Marker) proposed by Liu et al. can reflect the quality of TCM comprehensively. The Q-Marker reduces the number of chemical components measured, thus reducing the cost of testing [6]. A TCM reference drug has been proposed as a new form of the TCM reference substance [7], which can reduce the cost of the reference substance. Overall, there is still a need to develop low-cost and holistic quality testing techniques for TCM.
Carbon quantum dots (CQDs) is a kind of carbon nanomaterial, the size of which is generally less than 10 nm. CQDs have the advantages of requiring a simple synthesis method as well as of being low-cost and having a large source of synthetic raw materials. It is widely used in biomedicines [8], optoelectronics [9,10], photocatalysis [11,12], sensing [13,14,15,16], environmental monitoring [17,18], and other fields. Sinduja et al. [19] used asparagine as the carbon source in synthesizing CQDs with the pyrolysis method, which can be used for the quantitative detection of rutin. Rao et al. [20] designed a continuous flow microreactor for the preparation of CQDs, which has the advantages of fast synthesis and the instant adjustment of reaction conditions. The hydrothermal synthesis method is a convenient method used to prepare CQDs. However, the synthesis temperature of CQDs can significantly exceed the boiling point of water. Therefore, the construction of a continuous flow CQD synthesis device generally requires the control of the reaction pressure, which increases the difficulty of setting up the device.
Since the paper-based analytical device (PAD) technology was first proposed by Whitesides’ group in 2007, PAD technology has been widely used in various fields such as environmental monitoring, medical diagnosis, and food safety [21]. Currently, modified paper can be obtained by various methods such as wax printing [22,23], inkjet printing [24], screen printing [25,26], photolithography [27], and 3D printing [28]. The main methods for detecting PAD results are the colorimetric [29,30], fluorescence [31], electrochemical [32], and chemiluminescence methods [33]. Overall, PAD technology is easy to operate and does not require a high level of expertise from the operator. The detection results can be used with portable devices such as smartphones. There are numerous processing and fabrication methods for PADs that can meet different analytical needs. The PAD itself is lightweight and easy to carry and can meet the need for immediate and rapid testing. Therefore, the use of PAD technology has the potential to achieve a rapid and cost-effective detection of TCM quality.
In this work, a continuous flow reaction device was set up to synthesize CQDs using a mixed-solvent system of tetraethylene glycol and water. The synthesized conditions were optimized. The optical properties of CQDs were characterized, and CQDs were found to be quenched by a variety of phenolic compounds. Then, a PAD-loading CQD was prepared, and a smart phone was used to test the analytical performance of the PAD. Finally, the PAD loading CQD was used to detect the total phenolic content of honeysuckle extracts.
2. Materials and Methods
2.1. Chemicals
Citric acid monohydrate (C6H8O7·H2O, ≥99.5%), sulfuric acid (H2SO4, 95.0~98.0%), and sodium carbonate (Na2CO3, ≥99.8%) were purchased from Sinopharm Chemical Reagent Co., Ltd. (Shanghai, China) Ethylenediamine (C2H8N2, >99%) was purchased from Shanghai Aladdin Biochemical Technology Co., Ltd. (Shanghai, China) Tetraethylene glycol (C8H18O5, ≥99%) and quinine sulfate (≥99%) were purchased from Shanghai Macklin Biochemical Co., Ltd. (Shanghai, China) Ammonia (NH3·H2O, 25~28%) was purchased from Hangzhou Longshan Fine Chemical Co., Ltd. (Hangzhou, China) D-Glucose (>99.8%) was purchased from Shanghai Shenggong Bioengineering Co., Ltd. (Shanghai, China) Chlorogenic acid (Lot 180529, >99%), caffeic acid (Lot 150413, ≥99%), salvianolic acid B (Lot 180906, ≥98%), salvinorin sodium (Lot 140507, ≥99%), rutin (Lot 180623, >99%), puerarin (Lot 160429, >99%), panaxoside R1 (Lot 140722, ≥99%), ginsenoside Rd (Lot 140719, ≥98%), and sinomenine (Lot 180324, ≥99%) were purchased from Shanghai Ronghe Pharmaceutical Technology Co., Ltd. (Shanghai, China) Deionized water was prepared by an ultra-pure water system (Milli-Q, Millipore, Massachusetts, Germany).
2.2. Synthesis of Carbon Quantum Dots
2.2.1. CQD Synthesis Experiment
A schematic diagram of the continuous flow reactor is shown in Figure 1, which includes a raw material bottle, an advection pump (2PB3020II, Beijing Star Technology Development Co., Ltd., Beijing, China), coils, a constant temperature oil bath (ZCY-15B, Ningbo Tianheng Instrument Factory, Ningbo, China), and a CQD collection bottle. A citric acid solution and an ethylenediamine solution were used as synthetic raw materials. They were mixed in the raw material bottle with a certain mass ratio under stirring. The raw material solution was fed into the heating coil using the advection pump. The heating coil was placed in the oil bath. The raw material solution was heated and reacted after passing through the heating coil. The cooling coil was immersed in an ice–water mixture. After the reaction, the mixed solution entered the cooling coil and the CQDs were collected. The coils were made from stainless steel, and their dimensions were as follows: 140 mm for the outer diameter of the coil winding, 34 turns of dense winding, 4 mm for the outer diameter, and 1 mm for the inner diameter.
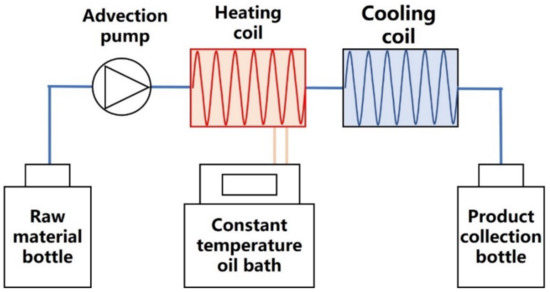
Figure 1.
Schematic diagram of continuous flow reactor.
2.2.2. Performance Characterization of CQD
The cation exchange resin (001 × 7, Cangzhou Boen Adsorption Material Technology Co., Ltd., Cangzhou, China) was used to adsorb CQDs in an aqueous tetraethylene glycol solution. The cation exchange resin was eluted with a mixture of ethanol and aqueous ammonia (v:v = 1:1). The eluate was dried until it was odorless. After that, the dry matter was dissolved with the use of deionized water. The solution containing CQDs was dialyzed through a dialysis membrane (retention capacity of 300 Da) in a deionized water batch for 24 h. The CQDs was obtained by drying the dialyzed solution.
The morphology of the synthesized CQDs was characterized by transmission electron microscopy (JEM-1200EX, Japan Electronics Co., Ltd., Tokyo, Japan). The elemental composition was detected by X-ray photoelectron spectroscopy (ESCALAB 250Xi, Thermo Fisher Scientific, Waltham, MA, USA). The UV-visible absorption and fluorescence spectra of the CQDs were obtained with a multifunctional continuous wavelength microplate reader (M1000, Tecan, Hombrechtikon, Swiss Confederation).
The concentration of each reference substance solution (chlorogenic acid, salvinorin sodium, salvianolic acid B, caffeic acid, rutin, puerarin, glucose, panaxoside R1, ginsenoside Rd, and sinomenine) was diluted to 0.1 M. A total of 50 μL of the diluted reference substance solution and 50 μL of the synthesized CQD solution were separately added and mixed in a 96-well plate. The fluorescence intensity was measured using a microplate reader, and the result was recorded as A1. The fluorescence intensity of the mixture of the 50 μL CQD solution and the 50 μL solvent used for the reference substance was recorded as A2. The fluorescence intensity of the mixture of the 50 μL aqueous tetraethylene glycol solution and the 50 μL solvent used for the reference substance was recorded as A0. The final fluorescence intensity was calculated with Equation (1) to compare the selectivity.
The concentrations of the chlorogenic acid reference substance solution was diluted to 1.6, 1.2, 0.8, 0.4, and 0.2 mg/mL. A total of 50 μL of the diluted chlorogenic acid solution and deionized water were added to a 96-well plate, and then 50 μL of the CQD solution was added and mixed. The fluorescence intensity was subsequently measured.
Sulfuric acid was weighed, deionized water was added, and 0.050 mol/mL sulfuric acid solution was prepared. Quinine sulfate was weighed, the prepared sulfuric acid solution was added, and 0.070 mg/mL quinine sulfate solution was prepared.
2.2.3. Optimization of CQD Preparation Conditions
After obtaining the CQDs, the fluorescence quantum yield was obtained. The fluorescence quantum yield was calculated as shown in Equation (2).
where F refers to the integrated fluorescence intensity; η refers to the refractive index; the subscripts S and R refer to the sample and reference, respectively. The quinine sulfate solution prepared in Section 2.2.2 was used as a reference sample.
In Table S1 of the Supplementary Materials, five different parameters were optimized using a deterministic screening experimental design, including the heating temperature (X1), solution flow rate (X2), raw material content (total mass fraction of ethylenediamine and citric acid in the mixed solution, X3), ethylenediamine content (mass fraction of ethylenediamine in the total weight of ethylenediamine and citric acid, X4), and tetraethylene glycol content (mass fraction of tetraethylene glycol in the solvent consisting of tetraethylene glycol and water, X5). The experimental design was carried out using Design Expert (V10.0.4, Stat-Ease, Minneapolis, MN, USA). The fluorescence quantum yield was regarded as the optimization target. Three dummy factors were added to the experimental design, which comprised a total of 17 experiments. The experimental factors and corresponding levels are shown in Table S2 of the Supplementary Materials.
A quantitative model was developed between the fluorescence quantum yield and the factors using Equation (3).
where Xi is the coded variable, Y is the fluorescence quantum yield, b0 is the constant term, bi is a regression coefficient of the primary term, bii is a regression coefficient of the quadratic term, and bij is a regression coefficient of the interaction term. A stepwise regression was used to simplify the equation. The p-values for adding or removing a model term was set to 0.10. Statistical analysis was performed using Design Expert.
To optimize the preparation conditions for the CQDs, the design space of the preparation conditions were calculated with a high probability of achieving the standard. The probability was calculated using the Monte Carlo method [34]. The coded values of each parameter were used in the calculation. The step size was 0.02. The simulation was repeated 5000 times. The minimum acceptable probability was 0.90.
2.2.4. Preparation of PAD
Honeysuckle extract: 5 g of honeysuckle and 100 mL of purified water were put in a conical flask. The conical flask was put in a water bath at 70 °C and heated for 1 h. The honeysuckle extract was collected.
Chlorogenic acid reference substance solution: 40.0 mg of chlorogenic acid reference substance was put in a 25 mL volumetric flask. Purified water was used to dissolve the reference substance to a certain volume. After shaking well, the standard solution of chlorogenic acid was obtained.
Sodium carbonate solution: 29 g of sodium carbonate and 100 mL of purified water were put in a conical flask. After dissolution under ultrasonification, the sodium carbonate solution was obtained.
The mold was designed using 3D Builder software (v2018, Microsoft, Redmond, WA, USA). Polylactic acid (PLA) was used as the printing material. The mold was printed using a 3D printer (Einstart-S, Hangzhou Xianlin 3D Technology Co., Ltd., Hangzhou, China). The finished mold designed to hold the square PAD is shown in Figure 2; the top edge of the square hole was 1.5 cm and the bottom edge was 1.0 cm.
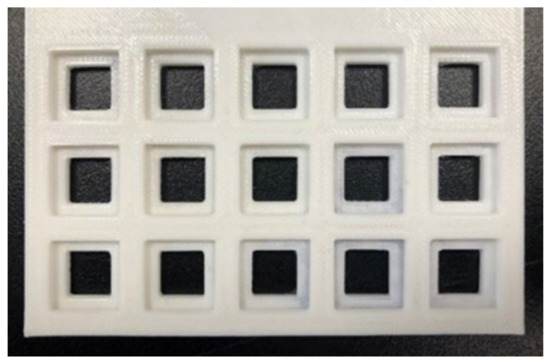
Figure 2.
PLA mold to hold the PAD.
Silhouette Studio (Silhouette, Lindon, UT, USA) was used to form the paper cutting path. Chromatographic paper was cut into 1.2 cm squares with the use of a cutting plotter (CAMEO 3, Silhouette, Lindon, UT, USA). In order to control the amount of CQD on each sheet of paper, 25 μL of the CQD solution synthesized in Section 2.1 was accurately taken with a pipette and added dropwise onto the sheet. After drying for 1 h, a PAD loaded with CQDs was obtained.
The square piece of paper that was loaded with CQD was placed on the PLA mold and then irradiated with UV light at a wavelength of 365 nm. In Figure 3, the three pieces of CQD paper on the left side of the bottom row showed blue-green fluorescence, while the two ordinary pieces of paper on the right side showed no fluorescence.
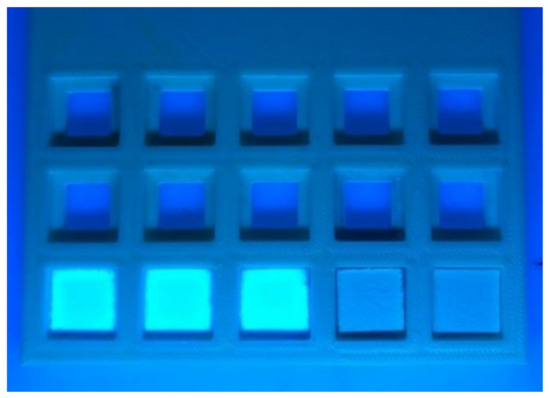
Figure 3.
The mold containing CQD paper and ordinary paper.
2.2.5. Color Data Collection and Analysis
The chlorogenic acid solution was diluted to 0.200, 0.400, 0.800, 1.20, and 1.60 mg/mL. The paper loaded with CQDs was placed in the square hole of the mold. A total of 25 μL of different concentrations of the chlorogenic acid solution were added dropwise onto the paper and dried in a dark place for 30 min. The mold was placed in a 3D-printed color detection box, as shown in Figure 4. Two UV lamps inside were used as the excitation light sources, and the wavelength of UV light was 365 nm. When reading the data, a smartphone (P0, Huawei Technologies Co., Ltd., Shenzhen, China) was placed on the color pickup box to read the color data with an app by Color Grab (v 3.3.0, Loomatix, Munchen, Germany). Multiple fluorescence color results were collected, including grayness, brightness, and color components of R, G, B, C, M, Y, and K. The corresponding color results of a piece of paper without CQDs were also obtained as a blank. The fluorescence color results of the PAD were calculated using Equation (4).
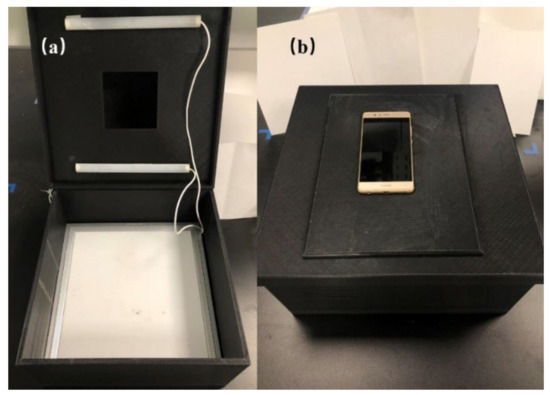
Figure 4.
The 3D-printed color detection box. (a) Internal structure of device; (b) The box worked with the phone.
2.2.6. Total Phenolic Compound Determination with PAD
The honeysuckle extract was diluted to different dilution solutions. The PADs were placed in the square holes of the mold. In total, 25 μL of the extracts at different dilutions were added dropwise to the PADs and then dried in a dark and dry place for 30 min. The mold was placed in the color detection box, the power of the two UV lamps was turned on, and the color data were read using the smartphone. The color data of the PADs and the pure paper chips with purified water added dropwise were obtained at the same time to calculate the corresponding color results. Different concentrations of chlorogenic acid solutions were used as the reference substance solution to produce standard curves between the color detection results and the chlorogenic acid concentrations. The fluorescence quenching ability of the honeysuckle extracts on the CQDs were characterized by chlorogenic acid equivalents.
A total of 2.5 mL of chlorogenic acid solution was precisely measured and put in a 25 mL brown volumetric flask. Deionized water was used to dilute it to scale. After shaking well, the chlorogenic acid solution with a concentration of 0.160 mg/mL was obtained. Precisely measured amounts of the diluted solution at 0.5, 1.0, 2.0, 3.0, 4.0, and 5.0 mL were put in a 25 mL brown volumetric flask. A total of 1 mL of the phosphorus molybdenum tungsten acid test solution was added to each flask, and 11.5, 11.0, 10.0, 9.0, 8.0, and 7.0 mL of purified water were respectively added. Sodium carbonate solution was used to dilute the solutions to scale. After shaking well, different concentrations of the chlorogenic acid solution were obtained. The absorbance of the chlorogenic acid solution was measured under UV light at 760 nm, with deionized water as blank, after 30 min. A total of 0.4, 0.3, 0.2, and 0.1 mL of the honeysuckle extract solutions were put in 25 mL brown volumetric flasks. The total phenolic content of the honeysuckle extract was characterized by the chlorogenic acid concentration equivalent according to the standard curve.
2.2.7. Methodological Experiment
Linearity experiments: 25 μL of different concentrations of the chlorogenic acid solutions were added dropwise onto the PAD. A standard curve was made, with the color result ratio as the vertical coordinate and the chlorogenic acid concentration as the horizontal coordinate. The linear regression equation was fitted. The limit of detection (LOD) and limit of quantification (LOQ) were calculated with Equations (5) and (6), respectively.
Repeatability experiments: 25 μL of the diluted honeysuckle extract was added to the PAD. A total of 6 extracts were prepared from the same batch of honeysuckle. The standard curve was created with chlorogenic acid as the reference substance, and the chlorogenic acid concentration equivalents of the honeysuckle extract were calculated. The mean chlorogenic acid concentration equivalents of the honeysuckle extract and their relative standard deviation (RSD) values were calculated.
Inter-day precision experiments: 25 μL of the diluted honeysuckle extract was added to the PAD. Three sets of experiments were repeated. The test was repeated for 6 consecutive days. The mean chlorogenic acid concentration equivalents of the honeysuckle extract and their RSD values were calculated.
Recovery experiments: 9 samples of the honeysuckle extracts with known chlorogenic acid concentration equivalents were taken and divided into 3 groups according to different concentrations. The ratios of the amount of chlorogenic acid added to the samples to be tested were controlled at 1.5:1.0, 1.0:1.0, and 0.5:1.0. A total of 3 samples were prepared in parallel at each concentration level for the color results. The mean recoveries of the different groups and their RSD values were calculated.
3. Results
3.1. Characterization of CQDs
The CQDs were prepared at a synthesis temperature of 160 °C, a solution flow rate of 3 mL/min, raw material content of 5%, ethylenediamine content of 50%, and tetraethylene glycol content of 50%. The results of the electron transmission microscopy are shown in Figure 5, which shows a uniformly dispersed black spherical material with a particle size of about 10 nm.
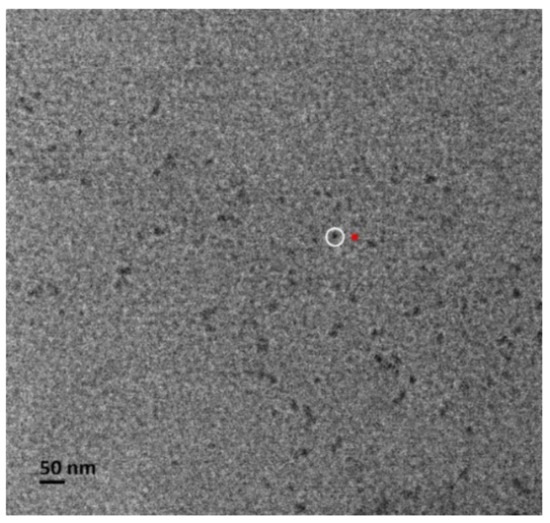
Figure 5.
Transmission electron microscope image of CQDs. The diameter of the red dot in the figure is about 10 nm, which is similar to the size of the carbon quantum dot marked by the white circle.
X-ray photoelectron spectroscopy (XPS) was used to analyze the CQDs. The full spectrum analysis results are shown in Figure 6a, which includes the six elements of Na, O, N, C, S, and Si. The elements of the CQDs include C, N, and O. The full spectrum analysis of the CQDs showed three peaks at 531.08, 399.08, and 284.08 eV, corresponding to O1s, N1s, and C1s, respectively. Figure 6b shows the high-resolution spectrum of the C1s of the CQDs, with the separable peaks of 287.96, 284.88, and 284.30 eV corresponding to C-C, C-N, and N-C=O, respectively. Figure 6c shows the high-resolution spectrum of the N1s of the CQDs, with the separable peaks of 399.88 and 398.86 eV corresponding to C-N-C and N-H, respectively. It is clear from the XPS data that the CQDs were successfully doped with nitrogen atoms in the synthesis, and that the citric acid and ethylenediamine may be combined by amide bonds.
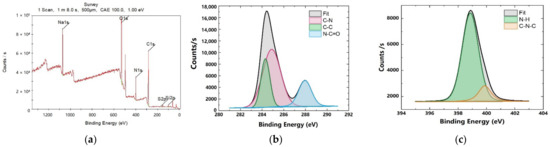
Figure 6.
XPS analysis results of CQDs. (a) XPS full spectrum of CQDs; (b) C1s spectrum of CQDs; (c) N1s spectrum of CQDs.
The fluorescence spectra of the CQDs are shown in Figure 7. It can be seen that the optimal excitation wavelength λex was 375 nm and the optimal emission wavelength λem was 450 nm. In Figure 7b, the fluorescence intensity of the CQDs increased first and then decreased with the increase of the excitation wavelength. When the excitation wavelength was 375 nm, the fluorescence intensity reached the maximum.
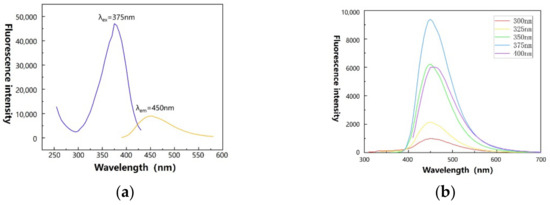
Figure 7.
Fluorescence spectrum of CQDs. (a) Optimal fluorescence excitation spectrum and fluorescence emission spectrum; (b) Fluorescence emission spectra at different excitation wavelengths (300–400 nm).
Figure 8 shows the states of the CQDs under daylight and UV light at 365 nm, respectively. The CQD solution was light yellow under daylight but showed blue-green fluorescence under UV light.
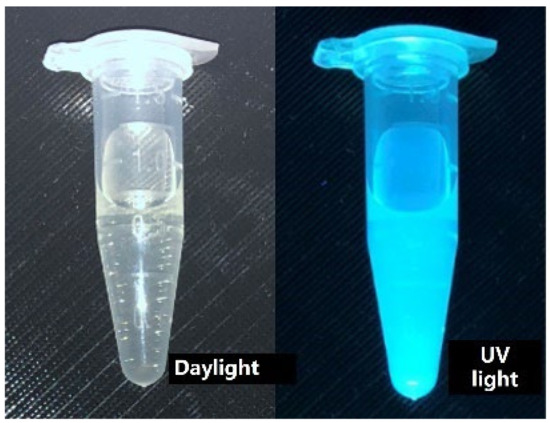
Figure 8.
Photographs of the CQDs in daylight and UV light (365 nm).
3.2. Optimization of CQD Preparation Conditions
Definitive screening designed experiments were conducted to investigate five synthesis parameters, including heating temperature, solution flow rate, raw material content, ethylenediamine content, and tetraethylene glycol content. The experimental results are shown in Table S2. A quantitative mathematical model between the fluorescence yield and each parameter was established by Equation (3). The result was Y = 34.13 + 2.31X1 − 2.55X2 + 5.65X5 − 12.54X12 − 9.38X22. The R2 of the model was 0.7715, which means that the model can explain most of the data variation. In Figure S1a, the moderate heating temperature and the solution flow rate led to the best fluorescence yield of the synthesized CQDs. In Figure S1b, the fluorescence yield increased as the tetraethylene glycol content increased. A higher tetraethylene glycol content was able to reduce the evaporation of water in the tube, which was beneficial to the synthesis and efflux of the CQDs.
In order to calculate the design space of the synthesis process, fluorescence yield was set as the optimization target. The upper limit of the fluorescence yield was 100%, while the lower limit was 25%. Fixing the raw material content to 5% (X3 = −1), the content of ethylenediamine to 50% (X4 = −1), and the minimum acceptable probability of reaching the target to 0.90, the design space was calculated, as shown in Figure 9a. Experimental conditions inside (Method A, Figure 9b) and outside (Method B, Figure 9c) the space was selected for the validation experiment. The experimental conditions are shown in Table 1 and Figure 9b,c. The validation results are shown in Table 1. The measured values of the model were close to the predicted values, which means the prediction performance of the model was good. The result of Method A was within the target range, but that of Method B was outside the range, which indicates that the design space was reliable.
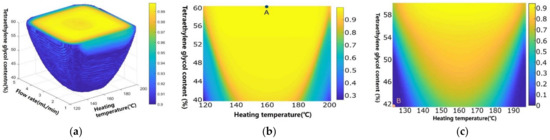
Figure 9.
Design space and the verification of experimental conditions. Different colors in the figure indicate different probabilities of reaching the design space, and the colored bar indicates the probability values. (a) Raw material content = 5%, ethylenediamine content = 50%; (b) Raw material content = 5%, ethylenediamine content = 50%, flow rate = 3 mL/min; (c) Raw material content = 5%, ethylenediamine content = 50%, flow rate = 1 mL/min.

Table 1.
Experimental validation conditions and results.
Considering the cost of the method and the requirement for high fluorescence yield CQDs, the following combinations of parameters were chosen as the conditions for the subsequent synthesis experiments: heating temperature of 160 °C, solution flow rate of 3 mL/min, raw material content of 5%, ethylenediamine content of 50%, and tetraethylene glycol content of 60%.
3.3. The Selectivity of Quenching of CQDs
The results of the change of CQD fluorescence intensity after adding different reference substances are shown in Figure 10. Some reference substances of chlorogenic acid, salvianolic acid B, and rutin significantly quenched the CQD fluorescence. Chlorogenic acid, salvianolic acid B, and rutin all have a polyhydroxy benzene ring, a carbon–carbon double bond, and a carbonyl group, as shown in Figure 11. Considering that chlorogenic acid and rutin are index components of some medicinal materials, the CQDs were regarded as a potential detector for TCM quality control.
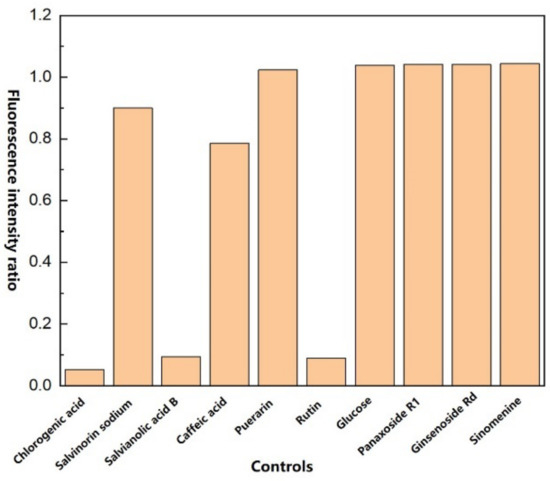
Figure 10.
Fluorescence intensity ratio of CQDs with different reference substances added.

Figure 11.
Structure of several reference substances. (a) Chlorogenic acid; (b) Salvianolic acid B; (c) Rutin; (d) Caffeic acid.
The results of the change of CQD fluorescence intensity were calculated after adding different concentrations of chlorogenic acid, as shown in Figure 12. The formula for the calculation of the fluorescence intensity ratio is shown in Equation (7).
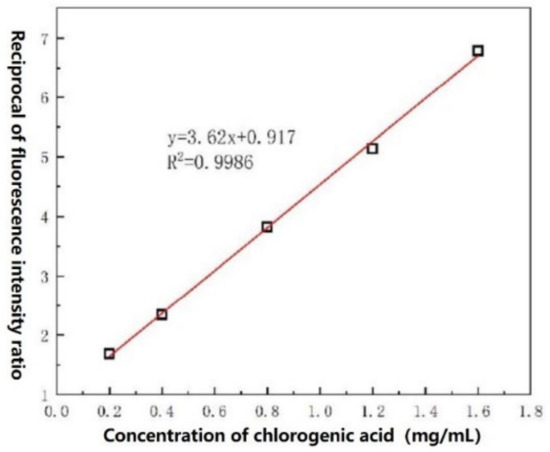
Figure 12.
Fluorescence intensity ratio of CQDs after adding different concentrations of chlorogenic acid.
With the increase in concentration of the added chlorogenic acid, the fluorescence intensity of the CQDs decreased and the fluorescence intensity ratio increased. As shown in Figure 12, the chlorogenic acid concentration range was 0.200–1.60 mg/mL, and the fluorescence intensity ratio was linearly related to the chlorogenic acid concentration, with an R2 of 0.9986. Its LOD was 0.255 mg/mL. Therefore, the CQDs have the potential to detect the concentration of chlorogenic acid in real samples.
3.4. Color Component Selection
As shown in Figure 13a, the PAD showed blue-green fluorescence under 365 nm UV light. The fluorescence brightness decreased as the chlorogenic acid solution concentration increased. The results of various color indices obtained by adding chlorogenic acid solutions onto the PAD are shown in Figure 13b. Color component G, color component M, grayness, and brightness decreased as the chlorogenic acid concentration increased. Linear fitting was applied. The slope, R2, and LOD were calculated and are shown in Table 2. All the R2 values were higher than 0.97, indicating good linearity. The color component G was selected as the detection color index for the subsequent experiments because its LOD was the lowest.
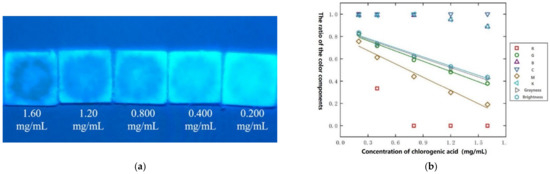
Figure 13.
Comparison of two modified filter paper preparation methods. (a) PAD after adding different concentrations of the chlorogenic acid solution. The numbers in the graph are the concentrations of the added chlorogenic acid solution; (b) Relationship between the results for the ratio of different color components and the chlorogenic acid concentration.
Table 2.
Slope, R2, and detection limit obtained by fitting the four-color parameters.
3.5. Comparison with Traditional Methods
The dilutions of the honeysuckle extract were 2.0, 2.5, 4.0, and 10.0 times, respectively. The color results of different dilutions added to the PAD are shown in Figure 14. As the dilution of the honeysuckle extract increased, the quenching effect of the extract on the CQDs weakened. The total phenolic content of the honeysuckle extracts at different dilutions was also determined using the total phenolic assay of the tannin content assay in the Chinese Pharmacopoeia Vol. 4, with chlorogenic acid as the reference substance. The results obtained by the two methods were converted into chlorogenic acid content equivalents, as shown in Table S3. The results of the two methods were subjected to a t-test and analyzed using Minitab (v17.1.0, Pennsylvania State University, PA, USA). The p value was 0.398, which was much higher than 0.05, indicating that no statistical significance was observed. This means that the CQD PAD method can be used for the determination of total phenol content in aqueous extracts of honeysuckle.
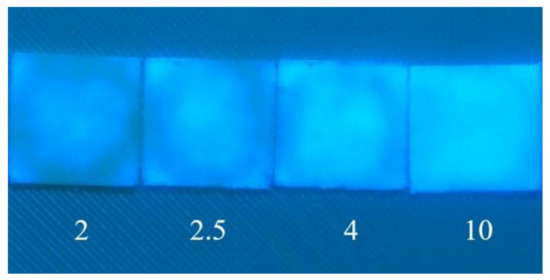
Figure 14.
PAD after adding the honeysuckle extract. The numbers in the figure are the dilution times of the added honeysuckle extract.
3.6. Results of the Analytical Methodology
The methodological validation of the CQD PAD method for the total phenolic content of the honeysuckle extract was performed using chlorogenic acid as the reference substance. The linearity, LOD, and LOQ of chlorogenic acid are shown in Table 3. The linearity of the method was good. The RSD value (n = 6) of the total phenol content of the honeysuckle extract was 2.33% in the inter-day precision experiment. The RSD value (n = 6) of the total phenol content of the honeysuckle extract was 3.40% in the sample reproducibility experiment. The experimental results of the sample recovery are shown in Table 4. The average recoveries of chlorogenic acid in the sample solutions met the requirements, and the RSD value was less than 5%, indicating that the CQD PAD method for the determination of total phenols in honeysuckle extracts was accurate and reliable.
Table 3.
Regression equation, correlation coefficient, and range of linear analysis for chlorogenic acid.
Table 4.
Recoveries (%) of chlorogenic acid (n = 3).
Ten different batches of honeysuckle extracts were prepared. The total phenol content of their aqueous extracts was determined using the PAD method. The assay method was the same as that in Section 2.2.6. The results are shown in Table 5. The total phenolic content of the honeysuckle aqueous extracts ranged from 0.885 to 1.60 mg/mL. The converted total phenolic content per unit herb ranged from 1.77 to 3.20%. The amount of total phenol in different batches of honeysuckle water extracts varied significantly.
Table 5.
Results of total phenol content in aqueous extracts of honeysuckle (n = 3).
4. Discussion
The main advantages of the continuous flow reactor, with aqueous tetraethylene glycol as the solvent, for the synthesis of CQDs are as follows: Firstly, the CQDs can be obtained in only about 5 min under the optimized experimental conditions. The time required by the continuous flow synthesis is less than that needed by the traditional batch synthesis process. Secondly, the aqueous tetraethylene glycol system can maintain a liquid state at synthesis temperature and under atmospheric pressure. Therefore, setting up the synthesis equipment was easy.
According to the experimental results, the CQD PAD has the following advantages: Firstly, the whole detection result is less time consuming and easy to operate. Secondly, the detection instrument is cheap because a smartphone is enough. Thirdly, the total phenolic content can be detected for a herbal extract, which can reflect part of the overall characteristics of the extract. Fourthly, the fluorescence detection result can be observed by naked eyes, which means that the method can also be used in qualitative detection.
Results of the determination of total phenol by CQD PAD are not significantly different from those obtained by the total phenol determination method in the pharmacopoeia. This means that the synthesized CQDs have the potential to be used for the quantitative detection of phenolics.
From the test results, the CQD PAD method has the potential to be used for the initial screening of herbal quality. The chlorogenic acid content in honeysuckle should not be less than 1.5%. If the total phenolic content calculated as chlorogenic acid equivalents by this method is lower than 1.5%, the honeysuckles are likely to be unqualified.
5. Conclusions
In this work, a continuous flow reactor was set up to synthesize CQDs, with citric acid and ethylenediamine as raw materials. An aqueous tetraethylene glycol solution was used as the solvent. The properties of CQDs were characterized by electron microscopy, photoelectron spectroscopy, fluorescence spectroscopy, and so on. It was found that the main elements of CQDs were C, N, and O, and the particle size was about 10 nm. The best excitation wavelength was 375 nm, and the maximum emission wavelength was 450 nm. After that, the fluorescence yield was used as the method index, and deterministic screening designed experiments were carried out. Multiple regression was used to establish a quantitative mathematical model between the fluorescence yield and the experimental parameters. The design space was established according to the probability of fluorescence yield meeting the preset range, and the validation experiment was subsequently carried out. The results showed that the prediction performance of the model was good.
After the preparation of the CQDs, they were found to be quenched by some phenolic substances. There was a linear relationship between the degree of quenching on the CQDs and the chlorogenic acid concentration. A PAD loaded with CQDs was prepared to determine the total phenolic content of the honeysuckle extracts. The color data were collected by a smartphone. The color component G was selected for the calculation of the color results according to the value of R2 and LOD. The results of methodological validation showed that the method was reliable, with good linearity, reproducibility, and inter-day precision. The diluted honeysuckle extract was assayed on a PAD. There was no significant difference between the results obtained with a PAD and the Pharmacopoeia method. This indicates that the total phenols of honeysuckle aqueous extracts could be detected using the CQD PAD. Based on the test results, the CQD PAD method has the potential to be used for the initial screening of herbal quality.
Supplementary Materials
The following supporting information can be downloaded at: https://www.mdpi.com/article/10.3390/chemosensors10080334/s1, Table S1: The factors and levels of deterministic screening experimental design; Table S2. Deterministic filter design tables and results; Table S3. Comparison of the test results of the two testing methods; Figure S1. Contour plot of fluorescence yield.
Author Contributions
Conceptualization, X.G.; methodology, S.G.; software, S.G. and X.G.; validation, S.G.; formal analysis, S.G. and J.L.; investigation, B.Z. and B.L.; resources, X.G.; data curation, X.G.; writing—original draft preparation, S.G. and J.L.; writing—review and editing, J.L.; visualization, J.L.; supervision, X.F.; project administration, X.G.; funding acquisition, X.G. All authors have read and agreed to the published version of the manuscript.
Funding
This research was supported by the following funds: National S&T Major Project of China, 2018ZX09201011; National Natural Science Foundation of China, 81503242; Innovation Team and Talent Cultivation Program of the National Administration of Traditional Chinese Medicine, ZYYCXTD-D-202002. The APC was funded by X.G.
Institutional Review Board Statement
Not applicable.
Informed Consent Statement
Not applicable.
Data Availability Statement
Not applicable.
Acknowledgments
The authors are grateful for the support of Haibin Qu.
Conflicts of Interest
The authors declare no conflict of interest. The funders had no role in the design of the study; in the collection, analyses, or interpretation of data; in the writing of the manuscript; or in the decision to publish the results.
References
- Zhang, C.; Dong, L.; Chen, S.; Xie, C.; Chang, D. UPLC fingerprint for quality assessment of ginsenosides of Ginseng Radix et Rhizoma. Acta Pharm. Sin. B 2010, 45, 1296–1300. [Google Scholar] [CrossRef]
- She, Y.; Hu, Y.; Han, L.; Liu, S.; Chen, C. Research progress on quality control of Chinese materia medica. Zhongcaoyao 2017, 48, 2557–2563. [Google Scholar] [CrossRef]
- Chinese Pharmacopoeia Commission. Pharmacopoeia of the People’s Republic of China: Part I; China Medical Science Press: Beijing, China, 2020; p. 85. [Google Scholar]
- Wang, Z.; Qian, Z.; Zhang, Q.; Zhu, J.; Gao, H. Technical guidelines for the establishment of quantitative analysis of multi-components by single- marker. Zhongguo Zhongyao Zazhi 2011, 36, 657–658. [Google Scholar]
- Wang, Z.; Gao, H.; Fu, X.; Wang, W. Multi-components quantitation by one marker new method for quality evaluation of Chinese herbal medicine. Zhongguo Zhongyao Zazhi 2006, 31, 1925–1928. [Google Scholar]
- Liu, C.; Chen, S.; Xiao, X.; Zhang, T.; Hou, W.; Liao, M. A new concept on quality marker of Chinese materia medica: Quality control for Chinese medicinal products. Zhongcaoyao 2016, 47, 1443–1457. [Google Scholar] [CrossRef]
- Yu, X.; Wang, X.; Yan, L.; Sun, L. Guideline principle and technical requirement for preparing traditional Chinese medicine reference drug. Zhongguo Zhongyao Zazhi 2017, 42, 3672–3675. [Google Scholar] [CrossRef]
- Jia, Q.; Ge, J.; Liu, W.; Zheng, X.; Chen, S.; Wen, Y.; Zhang, H.; Wang, P. A Magnetofluorescent Carbon Dot Assembly as an Acidic H2O2-Driven Oxygenerator to Regulate Tumor Hypoxia for Simultaneous Bimodal Imaging and Enhanced Photodynamic Therapy. Adv. Mater. 2018, 30, 1706090. [Google Scholar] [CrossRef]
- Tang, Q.; Zhu, W.; He, B.; Yang, P. Rapid Conversion from Carbohydrates to Large-Scale Carbon Quantum Dots for All-Weather Solar Cells. ACS Nano 2017, 11, 1540–1547. [Google Scholar] [CrossRef]
- Su, Y.; Su, L.; Liu, B.; Lin, Y.; Tang, D. Self-powered photoelectrochemical assay for Hg2+ detection based on g-C3N4-CdS-CuO composites and redox cycle signal amplification strategy. Chemosensors 2022, 10, 286. [Google Scholar] [CrossRef]
- Soheila, A.K.; Aziz, H.Y.; Kazuya, N. Decoration of carbon dots over hydrogen peroxide treated graphitic carbon nitride: Exceptional photocatalytic performance in removal of different contaminants under visible light. J. Photochem. Photobiol. A 2019, 374, 161–172. [Google Scholar] [CrossRef]
- Kumar, R.S.; Govindan, K.; Ramakrishnan, S.; Kim, A.R.; Kim, J.S.; Yoo, D.J. Fe3O4 nanorods decorated on polypyrrole/reduced graphene oxide for electrochemical detection of dopamine and photocatalytic degradation of acetaminophen. Appl. Surf. Sci. 2021, 556, 149765. [Google Scholar] [CrossRef]
- Gao, W.; Song, H.; Wang, X.; Liu, X.; Pang, X.; Zhou, Y.; Gao, B.; Peng, X. Carbon Dots with Red Emission for Sensing of Pt2+, Au3+, and Pd2+ and Their Bioapplications in Vitro and in Vivo. ACS Appl. Mater. Interfaces 2018, 10, 1147–1154. [Google Scholar] [CrossRef] [PubMed]
- Gan, Z.; Hu, X.; Huang, X.; Li, Z.; Zou, X.; Shi, J.; Zhang, W.; Li, Y.; Xu, Y. A dual-emission fluorescence sensor for ultrasensitive sensing mercury in milk based on carbon quantum dots modified with europium (III) complexes. Sens. Actuators B 2021, 328, 128997. [Google Scholar] [CrossRef]
- Chaudhary, P.; Maurya, D.K.; Yadav, S.; Pandey, A.; Tripathi, R.K.; Yadav, B.C. Ultrafast responsive humidity sensor based on roasted gram derived carbon quantum dots: Experimental and theoretical study. Sens. Actuators B 2021, 329, 129116. [Google Scholar] [CrossRef]
- Ravichandiran, P.; Subramaniyan, S.A.; Bella, A.P.; Johnson, P.M.; Kim, A.R.; Shim, K.S.; Yoo, D.J. Simple fluorescence turn-on chemosensor for selective detection of Ba2+ ion and its live cell imaging. Anal. Chem. 2019, 91, 10095–10101. [Google Scholar] [CrossRef]
- Yang, L.; Wen, J.; Li, K.; Liu, L.; Wang, W. Carbon quantum dots: Comprehensively understanding of the internal quenching mechanism and application for catechol detection. Sens. Actuators B 2021, 333, 129557. [Google Scholar] [CrossRef]
- Suh, B.; Gil, D.; Yoon, S.; Kim, K.T.; Kim, C. A practical hydrazine-carbothioamide-based fluorescent probe for the detection of Zn2+: Applications to paper strip, zebrafish and water samples. Chemosensors 2022, 10, 32. [Google Scholar] [CrossRef]
- Sinduja, B.; John, S.A. Sensitive determination of rutin by spectrofluorimetry using carbon dots synthesized from a non-essential amino acid. Spectrochim. Acta Part A 2018, 193, 486–491. [Google Scholar] [CrossRef]
- Rao, L.; Tang, Y.; Li, Z.; Ding, X.; Liang, G.; Lu, H.; Yan, C.; Tang, K.; Yu, B. Efficient synthesis of highly fluorescent carbon dots by microreactor method and their application in Fe3+ ion detection. Mater. Sci. Eng. C 2017, 81, 213–223. [Google Scholar] [CrossRef]
- Hisamoto, H. Paper-based Analytical Devices. Anal. Sci. 2017, 33, 753. [Google Scholar] [CrossRef]
- Wang, Y.; Luo, J.; Liu, J.; Sun, S.; Xiong, Y.; Ma, Y.; Yan, S.; Yang, Y.; Yin, H.; Cai, X. Label-free microfluidic paper-based electrochemical aptasensor for ultrasensitive and simultaneous multiplexed detection of cancer biomarkers. Biosens. Bioelectron. 2019, 136, 84–90. [Google Scholar] [CrossRef] [PubMed]
- Cao, Q.; Liang, B.; Tu, T.; Wei, J.; Fang, L.; Ye, X. Three-dimensional paper-based microfluidic electrochemical integrated devices (3D-PMED) for wearable electrochemical glucose detection. RSC Adv. 2019, 9, 5674–5681. [Google Scholar] [CrossRef] [PubMed]
- Hashimoto, Y.; Kaneta, T. Chromatographic paper-based analytical devices using an oxidized paper substrate. Anal. Methods 2019, 11, 179–184. [Google Scholar] [CrossRef]
- Arduini, F.; Cinti, S.; Caratelli, V.; Amendola, L.; Palleschi, G.; Moscone, D. Origami multiple paper-based electrochemical biosensors for pesticide detection. Biosens. Bioelectron. 2019, 126, 346–354. [Google Scholar] [CrossRef] [PubMed]
- Chinnadayyala, S.R.; Park, J.; Hien Thi Ngoc, L.; Santhosh, M.; Kadam, A.N.; Cho, S. Recent advances in microfluidic paper-based electrochemiluminescence analytical devices for point-of-care testing applications. Biosens. Bioelectron. 2019, 126, 68–81. [Google Scholar] [CrossRef]
- Asano, H.; Shiraishi, Y. Microfluidic Paper-based Analytical Device for the Determination of Hexavalent Chromium by Photolithographic Fabrication Using a Photomask Printed with 3D Printer. Anal. Sci. 2018, 34, 71–74. [Google Scholar] [CrossRef]
- Gong, X.; Shao, J.; Guo, S.; Pan, J.; Fan, X. Determination of inhibitory activity of Salvia miltiorrhiza extracts on xanthine oxidase with a paper-based analytical device. J. Pharm. Anal. 2021, 11, 603–610. [Google Scholar] [CrossRef]
- Wang, Z.; Zhang, J.; Liu, L.; Wu, X.; Kuang, H.; Xu, C.; Xu, L. A colorimetric paper-based sensor for toltrazuril and its metabolites in feed, chicken, and egg samples. Food Chem. 2019, 276, 707–713. [Google Scholar] [CrossRef]
- Hu, L.; Zhu, B.; Zhang, L.; Yuan, H.; Zhao, Q.; Yan, Z. Chitosan-gold nanocomposite and its functionalized paper strips for reversible visual sensing and removal of trace Hg2+ in practice. Analyst 2019, 144, 474–480. [Google Scholar] [CrossRef]
- Wang, J.; Dai, J.; Xu, Y.; Dai, X.; Zhang, Y.; Shi, W.; Sellergren, B.; Pan, G. Molecularly Imprinted Fluorescent Test Strip for Direct, Rapid, and Visual Dopamine Detection in Tiny Amount of Biofluid. Small 2019, 15, 1803913. [Google Scholar] [CrossRef]
- de Oliveira, T.R.; Fonseca, W.T.; de Oliveira Setti, G.; Faria, R.C. Fast and flexible strategy to produce electrochemical paper-based analytical devices using a craft cutter printer to create wax barrier and screen-printed electrodes. Talanta 2019, 195, 480–489. [Google Scholar] [CrossRef] [PubMed]
- Huang, Y.; Li, L.; Zhang, Y.; Zhang, L.; Ge, S.; Yu, J. Auto-cleaning paper-based electrochemiluminescence biosensor coupled with binary catalysis of cubic Cu2O-Au and polyethyleneimine for quantification of Ni2+ and Hg2+. Biosens. Bioelectron. 2019, 126, 339–345. [Google Scholar] [CrossRef] [PubMed]
- Tai, Y.; Qu, H.; Gong, X. Design Space Calculation and Continuous Improvement Considering a Noise Parameter: A Case Study of Ethanol Precipitation Process Optimization for Carthami Flos Extract. Separations 2021, 8, 74. [Google Scholar] [CrossRef]
Publisher’s Note: MDPI stays neutral with regard to jurisdictional claims in published maps and institutional affiliations. |
© 2022 by the authors. Licensee MDPI, Basel, Switzerland. This article is an open access article distributed under the terms and conditions of the Creative Commons Attribution (CC BY) license (https://creativecommons.org/licenses/by/4.0/).