Article

QCM Measurements of RH with Nanostructured Carbon-Based Materials: Part 2-Experimental Characterization

1
Department of Information Engineering and Mathematical Sciences, University of Siena, Via Roma 56, 53100 Siena, Italy
2
Department of Physical Science, Earth and Environment, University of Siena, Via Laterina 8, 53100 Siena, Italy
3
Department of Electrical Engineering and Information Technology, Chemnitz University of Technology, 09107 Chemnitz, Germany
*
Author to whom correspondence should be addressed.
Chemosensors 2022, 10(8), 320; https://doi.org/10.3390/chemosensors10080320
Submission received: 6 July 2022 / Revised: 6 August 2022 / Accepted: 9 August 2022 / Published: 10 August 2022
(This article belongs to the Special Issue Gas Sensors: Simulation, Modeling, and Characterization)

Abstract

:
In this series of two papers, the humidity sensing of a carbon nanotube (CNT) network-based material is transduced and studied through quartz crystal microbalance (QCM) measurements. To this aim, quartzes functionalized with different amounts of sensing material were realized, exposed to different humidity levels, and characterized. In this second paper, the experimental results are presented and discussed. The sensing mechanisms are elucidated exploiting the theory presented in the first paper of this series. The presented results show that the investigated material functionalization induces a large response of QCM to humidity in terms of resonant frequency even at low RH levels, with a sensitivity of about 12 Hz/%RH (at RH < 30% and room temperature and 10 ug of deposited SWCNT solution) and an increase in sensitivity in the high RH range typical of nanostructured film. Regarding the response in terms of motional resistance, a large response is obtained only at intermediate and high humidity levels, confirming that condensation of water in the film plays an important role in the sensing mechanism of nanostructured materials.

1. Introduction

The need to develop RH sensors is boosted by many different application demands; therefore, a lot of research in this field concerns the exploitation of novel materials for this sensing application [1]. In recent years, a great deal of attention has been devoted to nanostructured materials since they are in principle the most performant in the field of gas or RH sensing due to their unique enormous surface to volume ratio, which greatly amplifies their adsorption capabilities [2,3,4]. Among these materials carbon-based ones, and specifically carbon nanotube networks, have shown great potential due also to their low cost and ease of preparation [5,6,7]. Until now, these materials have shown very good performance in terms of sensitivity, but also some issues when used at high humidity levels, which are mainly related to non-linear behavior and poor stability [8]. These problems can be explained by water condensation in the micro- and nano-voids or empty spaces, which are typical of nanostructured materials and more specifically of the investigated carbon nanotube networks. In this series of two papers, the RH-sensing properties of films consisting of disordered networks of single-wall carbon nanotubes (SWCNTs) are transduced and studied by means of quartz crystal microbalance (QCM) measurements. QCMs are usually considered mass sensors, able to measure the mass deposited on the surface of the quartz resonant system due to the adsorption of a target substance, water vapor in our case.
In fact, the response of a QCM in terms of resonant frequency and of motional resistance (which describes the dissipative phenomena) does not depend solely on the adsorbed mass, as clarified in the first part of this paper [9], but can also be related to the nature of the adlayer; this can be used to throw some light on the adsorption mechanisms involved in the water adsorption and on the advantages and limitations of SWCNT networks as RH-sensing layers.
In this second paper in the series, the sensing phenomena are investigated through experiments and discussed on the basis of the results presented in the previous paper [9]. In particular, this paper provides the static and dynamic characterizations of SWCNT networks obtained depositing a solution of SWCNT on AT-cut quartzes, which thus forms a functionalization layer over one of the quartz surfaces. The quartz and the deposited SWCNT network therefore compose a resonant system, whose behavior changes upon adsorption of water vapor. The way in which water molecules are bound to the network causes different responses of the QCM system, affecting differently its resonant frequency and its motional resistance (or Q-factor), and this allows for recognition among different adsorption mechanisms. Indeed, the designed measurement system exploits an oscillator circuit developed ad hoc, which guarantees the possibility of evaluating in real time both the resonance frequency and the motional resistance of the system, with high accuracy. This is an important aspect for deepening the investigation of the water absorption mechanism with particular reference to the formation of condensed water in CNT networks and more generally in nanostructured materials, since the motional resistance provides the possibility of discriminating between mass and viscoelastic changes occurring in the sensing film [10,11,12].
In summary, this paper provides a novel insight into RH sensing with nanostructured layers, through the interpretation based on the theoretical study provided in the first part of this paper [9] and into the application of an ad-hoc measurement system based on QCM monitoring.
The paper is organized as follows: in Section 2, materials and methods are described. First, the sensing material and layer preparations are described; then the methods for the sensing material characterization are presented; finally, some details concerning the QCM measurement systems are given, and finally this section describes the measurement system capability of simultaneously monitoring in real time the quartz resonant frequency and its motional resistance. Section 3 reports the experimental results concerning the material characterization and sensing properties of the investigated sample; a concluding section closes the paper.

2. Materials and Methods

2.1. Sensing Layer and QCM Preparation

Single-wall carbon nanotubes (SWCNTs) were purchased from Sigma-Aldrich (CoMoCat SG65i®, with a purity of 95% and a CAS number of 308068-56-6) and utilized in the same form in which they were received. The CNTs have an average diameter of 0.78 ± 0.1 nm, a percentage of semiconducting tubes that is less than or equal to 95 %, and a portion less than 40% with (6,5) chirality. Following the same dispersion method used and well described by the authors in [13], a 1% solution of the surfactant sodium do-decyl-benzenesulfonate (SDBS) in deionized water was used to disperse 0.01 weight percentage of the SWCNTs. The dispersion was made by combining 7 mg of SWCNTs with 10 mL of the SDBS aqueous solution. After magnetically stirring the SWCNTs/SDBS solution for a few minutes, the mixture was then sonicated at 25 °C for 45 min using a spherical tip. This was done to ensure the SWCNTs were evenly distributed throughout the liquid phase. A Bandelin Solopuls HD 3200 (20 W) was utilized to apply sonication at a power level of 30 % of the total power with square pulses with 50% of duty cycle.
The quartz used during the experimental test is an AT-cut crystal with a nominal resonance frequency of approximately 10 MHz and two gold electrodes having a diameter of 6 mm.
The as-prepared SWCNT solution was deposited on one surface of the quartz by drop-casting and dried at room temperature (RT) for 8 h.

2.2. Material Characterization

A small drop of the SWCNT solution was dispersed on a silicon substrate and spin-coated at 4000 rpm for several minutes to ensure a good dispersion. The obtained film was measured by atomic force microscopy (AFM) imaging using a 5600LS Atomic Force Microscope System (Keysight Technologies, Santa Rosa, CA, USA) in tapping mode.
TEM analyses were performed by a JEOL 2010 microscope, working at 200 kV, LaB6 source and with an ultra-high resolution (UHR) pole piece, allowing point-to-point resolution of 0.19 nm. The microscope is equipped with a semi-STEM control and ultra-thin window energy dispersive spectrometer (EDS ISIS Oxford, Oxford, UK). Data were recorded by an Olympus Tengra CCD camera. The obtained carbon-based solution was kept in ultrasonic treatment for approximately 5 min and subsequently deposited on a tailored carbon-coated mesh grid for the investigation.

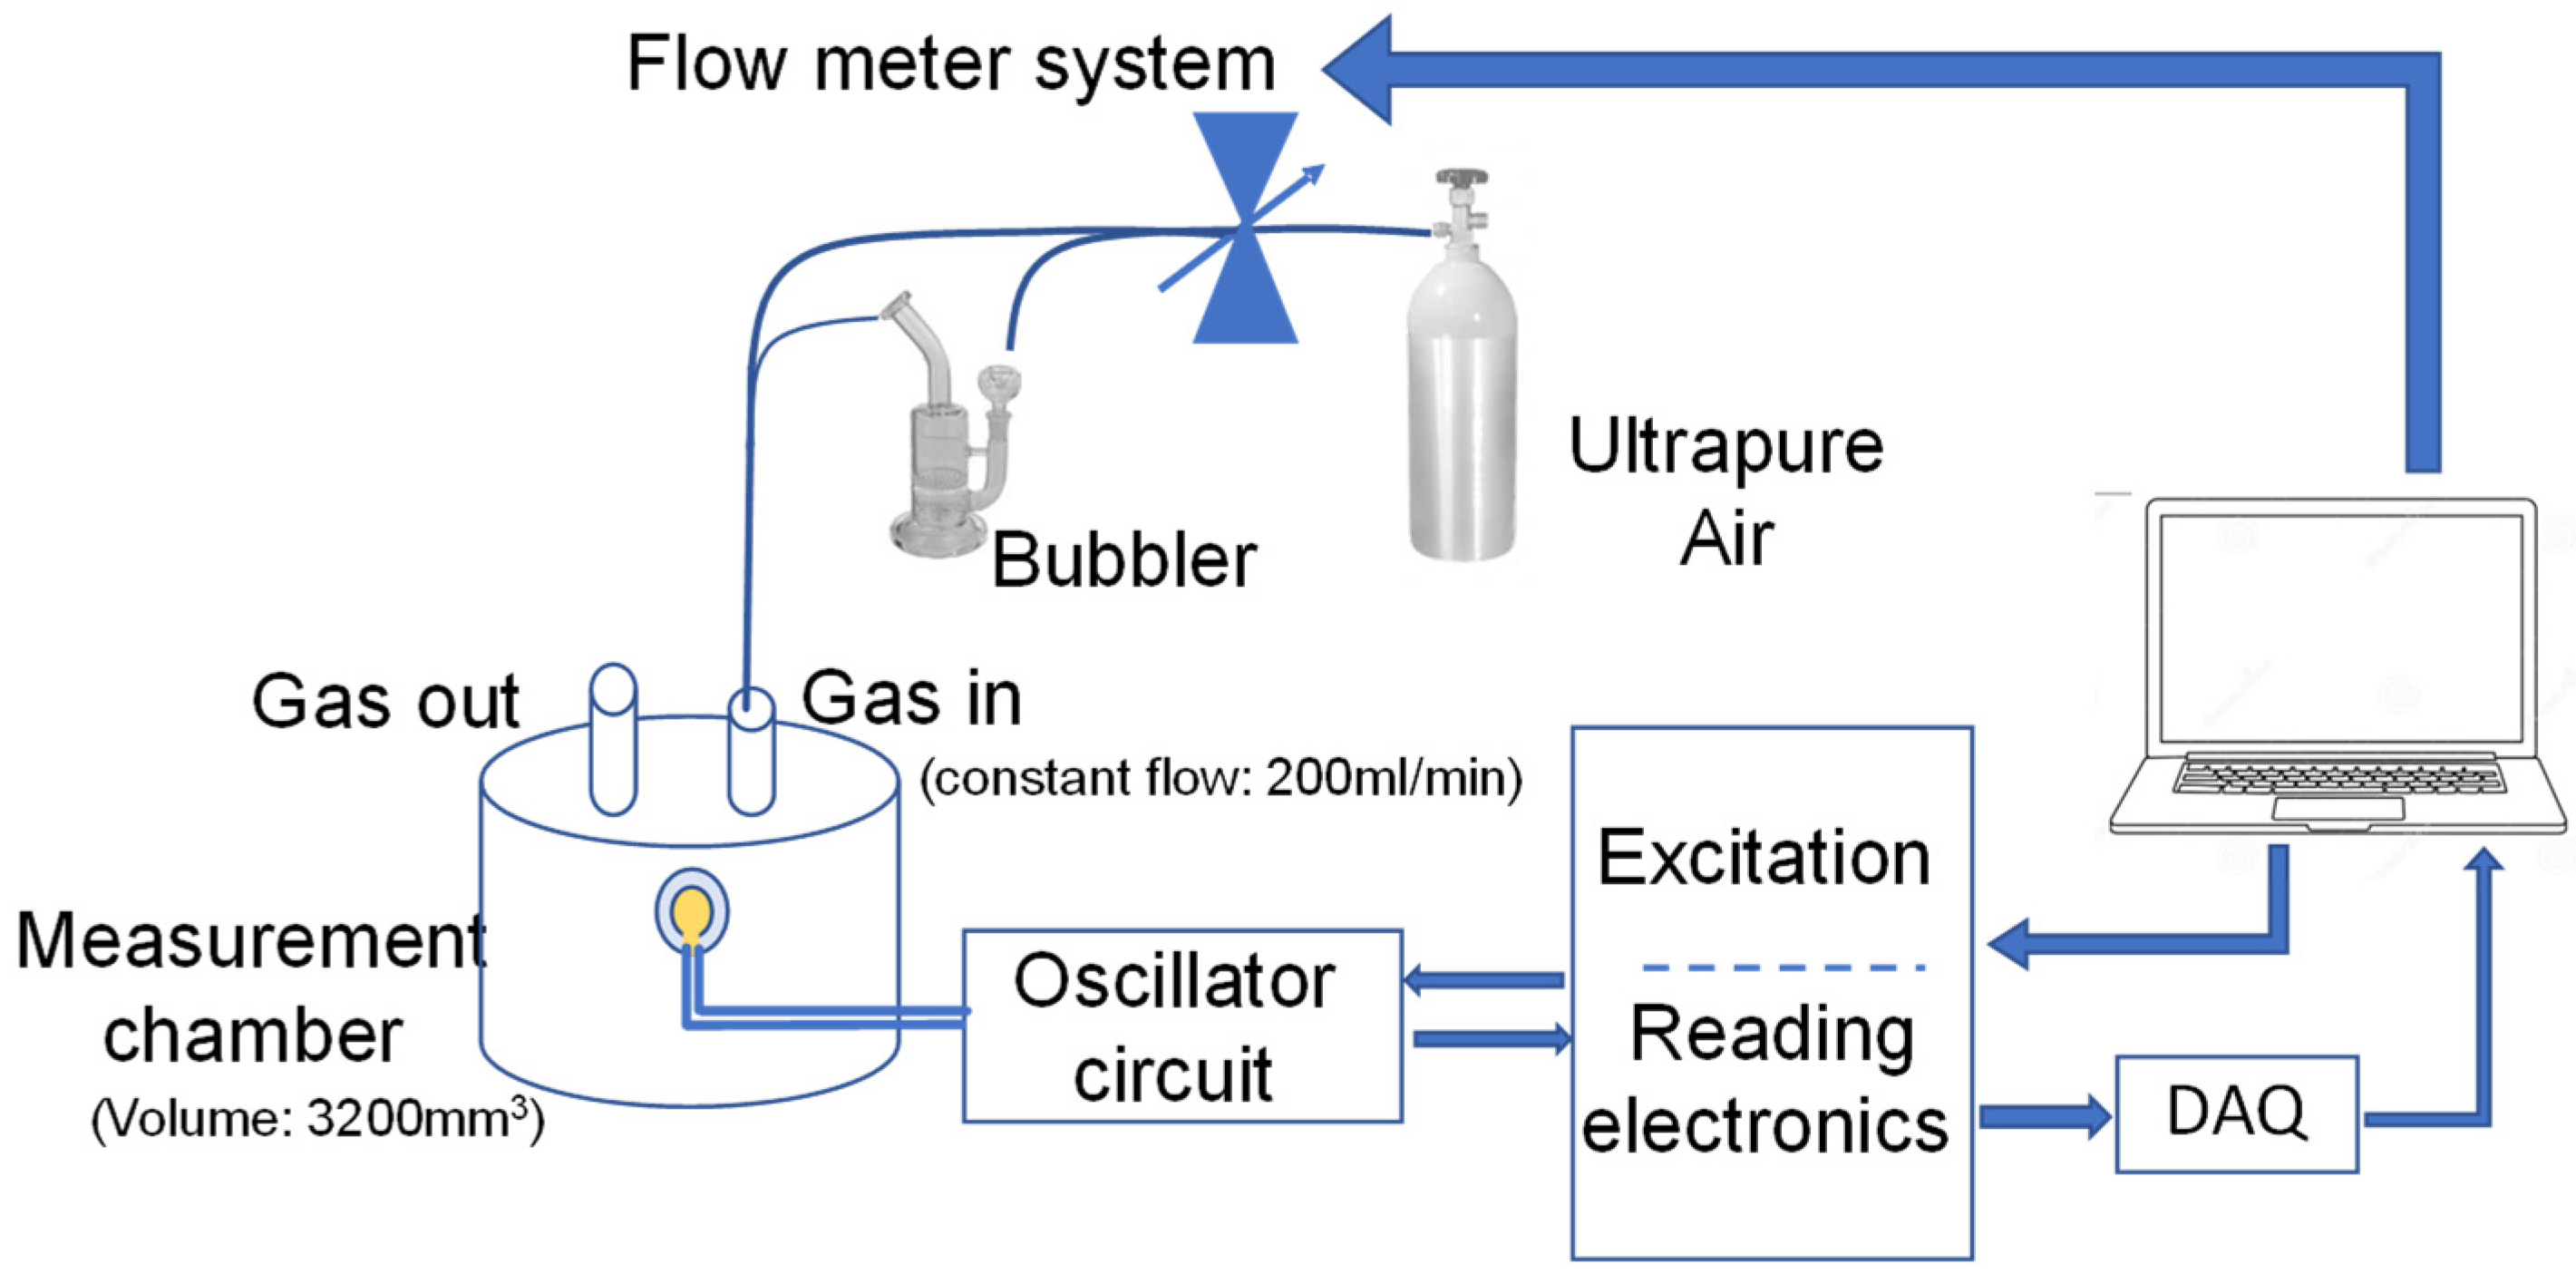
2.3. Assessment of the RH Sensing Properties

The humidity-sensing performance of the prepared CNT-based film was characterized by means of an automated measurement system as schematically reported in Figure 1. The system is composed of a sealed gas measurement chamber with a volume of approximately 3200 mm3, suitable for housing the quartz crystal during transient gas, ad-hoc designed front-end electronics and an automated measurement system realized with a LabView interface capable of managing the measurement of the oscillating response and the operating humidity conditions. In addition, the temperature in the measurement chamber is monitored with a PT 100 class I temperature sensor and all the measurements shown in this paper are conducted in the temperature range 21–24 °C.
The different humidity levels in the measurement chamber are obtained by mixing, in different concentrations, a dry air flow with a humid one deriving from a bubbler, where dry synthetic air is saturated. The setting of the gas flow is managed by an accurate flow controller system, and precisely by using BronkHorst F-201C flow controllers, granting an accuracy of +/− 5% of the set-point when the flow rate of 200 mL/min is set. The latter are also remotely managed by a PC through the designed LabView interface. During measurements, the total flow entering the measurement chamber is kept constant at 200 mL/min and the different RH concentrations are set by the flow meter system.
The front-end electronics is based on a QCM oscillator circuit exploiting a Meacham bridge topology whose selection was led by the need to operate with a grounded quartz, oscillating at its zero-phase frequency f, at which the quartz operates as a pure resistive element. This represents an important aspect when, in addition to the measurement of the resonance frequency, the evaluation of the quartz impedance is also considered. In fact, the value of the quartz impedance operating at f gives a good estimation, especially for QCM in gas measurements, of the motional resistance of the system, which is a crucial parameter for characterizing the viscoelastic properties of the sensing film, rigidly deposited on the QC surface [14,15].
The front-end electronics is composed of the oscillator circuit and a section embedding a mixer and a low-pass filter, used to process the oscillator output signal in order to properly downshift its frequency, and to exploit a reference signal generated by a waveform generator (AG33220A in this work). Moreover, the oscillator circuit has been designed to perform an automatic gain adjustment of the oscillating signal. The feasibility of this task is granted by the use of a wide-band differential amplifier with variable gain, described in detail by the authors in [16]. This strategy provides the possibility to maintain the necessary conditions for the quartz oscillation, even for large excursions of the system working point.
The amplitude and frequency of the oscillating output signal are acquired by a 16-bit DAQ board with 333 kS/s as the maximum sampling rate (NI PCI 6052E) and assuming an acquisition time of 150 ms. The acquired signal was processed in real time by means of the ad hoc-realized LabVIEW virtual instrument and assuming a measurement time of 2 s, during which the measurement of the frequency f and the estimation of the motional resistance RTOT (as defined in [9], which is intended as part 1 of this paper) are performed.

3. Experimental Results and Discussion

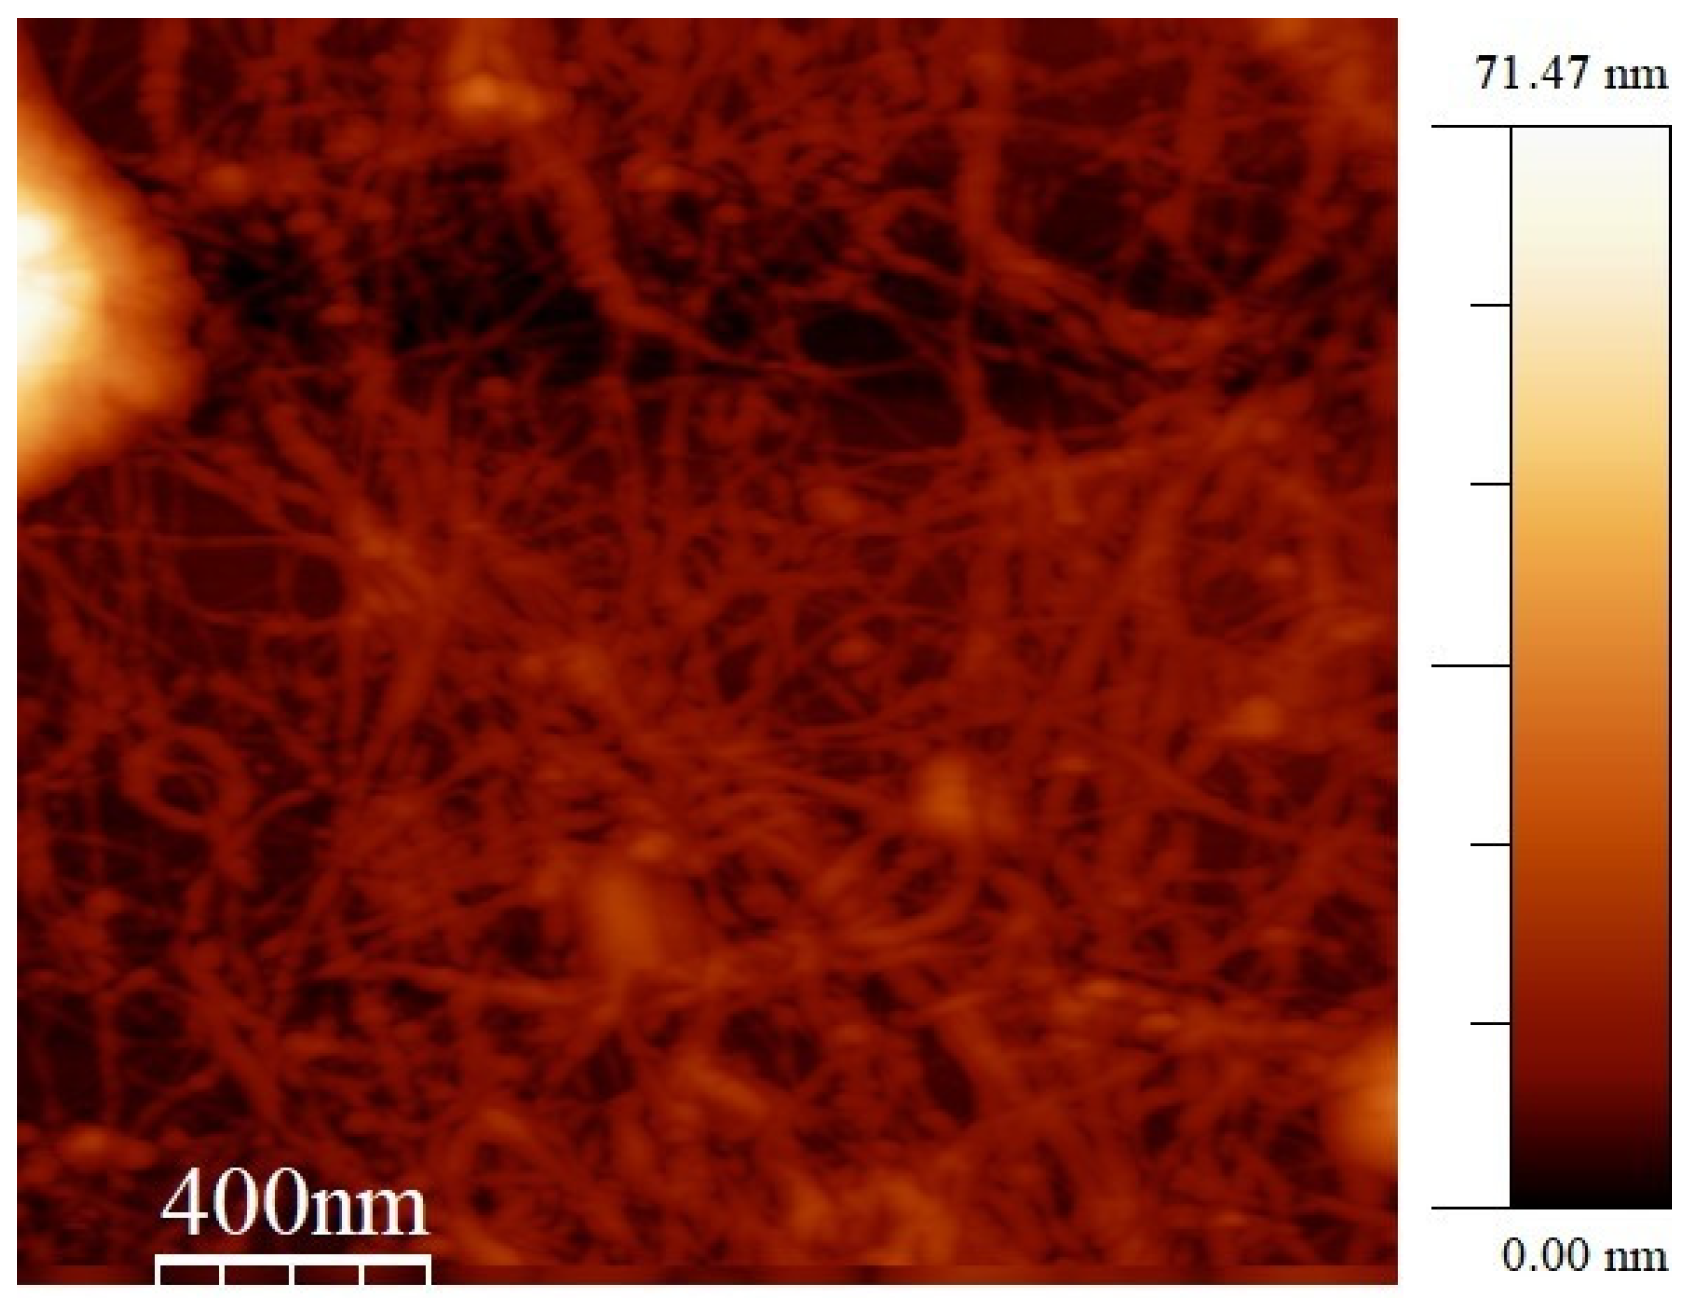
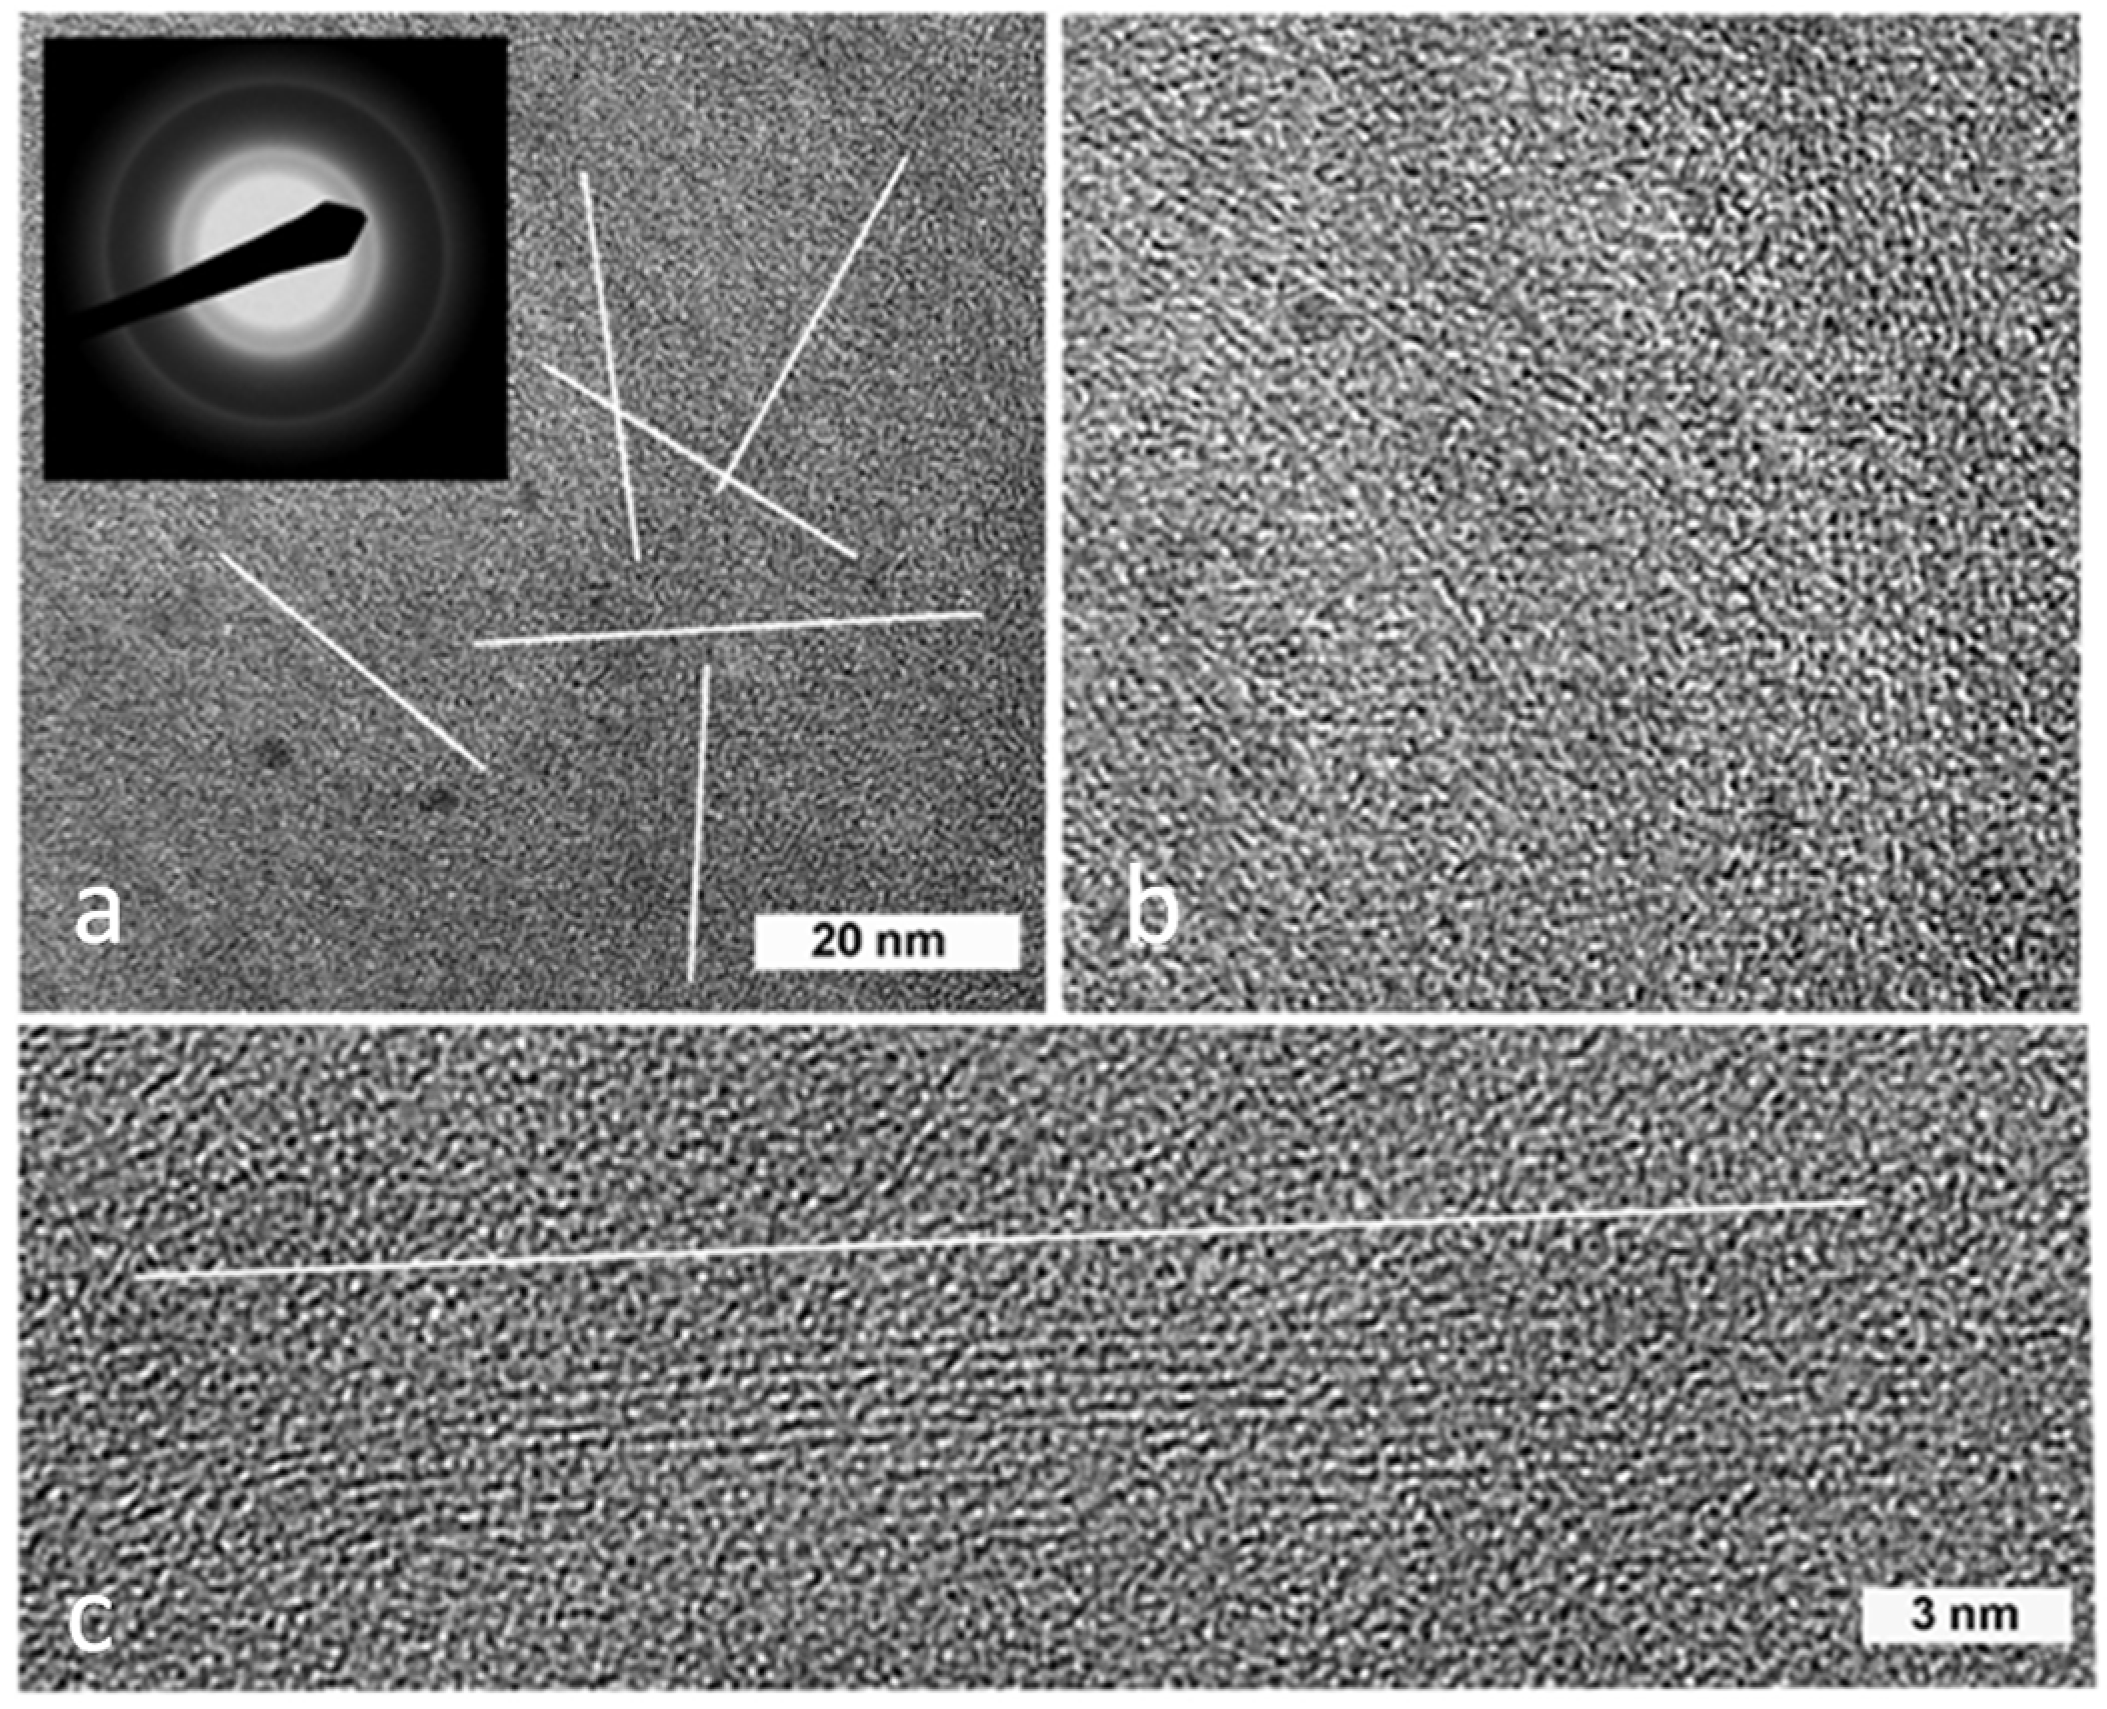
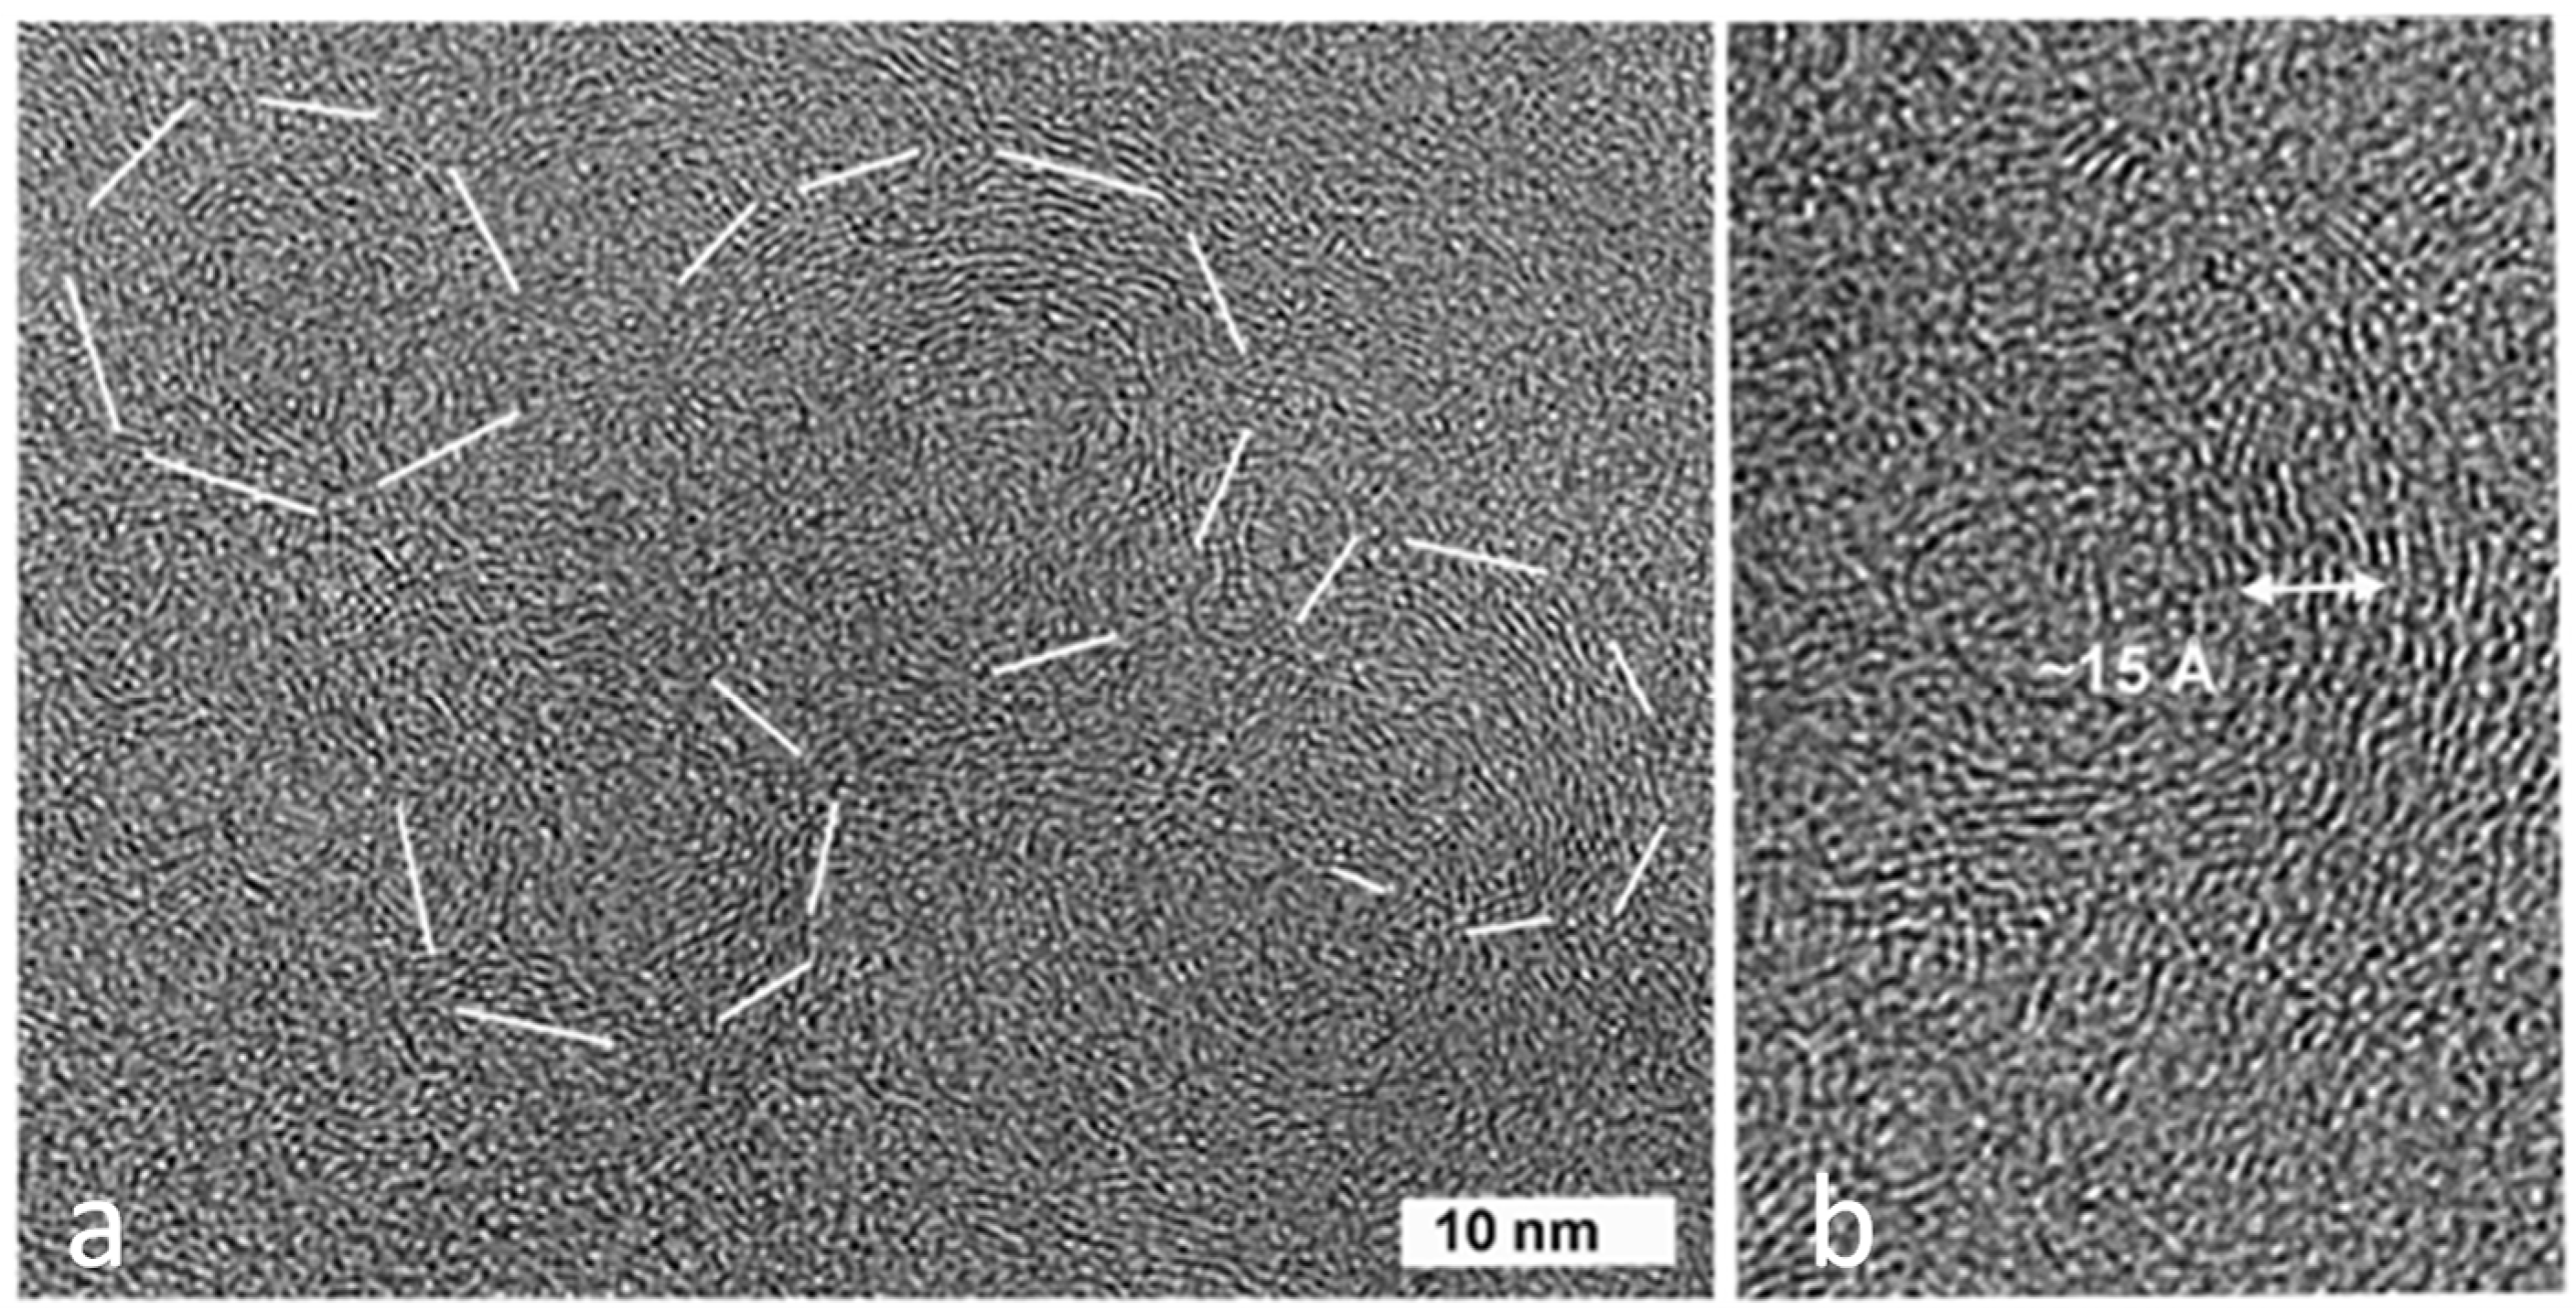
3.1. Material Characterization

The dispersion quality of the prepared sensing solution, as well as the morphological and structural characteristics of the thin film, was investigated using atomic force microscopy (AFM) imaging. In Figure 2, a continuous coating of the film and a well-distributed network of individual and bundles of tubes can be observed. The height assessment indicates that the bundles have a roughness of approximately 72 nm, indicative of a large surface area and porosity, especially at the voids between the bundles.
TEM analysis was performed on two different grids with variable powder charge, showing completely equivalent results. The results show the presence of randomly oriented C nanocrystals in two main habits: tubular-like and concentric onion-like habits as reported in Figure 3 and Figure 4, respectively.
Figure 3a reports a relatively low magnification image, showing variably oriented C nanotubes (as highlighted by the white lines); the inset reports the corresponding selected-area electron diffraction (SAED), characterized by a weak, diffuse and ring-shaped diffraction pattern, testifying to low crystallinity and random orientation. Figure 3b (an enlargement of the previous image) shows randomly oriented C-nanotubes, each formed by up to a maximum of 8–10 lattice fringes with typical d-spacing of~3 Å. A further detail of a relatively well-crystallized C nanotube is shown in Figure 3c, where the orientation of the nanotube is emphasized by the white line.
In the same investigated sample, we also observed onion-like concentric arrangements of C lattice fringes, as shown in Figure 4a. Lattice fringes are commonly bent and irregular, as evident in the high magnification image in Figure 4b. Locally, C lattice fringes may also show a partially polygonalized arrangement, with sharp angular changes in lattice fringe orientation.

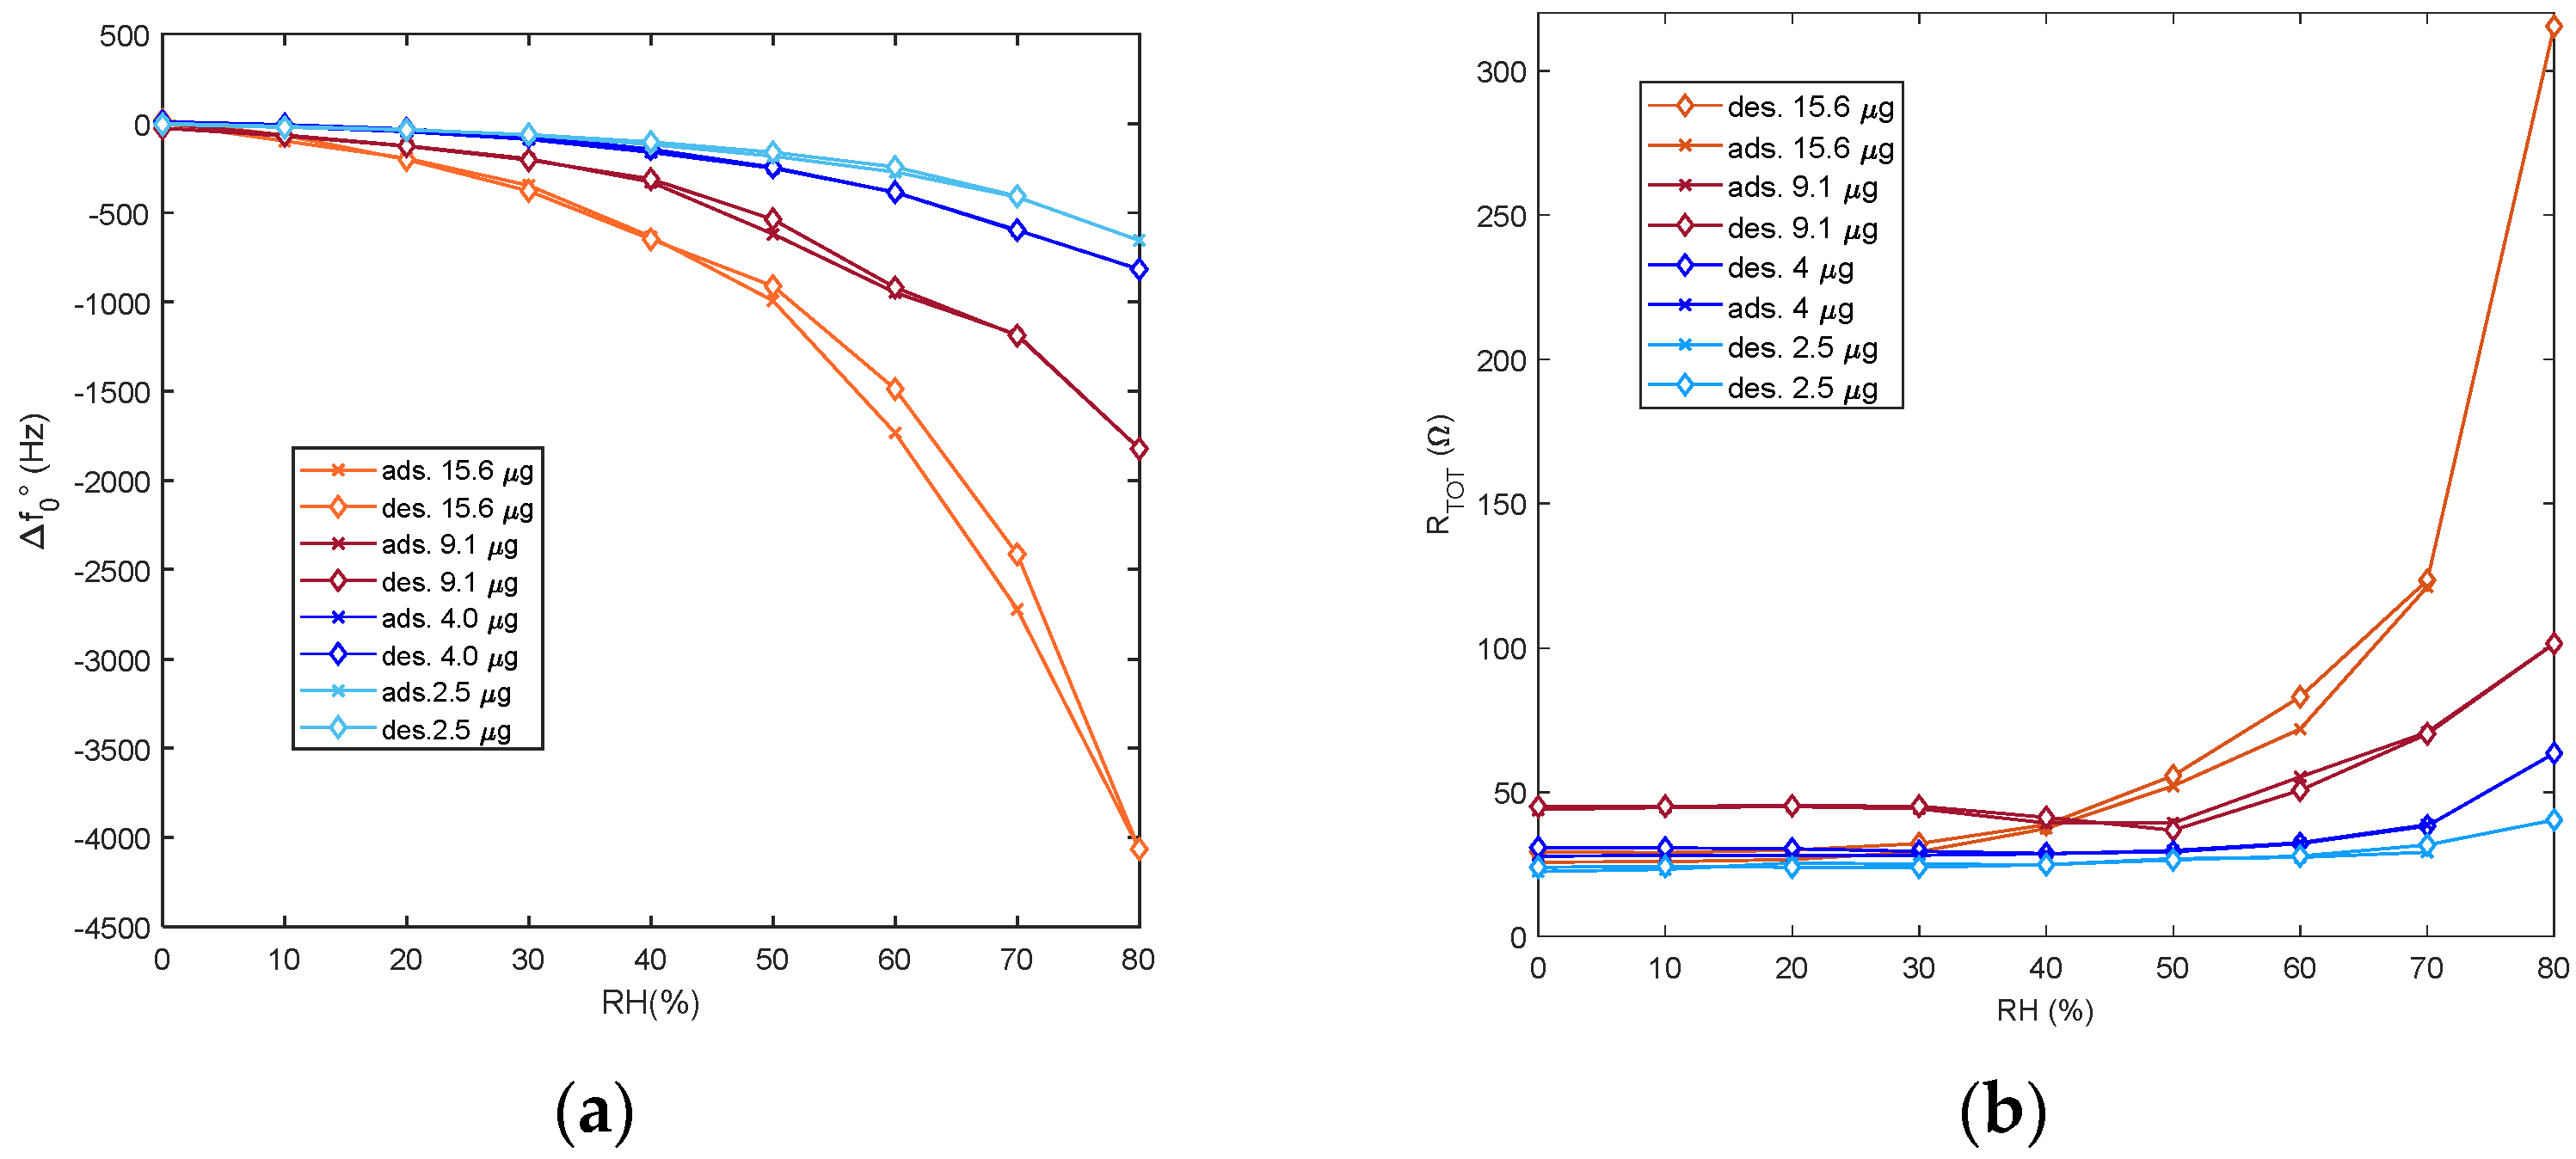
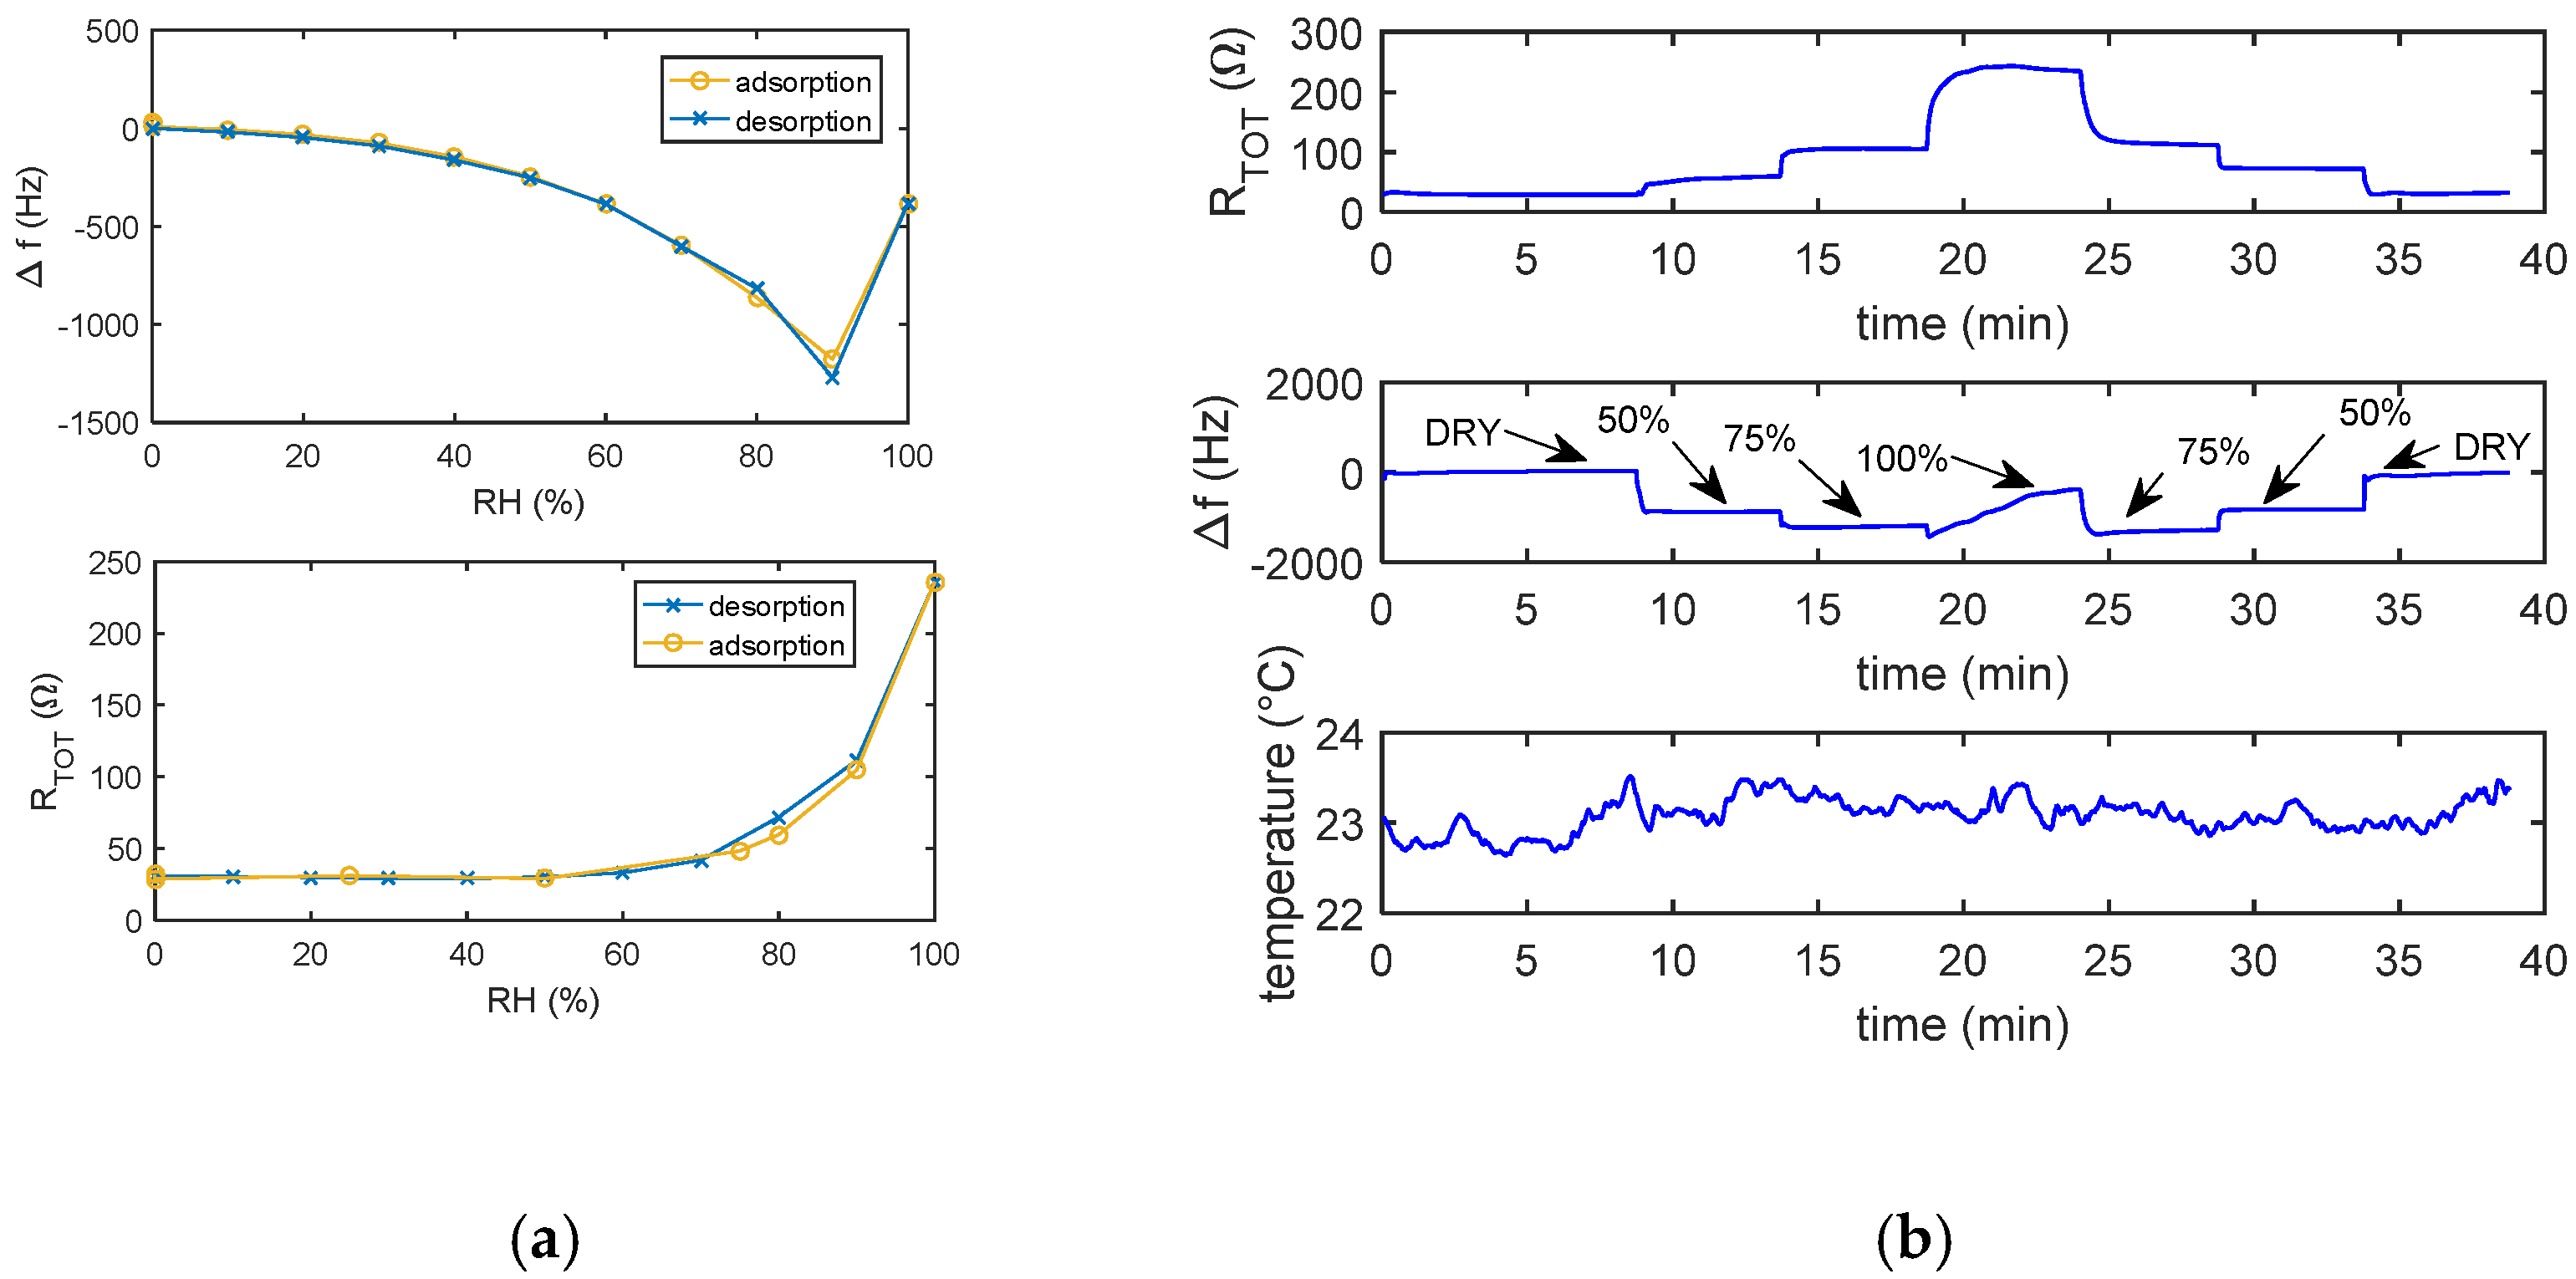
3.2. Adsorption-Desorption Experiments: Sensing Properties of the SWCNT Network

In this subsection, the behavior of the different SWCNT networks, obtained by the deposition of different quantities of the base solution, was analyzed by means of adsorption/desorption experiments. The behavior of the sensing films was observed during experiments in which the RH value was slowly increased (10% RH/30 min) from 0% to 80% and then decreased from 80% to 0%. The response of the sensor was measured in terms of frequency shift with respect to the resonant frequency baseline in a dry environment, and of motional resistance, as assessed by the used oscillator.
Figure 5 shows the sensing film responses as a function of the RH value, maintaining a constant air flow whose RH level is set by controlling the fractions of flow of dry and water-saturated air entering the chamber, as described in Section 2.
It can be seen that the response to humidity in terms of frequency shift is satisfactorily large for all the tested sensing films. And, as expected, the sensitivity increases as the active area increases, i.e., increasing the SWCNT solution doses. For humidity lower than 30%, all the films appear to behave as “solid elastic” films, characterized by small motional resistances whose values change very little with respect to the ones obtained in dry gas. Except for the film obtained casting 9.1 μg of solution, the motional resistance of the dry film increases slightly with the SWCNT-deposited mass. Therefore, in this low RH range, it appears that the mechanical load provided by the water uptake causes pure mass loading of the solid film, which can be modeled by an increase of the film density due to the filling of void regions (the inner part of the single tube and the inter-grain regions) related to the water adsorption of OH groups (first chemosorbed layer) [17,18] and of bound water molecules (upper physiosorbed layers).
This behavior allows for the use of the Sauerbrey equation to describe the relationship between the frequency shifts and the mass increases. Exploiting this relationship, for the used quartz, a shift of 100 Hz corresponds to a mass increase of 125 ng and to a layer of adsorbed water molecule fully covering an area of about 203 mm2. Considering that the electrode area is about 28 mm2, this shows the improvement in terms of equivalent area brought about by the studied functionalization. Clearly, this large gain is provided both by the increased active area characteristic of the SWCNT network morphology and by the tendency of water to adsorb in multilayer structures.
Since multilayer adsorption for water on solid surfaces [8] predicts a linear relationship between the adsorbed mass and the water vapor concentration, it can be expected that the sensing system behaves linearly as far as the frequency shift is concerned in this RH range. This is in fact confirmed by the measurements (see Figure 5b); up to 30% RH of all the tested films show constant sensitivities proportional to the SWCNT mass, going from 1.9 Hz/%RH for the lighter film up to 12 Hz/%RH for the heavier film.
In the low RH range, a reduction in the motional resistance with increasing humidity is observed in some cases. This can be explained by the reduction of the attenuation of the acoustic wave occurring while voids in the SWCNT network are filled with adsorbed water [19,20,21]. This phenomenon can be more or less important depending on the randomness of the network structure, but is more visible for less dense networks: those obtained with a smaller quantity of deposited material and in particular in the case of the QCM functionalized with 4 μg. This QCM is also the one with the largest baseline resistance explainable by a very porous, less compact film structure: accordingly, it appears the one showing the more marked motional resistance decreases.
At high humidity levels, a large increase in the motional resistance is observed (see Figure 5 again), which can be explained by the appearance of condensed water in the micropores or voids in the network microstructure and can continue until an almost continuous water film forms [8]. This is normally accompanied by a different behavior of the sensing layer in which a pure mass load and the Sauerbrey equation are not sufficient to explain the variations in the measured parameters, but on the contrary, they need to be interpreted using the theory concerning viscous or liquid films.
Moreover, the behavior that is observed for the SWCNT networks at high RH levels is very similar to that of other nanostructured sensing layers observed for instance in [8,22]: as the amount of material used to make the film increases, we see that the evidence of water condensation occurs at lower humidity; that is, it manifests itself more easily. For the heavier layer it already starts at RH = 30%, while the sensor obtained by depositing 2.5 μg of SWCNT solution (lower used amount) practically shows no evidence of significant condensation up to 80% RH. The behavior of films obtained with large doses of material has already been explained by the presence of a greater number of micro-pores or voids that behave like capillaries and favor the condensation of water, even at humidity levels well below that corresponding to saturated vapor [8].
Furthermore, Figure 5 shows that the formation of condensed water is accompanied by hysteresis in the response, which is more evident in sensors with more deposited material.
The frequency shift response deviates from linearity before the resistances start increasing, and this happens for intermediate RH levels going from 30% up to 70%, depending on the film mass. This could be explained by a simultaneous increase in density and thickness of the film due to the large amount of adsorbed water.
Overall, the steady state responses obtained in the adsorption/desorption experiments are consistent with those obtained from simulation by applying the sensing behavioral model described in part 1 of this paper [9] (compare experimental data with those shown in Figures 5 and 6 of [9]).
Moreover, the behavior of the sensor realized with a fairly large quantity of the base solution (see Figure 6, where the response of the 4 μg sensor up to RH = 100% humidity is plotted) shows the same non-monotonic behavior predicted by the theory for large humidity levels. In Figure 6, together with the plots of the measured parameters in steady state conditions as a function of the RH levels, the transient behavior obtained with step changes in the humidity as a function of time is shown.
The comparison of these results with those predicted by the modeling of the previous paper corroborates the theoretical interpretation of the measured frequency (f). The non-monotonous behavior, as explained in [9], is due to the presence of a very large motional resistance, which causes the zero-phase frequency f of the QCM impedance to behave differently from the series resistance [14].
Figure 7 shows that the measured frequency shifts are linearly related to the SWCNT deposited mass not only for low humidity, where it is expected from the adsorption theory, since the increase in SWCNT is related to an increase in the active sensing area, but also for high humidity levels where this result is less obvious. The mass of the deposited network of SWCNTs used for this plot is obtained from the frequency shift measurements in dry air of the pristine and functionalized quartz and exploiting the Sauerbrey equation:
Δ f = 2 f s 2 A μ q ρ q Δ m
where ρ q and μ q are the quartz density and shear modulus, respectively, A is the area of the electrodes, fs the modal frequency of the quartz and Δ m the mass variation on the quartz surface due to the water adsorption.

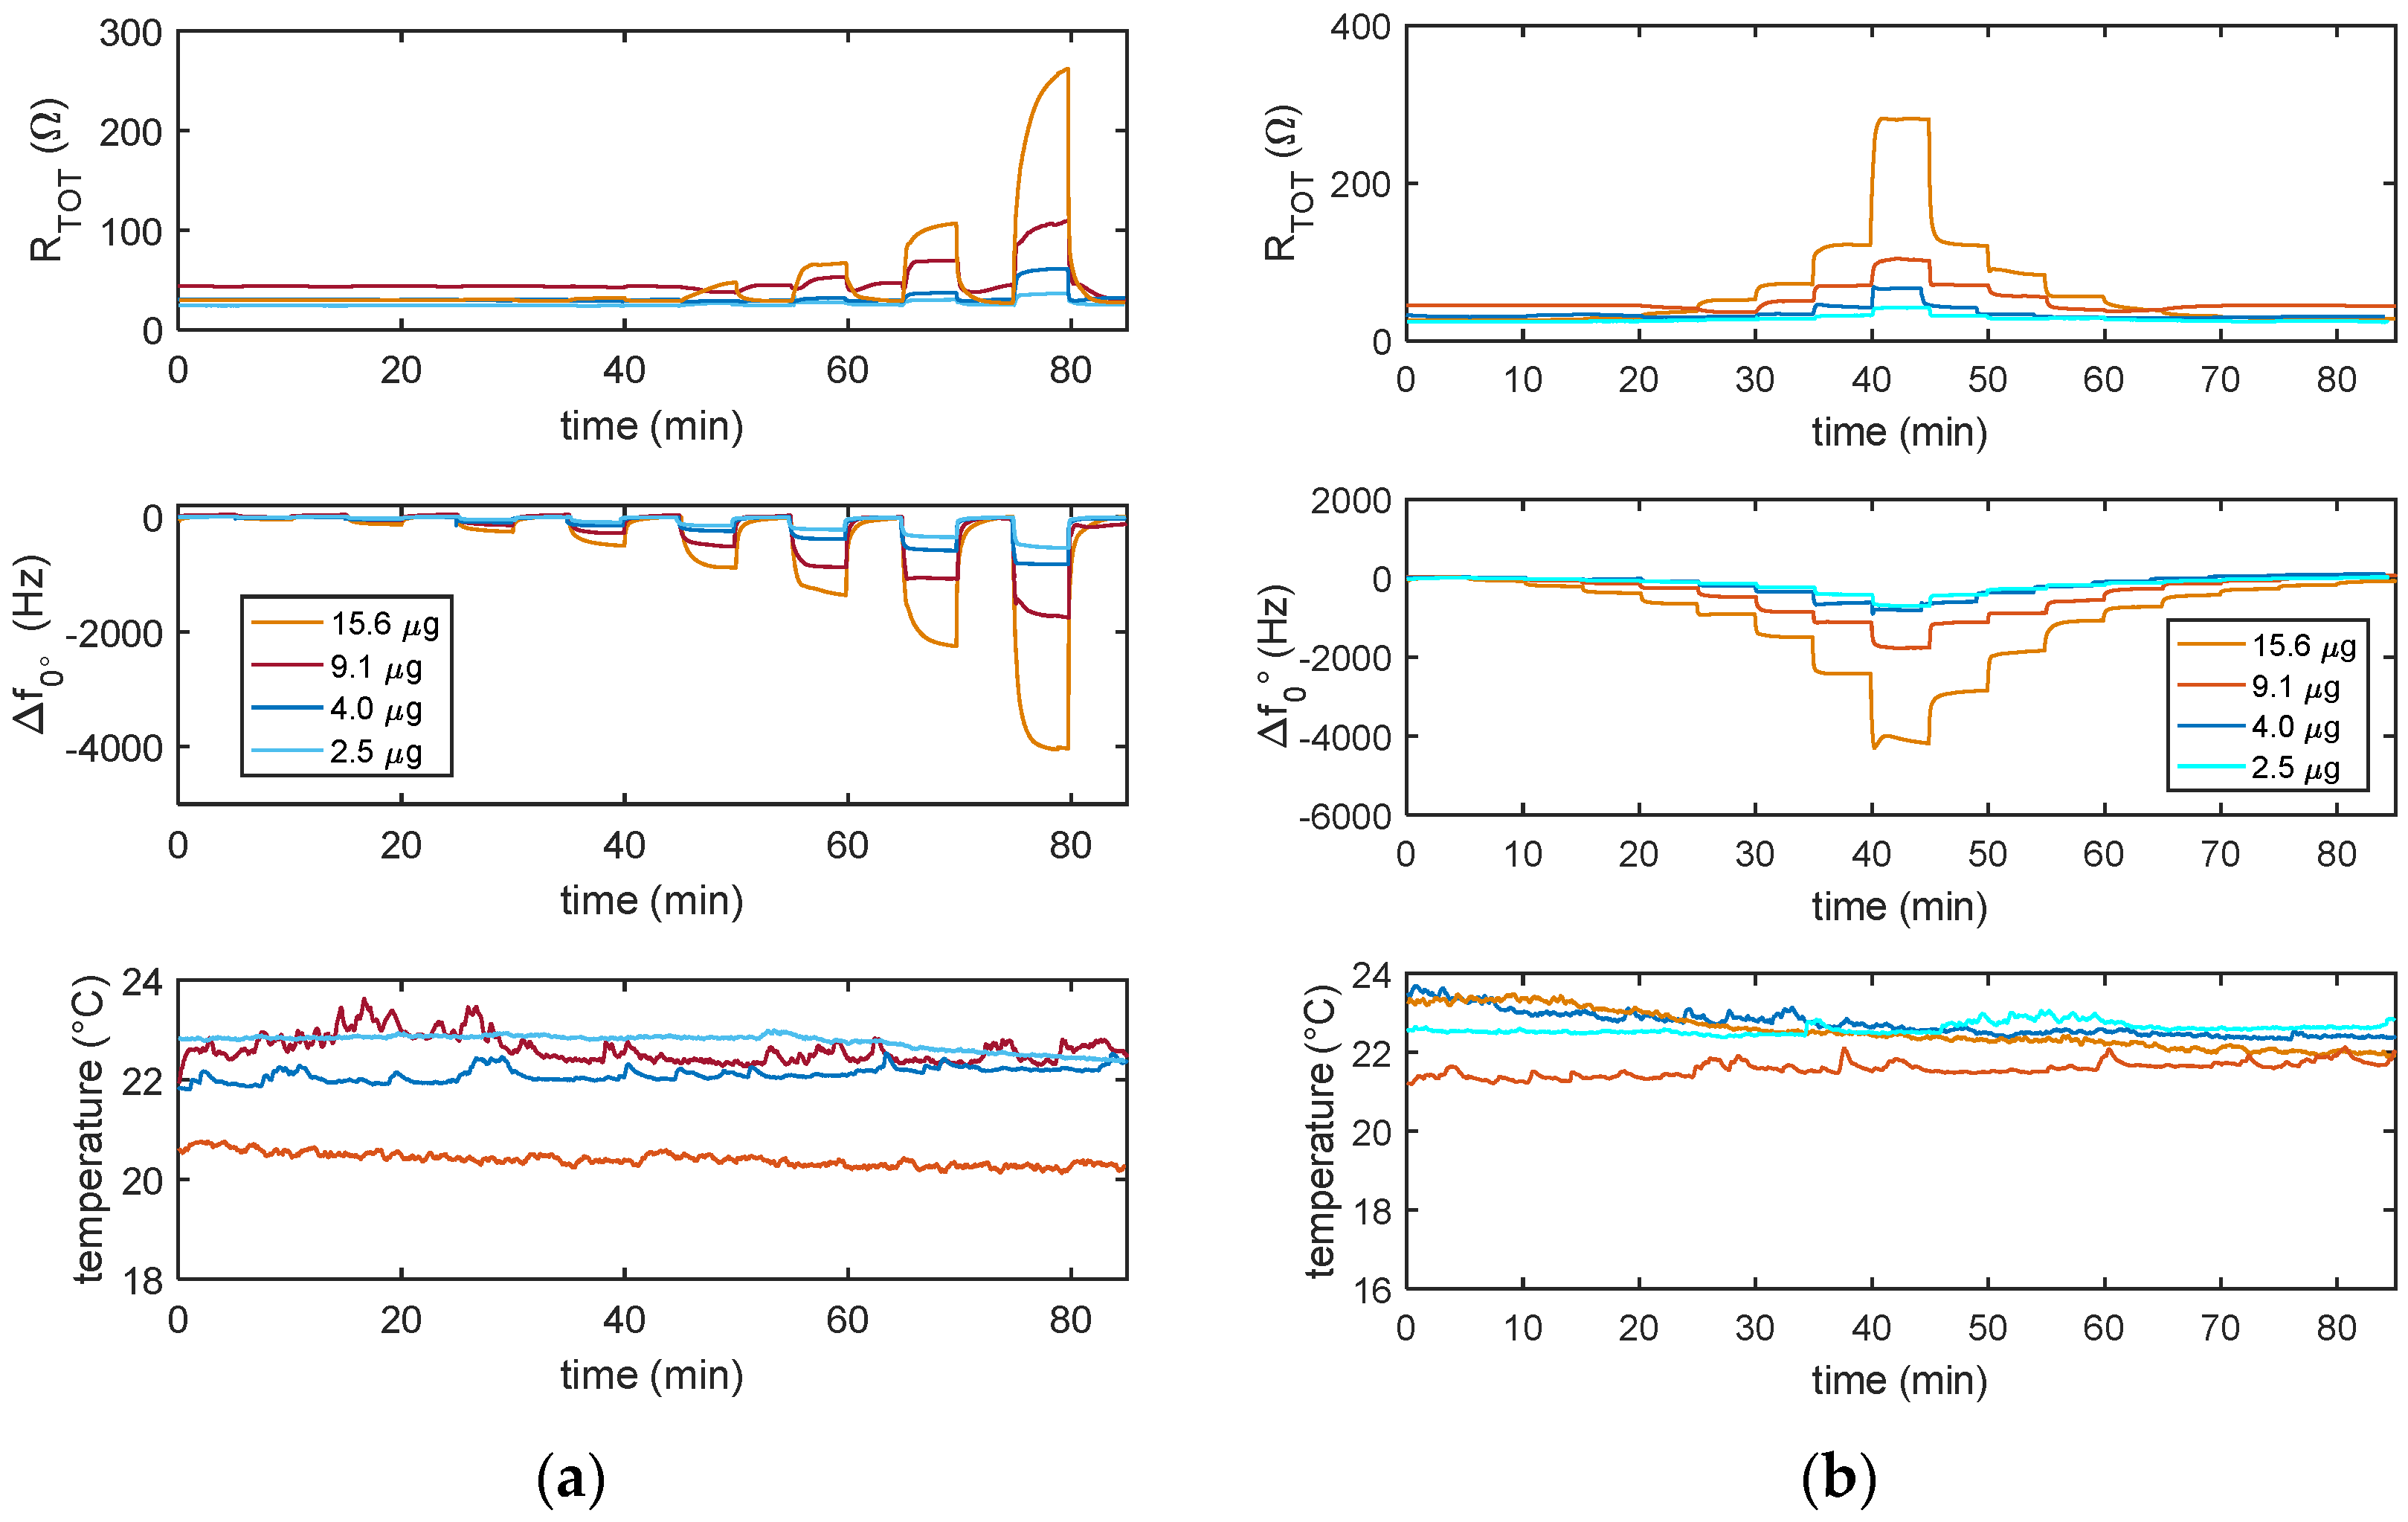
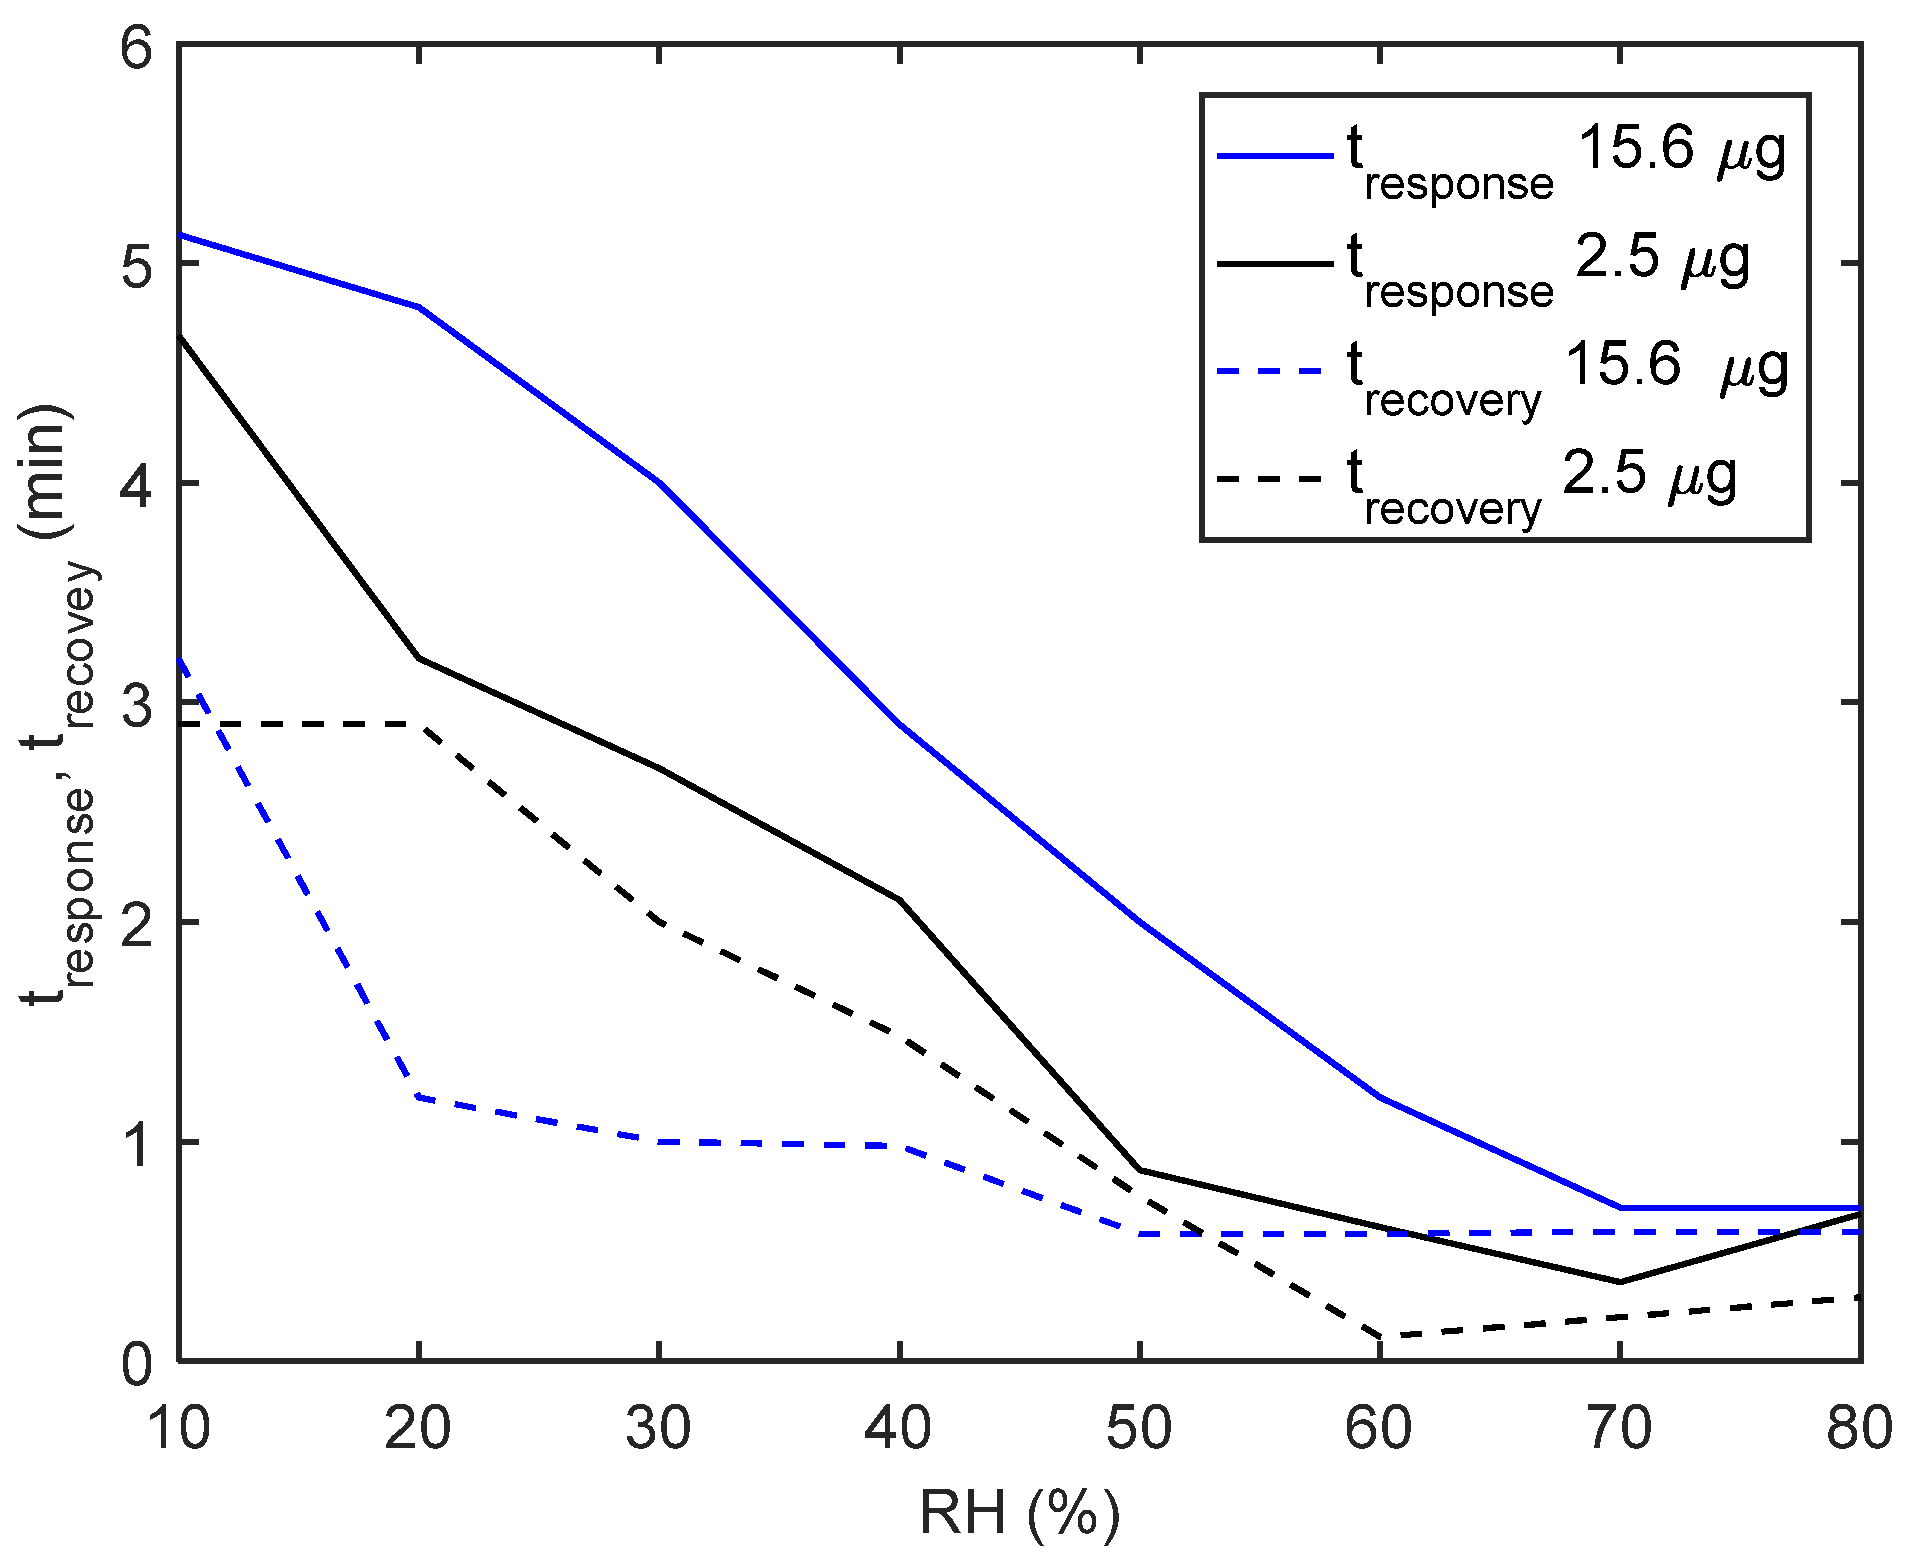
3.3. Transient Responses

To evaluate the dynamic behavior of the materials under study, tests with RH pulses and RH steps (staircase) covering the RH range 0–80% were performed and some results are reported in Figure 8a,b, respectively.
The dynamic response behavior can be explained by the superimposition of the adsorption/desorption kinetics, which is quite fast (response/recovery times in the order of about one minute), responsible for the behavior of the sensing films at low RH levels, and of capillary condensation, which is slower, and becomes relevant especially at high RH and is responsible particularly for the response in terms of motional resistance. Condensation causes slow transients of the sensor responses, which are more relevant for large RH discontinuities and sometimes do not vanish at the end of the RH cycle.
In detail, comparing the results shown in Figure 8a,b, it can be seen that small steps in the RH value are accompanied by a reduced contribution in the slow increase of the motional resistance and of the magnitude of the frequency shift, probably due to the fact that the pores and the voids are already partially filled with condensed water. On the other hand, for large variations of RH, as in the case of the RH pulses shown in Figure 8b, it can be seen that the effects attributed to condensation are more evident.
The response (10% to 90%) and recovery times (90% to 10%) of the frequency shift, measured with the staircase experiments shown in Figure 8b, have been evaluated. We use the definition of response time (tresponse) as the time taken for the sensor response to pass from 10% to 90% of the response step height (initial state to steady state) due to a step humidity change; in the same way, the recovery time (trecovery) is defined as the time the sensor needs to recover from 90% to 10% of the response step (from initial to steady state) after the removal of the humidity. As can be observed in Figure 9, they are all shorter than one minute for the RH value higher than 40%.
The films characterized by a smaller mass are slightly faster than those with a larger one. For lower humidity the response becomes slower, and increases with decreasing RH, reaching a rise time of about 5 min for RH = 10%. In the RH pulse experiments, the condensation phenomena take a major role, especially as far as the resistance is concerned, whose importance depends also on the random SWCNT network morphology, which is scarcely predictable. In general, and in all conditions the larger the SWCNT mass, the slower and the larger is this contribution. It is remarkable instead that in these experiments too, the recovery time appears less variable with the RH value and far shorter than the response time: therefore, fast evaporation occurs in the tested condition, i.e., under a flow of 200 mL/min.

4. Conclusions

The work shows the possibility of realizing a simple humidity sensor based on SWCNTs networks and QCMs. The mass balance was used to monitor the interactions of water molecules with the sensing material at a nanoscale level by measuring the changes in the resonance frequency and the motional resistance of the coated quartz. The measurement system is based on an ad hoc-designed oscillator circuit able to monitor in real time both the resonant frequency and the motional resistance of the quartz with an evaluated accuracy of approximately 1 Hz and tenth of Ohms, respectively. The interaction mechanism between water molecules and the sensing material was thoroughly investigated and characterized, exploiting the model presented in [9], intended as part 1 of this paper. Accordingly, both the water absorption mechanism and the physical change in the material at the quartz interface were taken into account and used to explain the observed sensor response, thus furthering knowledge concerning water absorption and its interaction with nanostructured carbon-based materials.
The investigated material showed a high response to humidity, in terms of resonant frequency, and response and recovery times of a few minutes even in the low humidity range; moreover, the non-linear behavior of the sensor response versus RH typical of nanostructured sensing materials was observed, which was explained by the formation of condensed water in the empty spaces and pores of the film. For sensors realized with the largest quantity of the sensing materials, the non-linear behavior can be noted already in the intermediate RH range (RH > 40%). This assumption is supported by the observed increase in the motional resistance at high RH levels, which reaches very large values (larger than 200 Ω) typical of viscous fluids. The large response of the SWCNT network, which corresponds to large adsorbed water masses (up to micrograms) is justified by a large active area.

Author Contributions

Conceptualization, A.F., E.P. and V.V.; methodology, A.F., E.P., L.P., C.V. and O.K.; validation, E.P., L.P. and A.A.-H.; formal analysis, A.F, M.M. and V.V.; investigation, E.P., A.L.G., C.V. and A.A.-H.; data curation, E.P., A.F., A.L.G., A.A.-H. and C.V.; writing—original draft preparation, A.F. and E.P.; writing—review and editing, V.V., M.M. and O.K. All authors have read and agreed to the published version of the manuscript.

Funding

This research received no external funding.

Conflicts of Interest

The authors declare no conflict of interest.

References

  1. Farahani, H.; Wagiran, R.; Hamidon, M.N. Humidity Sensors Principle, Mechanism, and Fabrication Technologies: A Comprehensive Review. Sensors 2014, 14, 7881–7939. [Google Scholar] [CrossRef] [PubMed] [Green Version]
  2. Nikolic, M.V.; Vasiljevic, Z.Z.; Lukovic, M.D.; Pavlovic, V.P.; Vujancevic, J.; Radovanovic, M.; Krstic, J.B.; Vlahovic, B.; Pavlovic, V.B. Humidity sensing properties of nanocrystalline pseudobrookite (Fe2TiO5) based thick films. Sens. Actuators B Chem. 2018, 277, 654–664. [Google Scholar] [CrossRef] [Green Version]
  3. Farzaneh, A.; Mohammadzadeh, A.; Esrafili, M.D.; Mermer, O. Experimental and theoretical study of TiO2 based nanostructured semiconducting humidity sensor. Ceram. Int. 2019, 45 Pt A, 8362–8369. [Google Scholar] [CrossRef]
  4. Fort, A.; Panzardi, E.; Vignoli, V.; Landi, E.; Mugnaini, M.; Carlo, T. Performance Analysis of an AlN Humidity Sensor based on TiO2 nanoparticles. In Proceedings of the 2019 IEEE International Symposium on Measurements & Networking (M&N), Catania, Italy, 8–10 July 2019; pp. 1–5. [Google Scholar]
  5. Chen, Z.; Lu, C. Humidity Sensors: A Review of Materials and Mechanisms. Sens. Lett. 2005, 3, 274–295. [Google Scholar] [CrossRef] [Green Version]
  6. Tulliani, J.-M.; Inserra, B.; Ziegler, D. Carbon-Based Materials for Humidity Sensing: A Short Review. Micromachines 2019, 10, 232. [Google Scholar] [CrossRef] [PubMed] [Green Version]
  7. Tripathy, A.; Pramanik, S.; Cho, J.; Santhosh, J.; Abu Osman, N.A. Role of Morphological Structure, Doping, and Coating of Different Materials in the Sensing Characteristics of Humidity Sensors. Sensors 2014, 14, 16343–16422. [Google Scholar] [CrossRef] [PubMed]
  8. Cappelli, I.; Fort, A.; Grasso, A.L.; Panzardi, E.; Mugnaini, M.; Vignoli, V. RH sensing by means of TiO2 nanoparticles: A comparison among different sensing techniques based on modeling and chemical/physical interpretation. Chemosensors 2020, 8, 89. [Google Scholar] [CrossRef]
  9. Fort, A.; Lo Grasso, A.; Mugnaini, M.; Panzardi, E.; Vignoli, V. QCM Measurements of RH with Nanostructured Carbon-Based Materials: Part 1—Theory and Model. Chemosensors 2022, 10, 315. [Google Scholar] [CrossRef]
  10. Johannsmann, D.; Langhoff, A.; Leppin, C. Studying Soft Interfaces with Shear Waves: Principles and Applications of the Quartz Crystal Microbalance (QCM). Sensors 2021, 21, 3490. [Google Scholar] [CrossRef] [PubMed]
  11. Lucklum, R.; Hauptmann, P. The quartz crystal microbalance: Mass sensitivity, viscoelasticity and acoustic amplification. Sens. Actuators B Chem. 2000, 70, 30–36. [Google Scholar] [CrossRef]
  12. Fort, A.; Trigona, C.; Panzardi, E.; Vignoli, V.; Addabbo, T.; Mugnaini, M. An AlN Micromachined Mass Sensor: Modeling and Characterization. IEEE Trans. Instrum. Meas. 2021, 70, 1–13. [Google Scholar] [CrossRef]
  13. Fort, A.; Panzardi, E.; Al-Hamry, A.; Vignoli, V.; Mugnaini, M.; Addabbo, T.; Kanoun, O. Highly Sensitive Detection of NO2 by Au and TiO2 Nanoparticles Decorated SWCNTs Sensors. Sensors 2020, 20, 12. [Google Scholar] [CrossRef] [PubMed] [Green Version]
  14. Fort, A.; Landi, E.; Grasso, A.L.; Mugnaini, M.; Panzardi, E.; Vaccarella, P.; Vignoli, V. QCM measurements in Newtonian liquids: Problems and performance analysis. IEEE Trans. Instrum. Meas. 2022, 71, 1–13. [Google Scholar] [CrossRef]
  15. Tan, F.; Qiu, D.Y.; Guo, L.P.; Ye, P.; Zeng, H.; Jiang, J.; Tang, Y.; Zhang, Y.C. Separate density and viscosity measurements of unknown liquid using quartz crystal microbalance. AIP Adv. 2016, 6, 095313. [Google Scholar] [CrossRef] [Green Version]
  16. Fort, A.; Panzardi, E.; Vignoli, V.; Tani, M.; Landi, E.; Mugnaini, M.; Vaccarella, P. An Adaptive Measurement System for the Simultaneous Evaluation of Frequency Shift and Series Resistance of QCM in Liquid. Sensors 2021, 21, 678. [Google Scholar] [CrossRef] [PubMed]
  17. Belovolova, L.V.; Glushkov, M.V. Porous Matrices and Specific Features of Water in Nanostructures. Phys. Wave Phen. 2021, 29, 249–277. [Google Scholar] [CrossRef]
  18. Zhao, J.; Buldum, A.; Han, J.; Lu, J.P. Gas Molecule Adsorption in Carbon Nanotubes and Nanotube Bundles. Nanotechnology 2001, 13, 195. [Google Scholar] [CrossRef]
  19. Yeow, J.T.W.; She, J.P.M. Capillary Condensation-Assisted Moisture Sensor Using Micro-/Nano-Materials. U.S. Patent US60/795198, 4 June 2005. [Google Scholar]
  20. Yeow, J.T.W.; She, J.P.M. Carbon nanotube-enhanced capillary condensation for a capacitive humidity sensor. Nanotechnology 2006, 17, 5441. [Google Scholar] [CrossRef]
  21. Craciun, F.; Guidarelli, G.; Galassi, C.; Roncari, E. Elastic wave propagation in porous piezoelectric ceramics. Ultrasonics 1998, 36, 427–430. [Google Scholar] [CrossRef]
  22. Addabbo, T.; Cappelli, I.; Fort, A.; Mugnaini, M.; Panzardi, E.; Vignoli, V.; Viti, C. The effect of au nanoparticle addition on humidity sensing with ultra-small TiO2 nanoparticles. Chemosensors 2021, 9, 170. [Google Scholar] [CrossRef]
Figure 1. Measurement system setup.
Chemosensors 10 00320 g001
Figure 2. AFM images of the SWCNT analyzed sample.
Chemosensors 10 00320 g002
Figure 3. TEM images of the SWCNT analyzed sample with scale bar 20 nm (a) and 3 nm (b) and (c). The inset in (a) shows a representative SAED pattern with ring-shaped diffraction effects, due to randomly oriented nanocrystals.
Chemosensors 10 00320 g003
Figure 4. TEM images of the SWCNT analyzed sample with scale bar 10 nm (a) whereas (b) reports a magnification detail highlighting the bent and irregular C lattice fringes.
Chemosensors 10 00320 g004
Figure 5. Measured responses of the functionalized QCMs as a function of the RH value. The tested QCMs are identified in the legend on the basis of the SWCNT deposited mass; (a)—frequency shift of the oscillator frequency with respect to frequency measured in dry air; (b)—motional resistance as measured by the adopted oscillator circuit.
Chemosensors 10 00320 g005
Figure 6. Response of functionalized QCM by 4 μg of solution by varying humidity up to RH = 100%. (a)—measured parameters in steady state conditions as a function of the RH levels; (b)—the transient behavior obtained with step changes in the humidity as a function of time (the duration of each RH% step is 4 min).
Chemosensors 10 00320 g006
Figure 7. Measured frequency shifts in the SWCNT-deposited mass. The mass is obtained from the frequency shift measurements in dry air of the pristine and functionalized quartz and exploiting Equation (1) as in [9], intended as part 1 of this paper.
Chemosensors 10 00320 g007
Figure 8. Dynamic response of the realized sensors in time by varying RH with pulses of 10% (a) and steps of 10% (b, staircase) covering the RH range 0–80%.
Chemosensors 10 00320 g008
Figure 9. The response (tresponse) and recovery times (trecovery) of the frequency shift measured with staircase experiments shown in Figure 8b.
Chemosensors 10 00320 g009
Publisher’s Note: MDPI stays neutral with regard to jurisdictional claims in published maps and institutional affiliations.

