Abstract
This work describes the technical features and the performance of two different types of metal-oxide semiconductor sensors, based on ZnO:Ga thin films and SnO2-G nanofibrous layers, for tropospheric ozone monitoring in ambient air. These nanostructures were tested and compared with commercial metal-oxide semiconductor sensors under controlled laboratory conditions and in a field campaign during summer 2021 in Monfragüe National Park (western Spain). The paper also details the design of the electronic device developed for this purpose. A machine learning algorithm based on Support Vector Regression (SVR) allowed the conversion of the resistive values into ozone concentration, which was evaluated afterward. The results showed that the manufactured sensors performed similarly to the commercial sensors in terms of R2 (0.94 and 0.95) and RMSE (5.21 and 4.83 μg∙m−3). Moreover, a novel uncertainty calculation based on European guides for air quality sensor testing was conducted, in which the manufactured sensors outperformed the commercial ones.
1. Introduction
Tropospheric ozone, also referred to as ground-level or surface ozone (hereinafter ozone), is a secondary air pollutant that results from a complex set of chemical processes involving precursor gases, namely methane (CH4), carbon monoxide (CO), and volatile organic compounds (VOCs), both of natural and anthropogenic origin, in the presence of nitrogen oxides (NOx) and sunlight [1]. Ozone has negative effects on human health [2,3,4] and is the second most harmful pollutant (after particulate matter) in terms of human mortality and morbidity [5,6]. In addition, ozone is hazardous to sensitive vegetation such as forests, crops, and grasslands [2,7,8,9,10,11,12] and is a greenhouse gas that contributes to climate change [13,14]. The World Health Organization (WHO) has established a limit value of 100 μg∙m−3 for the Maximum Daily 8 h Averaged (MDA8) concentration of ozone for the protection of human health, never to be exceeded [15]. The European air quality directive 2008/50/EC [16] is less restrictive as it sets a target value of 120 μg∙m−3 for the MDA8 concentration of ozone for the protection of human health, which can be exceeded up to 25 days per year averaged over 3 years. For protecting vegetation, the European directive uses the Accumulated Ozone over Threshold of 40 ppb (AOT40) metrics, which is the sum of hourly exceedances above 40 ppb (80 μg∙m−3) over the daylight hours during the growing season, and sets a target value of 18,000 μg∙m−3·h and a long-term objective of 6000 μg ∙m−3·h for 5 years averaged AOT40. The Europe-averaged AOT40 showed a declining trend in the period of 2000–2014 [17], which is attributed to the successful strategies to reduce ozone precursor emissions that have been put in place in Europe since the 1990s [18]. However, ozone trends differ largely between regions in Europe depending on aspects such as the location, population density, economic activity, orography, climate, and meteorology of the zone under study [19,20,21,22,23]. In 2019, 20 European countries (from a total of 32 reporting states based on 1665 air quality stations) registered ozone concentrations above the target value for the protection of health set by the European directive more than 25 times, and almost all rural background stations recorded ozone concentrations in excess of the limit recommended by the WHO [19]. It is well known that southwestern European countries are particularly exposed to exceedances of the ozone target value in summer due to the frequent anticyclones and clear-sky conditions, favoring photochemical ozone formation in the troposphere; the long-range transport of pollution from Europe, Asia, and even North America; and the own emission of ozone precursors from large urban agglomerations [24,25]. This explains the growing interest in air quality monitoring systems as distributed and localized monitoring of air pollution is crucial to determine the sources and causes of pollution and, hence, to provide solutions.
The standardized analyzers currently used for the monitoring of air quality for regulatory purposes are sophisticated pieces of equipment that are operated in thermally conditioned weatherproof cabins. The high acquisition, operational, and maintenance costs of the analyzers severely limit their massive deployment. As an example, the air quality network in Spain consists of around 4000 analyzers (for the monitoring of all regulated air pollutants) installed in about 600 stations distributed over an area of 506,000 km2. There is a need for reliable and accurate air quality data of higher temporal and spatial resolution and representativeness than the official air quality networks, to efficiently control pollutant emissions [26,27]. To this aim, the number of commercial products and research prototypes for atmospheric surveillance that rely on low-cost sensors and are easy to deploy in the field has multiplied in recent years, thanks to advanced manufacturing technologies that allow for a high level of integration of miniaturized sensors in ever smaller, lighter, and more simplified devices [28,29,30]. These are paving the way for environmental monitoring through Wireless Sensor Networks (WSNs) and Internet of Things (IoT) devices capable of processing the data gathered by the WSN and transmitting them over long distances [31]. However, there are still many concerns about the quality assurance of air pollution data obtained by using low-cost sensors, especially from the regulatory bodies [32,33,34].
Among the variety of sensor technologies for the detection of gas pollutants on the market, resistive sensors based on gas-sensitive layers of metal-oxide semiconductors (MOS) are the ones that are receiving the most attention [35]. The resistance of the pre-heated MOS layer varies depending on the concentration of the target gas in the air, generating a proportional current flow in the circuit. The pros and cons of the MOS sensors compared to their main competitors in the market, the electrochemical sensors, have been widely discussed [36]. The inherent advantages of the MOS sensors are its ability to work at high temperature while maintaining a longer service life compared to other types of gas sensors (e.g., electrochemical sensors); its high sensitivity and fast response; its low cost, capability for large-scale manufacturing, and potential for miniaturization (e.g., sensors based on Micro-Electro-Mechanical Systems or MEMS sensors) and integration into IoT devices, smart gadgets, and wearable and mobile consumer devices [37,38]. Its major drawbacks are the need to heat the MOS layer, requiring a relatively high operating power; the cross-sensitivity to ambient temperature and humidity, and to gases other than the target gas present in the air; and the loss of sensitivity of the MOS surface over time [39,40,41]. Intensive research is being conducted on MOS nanomaterials of all dimensionalities and of tailored surface properties (e.g., composition, micro/nanostructure, and porosity) with the aim of improving the low-temperature sensing performance (e.g., limit of detection, sensitivity, and selectivity toward specific gases, response, and recovery times) of the MOS sensors [42,43,44,45,46,47,48,49]. Ideally, they should work at room temperature and have zero power consumption, which will enable its large-scale deployment in WSNs for air quality applications [50]. MOS sensors are widely used for measuring ozone in air [51]. Generally, commercial ozone sensors use thick or thin films of tungsten oxide (WO3), indium and tin oxide (ITO), and other oxides, which are deposited by sputtering, and the power consumption ranges from 40 to 400 mW [52,53,54,55]. In addition, engineered functional nanomaterials obtained by mixing, doping, or surface-decoration of MOS with other oxides, noble metal nanoparticles, or carbon nanomaterials have been demonstrated for sensing ozone in the laboratory [56].
In this work, self-developed microsensors using nanostructured gas-sensitive layers of two types: thin films of zinc oxide doped with gallium (ZnO:Ga), and nanofibrous layers of tin dioxide, pure (SnO2), and doped with graphene (SnO2:G), were used for real-time measurement of ozone in ambient air in a rural area in southwestern Europe (Monfragüe natural park, Spain). For this purpose, automated multisensor devices were designed and fabricated: one device for each of the two types of MOS microsensors under study, and one more device for a set of commercial MOS sensors commonly used in air quality applications.
2. Materials and Methods
2.1. Metal Oxide Gas Sensors
The air pollutant sensors used in this work were electrically transduced sensors of the resistive type with MOS as the gas-sensitive material. Both commercial sensors and home-made sensor prototypes, the latter including nanostructured MOS layers, were used here to monitor ozone in the air in a natural park.
2.1.1. Commercial Sensors
A total of eight commercial sensors of models MiCS 2714, 4514, and 6814 (SGX SensorTech Ltd., Corcelles-Cormondreche, Switzerland) and SP3-61 (Nissha FIS, Inc., Osaka, Japan) were used in this study. As this multisensor device was not built with a specific area of study in mind, it integrates sensors for different target pollutants. The MiCS sensors consist of a silicon substrate including a micro-machined diaphragm with an embedded heater and a MOS layer on top. The SP3-61 sensor is composed of an alumina substrate with a printed heater (bottom) and electrodes (top) and a thin film of ITO on the electrodes. Table 1 shows the concentration range of the target gases covered by the sensors and their rated power, as reported by the manufacturers.

Table 1.
Commercial Sensors.
In the past, these sensors have been used to monitor air quality in urban areas for different purposes [52,53,54,55,57,58].
2.1.2. Nanostructured Sensors
Sensors using MOS nanostructures as the active material, henceforth referred to as nanosensors, were manufactured. In the first place, four ultrathin dielectric membranes were processed on a silicon substrate by MEMS technology. Each membrane contains a heating resistor and two interdigitated electrodes that are isolated from each other and from the heating resistor. The assembly is known as a microhotplate. Then, the electrodes were coated with MOS nanostructures to be electrically measured. The materials, geometries, and manufacture process of the microhotplates have been described elsewhere [59,60,61]. Two different microhotplate structures were used in this work. The first one had heating and measuring electrodes on the same level and was used for materials deposited by the electrospinning deposition process (Figure 1). To avoid the problem of the high SiO2 step to be covered for very thin (25 nm to 50 nm) sputtered layers, another design was used in which the measuring electrode was moved to a level above (Figure 2). This last configuration allowed the reduction in the inter-electrode space from 60 µm to 15 µm, which also permitted the measurement of higher-resistive materials.
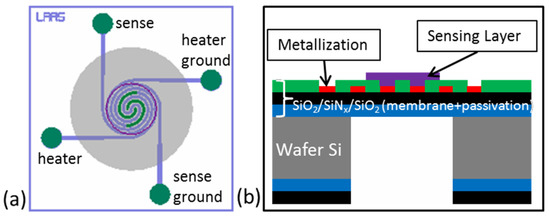
Figure 1.
Microhotplate gas sensor with heater and sensing electrodes at the same metallization level: (a) chip top view; (b) cross-sectional view.
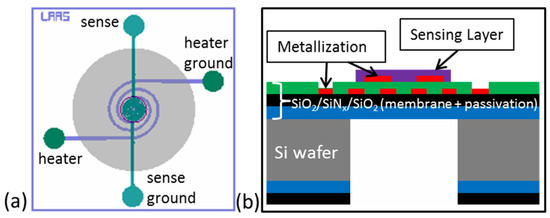
Figure 2.
Microhotplate gas sensor with encapsulated heater and very close sensing electrodes at the surface: (a) chip top view; (b) cross-sectional view.
Two types of nanostructured sensing layers were prepared on the top surface of the microhotplates. On the one hand, thin films of zinc oxide doped with gallium (ZnO:Ga) were grown by magnetron sputtering under pure argon from a self-made oxide target [62] on microhotplates, as shown in Figure 2. On the other hand, highly porous mats of nanofibers of tin dioxide (SnO2) were deposited by electrospinning a polymeric solution containing a tin salt and eventually graphene (G) followed by calcination [63] on microhotplates, as displayed in Figure 1.
Three multisensor platforms (each platform contains 4 microhotplates) were coated with thin films of ZnO:Ga. One multisensor platform was coated with nanofibers of SnO2 and three platforms were coated with nanofibers of SnO2 loaded with different graphene materials (SnO2:G): reduced graphene oxide (RGO, E800, Abalonyx AS, Oslo, Norway), pristine graphene (PG, 900561, Sigma-Aldrich, Saint Louis, MO, USA), and graphene nanoplatelets (GNPL, 900407, Sigma-Aldrich, Saint Louis, MO, USA). The gas (NO2 and O3) detection behavior of the nanosensors was tested in the lab and the ones that showed the best performance are summarized in Table 2 (two nanosensors from each platform). There were a total of fourteen nanosensors using ZnO:Ga films of 25 nm and 50 nm thickness, nanofibrous layers of SnO2, and nanofibrous layers of SnO2:G.

Table 2.
Nanosensors.
Lab measurements were conducted with the MOS sensors and mixtures of ozone in air (25–500 ppb). The sensors using SnO2 nanofibers were very sensitive to ozone over a broad temperature range (20–400 °C). The optimal working temperature (at which the sensor response reached a maximum) was 350 °C (SnO2) and 200 °C (SnO2:G) [64]. It was decided then to operate the nanosensors of SnO2 in the continuous heating mode at 14.5 mW (~100 °C) and 41 mW (~350 °C). On the other hand, the sensors based on ZnO:Ga were measured by heating the microhotplate between 100 °C and 400 °C. The best response was obtained at 25 mW (~205 °C). For a heating power equal to or greater than 35 mW (~305 °C), a drift in the sensor response was found. Two measuring modes were used for these nanosensors: a classical continuous heating mode at 25 mW (~250 °C) and an alternating heating mode in which the sensor was heated alternately between 5 mW and 25 mW for 3 min.
Figure 3a,b display the commercial sensors used in this work. They are encapsulated and the housings have openings that allow access of the gas to the MOS film inside. Figure 2c shows the selected arrangement for the nanosensors. The multisensor platform is bonded to the top surface of a standard TO-8 header and the electrodes and heater of the microhotplates are wired to the pins of the header.
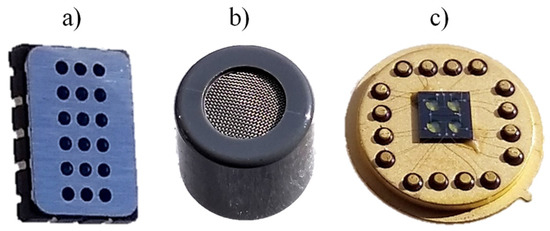
Figure 3.
OEM sensors: (a) MiCS 2714 (5.5 × 7.5 × 2.5 mm) and (b) SP3–61 (Ø 14 mm, h 13 mm), and (c) bare TO-8 header (Ø 15.25 mm, h 1.5 mm) with self-designed multisensor silicon platform (4 nanosensors) on top.
2.2. Air Pollution Monitoring Devices
2.2.1. Device Design
We developed and manufactured multisensor devices for measuring air pollution in real-time, each one using a different type of MOS sensor. The devices were labeled CO (commercial sensors), CS (nanosensors based on nanofibers of SnO2 or SnO2:G), and CN (nanosensors using thin films of ZnO:Ga). Sensor holder PCBs were specifically designed for each type of sensor. Each PCB could host up to 8 gas sensors of the same type and a temperature and humidity sensor (SHT21, Sensirion AG, Stäfa, Switzerland). The devices were controlled by the low-power, RISC-based, 8-bit ATMega2650 microcontroller (Microchip Technology Inc., Chandler, AZ, USA). This met the needs of the device, with features such as 256 KB of ISP flash memory, 8 KB of SRAM, 4 KB of EEPROM, 86 general-purpose I/O lines, 32 general-purpose working registers, a PWM, four USARTs, a 16-channel 10-bit A/D converter, and a JTAG interface for on-chip debugging. The device achieved a performance of 16 MIPS at 16 MHz. Readout of the sensors was performed via an external low-power 24-bit, 8-channel analog–digital converter, which allowed the acquisition of up to 15 samples per second. Three selectable bias voltages (5 V, 3.3 V, and 2.5 V) were implemented for added versatility. In addition, two measuring ranges were implemented to optimize the resolution of the measurements. These were automatically selected by the implemented program according to the measured sensor resistance. In addition, the voltage supplied to the sensor heating elements was controlled by two 12-bit, 4-channel digital-to-analog converters. In order to track the control of heaters, the current was measured with a current shunt monitor. Regarding communications, the device implements a USB port (modbus-RTU by default), Ethernet, and WiFi. Moreover, the system stores the data in a local μSD card. A real-time clock is included in the design to allow the user to know the time when there is no internet connection. With respect to the pneumatic design, the unit is equipped with an active sampling system. It includes a pneumatic pump with variable control, which produces a 0.5 L min-1 airflow to the sensors, and an electrovalve that allows the system to switch from two gas sample inlets. Moreover, a resin cell was developed to encase the sensors. The whole device was powered by a 230 VAC 50 Hz power supply. Figure 4 shows a picture of one of the devices and some key parts.
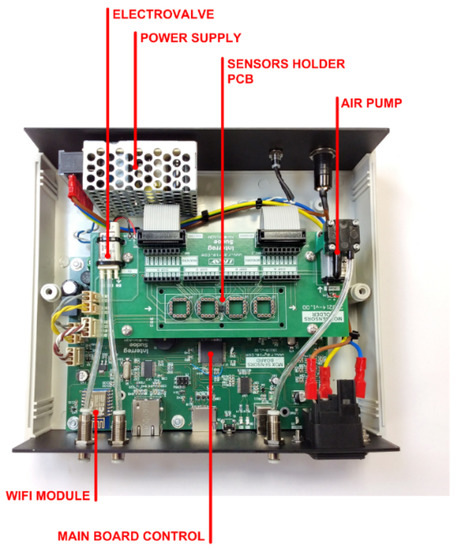
Figure 4.
The multisensor device for the monitoring of air pollution and its main components.
2.2.2. Laboratory Measurements
Measurements were performed in the laboratory with the multisensor devices and ozone-air mixtures from a commercial ozone source (model 714 NO2/NO/O3 Calibration Source, 2B Technologies, Boulder, CO, USA), which generates ozone by photolysis of molecular oxygen in the air. The concentration of ozone was increased from 0 ppb to 200 ppb in 5 steps of a duration of 10 min each. The measurements were repeated 3 times on different days in order to assess the sensor performance and the repeatability of the results. Figure 5 shows the results corresponding to the three devices (CO, CN, and CS). For simplicity, only one sensor of each kind is shown.
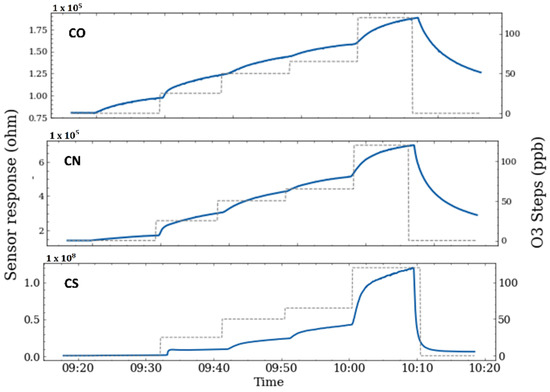
Figure 5.
Response of commercial nanosensors (CO), ZnO:Ga based sensors (CN), and SnO2 nanofibrous layer sensors (CS), to an increasing concentration of ozone in air under laboratory conditions.
2.3. Field Campaign
2.3.1. Monfragüe National Park
The devices for the monitoring of air pollution by means of MOS sensors were deployed during the summer of 2021 in Monfragüe National Park, a protected natural zone (Natural Park and Biosphere Reserve) located in the province of Cáceres (Extremadura) in Spain. It covers an area of 179 km2 and has an air quality station from the Air Quality Protection and Research Network of Extremadura (REPICA) inside (Figure 6).
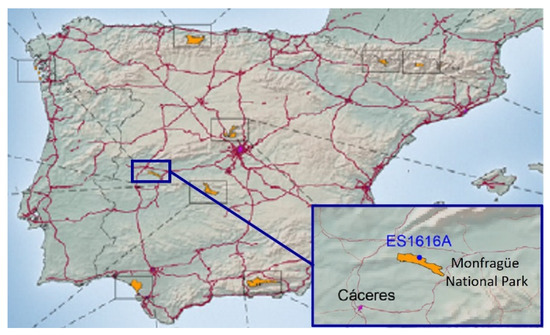
Figure 6.
Map of the Spanish National Parks. The inset shows the air quality station (ES1616A) at Monfragüe National Park.
Historical air quality data reveal that ozone concentrations beyond the target value for the protection of human health occur more than 25 times every year at Monfragüe National Park. For instance, 32 exceedances were recorded in 2020 for ozone [65], despite the noticeable reduction in air pollution observed globally as a result of the COVID-19 pandemic. It is also usually in summer that ozone is at its highest level. This is explained by the large emissions of VOCs (mainly of natural origin), high temperatures, and intense solar radiation prevailing in summer in Extremadura [66,67]. On the other hand, the concentrations of other gas pollutants (e.g., NO2 and CO) remain very low throughout the year, well below the limit values for protecting health. This situation makes Monfragüe National Park an ideal environment to assess the detection performance of the MOS sensors toward ozone, without interferences from other gases.
The multisensor devices were collocated next to the air quality station at Monfragüe National Park, which was used as a reference. It supplies hourly average values of the concentration in air of all pollutants regulated by the European directive. Specifically, the station includes a UV photometer (model 49i-B3ZAA, Thermo Fisher Scientific, Waltham, MA, USA) as an ozone analyzer. The devices were synchronized with the station and recorded pollutant concentration values every 5 s. After the field campaign, the data from the devices were averaged over 1 h periods. Figure 7 displays the response of the MOS sensors after applying normalization (0,1) and linear drift counteraction. Commercial sensors CO3 and CO7 exhibited anomalous behavior and their data were dismissed.
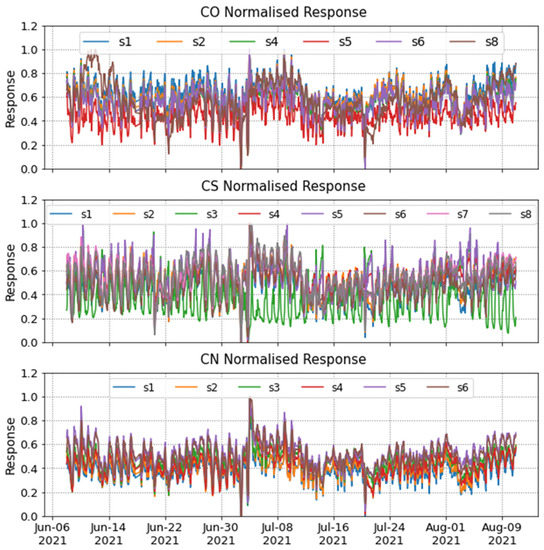
Figure 7.
Normalized response of MOS sensors (CO, CS, and CN) during the summer campaign at Monfragüe National Park.
2.3.2. Sensor Calibration
In order to calibrate the multisensor devices to measure ozone, we built a machine learning model. This model was a SVR with a polynomial kernel. For each device (CO, CS, and CN), the sensors response was split into two sets (training and test) by randomly selecting 30% of the data for training and the remaining 70% for testing. It is well known that MOS sensors are affected by ambient temperature and humidity and, thus, these parameters were also measured and used as inputs to the model [57,68].
By feeding the training set and the corresponding reference values into the SVR, the model was fitted. Then, using the test set, the model was able to calculate three values of the ozone concentration, one for each device. To assess the goodness of the ozone data achieved with each device, the coefficient of determination (R2) and the Root-Mean-Squared Error (RMSE) were used, as well as the parameters from the least squares regression line.
2.3.3. Data Uncertainty
The uncertainty of the data from the multisensor devices was calculated following the protocol recommended by the EC Working Group on Guidance for the Demonstration of Equivalence [69], which is based on the orthogonal regression of the sensor data against the reference data. The relative expanded uncertainty (at the limit value) was calculated by (1), where a and b are the intercept and slope of the orthogonal regression, respectively, is the number of measurements results, is the uncertainty of the reference analyzer, and RSS is the sum of squares of relative residuals (2) or absolute residuals (3). More details on the calculation of the relative expanded uncertainty can be found in the Guide to the demonstration of equivalence [69].
3. Results and Discussion
3.1. Sensor Calibration
Figure 8 shows the results of the calibration of the devices’ CO, CS, and CN against the ozone analyzer. The scatter plots show the distribution of the measured ozone concentration values as well as the values of R2, RMSE, and a and b regression coefficients. This values are also summarized in Table 3.
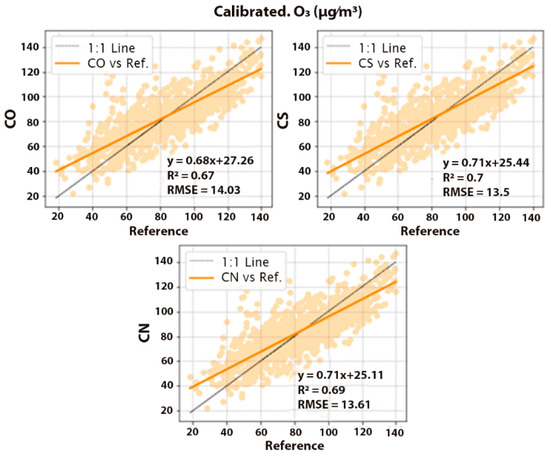
Figure 8.
Calibration scatterplots for ozone concentration: Multisensor devices’ CO, CS, and CN vs. reference analyzer. Light orange dots represent the individual points sensor—reference, the orange line is the least squares regression line, and the black line represents the x = y line. Units are in μg·m−3.

Table 3.
Calibration metrics. Sensor vs, Reference.
The devices based on MOS nanosensors showed a moderate correlation with the reference analyzer, with values of R2 of 0.70 and 0.69 for CS and CN, respectively. This was also the case for the device based on commercial MOS sensors (R2 of 0.67 for CO). The RMSE values were 13.50 μg·m−3, 13.61 μg·m−3, and 14.03 μg·m−3 for the devices’ CS, CN, and CO, respectively. The maximum deviation in RMSE was 7% for CN, and it was less than 5% for the devices’ CS and CO. Moreover, if the CS and CN devices are directly compared with the commercial sensors (Figure 9), satisfactory performances of CS and CN are assessed.
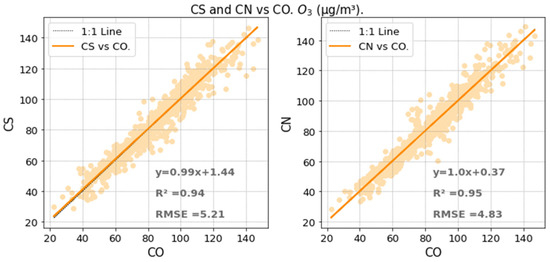
Figure 9.
Correlation scatterplots for ozone concentration: Nanosensors CS (left) and CN (right) vs. commercial sensors CO. Units in μg∙m−3.
3.2. Data Uncertainty
To evaluate the performance of the multisensor devices, the measurement uncertainty was calculated following the methodology described in Section 3.
Table 4 shows relevant statistical parameters of the orthogonal regression and the relative expanded uncertainty for each multisensor device. Regarding statistical analysis of the CO, CN, and CS devices, a positive systematic error was detected in the intercept, as 0 was not included between the 95% confidence limits. A systematic error was also detected for the slope as the value of 1 was not between the 95% confidence limits. The relative expanded uncertainties (at limit value) were 20.41%, 19.39%, and 19.45% for CO, CN, and CS devices, respectively, which means better results were obtained with CN and CS devices compared to CO. However, in all cases, the uncertainty values were less than 30%, thus meeting the uncertainty requirement of European directive 2008/520/CE for indicative measurements [16].

Table 4.
Orthogonal Regression Parameter for devices’ CO, CN, and CS.
Other authors have conducted similar studies with MOS sensors (commercial or prototype devices). For example, [70] used SVR to calibrate an array of sensors and classify the data after extracting features based on the Relief method. On the other hand, [71] built a neural network to process the data acquired from an array of MOS sensors to evaluate the impact of NO2, NH3, and CH4 in agriculture applications. Even though both papers showed promising results, neither of them (as with many others in the literature) performed the measurement uncertainty calculation shown in this work, which we believe should play a relevant role in sensor performance evaluation, e.g., the European regulation on air quality includes maximum uncertainty requirements to validate air pollution monitoring equipment.
4. Conclusions
In this work, we have demonstrated the real-world applicability of newly developed resistive sensors using MOS nanostructures as gas-sensitive material (nanosensors) for the purpose of measuring ozone in ambient air. One type of nanosensor is based on ZnO:Ga thin films, while another type is formed by nanofibers of SnO2 or SnO2:G. The performance of the MOS nanosensors and of a selected commercial MOS sensor for ozone was assessed against a reference analyzer in a field measurement campaign in a natural environment characterized by a low pollution level. Both the nanosensors and the commercial sensor performed similarly and showed a moderate correlation with the reference (R2 of 0.67–0.7) and a deviation in terms of RMSE of 13.50–14.03 μg∙m−3, which is about 10% of the maximum ozone concentration. Furthermore, the nanosensors exhibited a great performance when compared with the commercial sensor (R2 of 0.94 and 0.95, RMSE of 5.21 μg∙ m−3 and 4.83 μg∙m−3, and offset of 1.44 μg∙m−3 and 0.37 μg∙m−3), while the former operated at powers at least a factor of 10 lower than the latter. In addition, for the first time, we calculated the uncertainty in the sensor measurements using a recognized method, which resulted in uncertainty values of less than 30% for both the nanosensors and the commercial sensor. This is a promising result toward the adoption of low-cost sensors for indicative air quality measurements.
Author Contributions
Conceptualization, J.L. and E.H.; methodology, E.P.-G.; software, J.G.-S.; validation, P.A., E.P.-G. and M.C.-Á.; formal analysis, J.G.-S.; investigation, R.A., S.M., P.M. and L.P.; resources, E.H., P.M., L.P. and R.A.; data curation, J.G.-S. and M.C.-Á.; writing—original draft preparation, J.G.-S.; writing—review and editing, P.A.; visualization, S.M.; supervision, J.L.; project administration, E.H.; funding acquisition, E.H. All authors have read and agreed to the published version of the manuscript.
Funding
This research was funded by the European Regional Development Fund (European Commission) through the V Interreg Sudoe Programme under GA SOE2/P1/E0569—NanoSen-AQM project.
Institutional Review Board Statement
Not applicable.
Informed Consent Statement
Not applicable.
Acknowledgments
Authors want to thank the EU for supporting the NanoSen-AQM (SOE/P1/E0569) project and the Spanish Ministry of Science and Innovation for supporting the NEOGAS project (PID2019-107697RB). This work was partly supported by LAAS-CNRS micro and nano technolgies platform member of the French RENATECH network.
Conflicts of Interest
The authors declare no conflict of interest.
References
- Warneck, P. Ozone in the trophosphere. In Chemistry of the Natural Atmosphere; Academic Press Inc.: London, UK, 1988; Volume 41, pp. 176–222. [Google Scholar]
- Agrawal, S.B.; Agrawal, M.; Singh, A. Tropospheric Ozone: A Hazard for Vegetation and Human Health; Cambridge Scholars Publishing: Newcastle upon Tyne, UK, 2021. [Google Scholar]
- Ryffel, B.; Hamacher, J.; Manoussa Ethel Fanny, S.; Erard, F.; Zhang, J.; Wei, Y.; Fang, Z. Ozone Pollution: A Major Health Hazard Worldwide. Front. Immunol. 2019, 10, 2518. [Google Scholar] [CrossRef]
- World Health Organization (WHO). Health Risks of Ozone from Long-Range Transboundary Air Pollution; WHO Regional Office for Europe: Geneva, Switzerland, 2008; ISBN 9789289042895. [Google Scholar]
- Nuvolone, D.; Petri, D.; Voller, F. The effects of ozone on human health. Environ. Sci. Pollut. Res. 2017, 25, 8074–8088. [Google Scholar] [CrossRef]
- Malley, C.S.; Henze, D.K.; Kuylenstierna, J.C.I.; Vallack, H.W.; Davila, Y.; Anenberg, S.C.; Turner, M.C.; Ashmore, M.R. Updated Global Estimates of Respiratory Mortality in Adults ≥30 Years of Age Attributable to Long-Term Ozone Exposure. Environ. Health Perspect. 2017, 125, 87021. [Google Scholar] [CrossRef]
- Grulke, N.E.; Heath, R.L. Ozone effects on plants in natural ecosystems. Plant Biol. 2019, 22, 12–37. [Google Scholar] [CrossRef]
- Emberson, L. Effects of ozone on agriculture, forests and grasslands. Philos. Trans. A Math. Phys. Eng. Sci. 2020, 378, 20190327. [Google Scholar] [CrossRef]
- Jakovljević, T.; Lovreškov, L.; Jelić, G.; Anav, A.; Popa, I.; Fornasier, M.F.; Proietti, C.; Limić, I.; Butorac, L.; Vitale, M.; et al. Impact of ground-level ozone on Mediterranean forest ecosystems health. Sci. Total Environ. 2021, 783, 147063. [Google Scholar] [CrossRef]
- Wang, Y.; Wild, O.; Ashworth, K.; Chen, X.; Wu, Q.; Qi, Y.; Wang, Z. Reductions in crop yields across China from elevated ozone. Environ. Pollut. 2022, 292, 118218. [Google Scholar] [CrossRef]
- Sharps, K.; Hayes, F.; Harmens, H.; Mills, G. Ozone-induced effects on leaves in African crop species. Environ. Pollut. 2021, 268, 115789. [Google Scholar] [CrossRef]
- Dolker, T.; Agrawal, M. Negative impacts of elevated ozone on dominant species of semi-natural grassland vegetation in Indo-Gangetic plain. Ecotoxicol. Environ. Saf. 2019, 182, 109404. [Google Scholar] [CrossRef]
- Ainsworth, E.A.; Yendrek, C.R.; Sitch, S.; Collins, W.J.; Emberson, L.D. The Effects of Tropospheric Ozone on Net Primary Productivity and Implications for Climate Change. Annu. Rev. Plant Biol. 2012, 63, 637–661. [Google Scholar] [CrossRef]
- Shindell, D.; Faluvegi, G.; Lacis, A.; Hansen, J.; Ruedy, R.; Aguilar, E. Role of tropospheric ozone increases in 20th-century climate change. J. Geophys. Res. 2006, 111, D08302. [Google Scholar] [CrossRef]
- World Health Organization. WHO Global Air Quality Guidelines: Particulate Matter (PM2.5 and PM10), Ozone, Nitrogen Dioxide, Sulfur Dioxide and Carbon Monoxide; WHO: Geneva, Switzerland, 2021; ISBN 978-92-4-003422-8. [Google Scholar]
- Karpus, K. Implementation of directive 2008/50/EC of 21 May 2008 on Ambient Air Quality and Cleaner Air for Europe in Polish environmental law. Polish Yearb. Environ. Law 2012, 2, 63–82. [Google Scholar] [CrossRef][Green Version]
- Cooper, O.R.; Parrish, D.D.; Ziemke, J.; Balashov, N.V.; Cupeiro, M.; Galbally, I.E.; Gilge, S.; Horowitz, L.; Jensen, N.R.; Lamarque, J.-F.; et al. Global distribution and trends of tropospheric ozone: An observation-based review. Elem. Sci. Anthr. 2014, 2, 000029. [Google Scholar] [CrossRef]
- Proietti, C.; Fornasier, M.F.; Sicard, P.; Anav, A.; Paoletti, E.; De Marco, A. Trends in tropospheric ozone concentrations and forest impact metrics in Europe over the time period 2000–2014. J. For. Res. 2020, 32, 543–551. [Google Scholar] [CrossRef]
- European Environmental Agency (EEA). Air Quality in Europe—2020 Report; EEA Report No 9/2020; Publications Office of the European Union: Luxembourg, 2020. [Google Scholar] [CrossRef]
- Viana, M.; Padrosa, M.; Querol, X.; Alastuey, A.; Benesova, N.; Krejčí, B.; Volná, V.; Real, E.; Colette, A.; de Leeuw, F.; et al. Ozone in Southern Europe—Assessment and Effectiveness of Measures. European Tropic Center on Air Pollution and Climate Change Mitigation (ETC/ACM), Technical Paper 2017/3. 2017. Available online: http://www.eionet.europa.eu (accessed on 11 November 2022).
- Querol, X.; Alastuey, A.; Pandolfi, M.; Reche, C.; Pérez, N.; Minguillón, M.C.; Moreno, T.; Viana, M.; Escudero, M.; Orio, A.; et al. 2001–2012 trends on air quality in Spain. Sci. Total Environ. 2014, 490, 957–969. [Google Scholar] [CrossRef]
- García, M.Á.; Villanueva, J.; Pardo, N.; Pérez, I.A.; Sánchez, M.L. Analysis of ozone concentrations between 2002–2020 in urban air in Northern Spain. Atmosphere 2021, 12, 1495. [Google Scholar] [CrossRef]
- Adame, J.A.; Gutiérrez-Álvarez, I.; Cristofanelli, P.; Notario, A.; Bogeat, J.A.; López, A.; Gómez, A.; Bolívar, J.P.; Yela, M. Surface ozone trends over a 21-year period at El Arenosillo observatory (Southwestern Europe). Atmos. Res. 2022, 269, 106048. [Google Scholar] [CrossRef]
- Pay, M.T.; Gangoiti, G.; Guevara, M.; Napelenok, S.; Querol, X.; Jorba, O.; García-Pando, C.P. Ozone source apportionment during peak summer events over southwestern Europe. Atmos. Chem. Phys. 2019, 19, 5467–5494. [Google Scholar] [CrossRef]
- Cristofanelli, P.; Bonasoni, P. Background ozone in the southern Europe and Mediterranean area: Influence of the transport processes. Environ. Pollut. 2009, 157, 1399–1406. [Google Scholar] [CrossRef]
- Maiheu, B.; Janssen, B. Assessing the Spatial Representativeness of Air Quality Sampling Points—Literature Review; Ricardo, N.B.V., Ed.; Report for European Commission—DG Environment, Ricardo/ED11492; Ricardo Nederland B.V.: Utrecht, The Netherlands, 2019. [Google Scholar]
- Galán-Madruga, D. Chapter 3: Importance of Air Quality Networks in Controlling Exposure to Air Pollution. In Environmental Emissions; IntechOpen Ltd.: London, UK, 2021. [Google Scholar] [CrossRef]
- Castell, N.; Dauge, F.R.; Schneider, P.; Vogt, M.; Lerner, U.; Fishbain, B.; Broday, D.; Bartonova, A. Can commercial low-cost sensor platforms contribute to air quality monitoring and exposure estimates? Environ. Int. 2017, 99, 293–302. [Google Scholar]
- Liu, X.; Jayaratne, R.; Thai, P.; Kuhn, T.; Zing, I.; Christensen, B.; Lamont, R.; Dunbabin, M.; Zhu, S.; Gao, J.; et al. Low-cost sensors as an alternative for long-term air quality monitoring. Environ. Res. 2020, 185, 109438. [Google Scholar] [CrossRef]
- Karagulian, F.; Barbiere, M.; Kotsev, A.; Spinelle, L.; Gerboles, M.; Lagler, F.; Redon, N.; Crunaire, S.; Borowiak, A. Review of the Performance of Low-Cost Sensors for Air Quality Monitoring. Atmosphere 2019, 10, 506. [Google Scholar] [CrossRef]
- Majid, M.; Habik, S.; Javed, A.R.; Rizwan, M.; Srivastava, G.; Gadekallu, T.R.; Lin, J.C.-W. Applications of Wireless Sensor Networks and Internet of Things Frameworks in the Industry Revolution 4.0: A Systematic Literature Review. Sensors 2022, 22, 2087. [Google Scholar] [CrossRef]
- Clements, A.L.; Griswold, W.G.; Abhijit, R.S.; Johnston, J.E.; Herting, M.M.; Thorson, J.; Collier-Oxandale, A.; Hannigan, M. Low-Cost Air Quality Monitoring Tools: From Research to Practice (A Workshop Summary). Sensors 2017, 17, 2478. [Google Scholar] [CrossRef]
- Williams, D.E. Low Cost Sensor Networks: How Do We Know the Data Are Reliable? ACS Sens. 2019, 4, 2558–2565. [Google Scholar] [CrossRef]
- Lewis, A.; Edwards, P. Validate personal air-pollution sensors. Nature 2016, 535, 29–31. [Google Scholar] [CrossRef]
- Nikolic, M.V.; Milovanovic, V.; Vasiljevic, Z.Z.; Stamenkovic, Z. Semiconductor Gas Sensors: Materials, Technology, Design, and Application. Sensors 2020, 20, 6694. [Google Scholar] [CrossRef]
- Narayana, M.V.; Jalihal, D.; Shiva Nagendra, S.M. Establishing A Sustainable Low-Cost Air Quality Monitoring Setup: A Survey of the State-of-the-Art. Sensors 2022, 22, 394. [Google Scholar] [CrossRef]
- Gomes, J.B.A.; Rodrigues, J.J.P.C.; Rabêlo, R.A.L.; Kumar, N.; Kozlov, S. IoT-Enabled Gas Sensors: Technologies, Applications, and Opportunities. J. Sens. Actuator Netw. 2019, 8, 57. [Google Scholar] [CrossRef]
- Rüffer, D.; Hoehne, F.; Bühler, J. New Digital Metal-Oxide (MOx) Sensor Platform. Sensors 2018, 18, 1052. [Google Scholar] [CrossRef]
- Ji, H.; Zeng, W.; Li, Y. Gas sensing mechanisms of metal oxide semiconductors: A focus review. Nanoscale 2019, 11, 22664–22684. [Google Scholar] [CrossRef]
- Kamarudin, K.; Bennetts, V.H.; Mamduh, S.M.; Visvanathan, R.; Yeon, A.S.A.; Shakaff, A.Y.M.; Zakaria, A.; Abdullah, A.H.; Kamarudin, L.M. Cross-sensitivity of metal oxide gas sensor to ambient temperature and humidity: Effects on gas distribution mapping. AIP Conf. Proc. 2017, 1808, 020025. [Google Scholar]
- Wang, C.; Yin, L.; Zhang, L.; Xiang, D.; Gao, R. Metal Oxide Gas Sensors: Sensitivity and Influencing Factors. Sensors 2010, 10, 2088–2106. [Google Scholar] [CrossRef]
- Isaac, N.A.; Pikaar, I.; Biskos, G. Metal oxide semiconducting nanomaterials for air quality gas sensors: Operating principles, performance, and synthesis techniques. Microchim. Acta 2022, 189, 196. [Google Scholar] [CrossRef]
- Liu, J.; Zhang, L.; Fan, J.; Yu, J. Semiconductor Gas Sensor for Triethylamine Detection. Small 2022, 18, 2104984. [Google Scholar] [CrossRef]
- Xue, S.; Cao, S.; Huang, Z.; Yang, D.; Zhang, G. Improving Gas-Sensing Performance Based on MOS Nanomaterials: A Review. Materials 2021, 14, 4263. [Google Scholar] [CrossRef]
- Fazio, E.; Spadaro, S.; Corsaro, C.; Neri, G.; Leonardi, S.G.; Neri, F.; Lavanya, N.; Sekar, C.; Donato, N.; Neri, G. Metal-Oxide Based Nanomaterials: Synthesis, Characterization and their Applications in Electrical and Electrochemical Sensors. Sensors 2021, 21, 2494. [Google Scholar] [CrossRef]
- Li, Z.; Li, H.; Wu, Z.; Wang, M.; Luo, J.; Torun, H.; Hu, P.; Yang, C.; Grundmann, M.; Liu, X.; et al. Advances in designs and mechanisms of semiconducting metal oxide nanostructures for high-precision gas sensors operated at room temperature. Mater. Horizons 2019, 6, 470–506. [Google Scholar] [CrossRef]
- Rickerby, D.G.; Skouloudis, A.N. Chapter 21: Nanostructured Metal Oxides for Sensing Toxic Air Pollutants. In Advanced Environmental Analysis: Applications of Nanomaterials; Book Series: Detection Science; Royal Society of Chemistry Publishing: Cambridge, UK, 2017; Volume 2, pp. 48–90. [Google Scholar] [CrossRef]
- Masuda, Y. Recent advances in SnO2 nanostructure based gas sensors. Sens. Actuators B Chem. 2022, 364, 131876. [Google Scholar] [CrossRef]
- Que, M.; Lin, C.; Sun, J.; Chen, L.; Sun, X.; Sun, Y. Progress in ZnO Nanosensors. Sensors 2021, 21, 5502. [Google Scholar] [CrossRef]
- Yi, W.Y.; Lo, K.M.; Mak, T.; Leung, K.S.; Leung, Y.; Meng, M.L. A Survey of Wireless Sensor Network Based Air Pollution Monitoring Systems. Sensors 2015, 15, 31392–31427. [Google Scholar] [CrossRef]
- Ando, M.; Biju, V.; Shigeri, Y. Development of Technologies for Sensing Ozone in Ambient Air. Anal. Sci. 2018, 34, 263–271. [Google Scholar] [CrossRef]
- Sironi, S.; Capelli, L.; Spinelle, L.; Gerboles, M.; Aleixandre, M.; Bonavitacola, F. Evaluation of Metal Oxides Sensors for the Monitoring of O3 in Ambient Air at Ppb Level. Chem. Eng. Trans. 2016, 54, 319–324. [Google Scholar] [CrossRef]
- Spinelle, L.; Gerboles, M.; Villani, M.G.; Aleixandre, M.; Bonavitacola, F. Field calibration of a cluster of low-cost available sensors for air quality monitoring. Part A: Ozone and nitrogen dioxide. Sens. Actuators B Chem. 2015, 215, 249–257. [Google Scholar] [CrossRef]
- Williams, D.E.; Henshaw, G.S.; Bart, M.; Laing, G.; Wagner, J.; Naisbitt, S.; Salmond, J.A. Validation of low-cost ozone measurement instruments suitable for use in an air-quality monitoring network. Meas. Sci. Technol. 2013, 24, 65803. [Google Scholar] [CrossRef]
- Peterson, P.J.D.; Aujla, A.; Grant, K.H.; Brundle, A.G.; Thompson, M.R.; Vande Hey, J.; Leigh, R.J. Practical Use of Metal Oxide Semiconductor Gas Sensors for Measuring Nitrogen Dioxide and Ozone in Urban Environments. Sensors 2017, 17, 1653. [Google Scholar] [CrossRef]
- Gautam, Y.K.; Sharma, K.; Tyagi, S.; Ambedkar, A.K.; Chaudhary, M.; Singh, B.P. Nanostructured metal oxide semiconductor-based sensors for greenhouse gas detection: Progress and challenges. R. Soc. Open Sci. 2022, 8, 201324. [Google Scholar] [CrossRef]
- Sales-Lérida, D.; Bello, A.J.; Sánchez-Alzola, A.; Martínez-Jiménez, P.M. An Approximation for Metal-Oxide Sensor Calibration for Air Quality Monitoring Using Multivariable Statistical Analysis. Sensors 2021, 21, 4781. [Google Scholar] [CrossRef]
- Spinelle, L.; Gerboles, M.; Villani, M.G.; Aleixandre, M.; Bonavitacola, F. Field calibration of a cluster of low-cost commercially available sensors for air quality monitoring. Part B: NO, CO and CO2. Sens. Actuators B Chem. 2017, 238, 706–715. [Google Scholar] [CrossRef]
- Yoboué, P.; Konaté, A.; Asseu, O.; Ménini, P. An industrializable silicon-based microhotplate for metal oxides gas sensors. Phys. Chem. News 2014, 72, 34–41. [Google Scholar]
- Dufour, N.; Chapelle, A.; Mesnilgrente, F.; Conedera, V.; Menini, P. Technological Improvements of a Metal Oxide Gas Multi- Sensor Based on a Micro-Hotplate Structure and Inkjet Deposition for an Automotive Air Quality Sensor Application. In Proceedings of the 25th Micromechanics and Microsystems Europe workshop (MME 2014), Istambul, Turkey, 31 August 2014. [Google Scholar]
- Presmanes, L.; Thimont, Y.; El Younsi, I.; Chapelle, A.; Blanc, F.; Talhi, C.; Bonningue, C.; Barnabé, A.; Menini, P.; Tailhades, P. Integration of P-CuO Thin Sputtered Layers onto Microsensor Platforms for Gas Sensing. Sensors 2017, 17, 1409. [Google Scholar] [CrossRef]
- Presmanes, L.; Gunasekaran, V.; Thimont, Y.; Sinnarasa, I.; Barnabe, A.; Menini, P.; Tailhades, P. Ga doped ZnO thin films deposited by RF sputtering for NO2 sensing. In Proceedings of the 2019 5th Experiment International Conference (exp.at’19), Funchal, Portugal, 12–14 June 2019. [Google Scholar] [CrossRef]
- Masa, S.; Hontañón, E.; Santos, J.P.; Sayago, I.; Lozano, J. Chemiresistive sensors based on electrospun tin oxide nanofibers for detecting NO2 at the sub-0.1 ppm level. In Proceedings of the 2019 5th Experiment International Conference (exp.at’19), Funchal, Portugal, 12–14 June 2019. [Google Scholar] [CrossRef]
- Masa, S.; Robés, D.; Hontañón, E.; Lozano, J.; Eqtesadi, S.; Narros, A. Graphene-Tin Oxide Composite Nanofibers for Low Temperature Detection of NO2 and O3. Sens. Transducers 2020, 246, 71–78. [Google Scholar]
- Ministerio para la Transición Ecológica y el Reto Demográfico (MITECO). Evaluación de la Calidad del Aire en España 2021; Ministerio para la Transición Ecológica y el Reto Demográfico: Madrid, Spain, 2022. [Google Scholar]
- Cerrato-Alvarez, M.; Núñez-Corchero, M.; Miró-Rodríguez, C.; Pinilla-Gil, E. Synoptic circulation patterns and local sources associated to high concentrations of tropospheric ozone in rural and suburban areas in southwestern Spain. Air Qual. Atmos. Health 2020, 13, 97–108. [Google Scholar] [CrossRef]
- Escudero, M.; Lozano, A.; Hierro, J.; Tapia, O.; del Valle, J.; Alastuey, A.; Moreno, T.; Anzano, J.; Querol, X. Assessment of the variability of atmospheric pollution in National Parks of mainland Spain. Atmos. Environ. 2016, 132, 332–344. [Google Scholar] [CrossRef]
- Kim, S.; Sung, H.; Kim, S.; Je, M.; Kim, J.H. ML-based humidity and temperature calibration system for heterogeneous mox sensor array in ppm-level BTEX monitoring. In Proceedings of the 2021 IEEE International Symposium on Circuits and Systems (ISCAS), Daegu, Korea, 22–28 May 2021. [Google Scholar] [CrossRef]
- EC Working Group. Guidance to the Demonstration of Equivalence of Ambient Air Monitoring Methods Report by an EC Working Group on Guidance for the Demonstration of Equivalence. 2010. Available online: https://scholar.google.com.hk/scholar?cluster=9783433903127910149&hl=zh-TW&as_sdt=2005&sciodt=0,5 (accessed on 28 September 2022).
- Djedidi, O.; Djeziri, M.A.; Morati, N.; Seguin, J.-L.; Bendahan, M.; Contaret, T. Accurate detection and discrimination of pollutant gases using a temperature modulated MOX sensor combined with feature extraction and support vector classification. Sensors Actuators B Chem. 2021, 339, 129817. [Google Scholar] [CrossRef]
- Bruno, C.; Licciardello, A.; Nastasi, G.A.M.; Passaniti, F.; Brigante, C.; Sudano, F.; Faulisi, A.; Alessi, E. Embedded Artificial Intelligence Approach for Gas Recognition in Smart Agriculture Applications Using Low Cost MOX Gas Sensors. In Proceedings of the 2021 Smart Systems Integration (SSI), Grenoble, France, 27–29 April 2021; pp. 9–13. [Google Scholar] [CrossRef]
Publisher’s Note: MDPI stays neutral with regard to jurisdictional claims in published maps and institutional affiliations. |
© 2022 by the authors. Licensee MDPI, Basel, Switzerland. This article is an open access article distributed under the terms and conditions of the Creative Commons Attribution (CC BY) license (https://creativecommons.org/licenses/by/4.0/).