Abstract
Certain dyes are deleterious to the biological system, including animals and plants living in the water sources, soil sources, and so on. Thus, the analysis of these dyes requires a potent, quick, and cost-effective approach to the environmental samples. The present research work shows a modest, low-cost, and eco-friendly electrochemical device based on poly(dl-phenylalanine)-layered carbon nanotube paste electrode (P(PAN)LCNTPE) material for indigo carmine (ICN) detection in the presence of tartrazine. The cyclic voltammetric, field emission scanning electron microscopy, and electrochemical impedance spectroscopic methods were operated for the detection of the redox nature of ICN and electrode material surface activities, respectively. In better operational circumstances, P(PAN)LCNTPE provided better catalytic activity for the redox action of ICN than the bare carbon nanotube paste electrode. The P(PAN)LCNTPE showed good electrochemical activity during the variation of ICN concentrations ranging from 0.2 µM to 10.0 µM with improved peak current, and the limit of detection was about 0.0216 µM. Moreover, the P(PAN)LCNTPE material was performed as a sensor of ICN in a tap water sample and shows adequate stability, repeatability, and reproducibility.
1. Introduction
Dyes or colorants are important organic compounds, used as artificial dyeing mediators in various industries including food, pharmaceutical, paper, photographic, paint, leather, and electronic industries. Numerous assessments reported that over 10,000 of various dyes are operated in several industrial products and over 700,000 tons of synthetic dyes are industrialized in the global market. Regrettably, 10.0–50.0% of colorants are wasted in the dyeing process and that massive quantity of colorants is directly liberated to environmental sources like water, soil, and so on. Here, most of the dyes are toxic, which formulates some harmful effects on nature such as decreasing photosynthesis action, oxygen lack, dissimilarity in BOD, the salinity of the soil, chemical oxygen demand, and so on. Additionally, less than 1 mg of colorant in 1 L of water is harmful to the plants and animals living in water resources [1].
Indigo carmine (ICN) is a water-soluble hydrophilic coloring agent (dye), naturally obtained during the indigo sulfonation process. ICN exhibits some significant applications during the detection of superoxide and ozone, redox reactions as a pH indicator, in the formulation of pharmaceutical pills, and coloring of food products, fabric materials, and beverages [2]. Likewise, ICN is extensively utilized during the treatments of gastric cancer and vesicoureteral reflux, transurethral resection, chemotherapy of hepatic tumors, obstetric surgery, and so on [3,4,5,6]. Nevertheless, the anomaly of ICN concentration in water samples promotes some side effects in living species, such as hereditary problems, invariable blood pressure, hypertension, urticaria, eye problems, bronchospasm, and cancer-related tumor growth [7,8,9,10]. Therefore, the detection and protection of ICN in water resources are most crucial. Both can be performed using a simple, sensitive, and eco-friendly methodology.
Numerous methods were described for ICN detection, including high-performance liquid chromatography [11], thin-layer chromatography [12], chemiluminescence [13], flow amperometry [14], tandem mass spectrometry [15], and spectrophotometry [16]. Here, almost all methods are tedious and laborious and need costly instruments, well-trained analysts, and sample pre-treatment procedures. Nevertheless, the electrochemical approaches are the best practical approaches for the detection of electroactive compounds due to their higher steadiness, sensitivity, selectivity, rapid response, low-priced, simplicity of optimization, comfort of handling, and lesser analysis time [17,18,19,20,21,22,23,24,25,26].
Additionally, working electrode materials are key tools for the operation of electrochemical approaches. Currently, CNTs are the finest material in the sensor field for the detection of electro/bioactive compounds due to the presence of various special characteristics including good bio-compatibility and conductivity, high electroactive surface area, higher mechanical, chemical, and thermal stability, good electronic activities, low-priced, easy preparation approach, and low background current [27,28]. These applications make CNTs-based materials a key sensing tool for the detection of ICN with high sensitivity and selectivity in the present research.
Here, the base electrode material needs a surface activation for improved electrocatalytic activity; hence, we used amino acid as a surface activator. Presently, electrochemically polymerized amino acid-based electrodes attain a huge interest in the sensor field for the detection of various bio/electroactive molecules. Particularly, electrochemically polymerized dl-phenylalanine P(PAN) displays raised stability, sensitivity, and bio-compatibility, non-hazardous character, therapeutic activities, robust activity with the analyte and electrode surface with more active sites and conducting channels [29].
As a result of limited literature information, no described research works were found on the sensitive and selective electrochemical analysis of ICN alone in the real sample (tap water) and concurrent ICN and tartrazine (TN) detection at the surface of poly(dl-phenylalanine)-layered carbon nanotube paste electrodes (P(PAN)LCNTPE) using cyclic voltammetric (CV) operation. Correspondingly, this article confirms the great analytical applications and authentications for the examination of the quality of water samples.
2. Experimental Section
2.1. Chemicals and Reagents
ICN (electroactive compound under study), dl-phenylalanine (PAN) (surface activator), CNTs (electrode base material), and silicone oil (binder) were bought from Molychem, Mumbai, India. TN and potassium chloride (supporting electrolyte) were bought from Nice Chemicals, Kochin, India. Sodium salts (supporting electrolytes: Na2HPO4·2H2O and NaH2PO4·H2O) and potassium ferrocyanide (electroactive compound) were procured from Sisco Research Laboratories Pvt. Ltd., Maharashtra, India. These chemical compounds are analytical reagents graded and operated without extra purification. The solutions of know concentration were made by dissolving an estimated amount of chemical compound in a known amount of distilled water. The complete ICN analysis in the present work was done at the lab temperature of 25 °C.
2.2. Instrumentation
The CV and electrochemical impedance spectroscopic (EIS) methods were operated using z CHI-6038E instrument. The CHI-6038E (CHI Instrument, Austin, TX, USA) was used as a potentiostat for ICN in phosphate buffer (PB). Here, the mentioned potentiostat was connected to the electrochemical cell with three electrodes (three-electrode system), the P(PAN)LCNTPE and bare carbon nanotube paste electrode (BCNTPE) were used as a working electrode, the platinum wire was operated as a counter-electrode, and the saturated calomel electrode is used as a reference electrode. The field emission scanning electron microscopy (FE-SEM) characterization of the bare and modified electrode materials was conducted at DST-PURSE Laboratory, Mangalore University, Mangalore, India.
2.3. Preparation of BCNTPE
The preparation of the BCNTPE was performed with the optimum composition like 60% CNTs and 40% silicone oil based on the previous literature [19]. Here, the powder of CNTs (60%) and silicone oil (40%) were mixed well for about 15 to 20 min in an agate mortar using a pestle to accomplish a homogeneous paste of CNT and silicon oil. A bit part of the resulting CNTP was filled into the void (3.0 mm width) of the Teflon tube and a copper wire was inserted to provide an electrical connection. The surface of the electrode was smoothened attentively utilizing soft paper and rinsed with distilled water. The finally obtained material is called BCNTPE.
2.4. Preparation of P(PAN)LCNTPE
The P(PAN)LCNTPE was prepared using the electrochemical polymerization of PAN (1.0 mm) in PB (0.2 M & 7.0 pH) at the surface of fresh CNTPE through cycling 10 CV cycles at the scan rate of 0.1 Vs−1 and the potential window of −1.0 V to 1.5 V. After the completion of 10 CV cycles the modified electrode surface was rinsed with distilled water to achieve a fresh sensitive electrode surface called P(PAN)LCNTPE.
3. Results and Discussions
3.1. FE-SEM and EDX Analysis of BCNTPE and P(PAN)LCNTPE
FE-SEM is an innovative characterization technique operated to capture and analyze the microstructure picture of the material surfaces. FE-SEM is characteristically operated in a high vacuum, since gas molecules tend to interrupt the electron beam and the emitted secondary and backscattered electrons used for imaging and morphological observations. In this study, FE-SEM and EDX techniques are used for the analysis of surface morphology and elemental analysis of BCNTPE and P(PAN)LCNTPE, and the data are shown in Figure 1. Here, Figure 1a shows an unsystematically distributed tube-like shape with rough exterior, which signifies the presence of CNTs on the surface of BCNTPE material. Nevertheless, Figure 1b shows a surface structure of P(PAN)LCNTPE, here the electrode surface is surrounded by a film of Poly(PAN) on the CNTP surface. In addition, the characteristic elemental analysis was performed using the EDX technique to coincide with the elemental configuration of BCNTPE and P(PAN)LCNTPE. Figure 1c,d display the EDX images of BCNTPE and P(PAN)LCNTPE with different topographies. In Figure 1c, elements such as carbon (C), oxygen (O), and silicon (Si) appeared, and it indicates the material of unmodified electrode (BGPPE). Nonetheless, Figure 1d presents C, nitrogen (N), Si, and O elements. Hence, it indicates the modification of nitrogen-based moiety (amino acid: PAN) on the CNTPE surface.
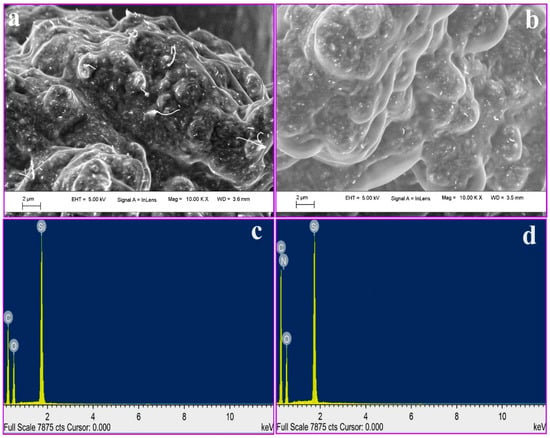
Figure 1.
FE-SEM image of (a) BCNTPE and (b) P(PAN)LCNTPE. EDX image of (c) BCNTPE and (d) P(PAN)LCNTPE.
3.2. EIS Study of BCNTPE and P(PAN)LCNTPE
EIS systems are functioned by computer programs specifically designed for EIS testing. Hence, before conducting EIS experimentation, all components of the arrangement must be accomplished. In this study, three electrodes were used (already explained in Section 2.2). The PB solution of known concentration and volume was prepared and transferred to the electrochemical cell and all three electrodes were connected to the potentiostat. Here, four leads were operated to assign the three electrodes to the EIS analyzer. Once all leads were connected, the EIS system was set up and ready for testing.
EIS is the simple method for the examination of charge transfer resistance (Rct) of the materials (BCNPE & P(PAN)LCNTPE). Here, EIS was performed for K4[Fe(CN)6], and (1.0 mM) was used as a standard analytical sample in KCl (0.1 M) at the surface of BCNTPE (curve-a) and P(PAN)LCNTPE (curve-b). The EIS outcomes are displayed based on the Nyquist plots (Figure 2). The described Nyquist plots show that the surface of BCNTPE material offers a greater semicircle size and the surface of P(PAN)LCNTPE material presents a smaller semicircle size. Also, the fitted equivalent circuit of R(CR(QR)) shows the parameters such as Rct, Q represents the constant phase element, Cdl represents the double layer capacitance, R represents the internal resistance, and Rs represents the solution resistance. The data relating to Rs, Rct, Q, and Cdl of bare and modified electrodes are tabulated in Table 1. These outcomes agree that the Rct of P(PAN)LCNTPE is lesser with a high charge transfer character than BCNTPE [27].
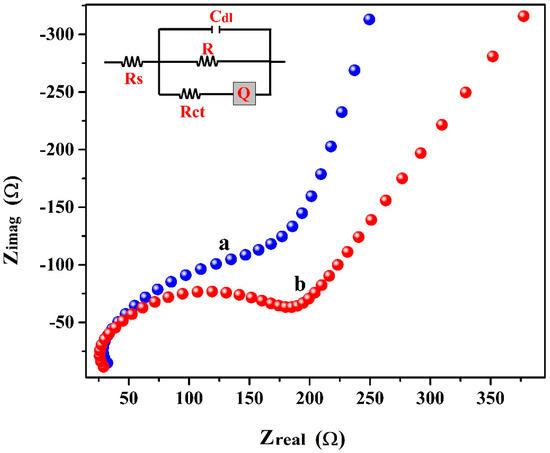
Figure 2.
EIS curves for BCNTPE (curve-a) and P(PAN)LCNTPE (curve-b).

Table 1.
EIS results for BCNTPE and P(PAN)LCNTPE.
3.3. Active Surface Area of BCNTPE and P(PAN)LCNTPE
The study of the electrochemically active surface area supports the clarification of the conductivity and sensitivity of the electrode materials. Figure 3 displays the cyclic voltammograms for a standard analytical sample K4[Fe(CN)6] (1.0 mm) in KCl (0.1 M) at the surface of BCNTPE (curve-a) and P(PAN)LCNTPE (curve-b) having a potential window of −0.3 V to 0.6 V and a scan rate of 0.1 Vs−1. The P(PAN)LCNTPE shows improved electrocatalytic activity for the redox action of K4[Fe(CN)6] with enhanced peak current and reduced peak potential in contrast to BCNTPE. These results are dependant on the electrochemically active surface area of the electrode materials. The active surface area of P(PAN)LCNTPE and BCNTPE was calculated using the following Randles–Sevcik equation [23,27,28],
where A (cm2) is the electro-active surface area, Ip(A) is the peak current, z is the electron number in redox action of K4[Fe(CN)6], υ (Vs−1) is the scan rate, D (7.3 × 10⁻⁶ cm2 s−1) is the diffusion coefficient of K4[Fe(CN)6] [28], and C (M) is the concentration of K4[Fe(CN)6]. Primarily, in the bare electrode (before modification) the calculated electroactive surface area (geometric surface area) value was found to be 0.017 cm2, but after modification of CNTPE surface by P(PAN), the calculated active surface area was found to be 0.034 cm2. These data indicate that the geometric surface area of the bare electrode is lesser than the modified electrode and it is due to the effect of the modification.
Ip = 2.69 × 10⁵ z3/2 A D1/2 C υ 1/2
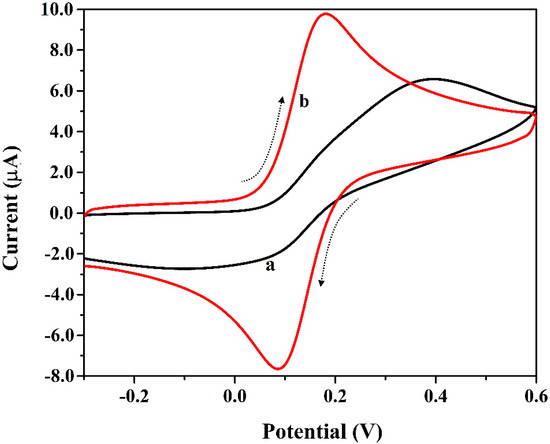
Figure 3.
Cyclic voltammograms for K4[Fe(CN)6] (1.0 mm) in KCl (0.1 M) at the surface of BCNTPE (curve-a) and P(PAN)LCNTPE (curve-b) having a potential window of −0.3 V to 0.6 V and a scan rate of 0.1 Vs−1.
The heterogeneous electron transfer rate constant (k) is calculated through the data of EIS and active surface area, and the rate constant relation are as follows:
where n represents the number of electrons, and other terms have their traditional denotation. The calculated value of k for P(PAN)LCNTPE was 0.0013 cm/s and for BCNTPE 0.0017 cm/s. These results show that the development of the P(PAN) layer at the surface of CNTPE increases its catalytic activity with a high number of active sites.
k = RT/n2 F2 A C Rct
3.4. Electrochemical Polymerization of PAN on CNTPE Surface
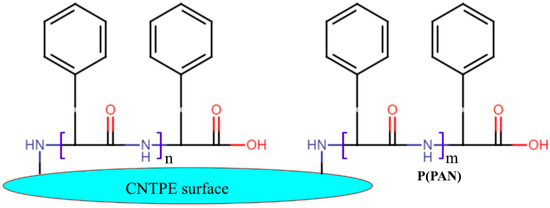
Inset Figure 4 shows the cyclic voltammograms for the PAN (1.0 mm) in PB (0.2 M and 7.0 pH) at the surface of CNTPE for the electrochemical polymerization and the plot of the number of cycles vs. peak current. Firstly, the effect of film thickness was studied by varying the number of CV cycles from 5 to 20 (Figure 4a). Here, 10 CV cycles show better electrochemical peak current for ICN than 5, 15, and 20 cycles. Hence, 10 CV cycles are selected as optimum for the polymerization of PAN on the surface of CNTPE. Additionally, the cyclic voltammograms were documented through the cycling of ten CV cycles (twenty CV segments) having a potential window of −1.0 V to 1.5 V and a scan rate of 0.1 Vs−1. The achieved PAN cyclic voltammograms exhibited an improved anodic peak current based on each CV cycle. This result authorized the alteration of the monomer film of PAN to the polymer film of PAN on the surface of CNTPE. Furthermore, the developed P(PAN) film probably expands the electrocatalytic activity, electrostatic interface, and sensitive electrochemical behavior. The possible electrochemically polymerized structure of PAN is shown in Scheme 1.
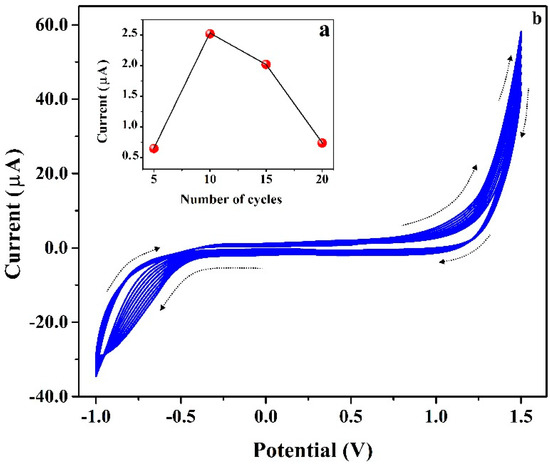
Figure 4.
(a) Plot of Ipa vs. number of cycles. (b) Cyclic voltammograms for the electro polymerization of PAN (1.0 mm) in PB (0.2 M & 7.0 pH) at the surface of CNTPE having the scan rate of 0.1 Vs−1.
Scheme 1.
The probable structure of Poly(PAN) on CNTPE surface.
3.5. Electrochemical Nature of ICN
The electrochemical redox action of 0.01 mM ICN on the surface-bare and modified electrodes was analyzed using the CV method. Cyclic voltammograms for the presence and absence (blank: curve-b) of 0.1 mM ICN in 0.2 M PB (pH 6.5) at the surface of P(PAN)LCNTPE (curve-c) and BCNTPE (curve-a) with a scan rate of 0.1 Vs−1 (Figure 5). Here, P(PAN)LCNTPE provided higher electrocatalytic activity for the redox action of ICN with more improved redox peak current than the BCNTPE. Additionally, the absence of ICN (only PB of 6.5 pH) at P(PAN)LCNTPE (curve-b) did not show any electrochemical behavior. From the recorded information, the greater ICN electrochemical redox activity at P(PAN)LCNTPE as compared to BCNTPE was due to the faster electron transfer among electrode and analyte interface, higher electrochemical heterogeneous rate constant, high active surface area, stronger interactions like electrostatic, hydrogen bonding, electronic, covalent, and so on, among the interface of the modified electrode surface and ICN.
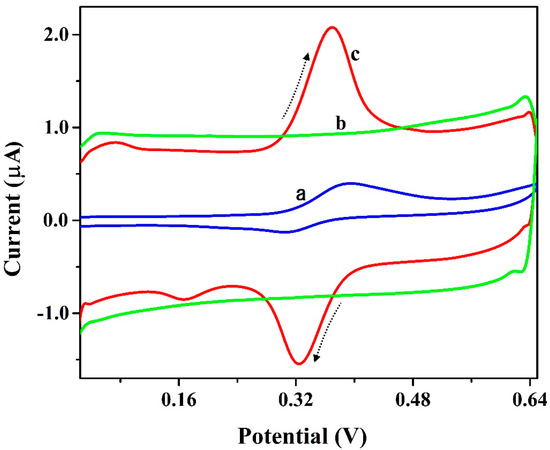
Figure 5.
Cyclic voltammograms for the presence and absence (blank: curve-b) of 0.1 mM ICN in 0.2 M PB (pH 6.5) at the surface of P(PAN)LCNTPE (curve-c) and BCNTPE (curve-a) with a scan rate of 0.1 Vs−1.
3.6. Effect of pH on ICN Electrochemical Activity
ICN is very sensitive to pH, oxidation, and reduction effects. Under normal conditions the ICN is in its oxidized form since it is always in interaction with oxygen in the air. ICN is pH-sensitive and at strongly basic conditions it has a yellow-greenish color. The ICN is in its blue form that dominates when the pH of the solution is less than about eleven points. Hence, the analysis of the pH effect on the redox activity of ICN at the surface of the modified electrode is essential. The influence of 0.2 M PB solution pH on the redox reaction of 0.1 mM ICN at P(PAN)LCNTPE was inspected using the CV method. Figure 6a shows the cyclic voltammograms recorded for the redox activity of ICN at the surface of P(PAN)LCNTPE in altered 0.2 M PB solution pHs ranging from 5.5–8.0 with the scan rate of 0.1 Vs−1. Figure 6b represents the plot of Epa vs. pH, here the movement of ICN peak potential (Epa) towards the negative path as the increase of pH from 5.5 to 8.0 was noticed with an effective linear relationship among Epa and pH (Epa(V) = 0.716 – 0.054 pH (V/pH) & R2 = 0.988). Here, the slope value of Epa vs. pH was −0.054 V/pH was nearer to the hypothetical value of −0.059, suggesting that the redox reaction of ICN was conducted through an equal number of protons and electrons (1:1 ratio). Supportive of this, the number of protons in the electro–redox reaction of ICN in P(PAN)LCNTPE was verified using the slope of Epa vs. pH and the Nernst relation: ΔEp/ΔpH = −2.303 mRT/nF. Here, m is the number of protons, n is the number of electrons, ΔEp is the change in potential, F is the Faraday constant, T is the temperature, R is the universal gas constant, and ΔpH is the change in pH. The calculated value of the number of electrons (n) was found to be 2.190 (almost two), signifying that the ICN electro-redox reaction in P(PAN)LCNTPE probably continues through the transmission of two electrons and two protons. Additionally, Figure 6c shows that the 6.5 pH presents the maximum ICN redox peak current in comparison with the remaining pHs (5.5, 6.0, 7.0, 7.5, and 8.0). The maximum electrochemical response of ICN at 6.5 is probably due to the stronger interactions such as electrostatic, hydrogen bonding, electronic, covalent, and so on. Therefore, 6.5 pH was selected as the optimum pH value for the current research.
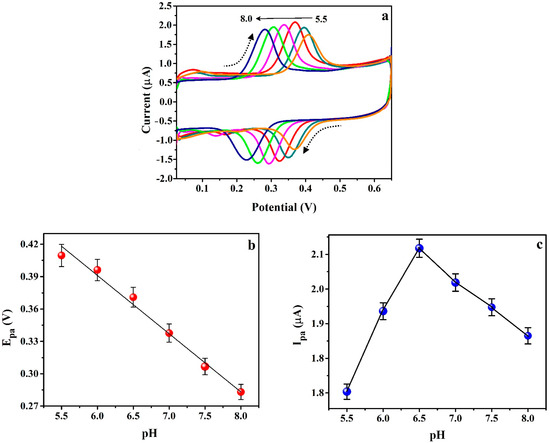
Figure 6.
(a) Cyclic voltammograms for 0.01 mM ICN at the surface of P(PAN)LCNTPE in altered 0.2 M PB solution pHs ranging from 5.5 to 8.0 with the scan rate of 0.1 Vs−1. (b) Plot of Epa vs. pH. (c) Plot of Ipa vs. pH.
3.7. Scan Rate Impact on Peak Current and Potential
Figure 7 signifies the influence of scan rate on the redox action of 0.01 mM ICN in 0.2 M PB at P(PAN)LCNTPE to understand the reliability of the redox peak current and peak potentials during the variation of scan rate. The cyclic voltammograms were detailed for ICN in 0.2 M PB of pH 6.5 at P(PAN)LCNTPE in the different scan rates ranging from 0.025 Vs−1 to 0.3 Vs−1 (Figure 7a). Figure 7b,c show the plots of log Ipa vs. log υ and Ipa vs. υ, respectively. Here, both the plots show good linear association, and the corresponding linear relations are log (Ipa, A) = 4.710 + 0.925 log (υ, Vs−1) (R2 = 0.997) and Ipa (A) = 0.295 + 20.193 υ (Vs−1) (R2 = 0.995). The slope value of 0.925 of log Ipa vs. log υ and the linear regression coefficient value of 0.995 of Ipa vs. υ are near the theoretical value of unity. These data suggest that the redox reaction of ICN at the P(PAN)LCNTPE surface was continued by the adsorption-controlled reaction pathway. The probable electrochemical redox reaction of ICN is shown in Scheme 2 [27].
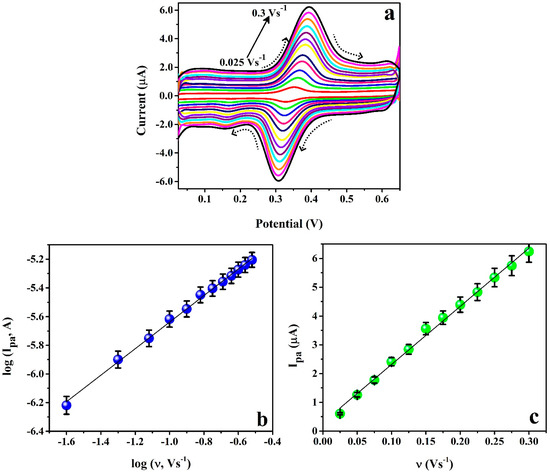
Figure 7.
(a) Cyclic voltammograms for 0.01 mM ICN in 0.2 M PB of pH 6.5 at P(PAN)LCNTPE in the different scan rates ranging from 0.025 Vs−1 to 0.3 Vs−1. (b) Plot of log Ipa vs. log υ. (c) Plot of Ipa vs. υ.
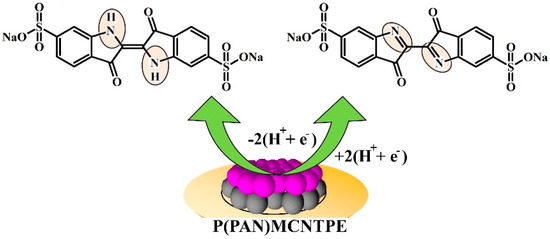
Scheme 2.
Probable electrochemical redox reaction of ICN at P(PAN)LCNTPE surface.
3.8. Simultaneous and Interference Analysis
The CV method was used for the inspection of 0.01 mM ICN in presence of 0.1 mM TN at the surface of BCNTPE (curve-a) and P(PAN)LCNTPE (curve-b) in PB (0.2 M and 6.5 pH) at 0.1 Vs−1 scan rate. In Figure 8a, BCNTPE reveals lower electrochemical activity with a low redox peak for ICN and low oxidation peak for TN. Nonetheless, P(PAN)LCNTPE displays a good and well-defined redox peak for ICN and an oxidation peak for TN. These results clarify that the elevated catalytic nature of P(PAN)LCNTPE for the redox action of ICN with TN (presence and absence) is approximately similar. Additionally, the interference effect on the surface of the modified electrode was tested for the electrochemical behavior of ICN in the presence of different organic molecules such as alizarin red (AR), erythromycin (ECN), methyl orange (MO), riboflavin (RF), TN, sucrose (SR), and Congo red (CR). The results are shown in Figure 8b. Here, only less than ±5.0% of signal change in ICN electrochemical oxidation is observed with respect to the base potential of ICN at P(PAN)LCNTPE. Therefore, the proposed P(PAN)LCNTPE shows acceptable anti-interferent and is good for simultaneous analysis even in the presence of different organic interferents.
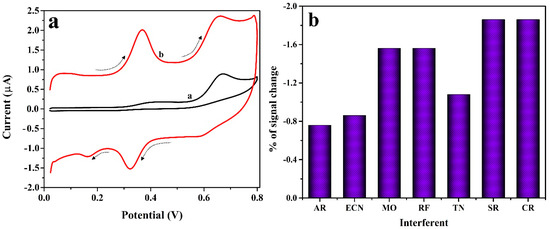
Figure 8.
(a) Cyclic voltammograms for 0.01 mM ICN in presence of 0.1 mM TN at the surface of BCNTPE (curve-a) and P(PAN)LCNTPE (curve-b) in PB (0.2 M & 6.5 pH) at 0.1 Vs−1 scan rate. (b) % error in signal vs. interferents.
3.9. Limit of Detection and Quantification
The electrochemical-based redox nature of ICN was examined by changing its concentration in the range of 0.2 µM to 10.0 µM in PB (0.2 M & 6.5 pH) at the modified electrode surface (P(PAN)LCNTPE) using the CV method (0.1 Vs−1 scan rate) and the recorded cyclic voltammograms are displayed in Figure 9a. Here, the concentration of ICN and Ipa and Ipc of ICN are proportional to each other, and they provide a good linear relationship. In this contrast, we considered anodic peak current as an analytical signal to plot a calibration curve and the results are noticed in the plot of Ipa vs. [ICN] shown in Figure 9b. The linear relation among Ipa vs. [ICN] is shown as Ipa (A) = 9.265 × 10⁻⁷ + 0.096 [ICN] (M) & R2 = 0.999. The ICN-detecting ability of P(PAN)LCNTPE was studied using the limit of detection (LOD) and limit of quantification (LOQ). The values of LOD and LOQ are calculated using the relations of LOD = 3 (Standard deviation of the blank/Slope of the calibration curve) and LOQ = 10 (Standard deviation of the blank/Slope of the calibration curve). The calculated value of LOD and LOQ were found to be 0.021 µM and 0.072 µM, correspondingly. The attained LOD and prepared electrode were contrasted with the earlier ICN electrochemical sensors, and the assessment data is documented in Table 2 [27,30,31,32,33].
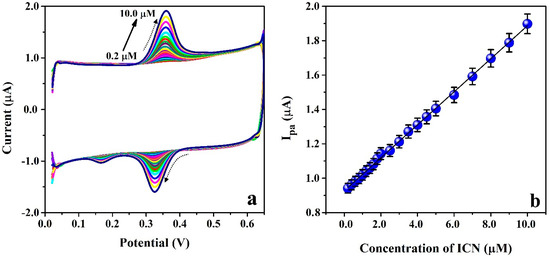
Figure 9.
(a) Cyclic voltammograms for ICN with different concentration ranging from 0.2 µM to 10.0 µM in PB (0.2 M & 6.5 pH) at the surface of P(PAN)LCNTPE having 0.1 Vs−1 scan rate. (b) Plot of [ICN] vs. Ipa.

Table 2.
Comparison of present LOD of ICN, electrode material, and methods used in previous ICN reports.
3.10. Stability, Repeatability and Reproducibility
The stability, repeatability, and reproducibility of the proposed electrochemical sensor (P(PAN)LCNTPE) were inspected by recording the cyclic voltammograms for a redox reaction of 0.01 mM ICN in PB (0.2 M & 6.5 pH) at a scan rate of 0.1 Vs−1. The P(PAN)LCNTPE stability was analyzed by recording cyclic voltammograms by driving 25 CV cycles (fifty CV segments) at a scan rate of 0.1 Vs−1. Here, the stability of the sensor was calculated using the initial and final electrochemical peak currents and the value was about 92.22%, which proposes acceptable P(PAN)LCNTPE stability. P(PAN)LCNTPE repeatability was verified based on five successive CV cycles for ICN analyte (changed at the end of each cycle) at the surface of constantly fixed P(PAN)LCNTPE. Here, all five cyclic voltammograms show a nearer oxidation peak current for ICN at P(PAN)LCNTPE with the relative standard deviation value of 0.544%, which proposes an adequate P(PAN)LCNTPE repeatability. P(PAN)LCNTPE reproducibility was confirmed with respect to five successive CV cycles for a constantly fixed ICN analyte at the surface of P(PAN)LCNTPE (changed at the end of each cycle). Here, all the recorded cyclic voltammograms showed a closer oxidation peak current value for ICN at P(PAN)LCNTPE with a relative standard deviation value of 1.025%, which suggests decent P(PAN)LCNTPE reproducibility. The results related to stability, repeatability, and reproducibility are shown in Figure 10.
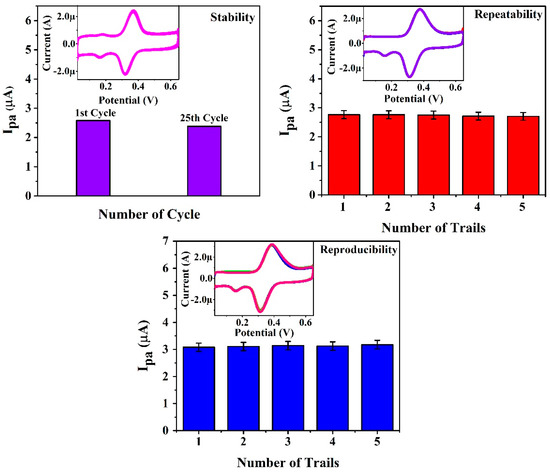
Figure 10.
Results for P(PAN)LCNTPE stability, repeatability and reproducibility.
3.11. Analysis of Water Sample
To authenticate the resolution of the projected P(PAN)LCNTPE by examining ICN in a water sample (the tap water is used as a real sample and it was collected from the municipality water tank, Madikeri, India). The operated CV method was used for ICN inspection in a tap water sample in PB (0.2 M & 6.5 pH) at a scan rate of 0.1 Vs−1 at the surface of the projected P(PAN)LCNTPE. Here, the tap water sample did not give the voltammetric response for ICN, hence the ICN investigation was completed in the tap water sample using the typical spike recovery method with three trials for each addition. The P(PAN)LCNTPE provided decent recovery for ICN in tap water samples under the standard addition method ranging from 97.80 ± 0.0005% to 100.40 ± 0.001%, and the institute outcomes are tabulated in Table 3.

Table 3.
The recovery data of ICN in tap water sample.
4. Conclusions
In this research, the simple, responsive, and low-priced electrochemical sensors: P(PAN)LCNTPE and BCNTPE were prepared using an eco-friendly procedure for the sensitive and selective ICN electrochemical analysis in presence of TN. The surface of CNTPE was effectively activated by developing an active layer of P(PAN) through a simple electrochemical polymerization approach. The enhanced electrochemical surface area of P(PAN)LCNTPE developed a faster rate of electron transference during the ICN redox reaction with elevated electrocatalytic action and more active spots than the BCNTPE. The surface features of P(PAN)LCNTPE and BCNTPE were confirmed successfully by means of FE-SEM, CV, and EIS approaches. The P(PAN)LCNTPE frames an improved electrochemical response with good linear correlation, lower LOD, higher stability, repeatability, and reproducibility toward the analysis of the redox nature of ICN. Furthermore, the projected P(PAN)LCNTPE and the CV technique retain superb ICN recapture in a tap water sample with fine recovery in the range of 97.80% to 100.40%.
Author Contributions
Conceptualization, K.B., J.G.M. and H.N.; methodology, K.B., J.G.M. and H.N.; validation, K.B., J.G.M. and H.N.; investigation, K.B., J.G.M. and H.N.; data analysis, K.B., J.G.M. and H.N.; writing—original draft preparation, K.B., J.G.M. and H.N.; writing—review and editing, K.B., J.G.M., H.N., A.M.T., M.D.A. and M.S.; supervision, J.G.M.; software, K.B. and H.N. All authors have read and agreed to the published version of the manuscript.
Funding
1. Kanthappa Bhimaraya gratefully acknowledges the financial support from the SC/ST Cell for the SC/ST Fellowship (No. MU/SCTRF/CR5/2019-20/SCT-1), Mangalore University. 2. Ammar M. TIGHEZZA and Munirah D. Albaqami are grateful for the Researchers Supporting Project Number (RSP-2021/267) King Saud University, Riyadh, Saudi Arabia.
Institutional Review Board Statement
Not applicable.
Informed Consent Statement
Not applicable.
Data Availability Statement
The data underlying this article are presented in the main manuscript. The datasets generated during and/or analyzed during the current study are available from the corresponding author upon reasonable request.
Conflicts of Interest
The authors declare no conflict of interest.
References
- Chequer, F.M.D.; de Oliveira, G.A.R.; Ferraz, E.R.A.; Cardoso, J.C.; Zanoni, M.V.B.; de Oliveira, D.P. Textile Dyes: Dyeing Process and Environmental Impact; IntechOpen: London, UK, 2013; pp. 151–176. [Google Scholar]
- Ammar, S.; Abdelhedi, R.; Flox, C.; Arias, C.; Brillas, E. Electrochemical degradation of the dye indigo carmine at boron-doped diamond anode for wastewaters remediation. Environ. Chem. Lett. 2006, 4, 229–233. [Google Scholar] [CrossRef]
- Song, J.E.; Kim, S.K. The use of indigo carmine in ureteral operations. Urol. J. 1967, 98, 669. [Google Scholar] [CrossRef]
- Ikeda, K.; Sannohe, Y.; Araki, S.; Inutsuka, S. A new trial in endoscopic diagnosis for stomach cancer: Intra-arterial dye (IAD) method. Gastrointest. Endosc. 1980, 26, 19801. [Google Scholar] [CrossRef]
- Fujita, M.; Kuroda, C.; Hosomi, N.; Inoue, E.; Kuriyama, K.; Ohhigashi, H.; Kishimoto, S.; Ishikawa, O.; Nakaizumi, A.; Vasc, J. Dye-Injection Method for Placement of an Infusion Catheter in Regional Hepatic Chemotherapy. Interv. Radiol. 1995, 6, 119. [Google Scholar] [CrossRef]
- Altok, M.; Sahin, A.F.; Gokce, M.I.; Ekin, G.R.; Divrik, R.T. Ureteral orifice involvement by urothelial carcinoma: Long term oncologic and functional outcomes. Int. Braz. J. Urol. 2017, 43, 1052. [Google Scholar] [CrossRef] [PubMed]
- Ng, T.Y.; Datta, T.D.; Kirimli, B.I. Reaction to indigo carmine. J. Urol. 1976, 116, 132. [Google Scholar] [CrossRef]
- Lakshmi, U.R.; Srivastava, V.C.; Mall, I.D.; Lataye, D.H. Rice husk ash as an effective adsorbent: Evaluation of adsorptive characteristics for Indigo Carmine dye. J. Environ. Manag. 2009, 90, 710. [Google Scholar] [CrossRef]
- Kennedy, W.K.; Wirjoatmadja, K.; Akamatsu, T.J.; Bonica, J.J. Cardiovascular and respiratory effects of indigo carmine. J. Urol. 1968, 100, 775. [Google Scholar] [CrossRef]
- Naitoh, J.; Fox, B.M. Severe hypotension, bronchospasm, and urticaria from intravenous indigo carmine. Urology 1994, 44, 271. [Google Scholar] [CrossRef]
- Berzas, J.J.; Flores, J.R.; Llerena, M.J.V.; Farinas, N.R. Spectrophotometric resolution of ternary mixtures of Tartrazine, Patent Blue V and Indigo Carmine in commercial products. Anal. Chim. Acta 1999, 391, 353. [Google Scholar] [CrossRef]
- Oka, H.; Ikai, Y.; Kawamura, K.; Yamada, M.; Inoue, H. Simple method for the analysis of food dyes on reversed-phase thin-layer plates. J. Chromatogr. A 1987, 411, 437. [Google Scholar] [CrossRef]
- Fereja, T.H.; Kitte, S.A.; Zafar, M.N.; Halawa, M.I.; Han, S.; Zhang, W.; Xu, G. Highly sensitive and selective non-enzymatic glucose detection based on indigo carmine/hemin/H2O2 chemiluminescence. Analyst 2020, 145, 1041. [Google Scholar] [CrossRef] [PubMed]
- Tsai, C.F.; Kuo, C.H.; Shih, D.Y.C. Determination of 20 synthetic dyes in chili powders and syrup-preserved fruits by liquid chromatography/tandem mass spectrometry. J. Food Drug Anal. 2015, 23, 45. [Google Scholar] [CrossRef] [PubMed]
- Alvarez, M.J.B.; Abedul, M.T.F.; Garcia, A.C. Flow amperometric detection of indigo for enzyme-linked immunosorbent assays with use of screen-printed electrodes. Anal. Chim. Acta 2002, 462, 31. [Google Scholar] [CrossRef]
- Minioti, K.S.; Sakellariou, C.F.; Thomaidis, N.S. Determination of 13 synthetic food colorants in water-soluble foods by reversed-phase high-performance liquid chromatography coupled with diode-array detector. Anal. Chim. Acta 2007, 583, 103. [Google Scholar] [CrossRef]
- Kavieva, L.; Ziyatdinova, G. Voltammetric Sensor Based on SeO2 Nanoparticles and Surfactants for Indigo Carmine Determination. Sensors 2022, 22, 3224. [Google Scholar] [CrossRef]
- Raymundo-Pereira, P.A.; Teixeira, M.F.; Fatibello-Filho, O.; Dockal, E.R.; Bonifacio, V.G.; Marcolino-Junior, L.H. Electrochemical sensor for ranitidine determination based on carbon paste electrode modified with oxovanadium (IV) salen complex. Mater. Sci. Eng. C 2013, 33, 4081–4085. [Google Scholar] [CrossRef]
- Ensafi, A.A.; Bahrami, H.; Karimi-Maleh, H.; Mallakpour, S. Carbon Paste Electrode Prepared from Chemically Modified Multiwall Carbon Nanotubes for the Voltammetric Determination of Isoprenaline in Pharmaceutical and Urine Samples. Chin. J. Catal. 2012, 33, 1919–1926. [Google Scholar] [CrossRef]
- Arvand, M.; Saberi, M.; Ardaki, M.S.; Mohammadi, A. Mediated electrochemical method for the determination of indigo carmine levels in food products. Talanta 2017, 173, 60–68. [Google Scholar] [CrossRef]
- Arbabi, N.; Beitollahi, H. A New Sensor Based on a La3+/Co3O4 Nanoflowers Modified Screen Printed Electrode for a Sensitive Simultaneous Determination of Levodopa and Tryptophan. Surf. Eng. Appl. Electrochem. 2022, 58, 305–312. [Google Scholar] [CrossRef]
- Fan, Z.; Cheng, P.; Liu, M.; Li, D.; Liu, G.; Zhao, Y.; Ding, Z.; Chen, F.; Wang, B.; Tan, X.; et al. Poly(glutamic acid) hydrogels crosslinked via native chemical ligation. New J. Chem. 2017, 41, 8656. [Google Scholar] [CrossRef]
- Hareesha, N.; Manjunatha, J.G.; Alothman, Z.A.; Sillanpää, M. Simple and affordable graphene nano-platelets and carbon nanocomposite surface decorated with cetrimonium bromide as a highly responsive electrochemical sensor for rutin detection. J. Electroanal. Chem. 2022, 917, 116388. [Google Scholar] [CrossRef]
- Tajik, S.H. Beitollahi, Hydrothermal synthesis of CuFe2O4 nanoparticles for highly sensitive electrochemical detection of sunset yellow. Food Chem. Toxicol. 2022, 165, 113048. [Google Scholar] [CrossRef] [PubMed]
- Stefan-van Staden, R.-I.; van Staden, J.F. Dot microsensors based on zinc porphyrins and zinc phthalocyanine for the determination of indigo carmine. ECS J. Solid State Sci. Technol. 2020, 9, 41015. [Google Scholar] [CrossRef]
- Amrutha, B.M.; Manjunatha, J.G.; Bhatt, A.S.; Nagarajappa, H. Sensitive and selective electrochemical detection of vanillin at graphene-based poly (methyl orange) modified electrode. J. Sci. Adv. Mater. Devices 2021, 6, 415–424. [Google Scholar]
- Hareesha, N.; Manjunatha, J.G.; Amrutha, B.M.; Pushpanjali, P.A.; Charithra, M.M.; Prinith, S.N. Electrochemical analysis of indigo carmine in food and water samples using a poly (glutamic acid) layered multi-walled carbon nanotube paste electrode. J. Electron. Mater. 2021, 50, 1230–1238. [Google Scholar] [CrossRef]
- Pushpanjali, P.A.; Manjunatha, J.G.; Nagarajappa, H.; D’Souza, E.S.; Charithra, M.M.; Prinith, N.S. Voltammetric analysis of antihistamine drug cetirizine and paracetamol at poly(L-Leucine) layered carbon nanotube paste electrode. Surf. Interfaces 2021, 24, 101154. [Google Scholar] [CrossRef]
- Ma, X.; Chao, M. Electrocatalytic determination of maltol in food products by cyclic voltammetry with a poly(l-phenylalanine) modified electrode. Anal. Methods 2013, 5, 5823. [Google Scholar] [CrossRef]
- Manjunatha, J.G. A novel poly (glycine) biosensor towards the detection of indigo carmine: A voltammetric study. J. Food Drug Anal. 2018, 26, 292–299. [Google Scholar] [CrossRef]
- Silva, T.A.; Pereira, G.F.; Fatibello-Filho, O.; Eguiluz, K.I.; Salazar-Banda, G.R. Electroanalytical sensing of indigo carmine dye in water samples using a cathodically pretreated boron-doped diamond electrode. J. Electroanal. Chem. 2016, 769, 28–34. [Google Scholar] [CrossRef]
- Edwin, D.S.S.; Manjunatha, J.G.; Raril, C.; Girish, T.; Ravishankar, D.K.; Arpitha, H.J. Electrochemical analysis of indigo carmine using polyarginine modified carbon paste electrode. J. Electrochem. Sci. Eng. 2021, 11, 87–96. [Google Scholar] [CrossRef]
- Deroco, P.B.; Medeiros, R.A.; Rocha-Filho, R.C.; Fatibello-Filho, O. Selective and simultaneous determination of indigo carmine and allura red in candy samples at the nano-concentration range by flow injection analysis with multiple pulse amperometric detection. Food Chem. 2018, 247, 66–72. [Google Scholar] [CrossRef] [PubMed]
Publisher’s Note: MDPI stays neutral with regard to jurisdictional claims in published maps and institutional affiliations. |
© 2022 by the authors. Licensee MDPI, Basel, Switzerland. This article is an open access article distributed under the terms and conditions of the Creative Commons Attribution (CC BY) license (https://creativecommons.org/licenses/by/4.0/).