Abstract
Background: Tobacco consumption, incorrect nutrition and insufficient physical activity/sedentariness represent modifiable NCDs risk factors in Western countries. To evaluate recent lifestyle indicators in Italy, data from the national Health Examination Survey (HES), implemented in 2018–2019 within the CUORE Project, were assessed. Methods: Age–sex standardized results from random samples of Italian general population (35–74 years) were reported by sex, age-class, educational level and geographical area. From 2106 participants, 2090 were considered for smoking habit, 2016 for physical activity and 1578 for nutrition. Standardized questionnaires were used for smoking habit and physical activity, and the EPIC questionnaire for nutrition. Results: Total cigarette current smokers were 23% in men and 19% in women; sedentariness during leisure time was 34% in men and 45% in women and at work 45% and 47% in men and women, respectively. Prevalence of balanced eating behaviours for vegetables was 28% in men and 39% in women; and for fruits 50% and 52%, respectively; prevalence of correct lifestyle (not smoker, regular physical activity and following at least five correct eating behaviours) was 7% and 12% for men and women, respectively. Conclusions: In 2018–2019, levels of unhealthy lifestyles were found to be still epidemic and basically stable compared to 10 years earlier (slight smoking habit decrease, slight sedentariness increase and slight nutrition improvements); intersectoral strategies and monitoring need to be continued.
1. Introduction
Non-communicable diseases (NCDs), such as cardiovascular diseases, cancers, chronic respiratory diseases, diabetes and musculoskeletal disorders, remain the leading causes of death worldwide [1]. Tobacco consumption, incorrect eating habits, insufficient physical activity/sedentariness and risky and harmful alcohol consumption, together with the characteristics of the environment and the social, economic and cultural context represent the main modifiable risk factors in Western countries [1].
These main behavioural risk factors act directly and indirectly to increase the risk of NCDs since they can lead to intermediate risk factors such as arterial hypertension, overweight/obesity, dyslipidaemia, hyperglycaemia and precancerous and early cancerous precancerous lesions. To combat global mortality from NCDs, at the Sixty-sixth World Health Assembly in 2013, Member States developed a Global Plan of Action for 2013–2020, extended to 2030, setting global targets; they included the achievement of nine global targets regarding overall mortality from NCDs, harmful use of alcohol, insufficient physical activity/sedentariness, intake of salt/sodium, current tobacco use, raised blood pressure, diabetes and obesity, heart attacks and strokes drug therapy and counselling for prevention and basic technologies and essential medicines to treat major NCDs [1,2,3].
In Italy, in 2017, about one-third of all deaths could be attributed to behavioural risk factors, such as unhealthy nutrition (16% of death), tobacco smoking (14%), alcohol consumption (4%) and physical inactivity (3%) [4].
To intervene on the four main modifiable risk factors of NCDs (tobacco consumption, sedentary lifestyle/low physical activity, risky alcohol consumption and poor diet), in Italy, the program “Gaining Health: making healthy choices easy” was implemented together with the National Preventive Plans (NPPs) through actions and policies adopting an intersectoral vision. The WHO recommended improving country-level surveillance and monitoring as a priority in the fight against NCDs, and also providing data disaggregated by age, gender and socioeconomic groups [1,2]. Monitoring should provide internationally comparable assessments of the trends in NCDs and related risk factors over time, help to benchmark the situation in individual countries versus others in the same region or development category and provide a support for advocacy, policy development and coordinated action [1,2].
In Italy, national Health Examination Surveys (HESs) have been conducted since 1998. The assessment of tobacco use, physical inactivity and dietary habits was carried out in 1998–2002 and 2008–2012 in the Italian adult general population through national HESs implemented within the CUORE Project [5].
In order to provide more recent lifestyles indicators, data collected in 2018–2019 in random samples of Italian adult general population, through the national HES implemented within the CUORE Project, were analysed and reported by sex, age-classes, educational level and geographical area.
2. Materials and Methods
2.1. Sampling
From April 2018 to December 2019, the Italian National Institute of Health (Istituto Superiore di Sanità-ISS), within the CUORE Project, conducted a HES in 10 Regions (out of 20) chosen in the North, Centre and South of Italy, enrolling a sample of 100 men and 100 women aged 35–74 years in each examined region (participation rate 40%) randomly selected from the resident registries and stratified by sex and age-group (35–44, 45–54, 55–64 and 65–74 years) [6,7,8,9]. The HES was approved by the Ethical Committee of the ISS; all participants received an invitation letter and an informative note by ordinary postal service and signed an informed consent at the time of the visit. The HES is recognized within the Italian National Statistical Program and within the European HES collaboration [10,11]. The HES 2018–2019—CUORE Project used international standardized procedures and methods for measurements and data collection [6,7,8,9].
2.2. Smoking Habit Data Collection
The smoking questionnaire assessed current and former smokers. Current smoker was defined as a person who smokes one or more cigarettes per day. A former smoker is defined as a person who has quit smoking for at least 12 months. Number of cigarettes consumption was recorded for current smokers, as well as type of cigarettes (packaged, handmade or electronic).
2.3. Physical Activity Data Collection
Data on physical activity were collected through a questionnaire including four levels of exercise (sedentariness, mild, moderate and heavy), separately for work and leisure time. During the leisure time, the four levels of physical activity correspond to the answer to the question “What is your physical activity during your leisure time?”:
- Usually reading, watching television, getting to the movies or spend leisure time in other sedentary activities (defined as sedentariness);
- Walking, riding a bicycle or to carry out some kind of physical activity for at least 4 h a week, anything more tiring than going to work on foot or by bicycle, gardening, hunting or fishing or playing ping-pong (defined as mild physical activity intensity);
- Doing sports as a hobby, such as running, swimming, tennis, gymnastics, or to do hard work in the garden or at home or other similar efforts (this is valid if this activity is carried out at least 3 times a week) (defined as moderate physical activity intensity);
- Training regularly or playing sport professionally such as athletics, skiing, swimming, football, basketball or tennis, several times a week (defined as heavy physical activity intensity).
Physical activity during leisure time was also assessed considering only participants who no longer carried out a working activity (retired). At work, the four levels of physical activity correspond to the answer to the question “What is (was) the physical activity deriving from your job?”:
- Work performed mainly sitting at a desk and generally without the need to walk; (defined as sedentariness);
- Work that implies standing and walking for a long time, but does not oblige to carry or move heavy weights (this category also includes normal housework, except hard work) (defined as mild physical activity intensity);
- Work that implies a lot of walking and handling heavy weights (this category also includes the cases of normal hard housework, such as doing the laundry, scrubbing the floors manually) (defined as moderate physical activity intensity);
- Hard manual work, with great efforts and lifting and handling heavy weights (defined as heavy physical activity intensity). Sedentariness was also investigated among retired participants, who no longer carries out a work activity. The questionnaire was previously used in an Italian research project sponsored by the National Research Council and in the previous Italian HESs within the CUORE Project [5,12].
2.4. Nutrition and Alcohol Consumption Data Collection
Dietary information was collected by the self-administered Italian version of the European Prospective Investigation into Cancer (EPIC) food frequency questionnaire (FFQ), which focused on diet as a major determinant of health. Accuracy and validation of the dietary questionnaire were of paramount importance since it had to be applied in several countries and to thousands of study participants [13]. The FFQ was designed to capture eating behaviours in the Italian population [14]. The questionnaire included images that defined food portions; it investigated general dietary habits (preferred food items, type of dressing, cooking modalities), frequency of meals consumed away from home and how frequently (weekly, monthly, yearly) each specific food was generally consumed.
For vegetables intake, the following foods were considered: leafy vegetables—cooked, leafy vegetables—raw, other vegetables, tomatoes—raw, tomatoes—cooked, root vegetables, cabbages, mushrooms, grain and pod vegetables, onion, garlic, stalk vegetables, mixed salad and mixed vegetables. For fruits intake, the following foods were considered: citrus fruits and other fruits. For fish intake, the following foods were considered: fish, crustaceans and molluscs. For cheese: cheeses (including fresh cheeses). For sweets/cakes intake, the following foods were considered: sugar, honey, jam, chocolate, candy bars, paste, confetti/flakes, non-chocolate confectionery, ice cream, cakes, pies, pastries, puddings (not milk-based), dry cakes and biscuits. For sweet beverages intake, the following foods were considered: fruit and vegetable juices, carbonated/soft/isotonic drinks and diluted syrups. For cereals intake, the following foods were considered: pasta, rice, white and wholemeal bread, other grains, crispbread, rusks and breakfast cereals. For potatoes intake, the following foods were considered: french fries, boiled potatoes, roasted potatoes, pure potatoes and croquette potatoes. For meats intake, the following foods were considered: beef, veal, pork, horse, chicken, turkey and rabbit (domestic).
A balanced nutrition was defined based on the following intake: vegetables ≥ 200 g/day; fruit 150–375 g/day; fish at least twice per week (150 g per serving); cheese no more than three times per week (50–100 g per serving); sausages, salami and other preserved meat no more than once per week (50 g per serving); cake and desserts no more than once per week (100 g per serving); sugar beverages less than once per week (330 mL); and consumption of alcoholic beverages limited to ≤24 g/day in men 35–64 years, ≤12 g/day in women 35–64 years and ≤12 g/day in men and women 65–74 years old [15,16,17,18,19]. These eight eating habits were also grouped together, and the population was divided into those who had no balanced eating behaviour or only one, and those who had 2, 3, 4, 5 or more balanced eating behaviours, respectively. Food items were linked using specifically designed software [20] to Italian Food Tables [21] to obtain estimates of daily intake of 37 macro- and micronutrients plus energy (not all nutrients are shown in the tables).
2.5. Statistical Analysis
The prevalence of people who followed a healthy lifestyle was evaluated, including them in the group of people who reported being non-smokers, non-sedentariness during leisure time and to have a food consumption comparable to at least five balanced eating behaviours. Educational level was used as a proxy for socioeconomic position; social class was characterized as those with primary/middle school degree (≤8 years)—lower education and those with high school/university degree (>8 years)—higher education. Data are presented separately for men and women, age classes, geographical areas and educational levels as mean, standard deviation and prevalence, with 95% confidence intervals (CI). Following the suggestion reported in the WHO Global NCDs Action Plan 2013–2020 extended to 2030 [1,2], indicators, where appropriate, were age standardized using the direct method, referring to the age- and sex-specific distributions of the Italian adult population in 2019 (Italian National Institute of Statistics—ISTAT) (Tables and figures, and Supplemental Materials Tables S1–S13) [22]. Data were also age-standardized using the European Standard Population (EuStPop) 2013 for international comparisons (Supplemental Materials Tables S14–S25) [23]. ANOVA was used to compare means and chi-square test to compare prevalence among classes. Two-sided p-values < 0.05 were considered statistically significant. Statistical analyses were performed using R software, release 4.2.3.
3. Results
From 2106 participants examined within the HES-CUORE Project 2018–2019, after excluding those with missing data for relevant variables, 2090 participants were considered in the statistical analyses for smoking habit and 2016 for physical activity; 1578 participants were considered in the statistical analyses for nutrition, after excluding those with missing data for relevant variables, those outside the range of the first and last percentile for the total energy consumption and the basal metabolic rate ratio (34 persons), and the participants residing in Abruzzo region with no nutritional data (211 persons).
3.1. Smoking Habit
Prevalence of current smokers of cigarettes was 23% in men and 19% in women, with a mean number of daily smoked cigarettes of 13 and 11, respectively, with significantly lower prevalence in older men (17%) in comparison to the first age-class, with no significant association by educational level and geographical area. In men, the mean number of cigarettes was higher in the older adults and in the Southern regions (Table 1, Tables S1 and S14).

Table 1.
Age-standardized (Italian population) current smokers and former smokers prevalence, and mean number of cigarettes smoked per day, by sex, age classes, geographical area and educational level. Cigarette, cigar and pipe smokers prevalence. Men and women residing in Italy aged 35–74 years, Health Examination Survey 2018–2019—CUORE Project.
Packaged cigarettes were consumed by 70% of smoking men and 84% of smoking women, handmade cigarettes by 19% and 7%, respectively, and electronic ones by 6%, both in smoking men and women. Prevalence of handmade and electronic cigarettes consumption decreased by age-class and among persons with a lower educational level (Figure 1, Figures S1 and S2).
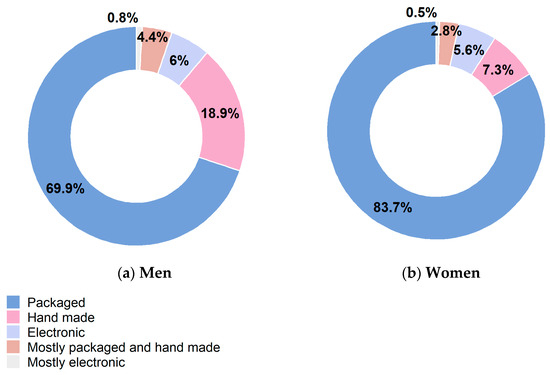
Figure 1.
Age-standardized (Italian population) type of daily consumed cigarettes by sex. Men and women residing in Italy aged 35–74 years, Health Examination Survey 2018–2019—CUORE Project. The pool was made of the following Italian regions: Piedmont, Lombardy, Liguria, Emilia Romagna, Tuscany, Lazio, Abruzzo, Basilicata, Calabria and Sicily. Prevalence was age standardized by Italian National Institute of Statistics—ISTAT Italian population 2019 (except when it is reported by age-classes). (a) Men; (b) Women.
Prevalence of former smokers of cigarettes was 43% in men and 28% in women, showing a significant increasing trend with age in both genders (from 24% of youngers to 47% of older men; from 19% to 30% in corresponding aged women); a decreasing trend with the educational level in men (54% in low educational level to 39% in high educational level), the opposite in women (24% and 30%, respectively). Prevalence of former-smoker men had a significant geographical gradient from Northern/Central Regions (40/41%) to Southern ones (47%); the opposite in women, from Northern/Central Regions (30/34%) to Southern ones (23%) (Table 1, Tables S1 and S14).
3.2. Physical Activity
During leisure time, the most prevalent activities were walking, cycling or engaging in physical activity of some kind for at least 4 h a week (43% of men and 40% of women), closely followed by sedentariness activities (34% and 45%), physical activity as a pastime for at least 3 h a week (20% and 14%) and systematic workout (4% and 2%) (Table 2, Tables S2 and S15, Figure 2 and Figures S3–S6).
Table 2.
Age-standardized (Italian population) sedentariness during leisure time and at work prevalence by sex, age classes, geographical area and educational level. Men and women residing in Italy aged 35–74 years, Health Examination Survey 2018–2019—CUORE Project.
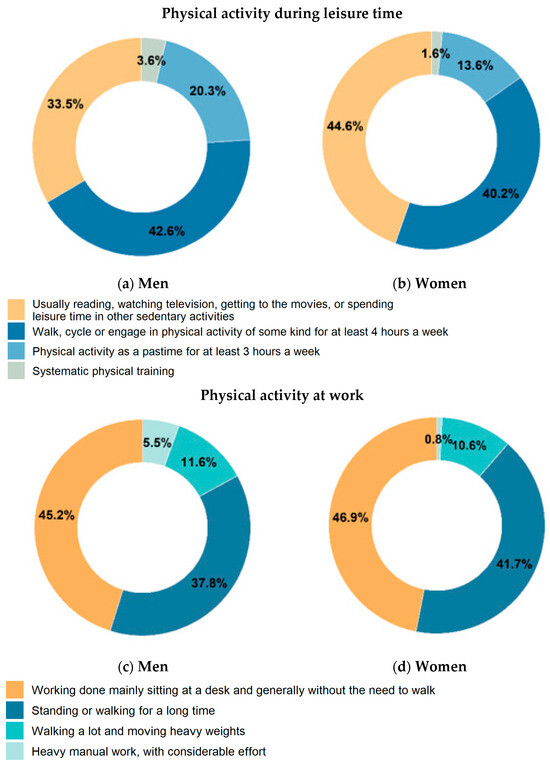
Figure 2.
Age-standardized (Italian population) physical activity during leisure time and at work by sex. Men and women residing in Italy aged 35–74 years, Health Examination Survey 2018–2019—CUORE Project. The pool was made of the following Italian regions: Piedmont, Lombardy, Liguria, Emilia Romagna, Tuscany, Lazio, Abruzzo, Basilicata, Calabria and Sicily. Prevalence was age standardized by Italian National Institute of Statistics—ISTAT Italian population 2019 (except when it is reported by age-classes). (a) Men (b) Women (c) Men (d) Women.
A significantly lower prevalence of sedentariness during leisure time was found in older men (22%) in comparison to the overall prevalence and first two age classes; it rises among retired older adults (37% in men and 56% in women) (Table S3).
During working time, the highest prevalence resulted for sedentariness (45% in men and 47% in women), followed by standing or walking for a long time (38% and 42%, respectively), walking a lot and moving heavy weights (12% and 11%, respectively) and heavy manual work, with considerable effort (6% and 1%, respectively) (Table 2, Tables S2 and S15, Figure 2, Figures S5 and S6).
A significantly lower prevalence of sedentariness at work was found in persons with lower educational level in comparison to those with higher educational level (19% vs. 53% in men, 21% vs. 53% in women) (Table 2, Tables S5, S6 and S15).
Combining physical activity during leisure time and at work in working people, 16% of men and 18% of women were classed as sedentary, with a significantly higher proportion in men and women with a higher educational level in comparison to those with a low educational level (18% vs. 8% in men, 21% vs. 9% in women) (Table 2, Tables S2 and S15).
3.3. Nutrition and Alcohol Consumption
Prevalence of balanced eating behaviours in men and women was, respectively: 28% and 39% for vegetables (a mean of 168 g per day in men and 184 g/day in women), 50% and 52% for fruits (a mean of 268 g/day in men and 276 g/day in women), cheese 45% and 54% (a mean of 43 g/day and 37 g/day, respectively), 11% and 21% for processed meats (36.4 g/day and 24.4 g/day), 44% and 40% for fish (46 g/day and 43 g/day), 9% and 11% for sweets/cakes (84 g/day and 78 g/day), 54% and 60%, for sweet drinks (100 mL/day and 73 mL/day) and 74% and 84% for alcohol consumption (15 mL/day and 6 mL/day) (Table 3, Table 4, Table 5, Table 6, Table 7 and Table 8 and Tables S4–S9, Figure 3).
Table 3.
Age-standardized (Italian population) balanced nutrition food groups intake (EPIC questionnaire): vegetables, fruit, fish and cheese prevalence by sex, age classes, geographical area and educational level. Men and women residing in Italy aged 35–74 years, Health Examination Survey 2018–2019—CUORE Project.
Table 4.
Age-standardized (Italian population) balanced nutrition food groups intake (EPIC questionnaire): processed meat, sweets/cakes, sweet drinks and alcohol prevalence by sex, age classes, geographical area and educational level. Men and women residing in Italy aged 35–74 years, Health Examination Survey 2018–2019—CUORE Project.
Table 5.
Age-standardized (Italian population) food group intake (EPIC questionnaire): vegetables, fruit, fish and cheese mean by sex, age classes, geographical area and educational level. Men and women residing in Italy aged 35–74 years, Health Examination Survey 2018–2019—CUORE Project.
Table 6.
Age-standardized (Italian population) food group intake (EPIC questionnaire): processed meat, sweets/cakes, sweet drinks, and alcohol mean by sex, age classes, geographical area and educational level. Men and women residing in Italy aged 35–74 years, Health Examination Survey 2018–2019—CUORE Project.
Table 7.
Age-standardized (Italian population) food group intake (EPIC questionnaire): cereals, potatoes, legumes and oil mean by sex, age classes, geographical area and educational level. Men and women residing in Italy aged 35–74 years, Health Examination Survey 2018–2019—CUORE Project.
Table 8.
Age-standardized (Italian population) food groups intake (EPIC questionnaire): meat, eggs, milk mean by sex, age classes, geographical area and educational level. Men and women residing in Italy aged 35–74 years, Health Examination Survey 2018–2019—CUORE Project.
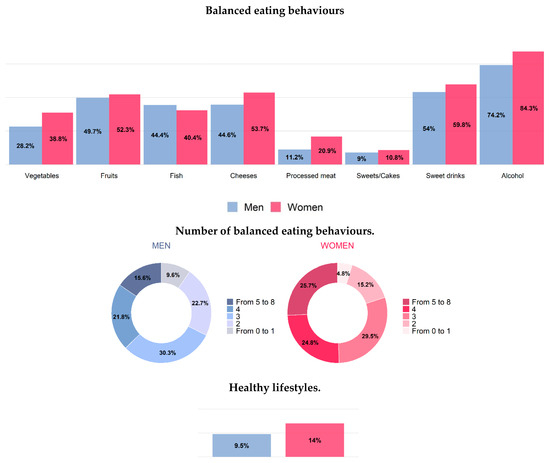
Figure 3.
Age-standardized (Italian population) nutrition and healthy lifestyles (EPIC questionnaire) by sex. Men and women residing in Italy aged 35–74 years, Health Examination Survey 2018–2019—CUORE Project. For vegetables intake, the following foods were considered: leafy vegetables—cooked, leafy vegetables—raw, other vegetables, tomatoes—raw, tomatoes—cooked, root vegetables, cabbages, mushrooms, grain and pod vegetables, onion, garlic, stalk vegetables, mixed salad, mixed vegetables. For fruits intake, the following foods were considered: citrus fruits and other fruits. For fish intake, the following foods were considered: fish, crustaceans and molluscs. For cheese intake, the following foods were considered: cheeses (including fresh cheeses). For processed meat intake, the following foods were considered: sausages, salami and other preserved meat. For sweets/cakes intake, the following foods were considered: sugar, honey, jam, chocolate, candy bars, paste, confetti/flakes, non-chocolate confectionery, ice cream, cakes, pies, pastries, puddings (not milk-based), dry cakes and biscuits. For sweet beverages intake, the following foods were considered: fruit and vegetable juices, carbonated/soft/isotonic drinks and diluted syrups. For alcohol intake, the following foods were considered: alcoholic beverages. These eight eating habits were also grouped together, and the population was divided into those who had no healthy eating behaviour or only one, and those who had, respectively, 2, 3, 4, 5 or more healthy eating behaviours. A balanced nutrition was defined based on the following intake: vegetables ≥ 200 g/day; fruit 150–375 g/day; fish at least twice per week (150 g per serving); cheese no more than three times per week (50–100 g per serving); sausages, salami and other preserved meat no more than once per week (50 g per serving); cake and desserts no more than once per week (100 g per serving); sugar beverages less than one per week (330 mL); and consumption of alcoholic beverages limited to two glasses per day for men (24 g of ethanol), one glass per day for women (12 g of ethanol) and one glass per day for men and women aged 65–74 (12 g of ethanol). Healthy lifestyle: people who reported being non-smokers, not sedentary during leisure time and to have a food consumption comparable to at least five balanced eating behaviours. The pool was made of the following Italian regions: Piedmont, Lombardy, Liguria, Emilia Romagna, Tuscany, Lazio, Basilicata, Calabria and Sicily. Prevalence was age standardized by Italian National Institute of Statistics—ISTAT Italian population 2019 (except when it is reported by age-classes).
Persons with healthy consumption of vegetables resulted tendentially lower among older adults (25% in men, 32% in women), in Southern regions (26% in men, 34% in women) and among persons with lower educational level (25% in men, 32% in women) (Table 3, Table 4, Tables S4 and S16, Figure 4 and Figure 5).
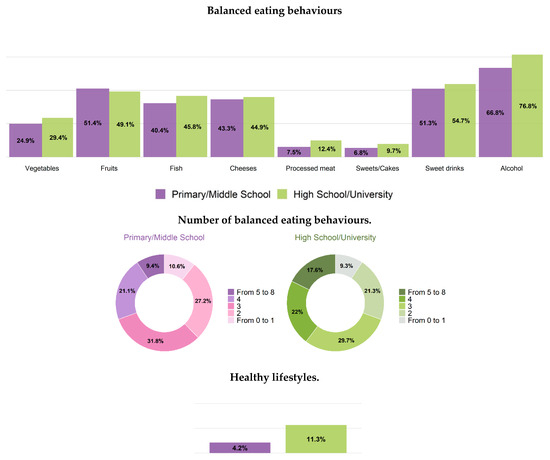
Figure 4.
Age-standardized (Italian population) nutrition and healthy lifestyles (EPIC questionnaire) by education level. Men residing in Italy aged 35–74 years, Health Examination Survey 2018–2019—CUORE Project. For vegetables intake, the following foods were considered: leafy vegetables—cooked, leafy vegetables—raw, other vegetables, tomatoes—raw, tomatoes—cooked, root vegetables, cabbages, mushrooms, grain and pod vegetables, onion, garlic, stalk vegetables, mixed salad and mixed vegetables. For fruits intake, the following foods were considered: citrus fruits and other fruits. For fish intake, the following foods were considered: fish, crustaceans and molluscs. For cheese intake, the following foods were considered: cheeses (including fresh cheeses). For processed meat intake, the following foods were considered: sausages, salami and other preserved meat. For sweets/cakes intake, the following foods were considered: sugar, honey, jam, chocolate, candy bars, paste, confetti/flakes, non-chocolate confectionery, ice cream, cakes, pies, pastries, puddings (not milk-based), dry cakes and biscuits. For sweet beverages intake, the following foods were considered: fruit and vegetable juices, carbonated/soft/isotonic drinks and diluted syrups. For alcohol intake, the following foods were considered: alcoholic beverages. These eight eating habits were also grouped together and the population was divided into those who had no healthy eating behaviour or only one, and those who had, respectively, 2, 3, 4, 5 or more healthy eating behaviours. A balanced nutrition was defined based on the following intake: vegetables ≥ 200 g/day; fruit 150–375 g/day; fish at least twice per week (150 g per serving); cheese no more than three times per week (50–100 g per serving); sausages, salami and other preserved meat no more than once per week (50 g per serving); cake and desserts no more than once per week (100 g per serving); sugar beverages less than one per week (330 mL); and consumption of alcoholic beverages limited to two glasses per day for men (24 g of ethanol), one glass per day for women (12 g of ethanol) and one glass per day for men and women aged 65–74 (12 g of ethanol). Healthy lifestyle: people who reported not being smoker, not sedentariness during leisure time, and to have a food consumption comparable to at least five balanced eating behaviours. The pool was made of the following Italian regions: Piedmont, Lombardy, Liguria, Emilia Romagna, Tuscany, Lazio, Basilicata, Calabria and Sicily. Prevalence was age standardized by Italian National Institute of Statistics—ISTAT Italian population 2019 (except when it is reported by age-classes).
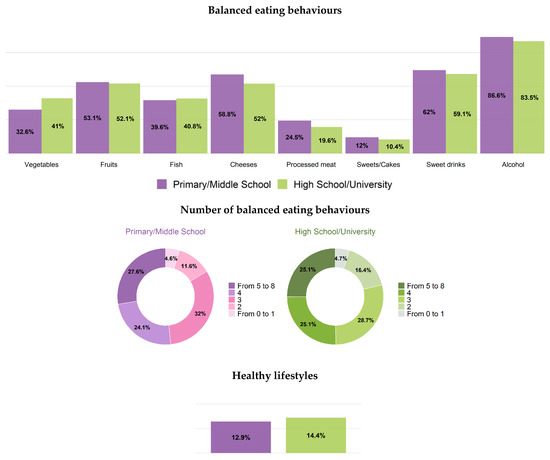
Figure 5.
Age-standardized (Italian population) nutrition and healthy lifestyles (EPIC questionnaire) by education level. Women residing in Italy aged 35–74 years, Health Examination Survey 2018–2019—CUORE Project. For vegetables intake, the following foods were considered: leafy vegetables—cooked, leafy vegetables—raw, other vegetables, tomatoes—raw, tomatoes—cooked, root vegetables, cabbages, mushrooms, grain and pod vegetables, onion, garlic, stalk vegetables, mixed salad, mixed vegetables. For fruits intake, the following foods were considered: citrus fruits and other fruits. For fish intake, the following foods were considered: fish, crustaceans and molluscs. For cheese intake, the following foods were considered: cheeses (including fresh cheeses). For processed meat intake, the following foods were considered: sausages, salami and other preserved meat. For sweets/cakes intake, the following foods were considered: sugar, honey, jam, chocolate, candy bars, paste, confetti/flakes, non-chocolate confectionery, ice cream, cakes, pies, pastries, puddings (not milk-based), dry cakes and biscuits. For sweet beverages intake, the following foods were considered: fruit and vegetable juices, carbonated/soft/isotonic drinks and diluted syrups. For alcohol intake, the following foods were considered: alcoholic beverages. These eight eating habits were also grouped together, and the population was divided into those who had no healthy eating behaviour or only one, and those who had, respectively, 2, 3, 4, 5 or more healthy eating behaviours. A balanced nutrition was defined based on the following intake: vegetables ≥ 200 g/day; fruit 150–375 g/day; fish at least twice per week (150 g per serving); cheese no more than three times per week (50–100 g per serving); sausages, salami and other preserved meat no more than once per week (50 g per serving); cake and desserts no more than once per week (100 g per serving); sugar beverages less than one per week (330 mL); and consumption of alcoholic beverages limited to two glasses per day for men (24 g of ethanol), one glass per day for women (12 g of ethanol) and one glass per day for men and women aged 65–74 (12 g of ethanol). Healthy lifestyle: people who reported not being smoker, not sedentariness during leisure time, and to have a food consumption comparable to at least five balanced eating behaviours. The pool was made of the following Italian regions: Piedmont, Lombardy, Liguria, Emilia Romagna, Tuscany, Lazio, Basilicata, Calabria and Sicily. Prevalence was age-standardized by the Italian National Institute of Statistics—ISTAT Italian population 2019 (except when it is reported by age-classes).
No associations were found between healthy consumption of fruit and class of age, geographical area and educational level (Table 3, Tables S4 and S16, Figure 4 and Figure 5). Prevalence of healthy consumption of cheese was tendentially higher in Southern regions (Table 3, Tables S4 and S16). Healthy consumption of processed meat was significantly lower among younger men and women (6% and 15%, respectively) and in lower educated men (7%) and higher educated women (20%) (Table 4 and Table S17, Figure 4 and Figure 5). Healthy consumption of sweet drinks prevalence was significantly lower among younger men and women (41% and 46%, respectively) (Table 4, Tables S5 and S17, Figure 3). Prevalence of healthy consumption of alcohol significantly decreased by age-class, especially in men, and tendentially increased from Northern to Southern regions, but did not significantly differ by educational level (Table 4, Tables S5 and S17, Figure 3, Figure 4 and Figure 5). The most frequent number of balanced eating behaviours, out of the considered eight, was three both in men and women (about 30%); 12% of men and 23% of women presented with five or more. Prevalence of those with five or more balanced eating behaviours was lower in less-educated men, while similar prevalence was found in both high and low educational level for women (Figure 3, Figure 4 and Figure 5).
Regarding nutrients, significantly lower levels were found in men than in women for total protein (15% of total kcal in men and 16% of total kcal in women), total lipids (35% and 38% of total kcal, respectively), vegetable lipids (17% and 20% of total kcal, respectively), monounsaturated lipids (16% and 18% of total kcal, respectively), simple carbohydrates (19% and 20% of total kcal, respectively), cholesterol (154 and 162 mg/day, respectively); and fibre (10 and 11 g/day). Similar values were found in men and women for saturated fats (11% of total kcal for both sexes), carbohydrate (48% and 47% of total kcal, respectively), vegetables proteins (5% of total kcal for both sexes), animal protein (10% and 11% of total kcal, respectively), animal lipids (18%of total kcal for both sexes), polyunsaturated fat (5% of total kcal for both sexes) and potassium (3 g/day for both sexes). Statistically significant higher levels of sodium were found in men than in women (3 and 2 g/day, respectively) (Table 9, Table 10, Table 11 and Table 12, Tables S10–S13 and S18–S25).
Table 9.
Age-standardized (Italian population) nutrients intake (EPIC questionnaire): proteins (total, animal and vegetable) mean by sex, age classes, geographical area and educational level. Men and women residing in Italy aged 35–74 years, Health Examination Survey 2018–2019—CUORE Project.
Table 10.
Age-standardized (Italian population) nutrients intake (EPIC questionnaire): lipids (animal and vegetable) and cholesterol mean by sex, age classes, geographical area and educational level. Men and women residing in Italy aged 35–74 years, Health Examination Survey 2018–2019—CUORE Project.
Table 11.
Age-standardized (Italian population) nutrients intake (EPIC questionnaire): saturated, polyunsaturated and monounsaturated fat, lipids total mean by sex, age classes, geographical area and educational level. Men and women residing in Italy aged 35–74 years, Health Examination Survey 2018–2019—CUORE Project.
Table 12.
Age-standardized nutrients intake (EPIC questionnaire) fibre, sodium, potassium, carbohydrates and simple carbohydrates mean by sex, age classes, geographical area and educational level. Men and women residing in Italy aged 35–74 years, Health Examination Survey 2018–2019—CUORE Project.
Associations between nutrients and subgroups of population are worth mentioning: significantly lower levels were found in older men and women for total lipid, animal lipids, saturated fats, polyunsaturated fats and sodium; significant higher levels were found in older men and women for fibre and vegetables proteins; significant higher levels were found in men and women from Southern Regions for cholesterol, animal lipids and carbohydrate, lower levels for vegetables lipid; significant lower level were found in men and women from Northern Regions for fibre and vegetables proteins; significant higher levels were found in men and women with low educational level for cholesterol, vegetables proteins, vegetables lipids, lower levels for fibre (Table 9, Table 10, Table 11 and Table 12, Tables S10–S13 and S18–S25).
3.4. Healthy Lifestyles
Prevalence of people who followed a correct lifestyle (non-smoker, non-sedentary during leisure time and reporting at least five healthy eating behaviours) was 10% in men and 14% in women, with a higher prevalence in those with high educational level, especially in men (4% vs. 11% in men, 13% vs. 14% in women) (Figure 3, Figure 4 and Figure 5).
4. Discussion
Data on smoking habit collected within the Italian HES—CUORE Project in random samples of the general Italian population aged 35–74 years during 2018–2019 showed about a fifth of the population as current smokers of cigarettes, with consistently higher levels for men than for women in all age-groups, geographical areas and educational levels; the same was found for the number of smoked cigarettes among smokers. Over 60% of men and about 50% of women are or have been habitual smokers. Regardless of gender, geographical area or level of education, the most consumed type of cigarette remains the packaged, followed by the handmade, with a prevalence of use of electronic cigarette not higher than 10%.
Data on physical activity collected within the Italian HES—CUORE Project during 2018–2019 showed about a third of men and almost half of women conducting no physical activity in their free time, with peaks of 66% in women living in a Southern region. Physical inactivity at work was around 46% in both men and women; it exceeds 50% in people with a higher educational level versus around 20% in people with a lower educational level. Just less than 2 in 10 people live in a sedentary condition both at work and during leisure time. Among retirees, more than a third of men and half of women follow a sedentary lifestyle.
Data on nutrition collected within the Italian HES 2018–2019—CUORE Project showed that women more frequently than men had a number of balanced eating behaviours equal to or greater than four (out of eight). More than two-thirds of men and women consumed alcohol within the limits of consumption in relation to the gender and age; around 4/5 in 10 men and women consume amounts of fruit, fish, cheese and sugary drinks as recommended by the Italian guidelines for an healthy nutrition [15]; less than 3 in 10 men and about 3 in 10 women consume the right amount of vegetables, while the correct consumption of processed meat does not exceed 1 in 10 people in men and 2 in women; 1 in 10 also met the recommended consumption of sweets/cakes both in men and women. There was a greater propensity in people with a higher educational level, especially men, to have healthy consumption of vegetables, processed meat and sweets/cakes, which represent, among the food groups considered (vegetables, fruits, fish, cheeses, processed meat, sweets/cakes, sweet drinks and alcohol), the food groups with the lowest prevalence of balanced eating behaviours.
Regarding the older adults, a better lifestyle profile was found compared to the general population, in fact the results showed tendentially lower prevalence of smoking habit and a higher prevalence of former smokers, significantly lower prevalence of sedentariness during leisure time, significantly higher prevalence of healthy consumption of processed meat, sweet drinks, alcohol, significantly lower levels of total lipid, animal lipids, saturated fats, polyunsaturated fats and sodium and significantly higher levels of for fibre and vegetables proteins.
In comparison to previous HES conducted at national level in Italy, prevalence of current smokers 2018–2019 decreased compared to 20 years before (1998–2002) and very slightly declined compared to 10 years before (2008–2012), both in men and women, while former smokers increased [5,24]. The trend of current-smoker prevalence is consistent with WHO data that showed the age-standardized tobacco use prevalence rates are declining, on average, in all WHO regions; in particular, in the European region, a relatively slow decline is being recorded [25]; prevalence and trends are also consistent with other Italian studies [26,27]. A 30% relative reduction in prevalence of current tobacco use within 2025, extended to 40% within 2030 (WHO targets for the prevention of NCDs), in Italy means a reduction in absolute terms of 7% in men and 6% in women within 2025, considering the 2008–2012 smoking prevalence as the reference (24% and 20% of cigarettes smokers in men and in women); reductions very far from the approximately 1% and 1.5% decline resulted in 2019 in men and in women, respectively [1,2,5,24].
Compared to 10 years before (2008–2012), the 2018–2019 prevalence of a sedentariness lifestyle during leisure time increased, both in men and women, returning to around the values found 20 years before (1998–2002) and showing an increase in the gap between levels of education in both sexes [5]. Prevalence of sedentariness from the HES 2018–2019 was in line with the European results showing that more than one third of adults are insufficiently active [28], with an increasing trend in high-income Western countries [29] and with the propensity of women to be less active than men [28,29]. A 10% relative reduction in prevalence of sedentariness lifestyle within 2025, extended to 15% within 2030 (WHO targets for the prevention of NCDs), in Italy means a reduction in absolute terms of 3% in men and 4% in women within 2025, considering the 2008–2012 prevalence of sedentariness during leisure time as the reference (32% and 42% of sedentariness in men and women). Taking into account the observed trend until 2019, a stable reversal trend will represent a first goal [1,2,5,24].
Compared to 10 years before (2008–2012), the prevalence of balanced eating behaviours in 2018–2019 in Italy improved for vegetables and sweets/cakes in women, and for fish, sweet drinks and alcohol in both sexes; but got worse for fruits and processed meat in both men and women, and sweets/cakes in men [5]. Mean intake of food groups was less than desirable, particularly for vegetables and fibres [30]. Mean intake of nutrients resulted in desirable intervals, except for an excessive consumption of total lipid, both saturated fat and polyunsaturated fat, simple carbohydrates and not enough intake of fibre and potassium; mean level of nutrients remains stable, except for a decreased cholesterol and fibre intake, both in men and women [31]. Mean values of sodium intake were significantly lower than those assessed in the same samples through the 24 h collection through which excessive consumption was found [8]; this result was due to the fact that questionnaires are not able to register the discretionary salt added during the preparation of meals and at table, which is instead included in the measurement carried out by the urine collection method; a similar order of difference was found for potassium consumption between the two methods of collection [9]. There was no homogeneity in fruit and vegetable consumption across European countries: fruit consumption increased from 1950 to 2019 in Northern and Western Europe, while the greatest increase in vegetable consumption occurred in the Middle East and Northern Europe, followed by Western Europe [32,33].
About the alcohol consumption, it is worth specifying that although protective associations have been reported in the literature between occasional consumption of alcohol and coronary heart disease, ischemic stroke and diabetes, according to WHO, net of all supposed benefits, the harmful effects of alcohol consumption on health are nonetheless preponderant [34,35]. In Italy, the guidelines for low-risk consumption have been included in the Scientific Dossier of the Guidelines for balanced eating [36,37], edited by the Council for Research in Agriculture and Agricultural Economics (CREA), reiterating that there are no safe levels of alcohol consumption. The non-“excess habitual consumption” is considered here as “healthy” way of consuming alcoholic beverages considering the limits of alcoholic beverages consumption in relation to the gender and age of the person [16,17,18,19].
Overall, the prevalence of healthy lifestyles assessed in the HES 2018–2019 was higher than 10 years earlier (2008–2012) both in men and women; in men the prevalence increased for both educational level, in women in those with lower educational level. The prevalence of people with at least five correct eating habits was higher than 10 years earlier (2008–2012), especially among men with higher education and women with lower education; a slight decreasing trend of people with only one or less correct eating habits was found [5,25].
Major strengths of this study are the following: the use of standardized questionnaires to collect very detailed data on smoking habit, physical activity, and, in a particular way, on nutrition; a good national coverage with the enrolment of study participants from half of the Italian regions distributed in the northern, central and southern areas of the country; the use of randomly selected samples of the general population stratified by sex and age-group. Conversely, we acknowledge some study limitations, which should be taken in consideration when interpreting results. First, because of the choice of urban districts for the random selection of the study participants, the results may not be representative of the population living in rural areas. The participation rates in the surveys were lower than desirable, yet consistent, taking into account the low contact rates occurring in more highly urbanized areas and the decreasing trend of participation observed in the HESs implemented in other European countries [38].
5. Conclusions
Data from some main lifestyle factors such as smoking habit, physical activity and nutrition collected within the Italian HES—CUORE Project in random samples of the general Italian population aged 35–74 years during 2018–2019 still showed epidemic levels of prevalence of current smokers, physical inactivity and incorrect eating behaviours, with an increasing prevalence of combined healthy lifestyles (not smoker, engaged in some regular physical activity and reporting at least five correct eating behaviours) which remains more prevalent in women. The prevalence of individual lifestyles is overall stable with small variations: slight decrease in smoking habit, slight increase in sedentariness during leisure time, slight increase in healthy consumption of vegetable and fish and slight decrease in healthy consumption of processed meat. The overall Italian picture of slight improvements in some healthy lifestyle factors and in the prevalence of combined correct lifestyles, together with the reduction in blood pressure and salt consumption, as well as the stop to the increasing obesity detected in the HES 2018–2019 as compared to the previous 10 years in the Italian general adult population, can be considered a partial success [6,7,8]. National and local cross-sectoral strategies, based on actions that involve different sectors of society and institutions, and specific interventions to fight smoking and alcohol abuse and to promote physical activity and balanced eating should be continued, as well as the monitoring of lifestyles and related risk factors and conditions.
Supplementary Materials
The following supporting information can be downloaded at: https://www.mdpi.com/article/10.3390/healthcare12040475/s1.
Author Contributions
Conceptualization, C.D.; Data curation, C.D., B.M., S.S. and C.L.N.; Formal analysis, C.D. and B.M.; Investigation, C.D., B.B., A.D.L., C.L.N. and E.P.; Methodology, C.D., S.S., A.D.L., C.L.N., C.A., S.V. and L.P.; Project administration, C.D.; Software, F.V. (Francesca Vespasiano); Supervision, C.D.; Writing—original draft, C.D.; Writing—review & editing, C.D., B.B., B.M., S.S., A.D.L., C.L.N., E.P., F.V. (Francesca Vespasiano), C.A., S.V., M.S., D.G., P.B., F.V. (Francesco Vaia) and L.P. All authors have read and agreed to the published version of the manuscript.
Funding
The Health Examination Survey (HES) 2018-2019 within the CUORE Project was pro-moted and funded by the Italian Ministry of health -National Centre for Disease Prevention and Control (CCM) for activities related to the CCM 2017 project-Central Actions Area—entitled “Monitoring of the average daily consumption of sodium in the Italian population”. The HES 2018-2019 was also funded by the Italian National Institute of Health (Istituto Superiore di Sanità—ISS) through permanent staff salary and some travels refund.
Institutional Review Board Statement
The study was conducted in accordance with the Declaration of Helsinki, and approved by the the Ethical Committee of the Italian National Institute of Health (Istituto Superiore di Sanità—ISS) on 14 March 2018 (Prot. PRE 1176/18).
Informed Consent Statement
Informed consent was obtained from all subjects involved in the study. Written informed consent has been obtained from the patient(s) to publish-aggregate data as included in this paper.
Data Availability Statement
The data are not publicly available due to ethical and legal restrictions on data sharing.
Acknowledgments
Research Group of the Health Examination Survey (HES) 2018–2019 within the CUORE Project: Chiara Donfrancesco (coordinator), Luigi Palmieri, Cinzia Lo Noce, Anna Di Lonardo, Elisabetta Profumo, Brigitta Buttari, Serena Vannucchi, Simona Giampaoli (former coordinator) (Italian National Institute Health -Istituto Superiore di Sanità, ISS). Local referents of HES 2018–2019 partecipating Centres: Luigi Dell’Orso and Alessandro Grimaldi (Ospedale San Salvatore, L’Aquila); Nicola Giordano (ASL—Azienda Sanitaria Locale di Potenza, Potenza); Carmelo Caserta (Centro di Medicina Solidale—Associazione Calabrese di Epatologia, Reggio Calabria); Alessandra Fabbri (Casa della Salute AUSL RE, Montecchio Emilia); Fabrizio Ciaralli (Casa della Salute S. Caterina della Rosa, Rome); Fiorella Bagnasco (Municipality of Arenzano, Arenzano—Genova); Giuliana Rocca (ATS Bergamo); Giuseppe Salamina (ASL Città di Torino, Torino); Pietro Modesti (Università di Firenze, Florence); Federico Vancheri and Giulio Geraci (Ospedale S. Elia, Caltanissetta). We would also like to thank for HES 2018–2019: Anna Rita Ciccaglione, Cinzia Marcantonio, Roberto Bruni (ISS), Emanuele Bottosso and Anna Acampora (as trainee medical doctor at ISS), Giulia Cairella (ASL Roma 2, SINU) and Municipality of Potenza. Fondazione IRCCS, Istituto nazionale dei tumori, Milano: Sabina Sieri, Vittorio Krogh, Sara Grioni. Research Group MINISAL-GIRCSI and MENO SALE PIU’ SALUTE: Pasquale Strazzullo, Ornella Russo, Lanfranco D’Elia, Roberto Iacone, Renato Ippolito, Enrico Agabiti-Rosei, Angelo Campanozzi, Marina Carcea, Ferruccio Galletti, Licia Iacoviello, Luca Scalfi, Alfonso Siani, Daniela Galeone, Chiara Donfrancesco, Simona Giampaoli. CARHES Research Group: Luca De Nicola, Chiara Donfrancesco, Roberto Minutolo, Cinzia Lo Noce, Luigi Palmieri, Amalia De Curtis, Licia Iacoviello, Carmine Zoccali, Loreto Gesualdo, Giuseppe Conte, Diego Vanuzzo, Simona Giampaoli. Italian Ministry of Health: Daniela Galeone, Paolo Bellisario, Giovanna Laurendi, Bianca Maria Polizzi. European Health Examination Survey, Reference Centre: Hanna Tolonen, Kari Kuulasmaa, Paivikki Koponen, Johan Heldan, Susanna Conti, Georg Alfthan. Administrative staff of the ISS: Claudia Meduri, Tiziana Grisetti, Matilde Bocci, Gabriella Martelli, Valerio Occhiodoro, Francesca Meduri. We acknowledge all persons who decided to participate to the 2018–2019 survey.
Conflicts of Interest
The authors declare no conflicts of interest.
References
- WHO. Global Action Plan for the Prevention and Control of Noncommunicable Diseases 2013–2020; World Health Organization: Geneva, Switzerland, 2013. [Google Scholar]
- WHO. Discussion Paper for The Regional Expert Consultations—Development of An Implementation Roadmap 2023–2030 for The Global Action Plan for The Prevention and Control of Ncds 2013–2030. (Version Dated 20 August 2021). Available online: https://www.who.int/publications/m/item/implementation-roadmap-2023-2030-for-the-who-global-action-plan-for-the-prevention-and-control-of-ncds-2023-2030 (accessed on 22 March 2022).
- Noncommunicable Diseases Country Profiles 2018. World Health Organization 2018. Available online: https://apps.who.int/iris/handle/10665/274512 (accessed on 22 March 2022).
- OECD/European Observatory on Health Systems and Policies. Italy: Country. Health Profile 2019, State of Health in the EU; OECD Publishing: Paris, France; European Observatory on Health Systems and Policies: Brussels, Belgium, 2019. [Google Scholar]
- Giampaoli, S.; Palmieri, L.; Donfrancesco, C.; Lo Noce, C.; Pilotto, L.; Vanuzzo, D. Osservatorio Epidemiologico Cardiovascolare/Health Examination Survey Research Group. Cardiovascular health in Italy. Ten-year surveillance of cardiovascular diseases and risk factors: Osservatorio Epidemiologico Cardiovascolare/Health Examination Survey 1998–2012. Eur. J. Prev. Cardiol. 2015, 22 (Suppl. S2), 9–37. [Google Scholar] [PubMed]
- Donfrancesco, C.; Di Lonardo, A.; Lo Noce, C.; Buttari, B.; Profumo, E.; Vespasiano, F.; Vannucchi, S.; Galletti, F.; Onder, G.; Gulizia, M.M.; et al. Trends of blood pressure, raised blood pressure, hypertension and its control among Italian adults: CUORE Project cross-sectional health examination surveys 1998/2008/2018. BMJ Open 2022, 12, e064270. [Google Scholar] [CrossRef] [PubMed]
- Donfrancesco, C.; Profumo, E.; Lo Noce, C.; Minutoli, D.; Di Lonardo, A.; Buttari, B.; Vespasiano, F.; Vannucchi, S.; Galletti, F.; Onder, G.; et al. Trends of overweight, obesity and anthropometric measurements among the adult population in Italy: The CUORE Project health examination surveys 1998, 2008, and 2018. PLoS ONE 2022, 17, e0264778. [Google Scholar] [CrossRef] [PubMed]
- Donfrancesco, C.; Noce, C.L.; Russo, O.; Minutoli, D.; Di Lonardo, A.; Profumo, E.; Buttari, B.; Iacone, R.; Vespasiano, F.; Vannucchi, S.; et al. Trend of salt intake measured by 24-h urine collection in the Italian adult population between the 2008 and 2018 CUORE project surveys. Nutr. Metab. Cardiovasc. Dis. 2021, 31, 802–813. [Google Scholar] [CrossRef] [PubMed]
- Donfrancesco, C.; Noce, C.L.; Russo, O.; Buttari, B.; Profumo, E.; Minutoli, D.; Di Lonardo, A.; Iacone, R.; Vespasiano, F.; Vannucchi, S.; et al. Trend in potassium intake and Na/K ratio in the Italian adult population between the 2008 and 2018 CUORE project surveys. Nutr. Metab. Cardiovasc. 2021, 31, 814–826. [Google Scholar] [CrossRef] [PubMed]
- European Health Examination Survey (EHES)—Measuring the Health of Europeans. Available online: http://www.ehes.info/national/national_hes_status.htm (accessed on 22 March 2022).
- Tolonen, H.; Project, F.T.E.P.; Koponen, P.; Naska, A.; Männistö, S.; Broda, G.; Palosaari, T.; Kuulasmaa, K. EHES Pilot Project. Challenges in standardization of blood pressure measurement at the population level. BMC Med. Res. Methodol. 2015, 15, 33. [Google Scholar] [CrossRef]
- Gruppo di Ricerca. CNR ATS-RF2. I fattori di rischio dell’aterosclerosi in Italia. La fase A del progetto CNR-RF2. G. Ital. Cardiol. 1980, 11 (Suppl. S3), 1–184. [Google Scholar]
- Kaaks, R.; Slimani, N.; Riboli, E. Pilot Phase Studies on the Accuracy of Dietary Intake Measurements in the Epic Project: Overall Evaluation of Results. European Prospective Investigation into Cancer and Nutrition. Int. J. Epidemiol. 1997, 26, S26–S36. [Google Scholar] [CrossRef]
- Pisani, P.; Faggiano, F.; Krogh, V.; Palli, D.; Vineis, P.; Berrino, F. Relative Validity and Reproducibility of a Food Frequency Dietary Questionnaire for Use in the Italian EPIC Centres. Int. J. Epidemiol. 1997, 26, S152–S160. [Google Scholar] [CrossRef]
- Centro di ricerca CREA-Alimenti e Nutrizione. Linee Guida Per Una Sana Alimentazione. Revisione 2018. Available online: https://www.crea.gov.it/documents/59764/0/LINEE-GUIDA+DEFINITIVO.pdf/28670db4-154c-0ecc-d187-1ee9db3b1c65?t=1576850671654 (accessed on 17 December 2023).
- Scafato, E.; Ghirini, S.; Gandin, C.; Matone, A.; Vichi, M.; Scipione, R.; Palma, G. e il gruppo di lavoro CSDA (Centro Servizi Documentazione Alcol). Epidemiologia e monitoraggio alcol-correlato in Italia e nelle Regioni. In Valutazione Dell’Osservatorio Nazionale Alcol Sull’Impatto del Consumo di Alcol ai Fini Dell’Implementazione Delle Attività del Piano Nazionale Alcol e Salute. Rapporto 2021; Istituto Superiore di Sanità: Rome, Italy, 2021; (Rapporti ISTISAN 21/7). [Google Scholar]
- Ministero Della Salute, Direzione Generale Della Prevenzione Sanitaria—Ufficio 6. Relazione del Ministro della Salute al parlamento sugli interventi realizzati ai sensi della legge 30.3.2001 n. 125. In Legge Quadro in Materia di Alcol e Problemi Alcol-correlati; Ministero Della Salute: Rome, Italy, 2020. Available online: https://www.salute.gov.it/portale/documentazione/p6_2_2_1.jsp?lingua=italiano&id=3059 (accessed on 17 December 2023).
- Scafato, E.; Ghirini, S.; Gandin, C.; Vichi, M.; Matone, A.; Scipione, R. Consumo di alcol. Rapporto Osservasalute 2020. In Stato di Salute e Qualità Dell’Assistenza Nelle Regioni Italiane; Università Cattolica del Sacro Cuore: Rome, Italy, 2021; Available online: https://www.osservatoriosullasalute.it/osservasalute/rapporto-osservasalute-2020 (accessed on 17 December 2023).
- Scafato, E.; Ghirini, S.; Gandin, C.; Matone, A.; Vichi, M. Gruppo di Lavoro CSDA (Centro Servizi Documentazione Alcol). Epidemiologia e monitoraggio alcol-correlato in Italia e nelle Regioni. In Valutazione Dell’Osservatorio Nazionale Alcol Sull’Impatto del Consumo di Alcol ai Fini Dell’Implementazione Delle Attività del Piano Nazionale Alcol e Salute; Rapporto 2022; Istituto Superiore di Sanità: Rome, Italy, 2022; Volume viii, p. 68, Rapporti ISTISAN 22/1; Available online: https://www.iss.it/-/rapporti_istisan_22_1 (accessed on 17 December 2023).
- Pala, V.; Sieri, S.; Palli, D.; Salvini, S.; Berrino, F.; Bellegotti, M.; Frasca, G.; Tumino, R.; Sacerdote, C.; Fiorini, L.; et al. Diet in the Italian EPIC Cohorts: Presentation of Data and Methodological Issues. Tumori 2003, 89, 594–607. [Google Scholar] [CrossRef] [PubMed]
- Salvini, S.; Parpinel, M.; Gnagnarella, P.; Maissoneuve, P.; Turrini, A. Banca Dati Composizione Degli Alimenti per Studi Epidemiologici in Italia; European Institute of Oncology: Milano, Italy, 1998. [Google Scholar]
- National Institute of Statistics. Resident Population 1991–2019. Available online: http://dati.istat.it/Index.aspx?DataSetCode=DCIS_RICPOPRES2011 (accessed on 22 March 2022).
- Revision of the European Standard Population—Report of Eurostat’s Task Force—2013 Edition. Available online: https://ec.europa.eu/eurostat/documents/3859598/5926869/KS-RA-13-028-EN.PDF/e713fa79-1add-44e8-b23d-5e8fa09b3f8f (accessed on 22 March 2022).
- CUOREDATA Platform—The CUORE Project. Available online: http://www.cuore.iss.it/eng/survey/cuoredata (accessed on 17 December 2023).
- WHO Global Report on Trends in Prevalence of Tobacco Use 2000–2025, Fourth Edition. Available online: https://www.who.int/publications/i/item/9789240039322 (accessed on 17 December 2023).
- Lugo, A.; Zuccaro, P.; Pacifici, R.; Gorini, G.; Colombo, P.; La Vecchia, C.; Gallus, S. Smoking in Italy in 2015–2016: Prevalence, trends, roll-your-own cigarettes, and attitudes towards incoming regulations. Tumori 2017, 103, 353–359. [Google Scholar] [CrossRef] [PubMed]
- PASSI Platform. Available online: https://www.epicentro.iss.it/passi/dati/fumo?tab-container-1=tab1 (accessed on 17 December 2023).
- WHO. Physical Activity Strategy for the WHO European Region 2016–2025. Available online: https://apps.who.int/iris/handle/10665/329407 (accessed on 17 December 2023).
- Guthold, R.; Stevens, G.A.; Riley, L.M.; Bull, F.C. Worldwide trends in insufficient physical activity/sedentariness from 2001 to 2016: A pooled analysis of 358 population-based surveys with 1·9 million participants. Lancet Glob. Health 2018, 6, e1077–e1086. [Google Scholar] [CrossRef] [PubMed]
- 2021 ESC Guidelines on cardiovascular disease prevention in clinical practice. Eur. Heart J. 2021, 42, 3227–3337. [CrossRef] [PubMed]
- Dokova, K.G.; Pancheva, R.Z.; Usheva, N.V.; Haralanova, G.A.; Nikolova, S.P.; Kostadinova, T.I.; Egea Rodrigues, C.; Singh, J.; Illner, A.K.; Aleksandrova, K. Nutrition Transition in Europe: East-West Dimensions in the Last 30 Years-A Narrative Review. Front. Nutr. 2022, 9, 919112. [Google Scholar] [CrossRef] [PubMed]
- Sikorski, C.; Yang, S.; Stennett, R.; Miller, V.; Teo, K.; Anand, S.S.; Paré, G.; Yusuf, S.; Dehghan, M.; Mente, A. Changes in energy, macronutrient, and food consumption in 47 countries over the last 70 years (1950–2019): A systematic review and meta-analysis. Nutrition 2023, 108, 111941. [Google Scholar] [CrossRef] [PubMed]
- Giampaoli, S.; Krogh, V.; Grioni, S.; Palmieri, L.; Gulizia, M.M.; Stamler, J.; Vanuzzo, D. Research group Osservatorio epidemiologico cardiovascolare/Health Examination Survey. Epidemiol. Prev. 2015, 39, 373–379. [Google Scholar] [PubMed]
- Forouzanfar, M.H.; Afshin, A.; Alexander, L.T.; Anderson, H.R.; Bhutta, Z.A.; Biryukov, S.; Brauer, M.; Burnett, R.; Cercy, K.; Charlson, F.J.; et al. Global, regional, and national comparative risk assessment of 79 behavioural, environmental and occupational, and metabolic risks or clusters of risks in 188 countries, 1990–2013: A systematic analysis for the Global Burden of Disease Study 2013. Lancet 2015, 386, 2287–2323. [Google Scholar] [CrossRef] [PubMed]
- Shield, K.D.; Parry, C.; Rehm, J. Chronic diseases and conditions related to alcohol use. Alcohol. Res. 2013, 35, 155–173. [Google Scholar] [PubMed]
- Centro di Ricerca Alimenti e Nutrizione; Natella, F.; Canali, R.; Galluzzo, L.; Gandin, C.; Ghirini, S.; Ghiselli, A.; La Vecchia, C.; Pelucchi, C.; Peparaio, M.; et al. Capitolo 9: Bevande alcoliche. In: Linee guida per una sana alimentazione. In Dossier Scientifico. Edizione 2018; Centro di Ricerca Alimenti e Nutrizione (CREA): Rome, Italy, 2020; pp. 979–1086. [Google Scholar]
- CREA. Linee guida per una sana alimentazione. Dossier scientifico. In Edizione 2018; Centro di Ricerca Alimenti e Nutrizione: Rome, Italy, 2020; Disponibile all’indirizzo. Available online: https://www.crea.gov.it/documents/59764/0/Dossier+Scientifico+Linee+Guida+2018.pdf/58910724-956c-d5de-9ee6-8b271835e206?t=1587466323780 (accessed on 17 December 2023).
- Mindell, J.S.; Giampaoli, S.; Goesswald, A.; Kamtsiuris, P.; Mann, C.; Männistö, S.; Morgan, K.; Shelton, N.J.; Verschuren, W.M.; Tolonen, H.; et al. Sample selection, recruitment and participation rates in health examination surveys in Europe experience from seven national surveys. BMC Med. Res. Methodol. 2015, 15, 78. [Google Scholar] [CrossRef]
Disclaimer/Publisher’s Note: The statements, opinions and data contained in all publications are solely those of the individual author(s) and contributor(s) and not of MDPI and/or the editor(s). MDPI and/or the editor(s) disclaim responsibility for any injury to people or property resulting from any ideas, methods, instructions or products referred to in the content. |
© 2024 by the authors. Licensee MDPI, Basel, Switzerland. This article is an open access article distributed under the terms and conditions of the Creative Commons Attribution (CC BY) license (https://creativecommons.org/licenses/by/4.0/).