
Computer Vision for Parkinson’s Disease Evaluation: A Survey on Finger Tapping

 , , , , and
Abstract
1. Introduction
2. Related Works
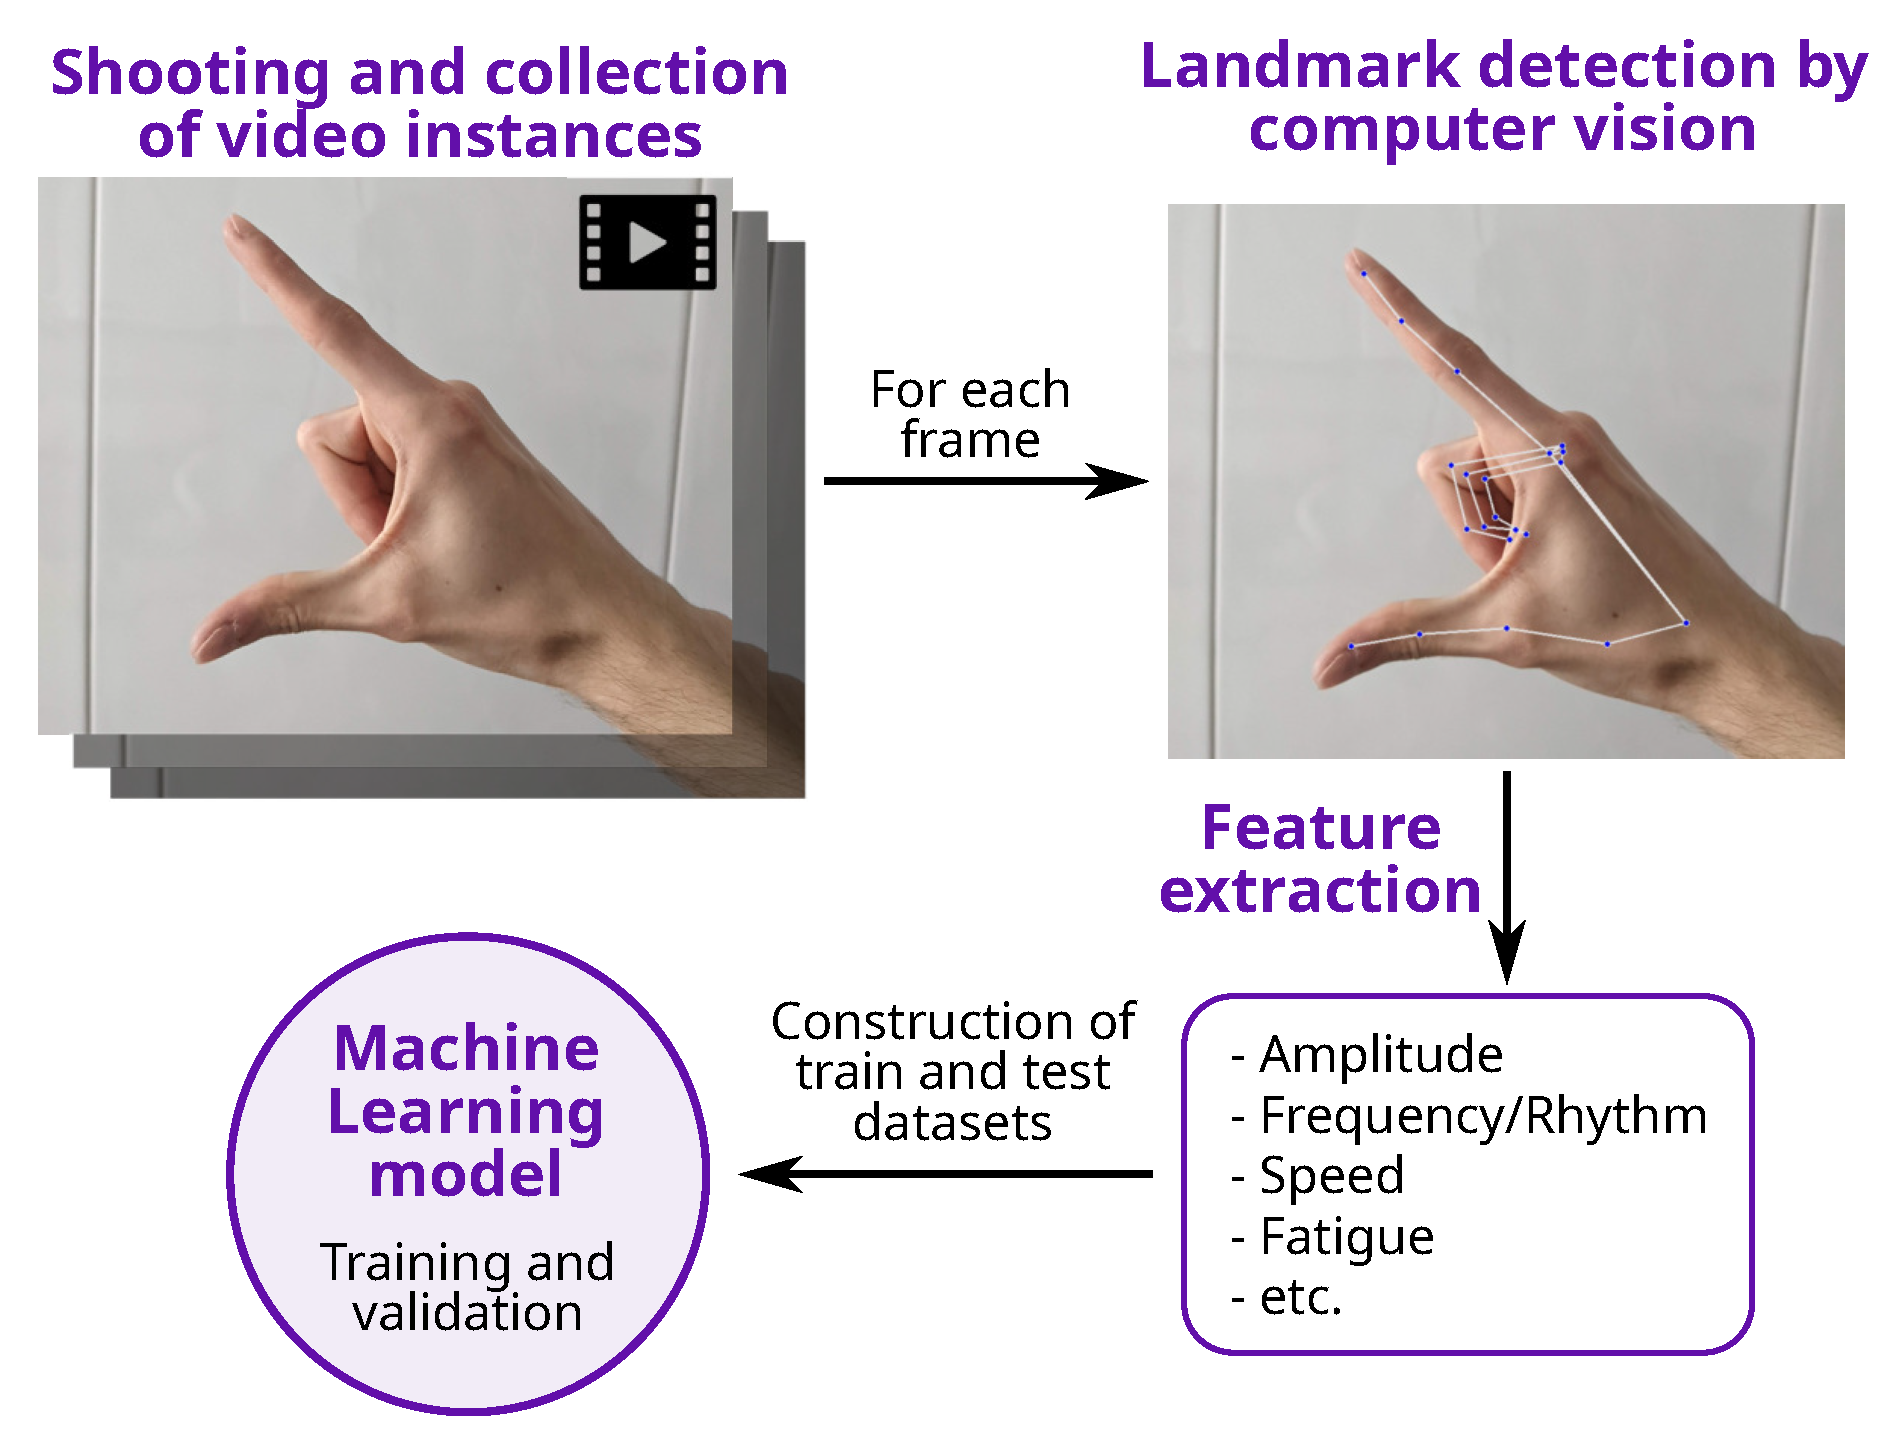
3. Finger Tapping and Computer Vision on Parkinson’s Disease Evaluation
3.1. Feature Extraction
- Mediapipe [26] is an open-source framework, developed by Google, which provides real-time processing of multimedia data, including video and audio. It includes several modules for CV tasks, including pose estimation, face detection, hand detection, and object tracking.
- Openpose [24], developed by the Computer Vision Center at the Autonomous University of Barcelona, was released in 2016. It is a real-time multi-person human pose detection library with the capability of jointly detecting the human body, foot, hand, and facial keypoints on single images.
- MMPose [38] is an open-source toolbox for pose estimation based on PyTorch. It supports: multi-person human pose estimation, 133 keypoint whole-body human pose estimation, hand pose estimation, and 3D human mesh recovery.
- Amplitude and Speed: the two most common features to be analyzed for PD assessment using FT. Nevertheless, they are not considered in quite the same way in all works, although there are no semantic differences regarding the way that those features are to be understood in FT:
- –
- Amplitude: distance between thumb and index fingers.
- –
- Speed: amplitude difference over time.
For example, a common approach is to obtain the values during the time series, but other authors also compute the mean or maximum value, a maximum value during the opening or the closing phases, minimum, standard deviation, etc. In other words, once the feature is considered, several metrics could be extracted, which will obviously differ across the different studies. - Fatigue: this feature is evaluated in few articles, yet the approaches used for its estimation vary. It should be noted that it is not a physical value, such as amplitude and speed. The concept itself is similar in the different articles, but essential nuances in its estimation were identified. For example:
- –
- Difference between the highest and the lowest values of amplitude peaks [42].
- –
- Gradient in amplitude according to time [43].
- –
- Other authors [37] evaluated fatigue on the basis of different measures:
- *
- Difference between number of taps in two time slots.
- *
- Variation coefficient (VC) in tapping speed.
- *
- Difference between the average/VCs maximum amplitude of finger taps in two time slots.
- *
- VC in the maximum amplitude of finger taps.
- *
- Tapping acceleration.
- Frequency/Rhythm: without a doubt, the most abstract feature. Both concepts are used indistinctly, but not always for representing the same concept:
- –
- –
- –
- Buongiorno et al. [40] used the averaged value of the division between the amplitude peak reached in a single exercise trial and the time duration of the trial.
3.2. Classifiers
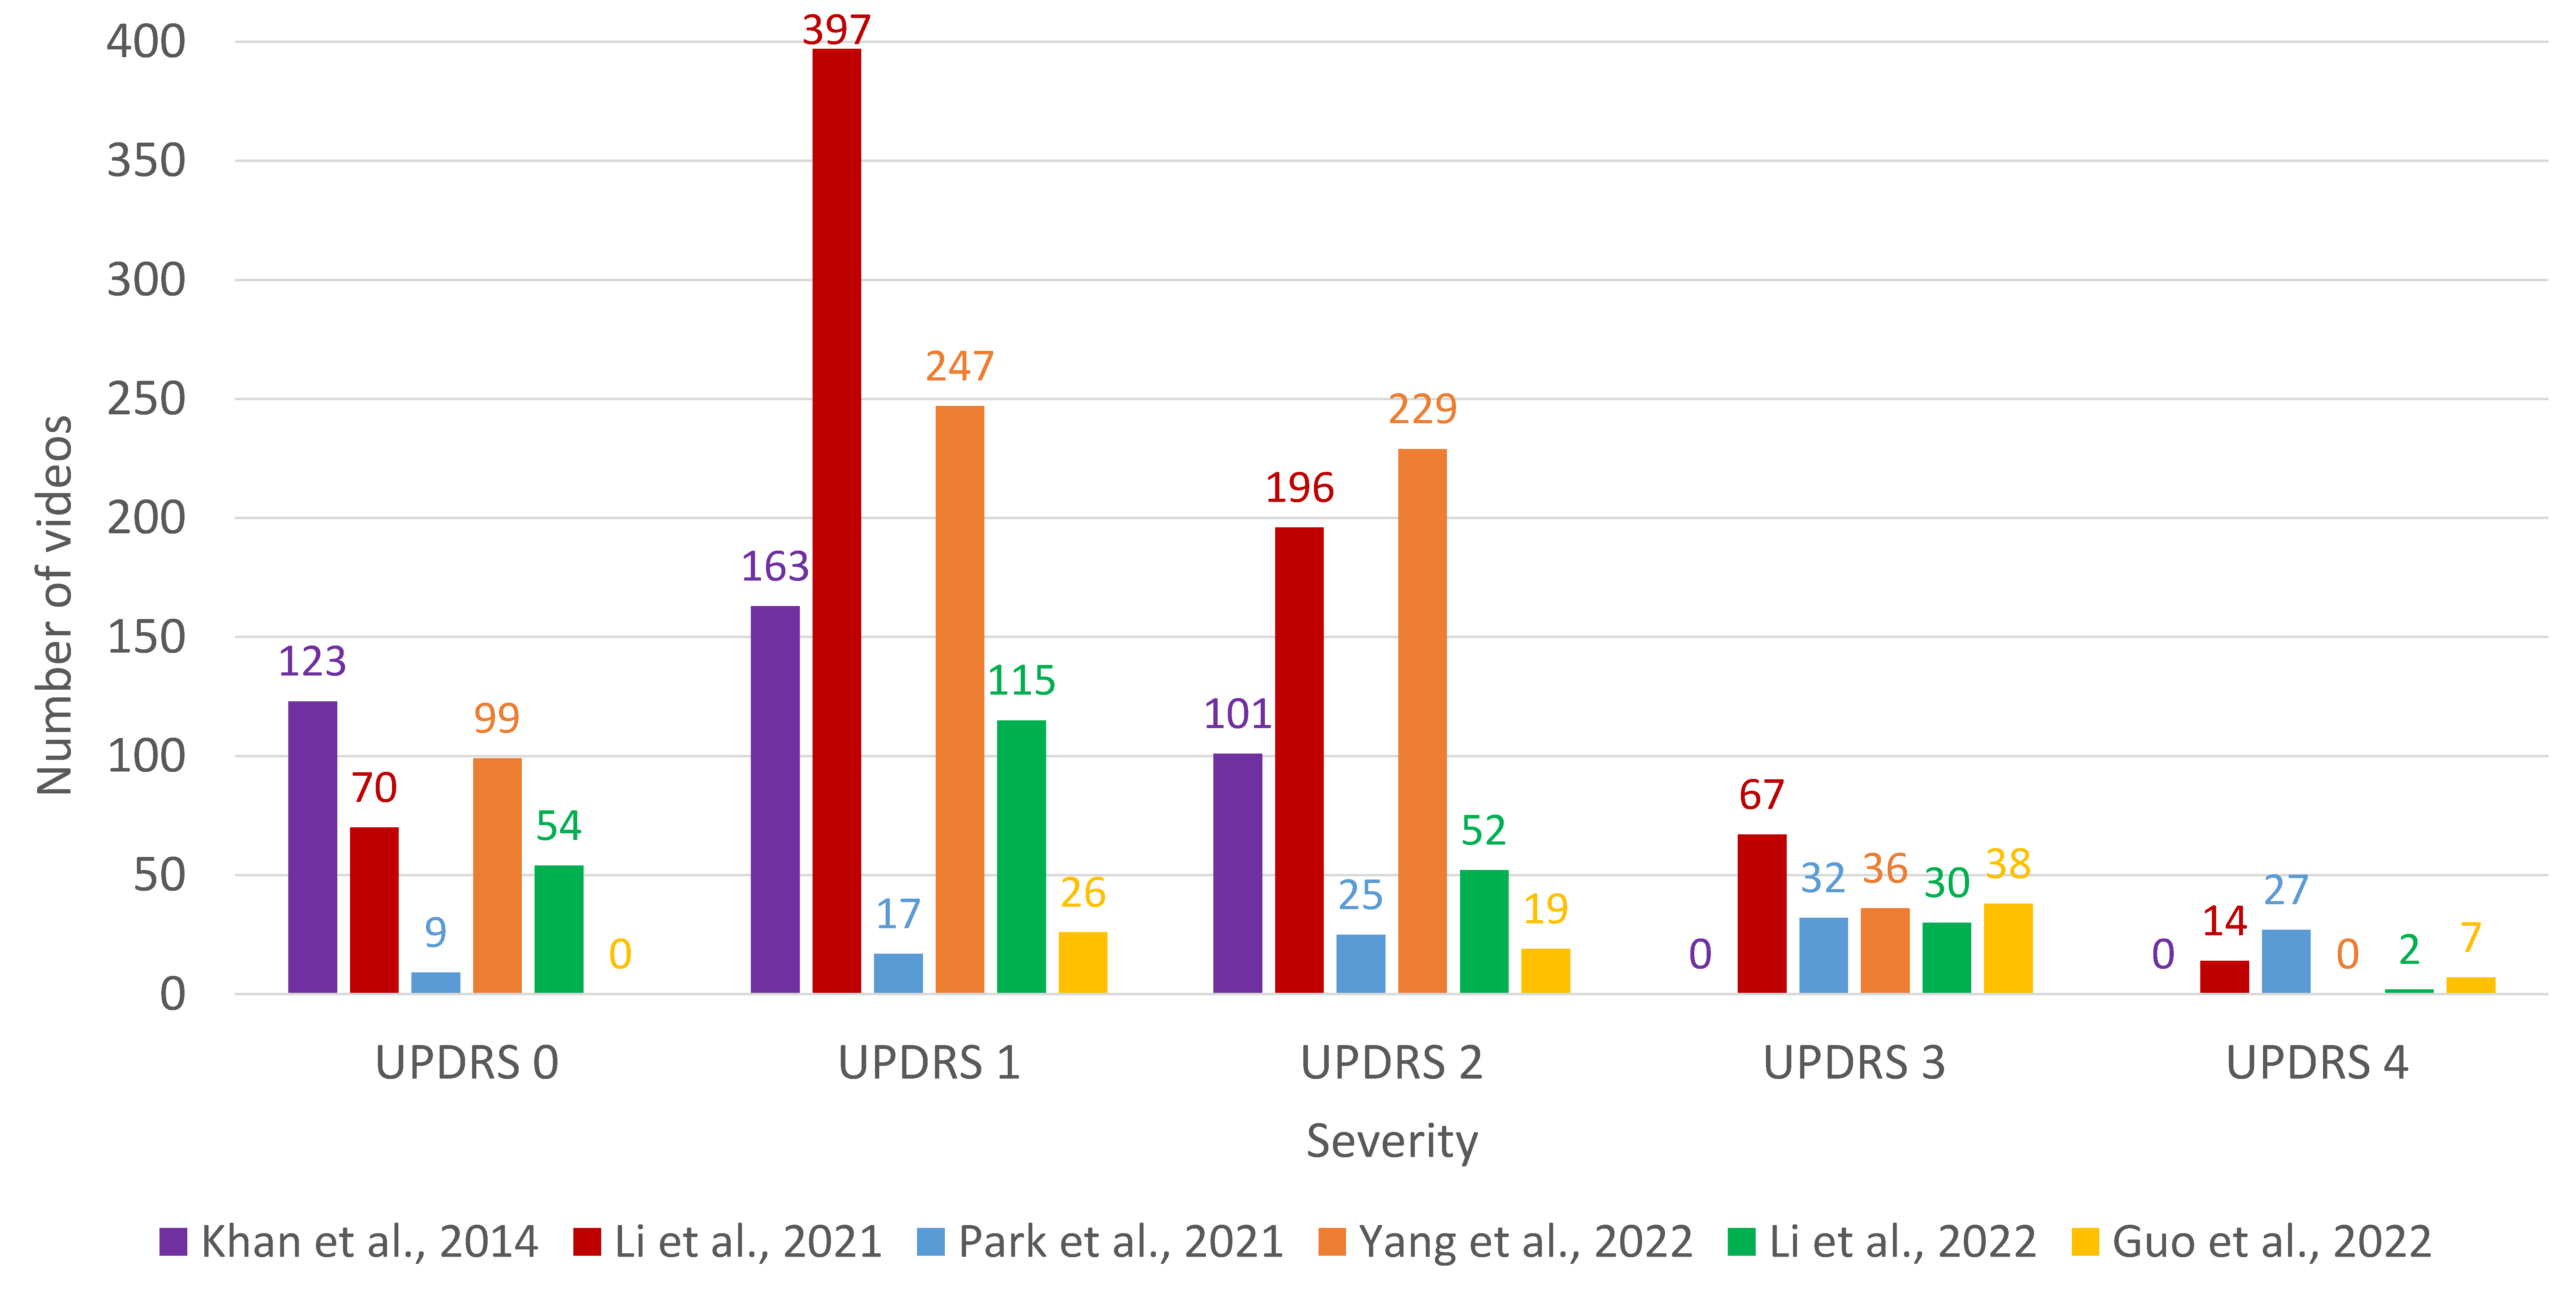
3.3. Datasets
3.4. Measures
- Accuracy: by far the most common measure [37,39,40,41,42,45,46,47], the foundation and common understanding of its meaning is what makes accuracy so popular (e.g., the number of successful outcomes divided by the total number of examples). Even a non-familiar reader could determine the achievement level by interpreting the accuracy percentage. However, this measure also has some drawbacks; a common complaint about accuracy is that it fails when the classes are imbalanced.
- Area Under ROC Curve (AUC): also considered a popular measure for classification problems [39,41,42]. It is commonly used in ML and data analytics to assess the performance of models at predicting binary outcomes and, in contrast to standard accuracy, it is particularly useful when processing imbalanced datasets, where accurate prediction of minority classes is of high importance.
- -score [41,44,45,47] is the harmonic mean of precision (the number of true positive divided by the predicted as positives) and recall (the number of true positives divided by the number of all samples of the class of interest). -score gives the same importance to both precision and recall, what can be considered as its main drawback [54]. Nonetheless, in real-world problems usually different costs are associated to different errors.
4. Discussion
5. Conclusions
6. Future Work
Author Contributions
Funding
Data Availability Statement
Conflicts of Interest
References
- Feigin, V.L.; Abajobir, A.A.; Abate, K.H.; Abd-Allah, F.; Abdulle, A.M.; Abera, S.F.; Abyu, G.Y.; Ahmed, M.B.; Aichour, A.N.; Aichour, I.; et al. Global, regional, and national burden of neurological disorders during 1990–2015: A systematic analysis for the Global Burden of Disease Study 2015. Lancet Neurol. 2017, 16, 877–897. [Google Scholar] [CrossRef]
- Stokes, M. Physical Management in Neurological Rehabilitation; Elsevier Health Sciences: Amsterdam, The Netherlands, 2004. [Google Scholar]
- Zgaljardic, D.; Foldi, N.; Borod, J. Cognitive and behavioral dysfunction in Parkinson’s disease: Neurochemical and clinicopathological contributions. J. Neural Transm. 2004, 111, 1287–1301. [Google Scholar] [CrossRef]
- Kordower, J.H.; Olanow, C.W.; Dodiya, H.B.; Chu, Y.; Beach, T.G.; Adler, C.H.; Halliday, G.M.; Bartus, R.T. Disease duration and the integrity of the nigrostriatal system in Parkinson’s disease. Brain 2013, 136, 2419–2431. [Google Scholar] [CrossRef]
- Bloem, B.R.; Valkenburg, V.V.; Slabbekoorn, M.; van Dijk, J.G. The multiple tasks test. Strategies in Parkinson’s disease. Exp. Brain Res. 2001, 137, 478–486. [Google Scholar] [CrossRef] [PubMed]
- Poewe, W.; Seppi, K.; Tanner, C.M.; Halliday, G.M.; Brundin, P.; Volkmann, J.; Schrag, A.E.; Lang, A.E. Parkinson disease. Nat. Rev. Dis. Prim. 2017, 3, 1–21. [Google Scholar] [CrossRef] [PubMed]
- Poewe, W. Non-motor symptoms in Parkinson’s disease. Eur. J. Neurol. 2008, 15, 14–20. [Google Scholar] [CrossRef] [PubMed]
- Zhao, Y.J.; Wee, H.L.; Chan, Y.H.; Seah, S.H.; Au, W.L.; Lau, P.N.; Pica, E.C.; Li, S.C.; Luo, N.; Tan, L.C. Progression of Parkinson’s disease as evaluated by Hoehn and Yahr stage transition times. Mov. Disord. 2010, 25, 710–716. [Google Scholar] [CrossRef] [PubMed]
- Peñas, E.; Gálvez, S.; Marín, M.; Pérez-Olivares, M. El Libro Blanco del Parkinson en España. Aproximación, anáLisis y Propuesta de Futuro; Real Patronato sobre Discapacidad (Ministerio de Sanidad, Servicios Sociales e Igualdad) y Federación Española de Parkinson: Madrid, Spain, 2015. [Google Scholar]
- Tolosa, E.; Garrido, A.; Scholz, S.W.; Poewe, W. Challenges in the diagnosis of Parkinson’s disease. Lancet Neurol. 2021, 20, 385–397. [Google Scholar] [CrossRef] [PubMed]
- Postuma, R.B.; Berg, D.; Stern, M.; Poewe, W.; Olanow, C.W.; Oertel, W.; Obeso, J.; Marek, K.; Litvan, I.; Lang, A.E.; et al. MDS clinical diagnostic criteria for Parkinson’s disease. Mov. Disord. 2015, 30, 1591–1601. [Google Scholar] [CrossRef]
- Goetz, C.G.; Stebbins, G.T.; Wang, L.; LaPelle, N.R.; Luo, S.; Tilley, B.C. IPMDS-sponsored scale translation program: Process, format, and clinimetric testing plan for the MDS-UPDRS and UDysRS. Mov. Disord. Clin. Pract. 2014, 1, 97–101. [Google Scholar] [CrossRef] [PubMed]
- Van Hilten, J.; Van Der Zwan, A.; Zwinderman, A.; Roos, R. Rating impairment and disability in Parkinson’s disease: Evaluation of the Unified Parkinson’s Disease Rating Scale. Mov. Disord. 1994, 9, 84–88. [Google Scholar] [CrossRef]
- Thijssen, E.; Makai-Bölöni, S.; van Brummelen, E.; den Heijer, J.; Yavuz, Y.; Doll, R.J.; Groeneveld, G.J. A Placebo-Controlled Study to Assess the Sensitivity of Finger Tapping to Medication Effects in Parkinson’s Disease. Mov. Disord. Clin. Pract. 2022, 9, 1074–1084. [Google Scholar] [CrossRef]
- Cubo, E.; Garcia-Bustillo, A.; Calvo, S.; Gámez-Leyva, G.; Simón-Vicente, L.; Rivadeneyra, J.; Miranda, J.; Madrigal, E.; Martínez-Martín, P.; Mir, P.; et al. How can I assess my patients with Parkinson’s disease during a busy clinic day? Park. Relat. Disord. 2023, 114, 105773. [Google Scholar] [CrossRef] [PubMed]
- Herz, D.M.; Brown, P. Moving, fast and slow: Behavioural insights into bradykinesia in Parkinson’s disease. Brain 2023, 146, 3576–3586. [Google Scholar] [CrossRef]
- Güney, G.; Jansen, T.S.; Dill, S.; Schulz, J.B.; Dafotakis, M.; Hoog Antink, C.; Braczynski, A.K. Video-Based Hand Movement Analysis of Parkinson Patients before and after Medication Using High-Frame-Rate Videos and MediaPipe. Sensors 2022, 22, 7992. [Google Scholar] [CrossRef]
- Pereira, C.R.; Pereira, D.R.; Silva, F.A.; Masieiro, J.P.; Weber, S.A.; Hook, C.; Papa, J.P. A new computer vision-based approach to aid the diagnosis of Parkinson’s disease. Comput. Methods Programs Biomed. 2016, 136, 79–88. [Google Scholar] [CrossRef]
- Jeon, H.; Lee, W.; Park, H.; Lee, H.J.; Kim, S.K.; Kim, H.B.; Jeon, B.; Park, K.S. High-accuracy automatic classification of Parkinsonian tremor severity using machine learning method. Physiol. Meas. 2017, 38, 1980. [Google Scholar] [CrossRef] [PubMed]
- Moshkova, A.; Samorodov, A.; Voinova, N.; Volkov, A.; Ivanova, E.; Fedotova, E. Parkinson’s Disease Detection by Using Machine Learning Algorithms and Hand Movement Signal from LeapMotion Sensor. In Proceedings of the 2020 26th Conference of Open Innovations Association (FRUCT), Yaroslavl, Russia, 20–24 April 2020; pp. 321–327. [Google Scholar] [CrossRef]
- Zhang, H.; Ho, E.S.L.; Zhang, X.; Shum, H.P.H. Pose-Based Tremor Classification for Parkinson’s Disease Diagnosis from Video. In Medical Image Computing and Computer Assisted Intervention—MICCAI 2022; Wang, L., Dou, Q., Fletcher, P.T., Speidel, S., Li, S., Eds.; Springer Nature: Cham, Switzerland, 2022; pp. 489–499. [Google Scholar] [CrossRef]
- Lu, M.; Poston, K.; Pfefferbaum, A.; Sullivan, E.V.; Fei-Fei, L.; Pohl, K.M.; Niebles, J.C.; Adeli, E. Vision-Based Estimation of MDS-UPDRS Gait Scores for Assessing Parkinson’s Disease Motor Severity. In Medical Image Computing and Computer Assisted Intervention—MICCAI 2020; Martel, A.L., Abolmaesumi, P., Stoyanov, D., Mateus, D., Zuluaga, M.A., Zhou, S.K., Racoceanu, D., Joskowicz, L., Eds.; Springer Nature: Cham, Switzerland, 2020; pp. 637–647. [Google Scholar]
- Lu, M.; Zhao, Q.; Poston, K.L.; Sullivan, E.V.; Pfefferbaum, A.; Shahid, M.; Katz, M.; Kouhsari, L.M.; Schulman, K.; Milstein, A.; et al. Quantifying Parkinson’s disease motor severity under uncertainty using MDS-UPDRS videos. Med. Image Anal. 2021, 73, 102179. [Google Scholar] [CrossRef]
- Cao, Z.; Simon, T.; Wei, S.E.; Sheikh, Y. Realtime multi-person 2D pose estimation using part affinity fields. arXiv 2018, arXiv:1812.08008. [Google Scholar]
- Kocabas, M.; Athanasiou, N.; Black, M.J. Vibe: Video inference for human body pose and shape estimation. arXiv 2019, arXiv:1912.05656. [Google Scholar]
- Lugaresi, C.; Tang, J.; Nash, H.; McClanahan, C.; Uboweja, E.; Hays, M.; Zhang, F.; Chang, C.L.; Yong, M.G.; Lee, J.; et al. MediaPipe: A Framework for Building Perception Pipelines. arXiv 2019, arXiv:1906.08172. [Google Scholar]
- Williams, S.; Zhao, Z.; Hafeez, A.; Wong, D.C.; Relton, S.D.; Fang, H.; Alty, J.E. The discerning eye of computer vision: Can it measure Parkinson’s finger tap bradykinesia? J. Neurol. Sci. 2020, 416, 117003. [Google Scholar] [CrossRef]
- Mathis, A.; Mamidanna, P.; Cury, K.M.; Abe, T.; Murthy, V.N.; Mathis, M.W.; Bethge, M. DeepLabCut: Markerless pose estimation of user-defined body parts with deep learning. Nat. Neurosci. 2018, 21, 1281–1289. [Google Scholar] [CrossRef]
- Jaber, R.; Qahwaji, R.; Abdullatif, A.; Buckley, J.; Abd-Alhameed, R. Proposing a Three-Stage Model to Quantify Bradykinesia on a Symptom Severity Level Using Deep Learning. In Proceedings of the Advances in Computational Intelligence Systems: Contributions Presented at the 20th UK Workshop on Computational Intelligence, Aberystwyth, UK, 8–10 September 2021; pp. 428–438. [Google Scholar] [CrossRef]
- Redmon, J.; Divvala, S.; Girshick, R.; Farhadi, A. You Only Look Once: Unified, Real-Time Object Detection. arXiv 2016, arXiv:1506.02640. [Google Scholar]
- Prince, J.; de Vos, M. A Deep Learning Framework for the Remote Detection of Parkinson’S Disease Using Smart-Phone Sensor Data. In Proceedings of the 2018 40th Annual International Conference of the IEEE Engineering in Medicine and Biology Society (EMBC), Honolulu, HI, USA, 18–21 July 2018; pp. 3144–3147. [Google Scholar] [CrossRef]
- Zhan, A.; Mohan, S.; Tarolli, C.; Schneider, R.B.; Adams, J.L.; Sharma, S.; Elson, M.J.; Spear, K.L.; Glidden, A.M.; Little, M.A.; et al. Using Smartphones and Machine Learning to Quantify Parkinson Disease Severity: The Mobile Parkinson Disease Score. JAMA Neurol. 2018, 75, 876–880. [Google Scholar] [CrossRef]
- Parab, S.; Boster, J.; Washington, P. Parkinson Disease Recognition Using a Gamified Website: Machine Learning Development and Usability Study. JMIR Form Res. 2023, 7, e49898. [Google Scholar] [CrossRef]
- Tien, R.N.; Tekriwal, A.; Calame, D.J.; Platt, J.P.; Baker, S.; Seeberger, L.C.; Kern, D.S.; Person, A.L.; Ojemann, S.G.; Thompson, J.A.; et al. Deep learning based markerless motion tracking as a clinical tool for movement disorders: Utility, feasibility and early experience. Front. Signal Process. 2022, 2, 884384. [Google Scholar] [CrossRef]
- Sibley, K.G.; Girges, C.; Hoque, E.; Foltynie, T. Video-based analyses of Parkinson’s disease severity: A brief review. J. Park. Dis. 2021, 11, S83–S93. [Google Scholar] [CrossRef] [PubMed]
- Dyagilev, K.; Saria, S. Learning (predictive) risk scores in the presence of censoring due to interventions. Mach. Learn. 2016, 102, 323–348. [Google Scholar] [CrossRef]
- Khan, T.; Nyholm, D.; Westin, J.; Dougherty, M. A computer vision framework for finger-tapping evaluation in Parkinson’s disease. Artif. Intell. Med. 2014, 60, 27–40. [Google Scholar] [CrossRef]
- Contributors, M. OpenMMLab Pose Estimation Toolbox and Benchmark. 2020. Available online: https://github.com/open-mmlab/mmpose (accessed on 29 January 2024).
- Wong, D.C.; Relton, S.D.; Fang, H.; Qhawaji, R.; Graham, C.D.; Alty, J.; Williams, S. Supervised Classification of Bradykinesia for Parkinson’s Disease Diagnosis from Smartphone Videos. In Proceedings of the 2019 IEEE 32nd International Symposium on Computer-Based Medical Systems (CBMS), Cordoba, Spain, 5–7 June 2019; pp. 32–37. [Google Scholar] [CrossRef]
- Buongiorno, D.; Bortone, I.; Cascarano, G.D.; Trotta, G.F.; Brunetti, A.; Bevilacqua, V. A low-cost vision system based on the analysis of motor features for recognition and severity rating of Parkinson’s Disease. BMC Med. Inform. Decis. Mak. 2019, 19, 243. [Google Scholar] [CrossRef] [PubMed]
- Li, H.; Shao, X.; Zhang, C.; Qian, X. Automated assessment of Parkinsonian finger-tapping tests through a vision-based fine-grained classification model. Neurocomputing 2021, 441, 260–271. [Google Scholar] [CrossRef]
- Monje, M.H.G.; Domínguez, S.; Vera-Olmos, J.; Antonini, A.; Mestre, T.A.; Malpica, N.; Sánchez-Ferro, A. Remote Evaluation of Parkinson’s Disease Using a Conventional Webcam and Artificial Intelligence. Front. Neurol. 2021, 12, 742654. [Google Scholar] [CrossRef]
- Park, K.W.; Lee, E.J.; Lee, J.S.; Jeong, J.; Choi, N.; Jo, S.; Jung, M.; Do, J.Y.; Kang, D.W.; Lee, J.G.; et al. Machine Learning–Based Automatic Rating for Cardinal Symptoms of Parkinson Disease. Neurology 2021, 96, e1761–e1769. [Google Scholar] [CrossRef] [PubMed]
- Yang, N.; Liu, D.F.; Liu, T.; Han, T.; Zhang, P.; Xu, X.; Lou, S.; Liu, H.G.; Yang, A.C.; Dong, C.; et al. Automatic Detection Pipeline for Accessing the Motor Severity of Parkinson’s Disease in Finger Tapping and Postural Stability. IEEE Access 2022, 10, 66961–66973. [Google Scholar] [CrossRef]
- Li, Z.; Lu, K.; Cai, M.; Liu, X.; Wang, Y.; Yang, J. An Automatic Evaluation Method for Parkinson’s Dyskinesia Using Finger Tapping Video for Small Samples. J. Med. Biol. Eng. 2022, 42, 351–363. [Google Scholar] [CrossRef]
- Guo, Z.; Zeng, W.; Yu, T.; Xu, Y.; Xiao, Y.; Cao, X.; Cao, Z. Vision-Based Finger Tapping Test in Patients with Parkinson’s Disease via Spatial-Temporal 3D Hand Pose Estimation. IEEE J. Biomed. Health Inform. 2022, 26, 3848–3859. [Google Scholar] [CrossRef]
- Amprimo, G.; Rechichi, I.; Ferraris, C.; Olmo, G. Objective Assessment of the Finger Tapping Task in Parkinson’s Disease and Control Subjects using Azure Kinect and Machine Learning. In Proceedings of the 2023 IEEE 36th International Symposium on Computer-Based Medical Systems (CBMS), L’Aquila, Italy, 22–24 June 2023; pp. 640–645. [Google Scholar] [CrossRef]
- Dara, S.; Tumma, P. Feature Extraction By Using Deep Learning: A Survey. In Proceedings of the 2018 Second International Conference on Electronics, Communication and Aerospace Technology (ICECA), Coimbatore, India, 29–31 March 2018; pp. 1795–1801. [Google Scholar] [CrossRef]
- Cortes, C.; Vapnik, V. Support-vector networks. Mach. Learn. 1995, 20, 273–297. [Google Scholar] [CrossRef]
- Kuncheva, L.I. Combining Pattern Classifiers: Methods and Algorithms; John Wiley & Sons: Hoboken, NJ, USA, 2014. [Google Scholar]
- Breiman, L. Random forests. Mach. Learn. 2001, 45, 5–32. [Google Scholar] [CrossRef]
- Chen, T.; Guestrin, C. XGBoost: A Scalable Tree Boosting System. In Proceedings of the 22nd ACM SIGKDD International Conference on Knowledge Discovery and Data Mining, San Francisco, CA, USA, 13–17 August 2016; KDD ’16. pp. 785–794. [Google Scholar] [CrossRef]
- Galar, M.; Fernández, A.; Barrenechea, E.; Herrera, F. EUSBoost: Enhancing ensembles for highly imbalanced data-sets by evolutionary undersampling. Pattern Recognit. 2013, 46, 3460–3471. [Google Scholar] [CrossRef]
- Hand, D.; Christen, P. A note on using the F-measure for evaluating record linkage algorithms. Stat. Comput. 2018, 28, 539–547. [Google Scholar] [CrossRef]
- Williams, S.; Wong, D.; Alty, J.E.; Relton, S.D. Parkinsonian hand or clinician’s eye? Finger tap Bradykinesia interrater reliability for 21 movement disorder experts. J. Park. Dis. 2023, 13, 525–536. [Google Scholar] [CrossRef] [PubMed]
- Chahine, L.M.; Merchant, K.; Siderowf, A.; Sherer, T.; Tanner, C.; Marek, K.; Simuni, T. Proposal for a Biologic Staging System of Parkinson’s Disease. J. Park. Dis. 2023, 297–309. [Google Scholar] [CrossRef] [PubMed]
- Simonet, C.; Schrag, A.; Lees, A.; Noyce, A. The motor prodromes of parkinson’s disease: From bedside observation to large-scale application. J. Neurol. 2021, 268, 2099–2108. [Google Scholar] [CrossRef]
- Belić, M.; Bobić, V.; Badža, M.; Šolaja, N.; Đurić Jovičić, M.; Kostić, V.S. Artificial intelligence for assisting diagnostics and assessment of Parkinson’s disease—A review. Clin. Neurol. Neurosurg. 2019, 184, 105442. [Google Scholar] [CrossRef]
- Loyola-González, O. Black-Box vs. White-Box: Understanding Their Advantages and Weaknesses From a Practical Point of View. IEEE Access 2019, 7, 154096–154113. [Google Scholar] [CrossRef]
- Gaudette, L.; Japkowicz, N. Evaluation Methods for Ordinal Classification. In Advances in Artificial Intelligence; Gao, Y., Japkowicz, N., Eds.; Springer: Berlin/Heidelberg, Germany, 2009; pp. 207–210. [Google Scholar]
- Frank, E.; Hall, M. A Simple Approach to Ordinal Classification. In Machine Learning: ECML 2001; De Raedt, L., Flach, P., Eds.; Springer: Berlin/Heidelberg, Germany, 2001; pp. 145–156. [Google Scholar]

| Ref. | Year | Brief Description | Classifiers |
|---|---|---|---|
| [18] | 2016 | Handwritten traces | Naïve Bayes Optimum-Path Forest SVM-R |
| [19] | 2017 | Tremor severity analysis using a wristwatch-type wearable device | Decision tree SVM-L SVM-P SVM-R k-nearest neighbors Discriminant Analysis |
| [31] | 2018 | On-screen tapping on a mobile phone (iPhone app) | Logistic regression Random forest Deep Neural Network Convolutional Neural Network |
| [32] | 2018 | PD-related activities (voice, finger tapping, gait, balance, and reaction time) assessment (Android app) | Machine-Learning algorithm [36] |
| [20] | 2019 | Hand movements data capturing using LeapMotion sensor | Decision tree SVM k-nearest neighbors Random forest |
| [22] | 2020 | Gait analysis using videos | Ordinal Focal Double-Features Double-Motion Network |
| [23] | 2021 | Gait and FT analysis using videos | Ordinal Focal Double-Features Double-Motion Network |
| [21] | 2022 | Tremor severity analysis using videos | Graph Neural Network Decision tree Convolutional Neural Network SVM |
| [33] | 2023 | Gamified website tracking keyboard and mouse inputs | Random forest Decision tree SVM Multilayer perceptron |
| Ref. | Year | Capture | Finger Identification | Classifiers | ML Problem | Dataset | Performance Measures |
|---|---|---|---|---|---|---|---|
| [37] | 2014 | 2D | OpenCV | SVM-PUK | Binary Multiclass (3) | 13 PD 6 HC | Accuracy |
| [39] | 2019 | 2D | Convolutional Neural Network | Naïve Bayes Logistic regression SVM-L SVM-R | Binary | 20 PD 15 HC | Accuracy Sensitivity Specificity AUC |
| [40] | 2019 | 3D | Custom-made trackers | Artificial neural network SVM | Binary | 16 PD 14 HC | Accuracy Sensitivity Specificity |
| [41] | 2021 | 2D | OpenPose | Convolutional Neural Network | Multiclass (5) | 157 PD 0 HC | Accuracy AUC Precision Recall -score |
| [42] | 2021 | 2D | Single Shot MultiBox Detector (SSD) + OpenPose | Logistic Regression Naïve Bayes Random forest | Binary | 22 PD 20 HC | Accuracy AUC |
| [43] | 2021 | 2D | OpenPose | SVM-R | Multiclass (5) | 55 PD 0 HC | Weighted Intraclass corr. coeff. |
| [44] | 2022 | 2D | MMPose | Deep Neural Network | Multiclass (4) | 300 PD 0 HC | Precision Recall -score |
| [45] | 2022 | 2D | MediaPipe | Fully Connected Network | Multiclass (5) | 93 PD 27 HC | Accuracy Precision Recall -score |
| [46] | 2022 | 3D | Spatial-Temporal Anchor-to-Joint Regression Network (ST-A2J) | k-nearest neighbors Random forest XGBoost SVM-L SVM-R | Multiclass (5) | 48 PD 11 HC | Accuracy |
| [47] | 2023 | 3D | MediaPipe | -nearest neighbors Random Forest XGBoost SVM | Binary | 35 PD 60 HC | Accuracy Precision Recall -score |
Disclaimer/Publisher’s Note: The statements, opinions and data contained in all publications are solely those of the individual author(s) and contributor(s) and not of MDPI and/or the editor(s). MDPI and/or the editor(s) disclaim responsibility for any injury to people or property resulting from any ideas, methods, instructions or products referred to in the content. |
© 2024 by the authors. Licensee MDPI, Basel, Switzerland. This article is an open access article distributed under the terms and conditions of the Creative Commons Attribution (CC BY) license (https://creativecommons.org/licenses/by/4.0/).
Share and Cite
Amo-Salas, J.; Olivares-Gil, A.; García-Bustillo, Á.; García-García, D.; Arnaiz-González, Á.; Cubo, E. Computer Vision for Parkinson’s Disease Evaluation: A Survey on Finger Tapping. Healthcare 2024, 12, 439. https://doi.org/10.3390/healthcare12040439
Amo-Salas J, Olivares-Gil A, García-Bustillo Á, García-García D, Arnaiz-González Á, Cubo E. Computer Vision for Parkinson’s Disease Evaluation: A Survey on Finger Tapping. Healthcare. 2024; 12(4):439. https://doi.org/10.3390/healthcare12040439
Chicago/Turabian StyleAmo-Salas, Javier, Alicia Olivares-Gil, Álvaro García-Bustillo, David García-García, Álvar Arnaiz-González, and Esther Cubo. 2024. "Computer Vision for Parkinson’s Disease Evaluation: A Survey on Finger Tapping" Healthcare 12, no. 4: 439. https://doi.org/10.3390/healthcare12040439
APA StyleAmo-Salas, J., Olivares-Gil, A., García-Bustillo, Á., García-García, D., Arnaiz-González, Á., & Cubo, E. (2024). Computer Vision for Parkinson’s Disease Evaluation: A Survey on Finger Tapping. Healthcare, 12(4), 439. https://doi.org/10.3390/healthcare12040439