
Efficiency and Resource Allocation in Government Hospitals in Saudi Arabi: A Casemix Index Approach


Abstract
:1. Introduction
2. Materials and Methods
2.1. Study Design
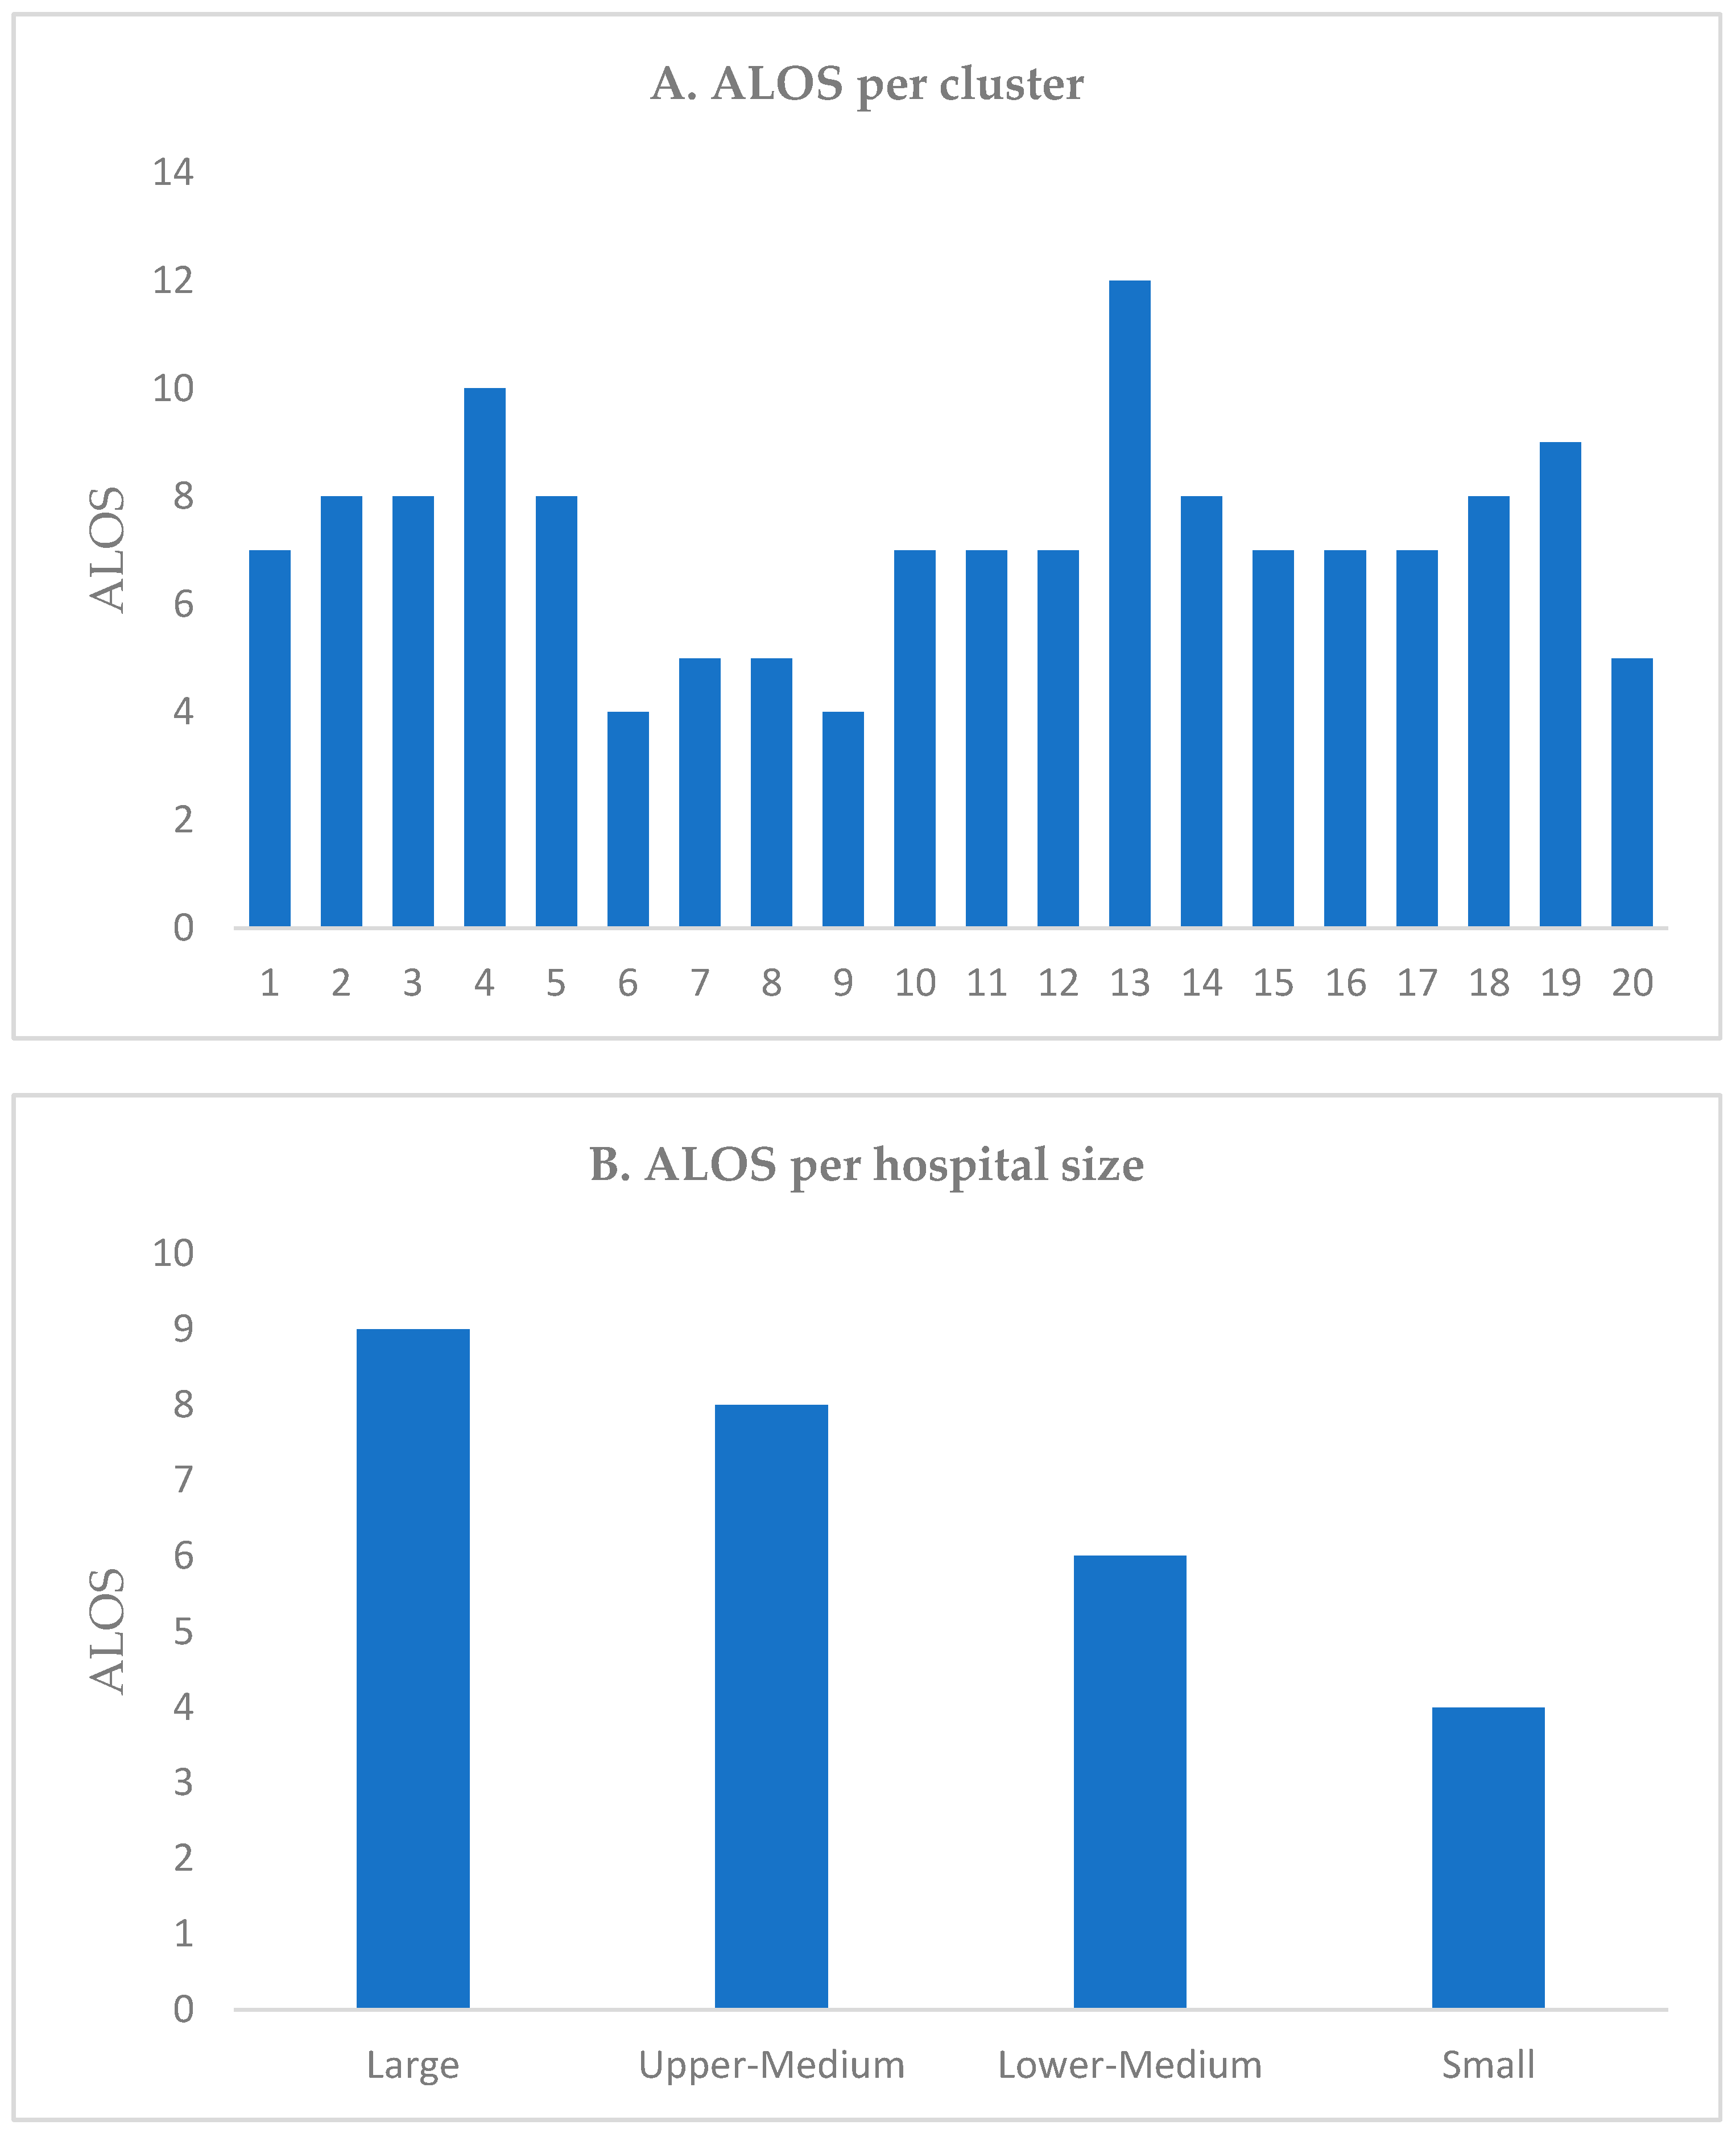
- Technical efficiency: This indicator determines whether hospitals are utilizing their capacity effectively, allowing them to treat more patients with same capacity and resources. This eventually reduces the average cost per DRG. Assessing technical efficiency involves analyzing patients’ average length of stay (ALOS).
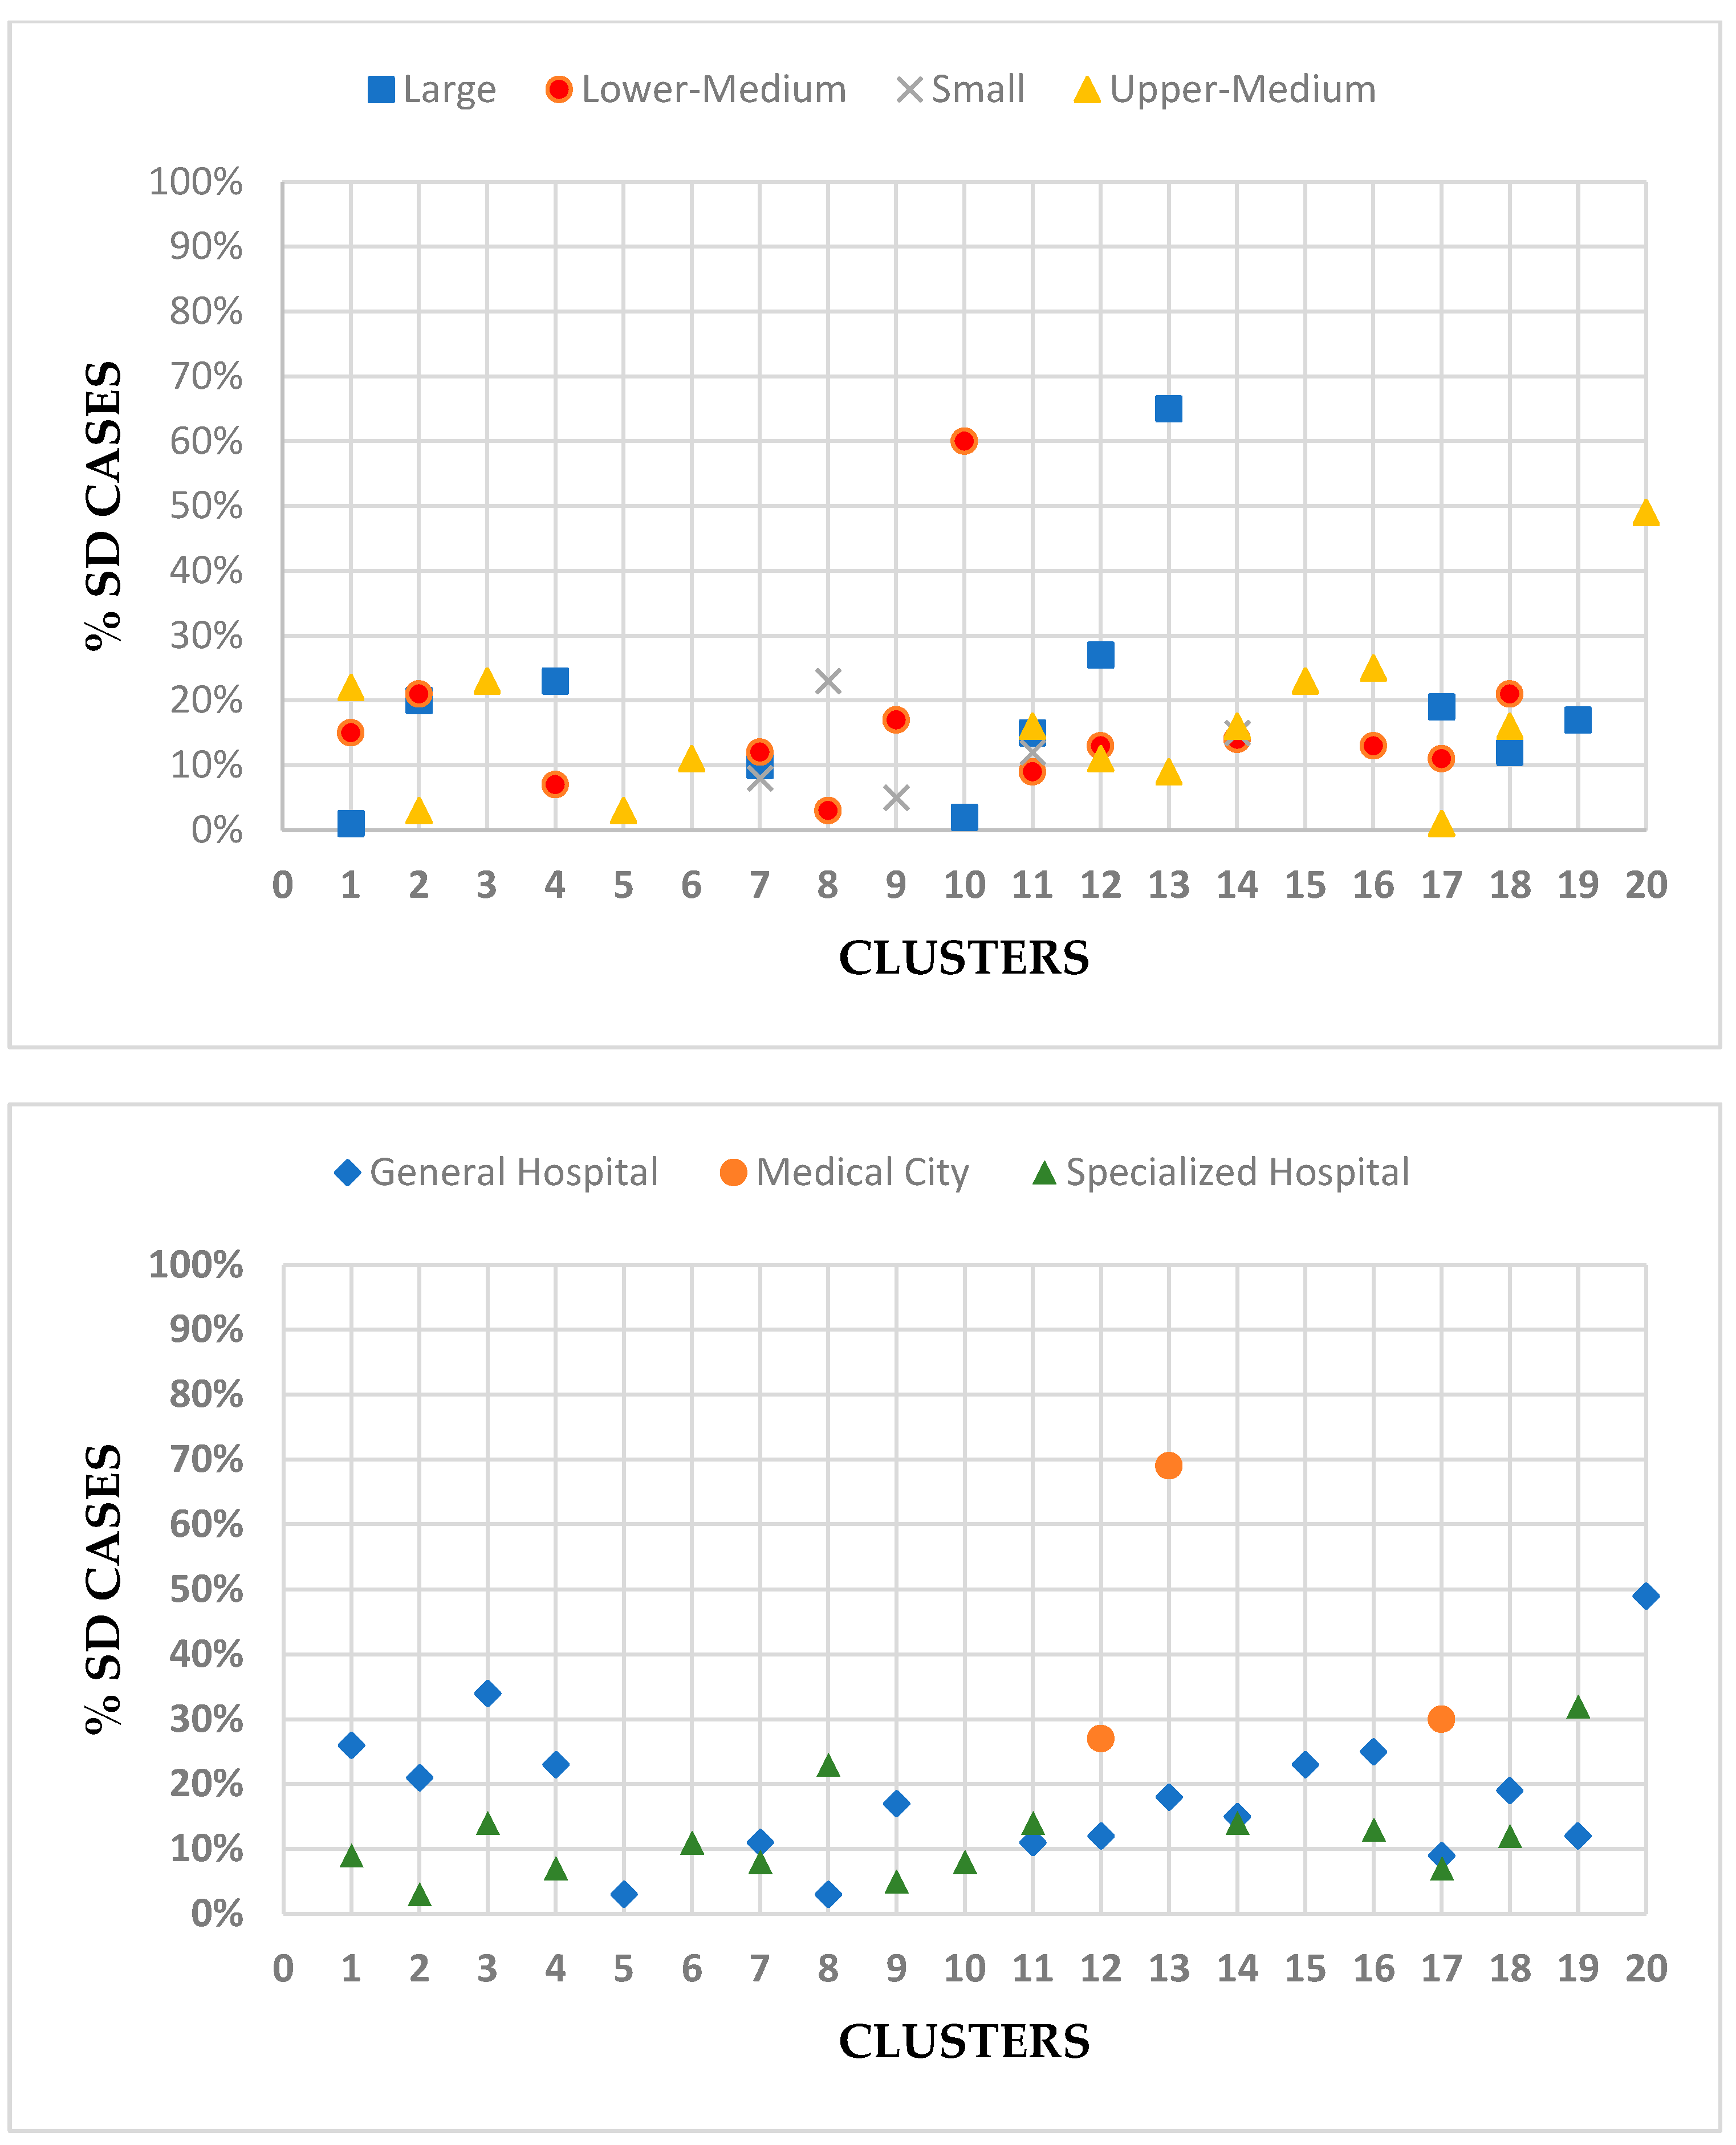
- Allocative efficiency: investigates whether the patients were treated in an appropriate clinical manner as it is perceived that healthcare provided in most cases could have been delivered in less intensive settings than the actual settings. To assess allocative efficiency, we will investigate the ratio of same-day cases or day cases and the number of days of surgery attendance (DOSA) before planned surgeries.
- Productivity of hospital: This indicator describes the volume of work undertaken by each cluster within a specific time period. Productivity of hospitals is not only measured by the number of patients or reported episodes, but also assessed by the total of weighted episodes.
- Complexity of care: This aspect describes the average degree of difficulty or relative cost of the work undertaken by each cluster.
2.2. Data Sources
2.3. Data Analysis
- Technical efficiency: was calculated by dividing the total number of hospital days for all patients for the same year by the total number of those patients excluding same-day cases and rehabilitation centers. This calculation provides an understanding of how efficiently hospitals are utilizing their capacity to treat patients.
- Allocative efficiency: was calculated by dividing the number of same-day cases (SDs) over the total number of discharges within the same year. The comparison was done across clusters based on the type and size of hospitals. The analysis also focuses on identifying potential waste in the system through the DOSA analysis and estimating the opportunity costs of having high DOSA rates in public hospitals. The required data were extracted from only one hospital that had a comprehensive patient-level data record, allowing tracking of the procedures conducted for patients. A total of 1060 patients who spent up to 10 days in the hospital before undergoing surgery without receiving any type of treatment were identified for the year 2019. We excluded those patients whose total length of stay after surgery was more than their DOSA, assuming their surgeries were not planned prior to their admission. The total DOSA for these patients was then calculated to assess the resulting cost of this inefficiency. The base cost or cost-per-bed per day was assumed based on information obtained from a clinical costing exercise conducted for that specific hospital.
- Productivity and complexity of care: was assessed using CMI, which is a statistical tool that can be used to assess the productivity and efficiency as well complexity of services. The CMI for a hospital during a specific period is calculated by dividing the sum of all DRG-relative weights by the number of patients. The CMI is then used by payers to adjust payment or reimbursement rates for hospitals. The CMI considers the total weighted episodes (WEs) instead of just the number of patients or reported episodes. Although the DRG weights available at the ABM portal are not specific to Saudi Arabia, they were used as a starting point since cost data was not available.
3. Results
3.1. Technical Efficiency
3.2. Allocative Efficiency
3.2.1. Same-Day Cases
3.2.2. Day of Surgery Attendance (DOSA) Analysis
3.3. Productivity
3.4. Case Mix Index
4. Discussion
5. Conclusions
Author Contributions
Funding
Institutional Review Board Statement
Informed Consent Statement
Data Availability Statement
Acknowledgments
Conflicts of Interest
Appendix A

| Hospital Name | Cluster | Day Cases | Total Encounters | % Day-Case | ALOS | Weighted Episodes | CMI |
|---|---|---|---|---|---|---|---|
| 1 | 1 | 50 | 7434 | 1% | 7 | 15,257 | 2.05 |
| 2 | 1 | 2161 | 16,535 | 13% | 5 | 20,348 | 1.23 |
| 3 | 1 | 843 | 5495 | 15% | 7 | 6550 | 1.19 |
| 4 | 1 | 9187 | 24,026 | 38% | 11 | 27,803 | 1.16 |
| 5 | 1 | 2885 | 24,384 | 12% | 4 | 27,777 | 1.14 |
| 6 | 2 | 2137 | 10,544 | 20% | 9 | 14,902 | 1.41 |
| 7 | 2 | 757 | 22,664 | 3% | 8 | 29,197 | 1.29 |
| 8 | 2 | 2006 | 9563 | 21% | 7 | 10,954 | 1.15 |
| 9 | 3 | 1306 | 9521 | 14% | 8 | 11,035 | 1.16 |
| 10 | 3 | 2767 | 8175 | 34% | 7 | 8702 | 1.06 |
| 11 | 4 | 2294 | 10,189 | 23% | 15 | 12,760 | 1.25 |
| 12 | 4 | 454 | 6546 | 7% | 5 | 7879 | 1.2 |
| 13 | 5 | 227 | 7321 | 3% | 8 | 10,752 | 1.47 |
| 14 | 6 | 1767 | 15,694 | 11% | 4 | 16,064 | 1.02 |
| 15 | 7 | 1612 | 13,329 | 12% | 4 | 17,811 | 1.34 |
| 16 | 7 | 687 | 7075 | 10% | 7 | 9347 | 1.32 |
| 17 | 7 | 21 | 259 | 8% | 4 | 188 | 0.73 |
| 18 | 8 | 2064 | 8916 | 23% | 6 | 9890 | 1.11 |
| 19 | 8 | 142 | 13,635 | 1% | 3 | 13,872 | 1.02 |
| 20 | 9 | 415 | 7966 | 5% | 4 | 7899 | 0.99 |
| 21 | 9 | 2438 | 11,083 | 22% | 6 | 13,130 | 1.18 |
| 22 | 9 | 622 | 7334 | 8% | 5 | 8140 | 1.11 |
| 23 | 9 | 12 | 261 | 5% | 4 | 197 | 0.76 |
| 24 | 10 | 469 | 27,262 | 2% | 11 | 49,984 | 1.83 |
| 25 | 10 | 1983 | 3313 | 60% | 4 | 3158 | 0.95 |
| 26 | 11 | 2 | 73 | 3% | 12 | 127 | 1.73 |
| 27 | 11 | 703 | 3562 | 20% | 7 | 5164 | 1.45 |
| 28 | 11 | 22 | 121 | 18% | 2 | 165 | 1.37 |
| 29 | 11 | 382 | 3081 | 12% | 4 | 4180 | 1.36 |
| 30 | 11 | 1840 | 12,417 | 15% | 4 | 14,583 | 1.17 |
| 31 | 11 | 1801 | 17,920 | 10% | 25 | 20,530 | 1.15 |
| 32 | 11 | 1212 | 15,776 | 8% | 4 | 15,913 | 1.01 |
| 33 | 11 | 103 | 1096 | 9% | 3 | 983 | 0.9 |
| 34 | 11 | 1115 | 8845 | 13% | 3 | 7573 | 0.86 |
| 35 | 11 | 15 | 86 | 17% | 4 | 68 | 0.79 |
| 36 | 11 | 4 | 115 | 3% | 2 | 84 | 0.73 |
| 37 | 11 | 191 | 1397 | 14% | 2 | 890 | 0.64 |
| 38 | 12 | - | 6 | 0% | 1576 | 15 | 2.55 |
| 39 | 12 | 9226 | 33,993 | 27% | 7 | 56,029 | 1.65 |
| 40 | 12 | 517 | 4988 | 10% | 10 | 7061 | 1.42 |
| 41 | 12 | 1013 | 8209 | 12% | 11 | 10,210 | 1.24 |
| 42 | 12 | 1116 | 7282 | 15% | 8 | 8654 | 1.19 |
| 43 | 12 | 745 | 6780 | 11% | 5 | 7566 | 1.12 |
| 44 | 13 | 3170 | 11,152 | 28% | 37 | 15,442 | 1.38 |
| 45 | 13 | 1164 | 12,452 | 9% | 7 | 15,185 | 1.22 |
| 46 | 13 | 63,832 | 92,691 | 69% | 12 | 85,514 | 0.92 |
| 47 | 14 | 16 | 98 | 16% | 12 | 137 | 1.4 |
| 48 | 14 | 1912 | 14,579 | 13% | 8 | 20,155 | 1.38 |
| 49 | 14 | 1405 | 9602 | 15% | 4 | 11,295 | 1.18 |
| 50 | 14 | 1440 | 9731 | 15% | 4 | 10,524 | 1.08 |
| 51 | 15 | 2791 | 12,249 | 23% | 7 | 20,485 | 1.67 |
| 52 | 16 | 436 | 10,732 | 4% | 11 | 13,397 | 1.25 |
| 53 | 16 | 2201 | 17,314 | 13% | 5 | 20,097 | 1.16 |
| 54 | 16 | 6147 | 15,560 | 40% | 7 | 15,963 | 1.03 |
| 55 | 17 | 7399 | 24,913 | 30% | 12 | 45,625 | 1.83 |
| 56 | 17 | - | 20 | 0% | 332 | 34 | 1.7 |
| 57 | 17 | 13 | 1166 | 1% | 4 | 1860 | 1.6 |
| 58 | 17 | 855 | 4932 | 17% | 9 | 6787 | 1.38 |
| 59 | 17 | 790 | 7300 | 11% | 9 | 9423 | 1.29 |
| 60 | 17 | 846 | 18,959 | 4% | 3 | 23,477 | 1.24 |
| 61 | 18 | 1462 | 8889 | 16% | 15 | 16,940 | 1.91 |
| 62 | 18 | 797 | 6715 | 12% | 5 | 9381 | 1.4 |
| 63 | 18 | 2304 | 10,913 | 21% | 5 | 12,345 | 1.13 |
| 64 | 19 | 4198 | 13,251 | 32% | 17 | 16,316 | 1.23 |
| 65 | 19 | 4540 | 39,127 | 12% | 7 | 47,550 | 1.22 |
| 66 | 20 | 1444 | 15,342 | 9% | 6 | 18,123 | 1.18 |
| 67 | 20 | 20,939 | 30,006 | 70% | 4 | 28,706 | 0.96 |
Appendix B
| MDC Description | 1 | 2 | 3 | 4 | 4 | 5 | 7 | 8 | 9 | 10 | 11 | 12 | 13 | 14 | 15 | 16 | 17 | 18 | 19 | 20 | Total |
|---|---|---|---|---|---|---|---|---|---|---|---|---|---|---|---|---|---|---|---|---|---|
| Pregnancy, Childbirth & Puerperium | 14,525 | 14,183 | 3924 | 2550 | 5565 | 2132 | 6781 | 10,778 | 2757 | 2013 | 18,693 | 10,658 | 14,286 | 16,954 | 3927 | 14,967 | 11,702 | 7514 | 14,247 | 8079 | 186,231 |
| Newborns & Other Neonates | 17,959 | 11,929 | 3892 | 3849 | 5409 | 2234 | 4962 | 8658 | 1909 | 5272 | 13,529 | 12,107 | 12,191 | 9030 | 5571 | 6173 | 13,953 | 4869 | 13,862 | 10,025 | 167,384 |
| Musculoskeletal Sys & Conn Tissue | 8555 | 4637 | 1538 | 2543 | 43 | 1143 | 2450 | 923 | 2323 | 3950 | 4525 | 12,096 | 8615 | 2028 | 1897 | 3802 | 4214 | 4207 | 4548 | 3063 | 77,101 |
| Circulatory System | 2199 | 1811 | 591 | 1536 | 24 | 412 | 1093 | 583 | 1409 | 7950 | 3158 | 6673 | 11,566 | 441 | 338 | 3655 | 19,767 | 884 | 2666 | 2700 | 69,453 |
| Respiratory System | 7673 | 3484 | 1781 | 1365 | 2278 | 809 | 2061 | 2659 | 2375 | 4567 | 5330 | 6538 | 6981 | 2525 | 1080 | 2641 | 5063 | 3072 | 3000 | 3724 | 69,004 |
| Nervous System | 6225 | 2888 | 1025 | 1726 | 261 | 1130 | 2132 | 1168 | 2148 | 3915 | 3693 | 9416 | 10,283 | 1524 | 1826 | 2466 | 5004 | 3562 | 3736 | 3360 | 67,488 |
| Digestive System | 6841 | 2988 | 1499 | 976 | 728 | 437 | 1652 | 1703 | 1847 | 3172 | 4861 | 6084 | 7674 | 1830 | 729 | 3437 | 5321 | 2154 | 3937 | 2722 | 60,593 |
| Endocrine, Nutritional & Metabolic | 2903 | 1958 | 1115 | 1052 | 81 | 345 | 731 | 567 | 799 | 2392 | 2601 | 4401 | 3488 | 631 | 472 | 1417 | 3518 | 1340 | 2121 | 1958 | 33,888 |
| Kidney & Urinary Tract | 4971 | 1562 | 494 | 922 | 138 | 260 | 1007 | 453 | 814 | 3167 | 1708 | 2681 | 3491 | 630 | 857 | 1191 | 2922 | 1598 | 1510 | 2760 | 33,138 |
| Hepatobiliary System & Pancreas | 3921 | 1391 | 556 | 715 | 11 | 216 | 904 | 397 | 1083 | 3450 | 2328 | 3232 | 2916 | 464 | 448 | 1259 | 2867 | 1595 | 2425 | 1871 | 32,050 |
| Neoplastic Disorders | 1356 | 191 | 63 | 127 | 20 | 6 | 89 | 45 | 35 | 4031 | 736 | 925 | 20,339 | 50 | 15 | 612 | 1779 | 375 | 110 | 57 | 30,962 |
| Ear, Nose, Mouth & Throat | 3133 | 644 | 622 | 862 | 899 | 127 | 703 | 992 | 1046 | 1310 | 2971 | 3719 | 2640 | 2038 | 456 | 1485 | 1969 | 1728 | 1840 | 1342 | 30,525 |
| Blood, Blood Form Organs, Immunology | 5557 | 2266 | 291 | 687 | 116 | 113 | 376 | 324 | 402 | 1967 | 805 | 1530 | 2936 | 702 | 212 | 531 | 1250 | 508 | 513 | 1238 | 22,327 |
| Skin, Subcutaneous Tissue & Breast | 3369 | 1765 | 451 | 390 | 50 | 123 | 518 | 459 | 378 | 1199 | 1391 | 1745 | 2082 | 295 | 228 | 982 | 1750 | 834 | 1585 | 875 | 20,469 |
| Eye Diseases & Disorders | 1244 | 52 | 676 | 17 | 5 | 2 | 314 | 156 | 718 | 1938 | 653 | 823 | 461 | 628 | 534 | 1448 | 1784 | 1746 | 4486 | 616 | 18,299 |
| Injury, Poison & Toxic Effect Drugs | 1195 | 788 | 540 | 295 | 101 | 341 | 779 | 599 | 693 | 346 | 997 | 2546 | 1102 | 566 | 704 | 1404 | 595 | 1271 | 1344 | 874 | 17,078 |
| Infectious & Parasitic Diseases | 2008 | 967 | 191 | 306 | 123 | 265 | 204 | 546 | 275 | 1125 | 776 | 1094 | 1355 | 350 | 363 | 428 | 1565 | 395 | 475 | 605 | 13,417 |
| Female Reproductive System | 1179 | 537 | 126 | 92 | 78 | 137 | 205 | 184 | 150 | 449 | 558 | 745 | 1536 | 666 | 218 | 356 | 1181 | 273 | 595 | 407 | 9671 |
| Male Reproductive System | 1551 | 435 | 174 | 138 | 83 | 49 | 245 | 202 | 195 | 204 | 443 | 796 | 574 | 575 | 131 | 413 | 493 | 412 | 483 | 233 | 7828 |
| Factors Influencing Health Status | 410 | 236 | 43 | 429 | 34 | 176 | 60 | 158 | 69 | 634 | 129 | 452 | 1355 | 81 | 39 | 499 | 271 | 94 | 118 | 131 | 5417 |
| Burns | 676 | 267 | 78 | 24 | - | 283 | 58 | 37 | 18 | 10 | 90 | 1158 | 116 | 33 | 434 | 234 | 184 | 169 | 186 | 136 | 4189 |
| Mental Diseases & Disorders | 260 | 68 | 63 | 34 | 15 | 10 | 19 | 70 | 21 | 73 | 226 | 102 | 147 | 69 | 6 | 48 | 57 | 68 | 68 | 49 | 1471 |
| Alcohol/Drug Use Disorders | 26 | 4 | 5 | 3 | 1 | 3 | 2 | 2 | 5 | 7 | 59 | 14 | 8 | 2 | - | 9 | - | - | 11 | 6 | 166 |
| Total | 97,736 | 55,053 | 19,737 | 20,639 | 16,064 | 10,752 | 27,346 | 31,662 | 21,467 | 53,141 | 70,260 | 89,535 | 116,141 | 42,111 | 20,485 | 49,456 | 87,206 | 38,666 | 63,866 | 46,829 | 978,151 |
References
- Dunn, A.; Whitmire, B.; Batch, A.; Fernando, L.; Rittmueller, L. High spending growth rates for key diseases in 2000–2014 were driven by technology and demographic factors. Health Aff. 2018, 37, 915–924. [Google Scholar] [CrossRef]
- Alasiri, A.A.; Mohammed, V. Healthcare transformation in Saudi Arabia: An overview since the launch of vision 2030. Health Serv. Insights 2022, 15, 11786329221121214. [Google Scholar] [CrossRef]
- Rahman, R. The privatization of health care system in Saudi Arabia. Health Serv. Insights 2020, 13, 1178632920934497. [Google Scholar] [CrossRef]
- Jacobs, R. Alternative methods to examine hospital efficiency: Data envelopment analysis and stochastic frontier analysis. Health Care Manag. Sci. 2001, 4, 103–115. [Google Scholar] [CrossRef]
- Chowdhury, P.; Paul, S.K.; Kaisar, S.; Moktadir, M.A. COVID-19 pandemic related supply chain studies: A systematic review. Transp. Res. Part E Logist. Transp. Rev. 2021, 148, 102271. [Google Scholar] [CrossRef]
- Mbau, R.; Musiega, A.; Nyawira, L.; Tsofa, B.; Mulwa, A.; Molyneux, S.; Maina, I.; Jemutai, J.; Normand, C.; Hanson, K. Analysing the efficiency of health systems: A systematic review of the literature. Appl. Health Econ. Health Policy 2023, 21, 205–224. [Google Scholar] [CrossRef]
- Azreena, E.; Juni, M.H.; Rosliza, A. A systematic review of hospital inputs and outputs in measuring technical efficiency using data envelopment analysis. Int. J. Public Health Clin. Sci. 2018, 5, 17–35. [Google Scholar]
- Dexter, F.; Wachtel, R.; Epstein, R.; McIntosh, C.; O’Neill, L. Allocative efficiency vs technical efficiency in operating room management. Anaesthesia 2007, 62, 1290–1291. [Google Scholar] [CrossRef]
- Hollingsworth, B. The measurement of efficiency and productivity of health care delivery. Health Econ. 2008, 17, 1107–1128. [Google Scholar] [CrossRef] [PubMed]
- Gray, M. Value based healthcare. BMJ 2017, 356, j437. [Google Scholar] [CrossRef] [PubMed]
- Alatawi, A.; Ahmed, S.; Niessen, L.; Khan, J. Systematic review and meta-analysis of public hospital efficiency studies in Gulf region and selected countries in similar settings. Cost Eff. Resour. Alloc. 2019, 17, 17. [Google Scholar] [CrossRef] [PubMed]
- Asbu, E.Z.; Masri, M.D.; Al Naboulsi, M. Determinants of Hospital Efficiency: Insights from the Literature. 2020. Available online: https://www.researchsquare.com/article/rs-6020/v2 (accessed on 1 July 2023).
- Giancotti, M.; Guglielmo, A.; Mauro, M. Efficiency and optimal size of hospitals: Results of a systematic search. PLoS ONE 2017, 12, e0174533. [Google Scholar] [CrossRef] [PubMed]
- Alatawi, A.D.; Niessen, L.W.; Khan, J.A. Efficiency evaluation of public hospitals in Saudi Arabia: An application of data envelopment analysis. BMJ Open 2020, 10, e031924. [Google Scholar] [CrossRef]
- Chowdhury, S.; Mok, D.; Leenen, L. Transformation of health care and the new model of care in Saudi Arabia: Kingdom’s Vision 2030. J. Med. Life 2021, 14, 347. [Google Scholar] [PubMed]
- Mardani, A.; Zavadskas, E.K.; Streimikiene, D.; Jusoh, A.; Khoshnoudi, M. A comprehensive review of data envelopment analysis (DEA) approach in energy efficiency. Renew. Sustain. Energy Rev. 2017, 70, 1298–1322. [Google Scholar] [CrossRef]
- Tricco, A.C.; Langlois, E.; Straus, S.E.; World Health Organization. Rapid Reviews to Strengthen Health Policy and Systems: A Practical Guide; World Health Organization: Geneva, Switzerland, 2017.
- Villalobos-Cid, M.; Chacón, M.; Zitko, P.; Inostroza-Ponta, M. A new strategy to evaluate technical efficiency in hospitals using homogeneous groups of casemix: How to evaluate when there is not drgs? J. Med. Syst. 2016, 40, 103. [Google Scholar] [CrossRef]
- Vitikainen, K.; Street, A.; Linna, M. Estimation of hospital efficiency—Do different definitions and casemix measures for hospital output affect the results? Health Policy 2009, 89, 149–159. [Google Scholar] [CrossRef]
- Street, A.; Vitikainen, K.; Bjorvatn, A.; Hvenegaard, A. Introducing Activity-Based Financing: A Review of Experience in Australia, Denmark, Norway and Sweden; Centre for Health Economics, University of York: York, UK, 2007. [Google Scholar]
- Costa, A.P.; Poss, J.W.; McKillop, I. Contemplating case mix: A primer on case mix classification and management. In Healthcare Management Forum; SAGE Publications: Los Angeles, CA, USA, 2015; Volume 28, pp. 12–15. [Google Scholar]
- McDermott, C.; Stock, G.N. Hospital operations and length of stay performance. Int. J. Oper. Prod. Manag. 2007, 27, 1020–1042. [Google Scholar] [CrossRef]
- Younis, M.Z. Length of hospital stay of Medicare patients in the post-prospective-payment-system era. J. Health Care Financ. 2004, 31, 23–30. [Google Scholar]
- Imani, A.; Alibabayee, R.; Golestani, M.; Dalal, K. Key indicators affecting hospital efficiency: A systematic review. Front. Public Health 2022, 10, 830102. [Google Scholar] [CrossRef]
- Ryan, R.; Davoren, J.; Grant, H.; Delbridge, L. A 23-hour care centre model for the management of surgical patients. ANZ J. Surg. 2004, 74, 754–759. [Google Scholar] [CrossRef] [PubMed]
- Vijay, V.; Kazzaz, S.; Refson, J. The same day admissions unit for elective surgery: A case study. Int. J. Health Care Qual. Assur. 2008, 21, 374–379. [Google Scholar] [CrossRef] [PubMed]
- Brown, R.; Grehan, P.; Brennan, M.; Carter, D.; Brady, A.; Moore, E.; Teeling, S.P.; Ward, M.; Eaton, D. Using lean six sigma to improve rates of day of surgery admission in a national thoracic surgery department. Int. J. Qual. Health Care 2019, 31, 14–21. [Google Scholar] [CrossRef] [PubMed]
- Brazil, D.; Moss, C.; Blinko, K. Acute hospital preoperative assessment redesign: Streamlining the patient pathway and reducing on-the-day surgery cancellations. BMJ Open Qual. 2021, 10, e001338. [Google Scholar] [CrossRef]
- Duckett, S.J. Casemix development and implementation in Australia. In The Globalization of Managerial Innovation in Health Care; Cambridge University Press: Cambridge, UK, 2008; pp. 231–253. [Google Scholar]
- Hollingsworth, B.; Peacock, S.J. Efficiency Measurement in Health and Health Care; Routledge: London, UK, 2008. [Google Scholar]
- Li, H.; Dong, S.; Liu, T. Relative efficiency and productivity: A preliminary exploration of public hospitals in Beijing, China. BMC Health Serv. Res. 2014, 14, 158. [Google Scholar] [CrossRef] [PubMed]
- Colombi, R.; Martini, G.; Vittadini, G. Determinants of transient and persistent hospital efficiency: The case of Italy. Health Econ. 2017, 26, 5–22. [Google Scholar] [CrossRef]
- Carey, K.; Burgess, J.F., Jr.; Young, G.J. Specialty and full-service hospitals: A comparative cost analysis. Health Serv. Res. 2008, 43, 1869–1887. [Google Scholar] [CrossRef]
- Linna, M.; Häkkinen, U.; Magnussen, J. Comparing hospital cost efficiency between Norway and Finland. Health Policy 2006, 77, 268–278. [Google Scholar] [CrossRef]
- Havranek, M.M.; Ondrej, J.; Widmer, P.K.; Bollmann, S.; Spika, S.; Boes, S. Using exogenous organizational and regional hospital attributes to explain differences in case-mix adjusted hospital costs. Health Econ. 2023, 32, 1733–1748. [Google Scholar] [CrossRef] [PubMed]
- Hvenegaard, A.; Street, A.; Sørensen, T.H.; Gyrd-Hansen, D. Comparing hospital costs: What is gained by accounting for more than a case-mix index? Soc. Sci. Med. 2009, 69, 640–647. [Google Scholar] [CrossRef]
- Carter, G.M.; Newhouse, J.P.; Relles, D.A. How much change in the case mix index is DRG creep? J. Health Econ. 1990, 9, 411–428. [Google Scholar] [CrossRef] [PubMed]
- Aljunid, S.; Moshiri, H.; Amin, R. The impact of introducing case mix on the efficiency of teaching hospitals in Malaysia. In BMC Health Services Research; BioMed Central: London, UK, 2010; Volume 10, pp. 1–2. [Google Scholar]
- Moshiri, H.; Aljunid, S.M.; Amin, R.M.; Ahmed, Z. Impact of implementation of case-mix system on efficiency of a teaching hospital in Malaysia. Glob. J. Health Sci. 2010, 2, 91. [Google Scholar] [CrossRef]


| Variables | N =67 | % |
|---|---|---|
| Hospital type | ||
| General Hospital * | 42 | 63% |
| Specialized Hospital * | 22 | 33% |
| Medical City * | 3 | 4% |
| Hospital size | ||
| Large (500 or more beds) | 15 | 22% |
| Upper-Medium(300–499 beds) | 20 | 30% |
| Lower-Medium (200–299 beds) | 21 | 31% |
| Small (less than 200 beds) | 11 | 16% |
| Days before Surgery | Number of Patents | Total DOSA | Cost of Bed Day (Scenario 1) | Opportunity Cost (Scenario 1) | Cost of Bed Day (Scenario 2) | Opportunity Cost (Scenario 2) |
|---|---|---|---|---|---|---|
| 2 | 478 | 956 | 2000 | 1,912,000 | 3000 | 2,868,000 |
| 3 | 199 | 597 | 2000 | 1,194,000 | 3000 | 1,791,000 |
| 4 | 104 | 416 | 2000 | 832,000 | 3000 | 1,248,000 |
| 5 | 92 | 460 | 2000 | 920,000 | 3000 | 1,380,000 |
| 6 | 63 | 378 | 2000 | 756,000 | 3000 | 1,134,000 |
| 7 | 45 | 315 | 2000 | 630,000 | 3000 | 945,000 |
| 8 | 36 | 288 | 2000 | 576,000 | 3000 | 864,000 |
| 9 | 23 | 207 | 2000 | 414,000 | 3000 | 621,000 |
| 10 | 20 | 200 | 2000 | 400,000 | 3000 | 600,000 |
| Total | 1060 | 3817 | 7,634,000 | 11,451,000 |
| Cluster | Hospital Size | Hospital Type | Average | |||||
|---|---|---|---|---|---|---|---|---|
| Large | Upper-Medium | Lower-Medium | Small | General Hospital | Medical City | Specialized Hospital | ||
| 1 | 2.05 | 1.18 | 1.19 | - | 1.19 | - | 1.6 | 1.35 |
| 2 | 1.41 | 1.29 | 1.15 | - | 1.28 | - | 1.29 | 1.28 |
| 3 | - | 1.11 | - | - | 1.06 | - | 1.16 | 1.11 |
| 4 | 1.25 | - | 1.2 | - | 1.25 | - | 1.2 | 1.23 |
| 5 | - | 1.47 | - | - | 1.47 | - | - | 1.47 |
| 6 | - | 1.02 | - | - | - | - | 1.02 | 1.02 |
| 7 | 1.32 | - | 1.34 | 0.73 | 1.33 | - | 0.73 | 1.13 |
| 8 | - | - | 1 | 1.11 | 1 | - | 1.11 | 1.04 |
| 9 | - | - | 1.15 | 0.76 | 1.15 | - | 0.76 | 1.02 |
| 10 | 1.83 | - | 0.95 | - | - | - | 1.39 | 1.39 |
| 11 | 1.17 | 1.4 | 1.3 | 0.88 | 0.99 | - | 1.42 | 1.1 |
| 12 | 1.65 | 1.12 | 1.6 | - | 1.24 | 1.65 | 2.55 | 1.53 |
| 13 | 1.15 | 1.22 | - | - | 1.3 | 0.92 | - | 1.18 |
| 14 | - | 1.4 | 1.28 | 1.08 | 1.24 | - | 1.28 | 1.26 |
| 15 | - | 1.67 | - | - | 1.67 | - | - | 1.67 |
| 16 | - | 1.14 | 1.16 | - | 1.14 | - | 1.16 | 1.14 |
| 17 | 1.48 | 1.6 | 1.29 | 1.7 | 1.53 | 1.83 | 1.31 | 1.51 |
| 18 | 1.4 | 1.91 | 1.13 | - | 1.52 | - | 1.4 | 1.48 |
| 19 | 1.22 | - | - | - | 1.22 | - | 1.23 | 1.22 |
| 20 | - | 1.07 | - | - | 1.07 | - | - | 1.07 |
| Average | 1.42 | 1.28 | 1.26 | 0.97 | 1.21 | 1.47 | 1.32 | 1.26 |
Disclaimer/Publisher’s Note: The statements, opinions and data contained in all publications are solely those of the individual author(s) and contributor(s) and not of MDPI and/or the editor(s). MDPI and/or the editor(s) disclaim responsibility for any injury to people or property resulting from any ideas, methods, instructions or products referred to in the content. |
© 2023 by the authors. Licensee MDPI, Basel, Switzerland. This article is an open access article distributed under the terms and conditions of the Creative Commons Attribution (CC BY) license (https://creativecommons.org/licenses/by/4.0/).
Share and Cite
Alshehri, A.; Balkhi, B.; Gleeson, G.; Atassi, E. Efficiency and Resource Allocation in Government Hospitals in Saudi Arabi: A Casemix Index Approach. Healthcare 2023, 11, 2513. https://doi.org/10.3390/healthcare11182513
Alshehri A, Balkhi B, Gleeson G, Atassi E. Efficiency and Resource Allocation in Government Hospitals in Saudi Arabi: A Casemix Index Approach. Healthcare. 2023; 11(18):2513. https://doi.org/10.3390/healthcare11182513
Chicago/Turabian StyleAlshehri, Abdulrahman, Bander Balkhi, Ghada Gleeson, and Ehab Atassi. 2023. "Efficiency and Resource Allocation in Government Hospitals in Saudi Arabi: A Casemix Index Approach" Healthcare 11, no. 18: 2513. https://doi.org/10.3390/healthcare11182513
APA StyleAlshehri, A., Balkhi, B., Gleeson, G., & Atassi, E. (2023). Efficiency and Resource Allocation in Government Hospitals in Saudi Arabi: A Casemix Index Approach. Healthcare, 11(18), 2513. https://doi.org/10.3390/healthcare11182513